Mcdonald
16
See discussions, stats, and author profiles for this publication at: http://www.researchgate.net/publication/8429869 Insights Into the ‘Healthy Immigrant Effect’: Health Status and Health Service Use of Immigrants to Canada ARTICLE in SOCIAL SCIENCE & MEDICINE · NOVEMBER 2004 Impact Factor: 2.89 · DOI: 10.1016/j.socscimed.2004.02.004 · Source: PubMed CITATIONS 342 READS 57 2 AUTHORS, INCLUDING: Ted Mcdonald University of New Brunswick 68 PUBLICATIONS 1,070 CITATIONS SEE PROFILE Available from: Ted Mcdonald Retrieved on: 11 October 2015
-
Upload
athanasia-sergounioti -
Category
Documents
-
view
218 -
download
0
description
Ρ
Transcript of Mcdonald

7/21/2019 Mcdonald
http://slidepdf.com/reader/full/mcdonald-56def3dfe0197 1/16
See discussions, stats, and author profiles for this publication at:http://www.researchgate.net/publication/8429869
Insights Into the ‘Healthy Immigrant
Effect’: Health Status and Health Service
Use of Immigrants to Canada
ARTICLE in SOCIAL SCIENCE & MEDICINE · NOVEMBER 2004
Impact Factor: 2.89 · DOI: 10.1016/j.socscimed.2004.02.004 · Source: PubMed
CITATIONS
342
READS
57
2 AUTHORS, INCLUDING:
Ted Mcdonald
University of New Brunswick
68 PUBLICATIONS 1,070 CITATIONS
SEE PROFILE
Available from: Ted Mcdonald
Retrieved on: 11 October 2015

7/21/2019 Mcdonald
http://slidepdf.com/reader/full/mcdonald-56def3dfe0197 2/16
Social Science & Medicine 59 (2004) 1613–1627
Insights into the ‘healthy immigrant effect’: health status and
health service use of immigrants to Canada
James Ted McDonalda,*, Steven Kennedyb
aDepartment of Economics, University of New Brunswick, PO Box 4400, Fredericton, NB E3B 5A3 CanadabAustralian Treasury and Economics Department, RSSS, Australian National University, Australia
Abstract
This paper combines multiple cross-sections of data drawn from the National Population Health Survey and
Canadian Community Health Survey to confirm the existence of the ‘healthy immigrant effect’, specifically that
immigrants are in relatively better health on arrival in Canada compared to native-born Canadians, and that immigrant
health converges with years in Canada to native-born levels. The paper finds robust evidence that the healthy immigrant
effect is present for the incidence of chronic conditions for both men and women, and results in relatively slow
convergence to native-born levels. There is only weak evidence in terms of self-assessed health status. The inclusion of
controls for region of origin and year of arrival does not account for the observed effects, although region of origin is an
important determinants of immigrant health. The paper then considers some alternative explanations for the observed
differences, and support is found for the idea that the healthy immigrant effect reflects convergence in physical health
rather than convergence in screening and detection of existing health problems.
r 2004 Elsevier Ltd. All rights reserved.
JEL classification: I1; J0
Keywords: Immigrants; Health; Cohort effects; Canada
Introduction
The health of Canada’s immigrant population is of
prime concern to scholars and policymakers for two
main reasons. First, the large number of immigrants
resident in Canada means that the health of Canada’s
immigrants is also an important determinant of generalmeasures of population health, and so is directly related
to issues of the cost and adequacy of the Canadian
healthcare system. According to data from the 2001
Census, 18% of Canada’s population was born in
another country, and over 250 000 people gained
permanent residency in 2001 alone. Second, the health
of Canada’s immigrants is one important determinant of
the costs and benefits of immigration policy, and so
relates to questions such as whether immigrants
constitute an undue burden on Canada’s taxpayer-
funded healthcare system. More broadly, immigrant
health is an important component of the general issue
about whether Canada is maximizing the returns to its
large-scale immigration program.
A key question relates to the time path of immigrant
health, i.e., what happens to an immigrant’s health as heor she spends more time in the new country. Much of the
recent literature on immigrant health has focused on
identifying the presence and magnitude of what is
known as the ‘healthy immigrant effect’—an observed
time path in which the health of immigrants just after
migration is substantially better than that of comparable
native-born people, but worsens with additional
years in the new country (denoted YSM—years since
immigration).
The current paper contributes to this literature in two
main ways. First, we present new evidence on the
healthy immigrant effect for Canada, using multiple
ARTICLE IN PRESS
*Corresponding author. Fax: +1-506-453-4514.
E-mail address: [email protected] (J.T. McDonald).
0277-9536/$- see front matterr 2004 Elsevier Ltd. All rights reserved.
doi:10.1016/j.socscimed.2004.02.004
7/21/2019 Mcdonald
http://slidepdf.com/reader/full/mcdonald-56def3dfe0197 3/16
cross-sections from large micro-level datasets that allow
for control of unobserved (cohort) effects, place of birth,
and country of origin that could otherwise obscure the
true YSM effect on immigrant health. Second, we
provide some preliminary evidence on what might be
underlying the estimated YSM effects on health, by
analyzing immigrants’ use of some basic health services.Similar patterns in the use of these health services might
indicate that barriers in the access of health services by
recent immigrants are contributing to relatively lower
reported incidence of health conditions, giving the
impression of relatively healthier immigrants.
The outline for the paper is as follows. Following a
review of recent literature in the literature section, the
subsequent section sets out an empirical framework for
analyzing health status and specifies the estimating
equations. This is followed by a section on description of
the data and the construction of the sample used in
estimation. The next section presents and discusses themain results. The paper then attempts to identify some
possible underlying reasons for the observed differences
in health patterns in the penultimate section by
considering immigrant use of health services and by
examining the incidence of specific health conditions.
The final section concludes by summarizing the main
results and outlining avenues for future research.
Review of the literature
Health researchers use a range of measures as
indicators of health status, including the existence of
diagnosed chronic health conditions, limitations in
mobility, and indicators of general health as measured
by subjective self-assessment. (See Kinnon, 1999; Hy-
man, 2001, for recent reviews.) Evidence of a healthy
immigrant effect is reported in Chen et al., (1996), who
use the 1994–95 wave of the National Population Health
Survey (NPHS), Newbold and Danforth (2003) who use
the 1998–99 wave of the NPHS, and Perez (2002) who
uses the Canadian Community Health Survey from
2000–01. The healthy immigrant effect has also been
documented in Australia (Donovan, d’ Espaignet, & van
Ommeren 1992; Biddle, Kennedy & McDonald, 2003)and the United States (Stephen, Foote, Hendershot, &
Schoenborn, 1994).
In the literature, the healthy immigrant effect is often
attributed to a number of factors. The first is immigrant
self-selection, in which healthier potential immigrants
are most likely to be physically or financially able to
migrate. Similarly, direct health screening by Canadian
authorities prior to an immigrant’s arrival in Canada
may give rise to relatively healthier immigrants.
Although the health assessment required under the
Canadian Immigration Act is comprehensive, in practice
few immigrants are denied entry to Canada for health
reasons. (See Laroche, 2000, for additional discussion.)
Another possibility may be that the incidence of health
conditions among recent immigrants is under-reported,
perhaps because immigrants under-utilize health services
that would diagnose existing medical conditions. How-
ever, even in the Canadian literature there is no
unanimity about the existence of the healthy immigranteffect. Dunn and Dyck (2000) analyze the 1994–95
NPHS and find no obvious consistent pattern between
immigrant characteristics and their health outcomes.
Also, Laroche (2000) finds that the health status of
immigrants does not differ significantly from that of the
Canadian-born population.
In those studies identifying a significant difference
between the health of new arrivals and the native born, it
is also found that recent immigrants are healthier than
immigrants who have been in Canada for more than 10
years, implying a narrowing of the health gap with the
native born as years in Canada increase—in essence, aworsening of immigrant health over time in Canada
compared to similar native-born persons. For example,
Newbold and Danforth (2003), using the 1998–99
NPHS, find that with the exception of the most recent
arrivals, immigrants to Canada experience poorer health
status compared to the native-born. Some researchers
hypothesize that convergence in health outcomes might
arise from a process of acculturation in which recent
immigrants take on characteristically Canadian ways of
living. (See Hyman, 2001, for an overview.) A similar
explanation may relate to exposure to common envir-
onmental factors (Stephen et al., 1994). An alternative
hypothesis (see Leclere, Jensen, & Biddlecom, 1994) is
that recent immigrants face barriers to the use of health
services because of language or cultural differences, and
a lack of information about and experience with their
new health care system. This leads to worsening
immigrant health status over time because of relative
under-use of preventative health screening and under-
diagnosis and treatment of health problems. Alterna-
tively, in the case of the existence of diagnosed
conditions, it may also be that improved access to and
use of health services over time leads to increased
recognition of existing but undiagnosed conditions, and
so an apparent worsening of immigrant health asmeasured this way. Related to this is the notion that
self-reported health is determined in part by cultural
perception of illness as well as the presence of illness
itself (Leclere et al., 1994).
Methodology
Determinants of health
Following Frank (1995) and Dunn and Dyck (2000),
our theoretical starting point is the ‘population health’
ARTICLE IN PRESS
J.T. McDonald, S. Kennedy / Social Science & Medicine 59 (2004) 1613–1627 1614

7/21/2019 Mcdonald
http://slidepdf.com/reader/full/mcdonald-56def3dfe0197 4/16

7/21/2019 Mcdonald
http://slidepdf.com/reader/full/mcdonald-56def3dfe0197 5/16
health after controlling for other observable character-
istics.2
In other regressions, we augment specification (1) by
allowing the FB, YSM, and YSM2 terms in Eq. (1) to
vary by broad region of origin. Birthplace is likely to be
an important determinant of immigrant health, and
could reflect unobserved differences in prenatal, neona-tal and early childhood care, childhood environmental
factors, and differences in social and cultural attitudes to
health behavior and health service use.
Similarly, age at arrival may also be important for two
reasons. First, immigrants who arrived in Canada as
children have been raised within Canada’s social system
and so would be more likely to be culturally and
behaviorally similar to native-born Canadians. Second,
Jasso, Massey, Rosenzweig, and Smith, (2003) suggest
that there may be a process of negative selection for
older immigrants since less healthy individuals might
seek to immigrate to Canada to take advantage of accessto Canada’s healthcare system. They find younger
immigrants are in significantly better health on arrival
in the United States than older immigrants. To allow for
these possibilities, we include additional interactions of
FB, YSM and YSM2 in Eq. (1) with indicator variables
for whether the individual immigrated as a child (aged
12 or younger) or as an older adult (aged 50 or older).
Measures of health status
The choice of health measures is limited to some
degree by what is available and consistently defined
across the datasets underpinning this analysis. We focus
on two specific measures of health. The first is the
incidence of chronic medical conditions as diagnosed by
a healthcare professional. To reflect the wide range of
specific conditions identified in the population health
datasets, we categorize chronic conditions into two
broad groups and examine the determinants of each
separately. The first group of conditions, which we call
Type A conditions, includes the following: asthma, back
pain, high blood pressure, allergies, migraines, ulcers,
bronchitis, and arthritis. These conditions are not
normally considered to be life threatening. The second
group of more serious conditions, which we call Type B
conditions, includes heart disease, cancer, diseases of the
thyroid, Crohn’s disease, and diabetes. (Other condi-
tions specifically related to old age—glaucoma, stroke,
cataracts, incontinence and Alzheimer’s disease—are
excluded from the analysis because of low incidence
among the subpopulation of people aged 21–65.)
For both Type A and B conditions, we define anindicator variable that takes the value one if the
individual has been diagnosed as having at least one of
the specified conditions, and zero otherwise. We
estimate the incidence of a chronic condition using
Probit estimation.
Our second indicator of physical health is a variable
that is based on the result of a subjective self-assessment
of one’s general health on a five-point scale: excellent,
very good, good, fair or poor. Measures of self-assessed
health status (SAHS) are commonly used in the
literature and have generally been found to be good
predictors of mortality, although there is a significantliterature on the extent to which perceptions of what
constitutes good or poor health vary by age, socio-
economic status, or other characteristics.3 Given the
categorical nature of reported self-assessed health status,
we estimate the incidence of less than good health (i.e.,
fair or poor health) using a Probit specification.
Data sources and descriptive statistics
We make use of pooled cross-sectional data drawn
from two large unit record datasets on health outcomes
and health services use published by Statistics Canada.
These are the 1996 wave of the National Population
Health Survey (NPHS) and the 2000–01 wave of the
Canadian Community Health Survey (CCHS). The
NPHS and CCHS are comparable in terms of survey
design and collection, and both surveys are representa-
tive of the Canadian population (although the NPHS
collects information on people of all ages while the
CCHS is limited to people aged 12 years or older).
Definitions of survey questions and response categories
are also comparable across the surveys.
Although the NPHS is available biennially from 1994to 2000 and contains a core longitudinal component, the
1996 wave is by far the largest because three provinces—
Ontario, Manitoba, and Alberta—funded significant
provincial supplemental data collection in their respec-
tive provinces. The total cross-sectional sample size of
ARTICLE IN PRESS
2With a single cross-section, YSM and year of arrival (as a
continuous variable) are perfectly correlated. With multiple
cross-sections of data, cohort and YSM effects can be
separately identified, although it is necessary to assume that
period effects between the sample years are common to both
immigrants and native-born people. See Borjas (1985) and
Lalonde and Topel (1991) for further discussion. In the current
analysis, identification is enhanced by assuming that cohort
effects are constant within each 5-year arrival period. This is a
widely made assumption in the immigration literature, and one
that is not likely to be overly limiting given the long time frame
of arrival years considered.
3See for example Ratner, Johnson, and Jeffrey (1998),
Menec, Chipperfield, and Perry (1999), Shields and Shooshtari
(2001), Crossley and Kennedy (2002), and Bailis, Segall, and
Chipperfield (2003).
J.T. McDonald, S. Kennedy / Social Science & Medicine 59 (2004) 1613–1627 1616

7/21/2019 Mcdonald
http://slidepdf.com/reader/full/mcdonald-56def3dfe0197 6/16
people aged 12 and above is 17,626 in the 1994–95
NPHS, compared with 73,402 in the 1996–97 NPHS and
131,535 in the CCHS.4
Sample means and proportions for the explanatory
variables and measures of health are reported in Table 1,
for four main subgroups of people aged 20–65: native-
born women, foreign-born women, native-born men,
and foreign-born men. Immigrant men and women are
less likely to have been diagnosed with a chronic
ARTICLE IN PRESS
Table 1
Sample means and proportions of key variables: individuals aged 20–65 (Pooled 1996 NPHS and 2000–01 CCHS data)
Women born
in Canada
Women born
elsewhere
Men born in
Canada
Men born
elsewhere
Type A condition 0.600 0.528 0.492 0.424
Type B condition 0.140 0.125 0.084 0.079Self-reported health
Excellent 0.265 0.241 0.279 0.273
Very good 0.391 0.345 0.390 0.355
Good 0.251 0.295 0.245 0.293
Fair 0.072 0.086 0.061 0.059
Poor 0.021 0.034 0.021 0.020
Age (years) 40.7 42.3 40.4 42.8
Did not finish high school 0.178 0.184 0.204 0.154
Graduated high school 0.267 0.273 0.244 0.241
Undergraduate degree 0.140 0.155 0.130 0.185
Other post-secondary 0.382 0.326 0.375 0.314
Higher degree 0.033 0.062 0.047 0.106
Speaks English 0.835 0.879 0.851 0.902
Speaks French 0.372 0.166 0.368 0.195
Speaks another language 0.085 0.692 0.085 0.739
Speaks neither English nor
French
0.003 0.081 0.003 0.058
Entered Canada 1991–01 N/a 0.243 N/a 0.243
Entered Canada 1981–90 0.250 0.233
Entered Canada 1971–80 0.222 0.229
Entered Canada 1961–70 0.182 0.171
Entered Canada 1951–60 0.107 0.121
Born in an English-speaking country 0.190 0.152
Born in Europe (not UK) 0.284 0.305
Born elsewhere 0.527 0.542
Arrived at age 10 or less 0.168 0.178
Lives in a rural area 0.196 0.067 0.214 0.068
Lives in a CMA 0.585 0.882 0.574 0.891
Lives elsewhere 0.219 0.048 0.212 0.041
Owns residence 0.718 0.660 0.734 0.675
Receives dividend income 0.150 0.130 0.167 0.143
Pooled sample size 63953 9812 57224 8942
4 In related analyses (not reported here), an expanded dataset
is used that merges 1996 NPHS and 2000-01 CCHS with the
1991 (health) wave of the General Social Survey (GSS)
published by Statistics Canada. Because of more limited
comparability between the GSS and the later surveys, we
restrict use of this expanded dataset to conducting sensitivity
( footnote continued )
checks on the main results. Results based on this larger dataset
are consistent with what is reported in the current paper.
J.T. McDonald, S. Kennedy / Social Science & Medicine 59 (2004) 1613–1627 1617

7/21/2019 Mcdonald
http://slidepdf.com/reader/full/mcdonald-56def3dfe0197 7/16
condition than native-born men and women. Interest-
ingly, immigrants are also less likely to report being in
very good or excellent health, and immigrant women are
more likely to report being in fair or poor health than
native-born women. Immigrants overall are generally
relatively well educated, are on average 2 years older
than the native-born, and are very likely to be able tospeak English. A majority of immigrants to Canada
originate from non-English speaking countries outside
of Europe (particularly Asia), which also leads to a
substantial percentage of immigrants who are able also
to speak a language other than French or English.
Immigrants are also very likely to reside in major
metropolitan areas, and are less likely to receive
dividends or to own their own residential dwelling.
Determinants of immigrant health
Cohort and YSM effects
The first issue of interest is whether there are
significant differences in the health of immigrants
compared to the native-born after controlling for
differences in age and other characteristics that are
important determinants of health. Coefficient estimates
for the immigrant variables obtained from estimating
specification (1) are reported in Table 2a for men and
Table 2b for women. (Other coefficient estimates are
reported in appendix Table 4.) For each measure of
health, we report the results from two estimations—the
first includes a quadratic in YSM to capture health
differences between immigrants and the native-born,
and the second includes additional controls for cohort
arrival period effects.
For immigrant men, the incidence of both sets of
chronic conditions is significantly different for immi-
grants compared to the native-born, after controlling for
the effects of other observable characteristics. The
pattern in the coefficients suggests evidence of the
healthy immigrant effect—that is, immigrants are less
likely to have a chronic condition on arrival in Canada
(when YSM is zero) but incidence increases with YSM.The pattern is similar after the inclusion of controls for
arrival period effects, although there is some evidence of
cohort effects for immigrant men arriving prior to 1970
in that they experience relatively fewer chronic condi-
tions. A statistical test of the significance of the cohort
terms indicates that period of arrival is a statistically
significant determinant of immigrant health. In terms of
self-assessed health, patterns are less precise, although
again there is evidence of significant cohort effects for
earlier arrivals. For immigrant women, there is very
strong evidence of a healthy immigrant effect in terms of
each health measure. In contrast to the results for men,
however, there is no suggestion that the time path of
health varies significantly by period of arrival.
Since the coefficient estimates from a Probit estima-
tion do not have an intuitive interpretation, we use the
estimates to predict the health profile of a typical
immigrant by arrival cohort and by years in Canada. In
order to focus attention on differences by immigrantstatus only, we hold all other characteristics including
age constant for a ‘base case’ individual whose
characteristics, for computational simplicity, are set at
age 45 plus the default characteristics in Eq. (1). These
default characteristics (where all non-immigrant indica-
tor variables take a value zero) are: Ontario resident
outside of a major city, high school education, English
speaker, no dividend income and living in a rented
house. Predicted differences between immigrant and
native-born health levels are not sensitive to the use of
alternative characteristics. In each figure, we include
predicted YSM profiles for specifications with andwithout cohort effects in order to illustrate the extent
of any misspecification arising from the omission of
cohort effects.
In Fig. 1a, it can be seen that a ‘baseline’ native-born
person aged 45 years has a predicted incidence of Type
A condition of around 55%. On arrival in Canada,
comparable immigrant men and women have markedly
lower incidence of these conditions (less than 30%), and
predicted incidence increases steadily with additional
years in Canada but at a decreasing rate. After about
20–25 years in Canada, a 45-year-old immigrant of
either gender has an incidence of Type A conditions that
is comparable to the native-born. After this point,
relative immigrant health does not worsen with addi-
tional years in Canada, so that the general pattern of the
YSM health path is one of convergence to native-born
levels. Consistent with the statistical tests for cohort
effects, the predicted cohort-specific YSM paths are very
close to the YSM path without cohort effects. The only
exception is that the YSM-only specification over-
predicts the incidence of Type A conditions for
immigrant men who arrived between 1956 and 1965. It
is interesting to note that while native-born women are
predicted to be around 10% more likely than native-
born men to have a Type A chronic condition, newlyarrived immigrant men and women have similar
predicted incidence of Type A conditions but converge
to different gender-specific native-born levels.
Fig. 1b illustrates predicted incidence of Type B
conditions. As in Fig. 1a, the incidence of Type B
conditions is higher for native-born women than native-
born men, but recent immigrant men and women exhibit
comparable incidence of these conditions. Again, as
YSM increases, immigrant incidence of chronic condi-
tions converges to the gender-specific native-born level.
The incidence of Type B conditions for immigrant men
shows only marginal change with additional YSM
ARTICLE IN PRESS
J.T. McDonald, S. Kennedy / Social Science & Medicine 59 (2004) 1613–1627 1618

7/21/2019 Mcdonald
http://slidepdf.com/reader/full/mcdonald-56def3dfe0197 8/16
ARTICLE IN PRESS
Table 2
Type A condition Type B condition Fair or poor SAH
(a) Selected results for Men—basic specification with controls for year of arrival and years since migration
Foreign-born (FB) 0.6018 0.3241 0.2151 0.5084 0.1151 0.3975
(0.072) (0.335) (0.104) (0.472) (0.107) (0.411)
Years since migration 0.0298 0.0143 0.0118 0.0179 0.0060 0.0094
(0.006) (0.020) (0.009) (0.028) (0.009) (0.024)
YSM-squared 0.0004 0.0001 0.0002 0.0001 0.0001 0.0007
(0.000) (0.000) (0.000) (0.000) (0.000) (0.000)
Arrived 1996–01 0.2382 0.1636 0.2678
(0.300) (0.423) (0.372)
Arrived 1991–95 0.2035 0.3547 0.3503
(0.241) (0.348) (0.286)
Arrived 1986–90 0.1627 0.1309 0.3227
(0.183) (0.248) (0.211)
Arrived 1981–85 0.1378 0.1666 0.5040
(0.144) (0.206) (0.197)
Arrived 1976–80 0.0998 0.0802 0.2030
(0.111) (0.142) (0.139)
Arrived 1966–70 0.0005 0.2830 0.0074
(0.105) (0.139) (0.114)
Arrived 1961–65 0.3759 0.5153 0.2961
(0.165) (0.178) (0.168)
Arrived 1956–60 0.2605 0.6674 0.6088
(0.219) (0.246) (0.231)
Arrived 1951–55 0.1051 0.5847 0.8355
(0.296) (0.350) (0.314)
Test of cohort effects ( p-value) 0.0824 0.0429 0.0780
Test of all immigrant controls ( p-value) 0.0000 0.0000 0.0401 0.0080 0.3571 0.0967
Pseudo-R2 0.0260 0.0254 0.1150 0.1162 0.1001 0.1013
Sample size 66166 66166 66166 66166 66166 66166
(b) Selected results for Women—basic specification with controls for year of arrival and years since migration
Foreign-born (FB) 0.7121 0.5714 0.4634 0.8674 0.1954 0.0756
(0.065) (0.301) (0.092) (0.378) (0.099) (0.458)
Years since migration 0.0410 0.0367 0.0312 0.0560 0.0215 0.0259
(0.006) (0.018) (0.007) (0.023) (0.009) (0.026)YSM-squared 0.0006 0.0006 0.0005 0.0009 0.0004 0.0007
(0.000) (0.000) (0.000) (0.000) (0.000) (0.000)
Arrived 1996–01 0.1311 0.3507 0.0912
(0.273) (0.349) (0.420)
Arrived 1991–95 0.1860 0.2838 0.1674
(0.222) (0.271) (0.327)
Arrived 1986–90 0.0411 0.1799 0.1391
(0.173) (0.200) (0.264)
Arrived 1981–85 0.0902 0.0511 0.1713
(0.133) (0.149) (0.202)
Arrived 1976–80 0.1024 0.1848 0.0975
(0.103) (0.116) (0.154)
Arrived 1966–70 0.0343 0.0269 0.0618
(0.105) (0.123) (0.149)
Arrived 1961–65 0.1182 0.0256 0.0939(0.154) (0.200) (0.179)
Arrived 1956–60 0.2481 0.0002 0.2386
(0.212) (0.251) (0.262)
Arrived 1951–55 0.1486 0.1653 0.5865
(0.275) (0.323) (0.364)
Test of cohort effects ( p-value) 0.2740 0.7195 0.5445
Test of all immigrant controls ( p-value) 0.0000 0.0000 0.0000 0.0013 0.0274 0.2158
Pseudo-R2 0.0330 0.0336 0.0631 0.0634 0.0946 0.0953
Sample size 73765 73765 73765 73765 73765 73765
Note 1: Type A conditions include allergies, asthma, backpain, high blood pressure, migraines, arthritis, ulcers, and bronchitis. Type B
conditions include heart disease, cancer, Crohn’s disease, diseases of the thyroid, and diabetes.
Note 2: Denotes that the associated coefficient is individually significant at the 10% level. Denotes that the associated coefficient is
individually significant at the 5% level. Robust standard errors are in parentheses.
J.T. McDonald, S. Kennedy / Social Science & Medicine 59 (2004) 1613–1627 1619

7/21/2019 Mcdonald
http://slidepdf.com/reader/full/mcdonald-56def3dfe0197 9/16
because the incidence of these conditions for new
immigrants is only marginally below the native-born
level. It is also notable that cohort effects again appear
to be present for men arriving in the 1950s and 1960s. 5
For self-assessed health, the relative incidence of ‘fair’
or ‘poor’ health for immigrant men and women is
generally comparable to what is found for Type B
conditions and so these figures are not reported. Recent
immigrant men have marginally lower incidence of fair
or poor health, and this changes only slightly with YSM.
As well, immigrant men arriving prior to 1966 have
better self-reported health than comparable native-born
men. For immigrant women, the incidence of fair orpoor self-assessed health is initially lower than for
native-born women and increases with YSM before
levelling off at a level that is marginally higher than for
native-born women. Estimating the determinants of all
five states of self-assessed health status jointly using an
ordered Probit specification yields few new insights.
Region of birth and age at arrival
In this section, we report selected results from
estimation of an expanded version of Eq. (1) that
includes additional immigrant controls. Preliminary
analysis suggested that the key distinction in health
outcomes by region of origin is between immigrants
arriving from countries that are predominantly English-speaking and culturally similar to Canada (UK, Ireland,
USA, Australia and New Zealand—termed ESB), and
immigrants arriving from other areas (mainly continen-
tal Europe and Asia—termed NESB).
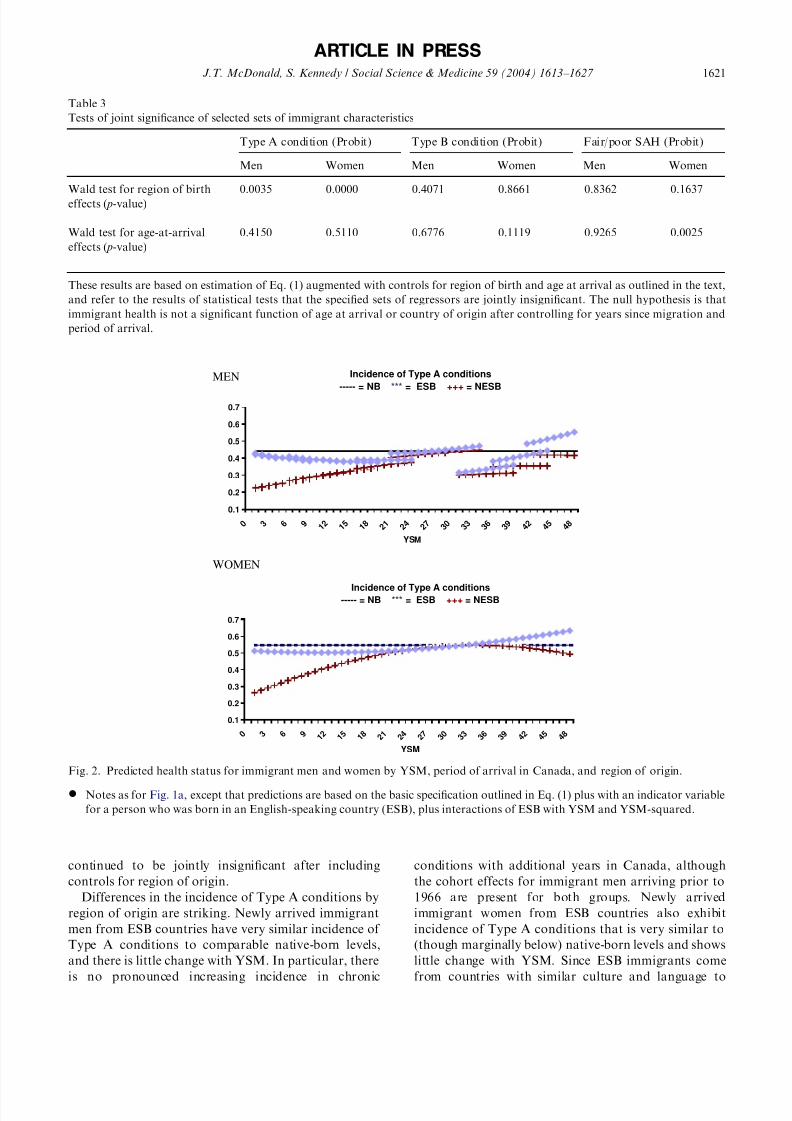
As indicated in Table 3, significant differences by
region of origin are found for Type A conditions but not
for the other measures of health. (Specific coefficient
estimates are available on request.) The estimated results
are used to generate predicted YSM-health profiles for
immigrants from ESB and NESB regions and these are
illustrated in Fig. 2. For women, we predict health
profiles without the inclusion of cohort effects, as these
ARTICLE IN PRESS
MEN
Incidence of Type A conditions
0.1
0.2
0.3
0.4
0.5
0.6
0.7
0 3 6 9 1 2 1 5 1 8 2 1 2 4 2 7 3 0 3 3 3 6 3 9 4 2 4 5
YSM
NB aged 45FB(no coh)arr 96-01arr 91-95arr 86-90arr 81-85arr 76-80arr 71-75arr 66-70arr 61-65arr 56-60
arr 51-55
WOMEN
Incidence of Type A conditions
0.1
0.2
0.3
0.4
0.5
0.6
0.7
0 3 6 9 1
2 1
5 1
8 2 1
2 4
2 7
3 0
3 3
3 6
3 9
4 2
4 5
YSM
Incidence of Type B conditions
0
0.05
0.1
0.15
0.2
0.25
0 3 6 9 1 2 1 5 1 8 2 1 2 4 2 7 3 0 3 3 3 6 3 9 4 2 4 5
YSM
Incidence of Type B conditions
0
0.05
0.1
0.15
0.2
0.25
0 3 6 9
1
2
1
5
1
8
2
1
2
4
2
7
3
0
3
3
3
6
3
9
4
2
4
5
4
8
YSM
MEN
WOMENNB aged 45FB(no coh)arr 96-01arr 91-95arr 86-90arr 81-85arr 76-80
arr 71-75arr 66-70arr 61-65arr 56-60arr 51-55
NB aged 45FB(no coh)arr 96-01arr 91-95arr 86-90
arr 81-85arr 76-80arr 71-75
arr 66-70arr 61-65
arr 56-60
arr 51-55
NB aged 45FB(no coh)arr 96-01arr 91-95arr 86-90arr 81-85arr 76-80arr 71-75arr 66-70arr 61-65
arr 56-60arr 51-55
(a) (b)
Fig. 1. (a) Predicted health status for immigrant men and women by YSM and period of arrival in Canada, graphed against a
comparable native-born man and woman.
* Predictions are based on the basic specification outlined in Eq. (1) and presented in Tables 2 and 4.* Predictions are for a ‘baseline’ individual who is 45-years-old, lives in Ontario outside of a CMA, speaks English, has a high-school
education, does not receive dividend income, and lives in a rented house.
(b) Predicted health status for immigrant men and women by YSM and period of arrival in Canada, graphed against a comparable
native-born man and woman.
* Notes as for Fig. 1a.
5One caveat concerns the reliability of the self-reported
incidence of chronic conditions, particularly for individuals out
of the labour force, as discussed in Baker, Stabile and Deri
(2001). A test of whether the results are sensitive to reporting
errors is to re-estimate the main specifications using only the
subsample of individuals who are currently working. For both
men and women, results are qualitatively similar to what is
reported.
J.T. McDonald, S. Kennedy / Social Science & Medicine 59 (2004) 1613–1627 1620
7/21/2019 Mcdonald
http://slidepdf.com/reader/full/mcdonald-56def3dfe0197 10/16
continued to be jointly insignificant after including
controls for region of origin.
Differences in the incidence of Type A conditions by
region of origin are striking. Newly arrived immigrant
men from ESB countries have very similar incidence of
Type A conditions to comparable native-born levels,
and there is little change with YSM. In particular, there
is no pronounced increasing incidence in chronic
conditions with additional years in Canada, although
the cohort effects for immigrant men arriving prior to
1966 are present for both groups. Newly arrived
immigrant women from ESB countries also exhibit
incidence of Type A conditions that is very similar to
(though marginally below) native-born levels and shows
little change with YSM. Since ESB immigrants come
from countries with similar culture and language to
ARTICLE IN PRESS
Table 3
Tests of joint significance of selected sets of immigrant characteristics
Type A condition (Probit) Type B condition (Probit) Fair/poor SAH (Probit)
Men Women Men Women Men Women
Wald test for region of birth
effects ( p-value)
0.0035 0.0000 0.4071 0.8661 0.8362 0.1637
Wald test for age-at-arrival
effects ( p-value)
0.4150 0.5110 0.6776 0.1119 0.9265 0.0025
These results are based on estimation of Eq. (1) augmented with controls for region of birth and age at arrival as outlined in the text,
and refer to the results of statistical tests that the specified sets of regressors are jointly insignificant. The null hypothesis is that
immigrant health is not a significant function of age at arrival or country of origin after controlling for years since migration and
period of arrival.
MEN Incidence of Type A conditions
----- = NB *** = ESB +++ = NESB
0.1
0.2
0.3
0.4
0.5
0.6
0.7
0 3 6 9 1 2 1 5 1 8 2 1 2 4 2 7 3 0 3 3 3 6 3 9 4 2 4 5 4 8
YSM
WOMEN
Incidence of Type A conditions----- = NB *** = ESB +++ = NESB
0.1
0.2
0.3
0.4
0.5
0.6
0.7
0 3 6 9 1 2 1 5 1 8 2 1 2 4 2 7 3 0 3 3 3 6 3 9 4 2 4 5 4 8
YSM
Fig. 2. Predicted health status for immigrant men and women by YSM, period of arrival in Canada, and region of origin.
* Notes as for Fig. 1a, except that predictions are based on the basic specification outlined in Eq. (1) plus with an indicator variable
for a person who was born in an English-speaking country (ESB), plus interactions of ESB with YSM and YSM-squared.
J.T. McDonald, S. Kennedy / Social Science & Medicine 59 (2004) 1613–1627 1621

7/21/2019 Mcdonald
http://slidepdf.com/reader/full/mcdonald-56def3dfe0197 11/16
Canada, they would be least likely to experience barriers
to accessing healthcare after migration. At the same
time, ESB immigrants are most similar to native-born
Canadians in terms of health behaviours and come from
countries with comparable health systems, demography,
and environment.
Given the age restriction of the sample, earlierimmigrant arrivals are more likely to have arrived as
children compared to more recent arrivals. Thus, cohort
effects might be reflecting differences across immigrants
in age at arrival. Further, if arrival age is an important
determinant of YSM effects then the cohort terms may
be insufficiently flexible to capture these dynamics.
However, including additional controls for age at arrival
changes the reported results very little. Although Table 3
indicates that age at arrival significantly affects the
incidence of fair/poor health for immigrant women,
simulations indicate only minor differences in predicted
health status between adult and child arrivals and sothese results are not reported.
Extensions
Access to basic health services
One possible reason for the apparent decline in
immigrant health in terms of chronic conditions is that
for recent immigrants, chronic conditions may be more
likely to go undiagnosed. This may be due to social,
cultural or language differences that mean recent
immigrants—particularly those from NESB regions—
are less likely to interact with Canada’s health
system the same way that native-born Canadians do.
However, with increasing years in Canada, these
differences narrow as health services are utilized
more widely and existing chronic conditions are more
likely to be diagnosed. It should be noted however that
recent Canadian studies of immigrants’ use of health
services by Chen et.al. (1996), Globerman (1998), and
Laroche (2000) find that immigrants and native-born
people exhibit similar rates of utilization of health
services.
To investigate this possibility, we examine the relativeincidence of three measures of the use of basic health
services: does the respondent have a family doctor, did
the respondent have a blood pressure test in the last 12
months, and has the respondent consulted with a doctor
in the last 12 months. These measures should reflect
general barriers to access of basic health services that
might arise from language or social differences, or
unfamiliarity with the Canadian health system. Also,
given their broad importance to maintenance of good
health, they should be less correlated with the incidence
of health problems than other measures that reflect more
specific use of health services.
For each measure, we estimate Probit models and use
the results to generate predicted profiles of service use
for an individual with the same ‘base case’ set of
characteristics as before. In Fig. 3, we present predicted
incidence of having a family doctor and consulting with
a doctor in the last year, for immigrant and native-born
men. (Results for women are similar.) While immigrantmen have lower incidence of these measures on arrival in
Canada, they exhibit relatively rapid convergence to
native-born levels, closing the gap after around 6–8
years in Canada. Figures for blood pressure testing are
reported in Fig. 4. The predicted incidence of a blood
pressure test for a native born ‘base case’ individual is
around 70% for women and 57% for men. Recently
arrived immigrant men and women are both around 55–
60% likely to have had a recent blood pressure test, and
immigrant women are predicted to close the gap to the
native-born level within 6–9 years in Canada. However,
for immigrant men, there is no significant difference inthe incidence of blood pressure testing between them
and the native-born ( p-value that all immigrant-specific
variables are zero is 0.4071). That is, recent immigrant
men have comparable incidence of blood pressure
testing, and there is no change in this incidence with
YSM.
These results indicate that immigrants’ use of basic
components of healthcare approaches native-born levels
substantially faster than health outcomes converge to
native-born levels. Thus, it does not seem that the
declining health of immigrants with YSM is due to
persistent barriers in access to health services, although
it should be noted that there could still be differences in
the diagnosis and treatment of possible health condi-
tions because of cultural or language differences between
patient and health care provider.
Incidence of specific chronic conditions
In this section, we discuss results from estimations
where the dependent variable is the incidence of a
specific chronic condition. Table 5 in the appendix
reports results of significance tests of the immigrant
variables, and indicates that significant differences are
present for most specific chronic conditions. Predictedhealth profiles (not reported) indicate that the predicted
incidence of almost all chronic conditions is lower for
recent immigrant men and women than comparable
native-born people. The only exceptions are diabetes
(where incidence is higher for immigrants arriving
between 1970 and 1985), migraines (where incidence
is marginally higher for immigrant men), and high
blood pressure (where incidence for immigrant women
is comparable to native-born levels). Further, for
recent female immigrants, the relative incidence of
most chronic conditions increases with YSM. For
recent male immigrants, this is true for a smaller
ARTICLE IN PRESS
J.T. McDonald, S. Kennedy / Social Science & Medicine 59 (2004) 1613–1627 1622

7/21/2019 Mcdonald
http://slidepdf.com/reader/full/mcdonald-56def3dfe0197 12/16
number of chronic conditions. However, for no chronic
condition does relative incidence exhibit a significant
decline.
Two results warrant additional discussion. First, it is
notable that even though there is little change with YSM
in the incidence of blood pressure testing for immigrant
men, there is evidence that the incidence of high blood
pressure increases with years in Canada. Similarly, there
is marked increase with YSM in the incidence of a recent
immigrant woman having a blood pressure test but no
concomitant increase in the incidence of high bloodpressure. The inconsistency between testing and inci-
dence is some evidence against the notion that reduced
barriers to health service use with YSM underpin
changes in health. For example, if high blood pressure
was more likely to go undiagnosed in recent immigrant
arrivals, then one might expect the incidence of high
blood pressure and the incidence of blood pressure tests
to display a similar pattern. Second, when controls for
broad region of birth are also included, the incidence of
asthma and allergies among recent immigrant women
from ESB countries is comparable to similar native-born
women and indicates little change with YSM, while the
incidence of other chronic conditions displays upward
convergence with YSM to native-born levels. It is
interesting to note that countries with some of the
world’s highest rates of asthma are these ESB countries:
UK and Ireland, New Zealand, and Australia (Jenkins,
2002). This seems to suggest that environmental factors
might explain at least some of the convergence in the
incidence of chronic conditions.
Discussion
This analysis finds a number of robust results that
give some insight into the determinants of immigrant
health. First, there is compelling evidence of a healthy
immigrant effect for recent immigrant arrivals, with
both immigrant men and women significantly less likely
to have been diagnosed with a chronic condition than
otherwise comparable native-born Canadians. Immi-
grants also continue to be relatively less likely to have a
chronic condition, even after many years in Canada.
However, there is also evidence that the gap in health
status between recent immigrants and native-born
ARTICLE IN PRESS
MEN
has a family doctor
0.6
0.65
0.7
0.75
0.8
0.85
0.9
0.95
1
0 3 6 9 1 2 1 5 1 8 2 1 2 4 2 7 3 0 3 3 3 6 3 9 4 2 4 5 4 8
YSM
NB aged 45
96-00
91-95
86-90
81-85
76-80
71-75
66-7061-65
56-60
51-55
MEN
contact with a doctor in the last 12 months
0.4
0.5
0.6
0.7
0.8
0 3 6 9 1 2 1 5 1 8 2 1 2 4 2 7 3 0 3 3 3 6 3 9 4 2 4 5 4 8
YSM
NB aged 45
96-00
91-95
86-90
81-85
76-80
71-75
66-70
61-65
56-60
51-55
Fig. 3. Predicted incidence of basic health service use for immigrant men by YSM and period of arrival in Canada, graphed against a
comparable native-born man.
* Notes as for Fig. 1a.
J.T. McDonald, S. Kennedy / Social Science & Medicine 59 (2004) 1613–1627 1623

7/21/2019 Mcdonald
http://slidepdf.com/reader/full/mcdonald-56def3dfe0197 13/16
Canadians narrows significantly (albeit slowly) with
years in Canada. In the case of type A conditions, the
incidence of chronic conditions approach native-born
levels after approximately 20 years in Canada. More-
over, the overall pattern in health outcomes and health
service use is one of convergence to native-born levels.
For those measures where new immigrants have
comparable values on arrival, there is typically little
change with additional years in Canada.
There is also significant evidence of cohort effects forsome specifications, i.e., year of arrival is an important
determinant of health status, although the presence of
these cohort effects is insufficient to explain the
convergence in health with years since immigration. It
was found that immigrant men who arrived in the 1950s
and early 1960s are in better health than either more
recent immigrants (for similar YSM) or the native-born,
but the same is not true for immigrant women. The
result is also robust to the inclusion of controls for age-
at-arrival of the immigrants. In fact, Biddle et al., (2003)
find similar results using pooled Australian data over the
period 1989–2001.
One possible explanation for the apparent worsening
of immigrant health with years in Canada (relative to
comparable native-born Canadians) is that because of
changes in social norms and increasing experience in the
Canadian system, recent immigrants become increas-
ingly likely to use the health system, and thus become
more likely to be diagnosed as having chronic conditions
even though underlying measures of physical health are
comparable to native-born levels. However, results for
basic health service use—rapid convergence to native-born levels—seem to be inconsistent with this hypoth-
esis. A similar analysis of health behaviors—for
example, smoking, alcohol consumption and diet—
would give some direct insight into the appropriateness
of the first hypothesis. Finally, it is interesting to note
that there is relatively little change with YSM in fair or
poor self reported health status, even though there are
marked changes in the incidence of chronic conditions.
An important caveat is that an immigrant’s expectations
about what constitutes ‘good’ or ‘poor’ health are also
likely to evolve with years since immigration. This is an
interesting area for further research.
ARTICLE IN PRESS
MEN
Blood pressure test in the last year
0.3
0.4
0.5
0.6
0.7
0 3 6 9 1 2 1 5 1 8 2 1 2 4 2 7 3 0 3 3 3 6 3 9 4 2 4 5 4 8
YSM
NB aged 45
96-00
91-95
86-90
81-85
76-80
71-75
66-70
61-65
56-60
51-55
WOMEN
Blood pressure test in the last year
0.3
0.4
0.5
0.6
0.7
0.8
0 3 6 9 1 2 1 5 1 8 2 1 2 4 2 7 3 0 3 3 3 6 3 9 4 2 4 5 4 8
YSM
NB aged 45
arr 96-01
arr 91-95
arr 86-90
arr 81-85
arr 76-80
arr 71-75
arr 66-70
arr 61-65
arr 56-60
arr 51-55
Fig. 4. Predicted incidence of basic health service use for immigrant men and women by YSM and period of arrival in Canada,
graphed against a comparable native-born man and woman.
* Notes as for Fig. 1a.
J.T. McDonald, S. Kennedy / Social Science & Medicine 59 (2004) 1613–1627 1624

7/21/2019 Mcdonald
http://slidepdf.com/reader/full/mcdonald-56def3dfe0197 14/16
Acknowledgements
We would like to thank Nick Biddle, Lori Curtis,
Brian Ferguson, Bruce Newbold, Doug Willms,
conference participants at the 2003 Canadian Econom-
ics Association meetings and two anonymous referees
for helpful comments. Financial assistance from SSHRC(grant # 410-2002-1357) is gratefully acknowledged. The
econometric analysis in this paper was conducted at the
Statistics Canada-CRISP Research Data Centre at the
University of New Brunswick.
Appendix
Results for demographic and socio-economic vari-
ables are given in Table 4 and tests of joint significance
of year of arrival and years since migration are give in
Table 5.
ARTICLE IN PRESS
Table 4
Results for demographic and socio-economic variables—specification 1 with controls for year of arrival and years since migration
Type A condition (Probit) Type B condition (Probit) Fair or poor health (Probit)
Men Women Men Women Men Women
Age variables
Age
(Age-group 21–29) 0.0610 0.0807
0.0526 0.0392 0.0075 0.1297
(0.037) (0.032) (0.072) (0.047) (0.054) (0.053)
Age2, (Age-group 21–29) 0.0020 0.0028 0.0017 0.0014 0.0001 0.0044
(0.001) (0.001) (0.002) (0.002) (0.002) (0.002)
Age 0.1781 0.1614 0.0572 0.0902 0.0448 0.2152
(0.085) (0.076) (0.191) (0.108) (0.128) (0.119)
Age2 0.0027 0.0023 0.0009 0.0012 0.0005 0.0032
(0.001) (0.001) (0.003) (0.002) (0.002) (0.002)
Age (Age-group 40–49) 0.0413 0.0321 0.0065 0.0370 0.0136 0.0344
(0.021) (0.019) (0.044) (0.026) (0.031) (0.028)
Age2, (Age-group 40–49) 0.0011 0.0008 0.0002 0.0009 0.0004 0.0008
(0.001) (0.000) (0.001) (0.001) (0.001) (0.001)
Age (Age-group 50–59) 0.0528 0.0609 0.0066 0.0316 0.0134 0.0840
(0.032) (0.029) (0.070) (0.041) (0.049) (0.045)
Age2 (Age-group 50–59) 0.0013 0.0013 0.0000 0.0008 0.0004 0.0018
(0.001) (0.001) (0.002) (0.001) (0.001) (0.001)
Age (Age-group 60–65) 0.0854 0.0793 0.0503 0.0469 0.0190 0.1306
(0.042) (0.039) (0.086) (0.052) (0.061) (0.056)
Age2, (Age-group 60–65) 0.0019 0.0016 0.0007 0.0011 0.0001 0.0026
(0.001) (0.001) (0.002) (0.001) (0.001) (0.001)
Age (year 2000–01) 0.0061 0.0082 0.0006 0.0095 0.0114 0.0066
(0.011) (0.010) (0.021) (0.013) (0.015) (0.013)
Age2, (year 2000–01) 0.0001 0.0001 0.0000 0.0001 0.0001 0.0001
(0.000) (0.000) (0.000) (0.000) (0.000) (0.000)
Education and Language
Did not finish high school 0.0475 0.0800 0.0991 0.0727 0.3762 0.4425
(0.029) (0.028) (0.040) (0.032) (0.033) (0.033)
Undergraduate degree 0.0196 0.0451 0.0399 0.1245
0.2966
0.3520
(0.034) (0.029) (0.047) (0.041) (0.059) (0.045)
Other post secondary 0.0688 0.1099 0.0510 0.0583 0.0162 0.0060
(0.025) (0.023) (0.035) (0.028) (0.033) (0.030)
Higher degree 0.0646 0.1407 0.0479 0.0455 0.4388 0.2374
(0.043) (0.050) (0.067) (0.059) (0.070) (0.102)
Speaks French 0.0835 0.0491 0.0229 0.0312 0.0037 0.0214
(0.027) (0.027) (0.039) (0.033) (0.036) (0.034)
Speaks another language than French/English0.0421 0.0310 0.0290 0.0330 0.0561 0.1753
(0.031) (0.029) (0.040) (0.037) (0.042) (0.0370)
Speaks neither French nor English 0.2198 0.1473 0.2180 0.0401 0.1534 0.1283
(0.088) (0.069) (0.140) (0.090) (0.099) (0.086)
Marital status and children
Married 0.0612 0.0007 0.0122 0.0246 0.1594 0.2006
(0.029) (0.027) (0.041) (0.035) (0.038) (0.036)
J.T. McDonald, S. Kennedy / Social Science & Medicine 59 (2004) 1613–1627 1625

7/21/2019 Mcdonald
http://slidepdf.com/reader/full/mcdonald-56def3dfe0197 15/16
ARTICLE IN PRESS
Table 4 (continued )
Type A condition (Probit) Type B condition (Probit) Fair or poor health (Probit)
Men Women Men Women Men Women
Other marital status 0.1242 0.0965 -0.0129 0.0881 0.0501 0.0029
(0.041) (0.035) (0.052) (0.046) (0.051) (0.048)
Kids aged o11 at home 0.0316 0.0256 0.0335 0.0051 0.0306 0.0203
(0.018) (0.016) (0.025) (0.023) (0.023) (0.022)
Kids agedo6 at home 0.0988 0.0162 0.0088 0.0166 0.0070 0.0443
(0.026) (0.023) (0.040) (0.033) (0.036) (0.033)
Proxy Variables for Permanent Income
Owns own residence 0.0598 0.0849 0.1042 0.0961 0.2712 0.2290
(0.029) (0.028) (0.045) (0.035) (0.035) (0.033)
Received dividend income 0.0508 0.0080 0.0691 0.0098 0.1491 0.2147
(0.030) (0.026) (0.034) (0.031) (0.041) (0.038)
Semi-detached house 0.0072 0.0022 0.0145 0.0046 0.0288 0.0024
(0.006) (0.006) (0.008) (0.006) (0.008) (0.007)
Apartment 0.0205 0.0799 0.0850 0.0160 0.0095 0.0343
(0.035) (0.031) (0.044) (0.038) (0.049) (0.037)
Mobile home 0.0128 0.0674 0.0625 0.0564 0.0533 0.0017(0.038) (0.035) (0.062) (0.042) (0.045) (0.038)
Other type of dwelling 0.0654 0.0509 0.0078 0.1130 0.1459 0.3817
(0.066) (0.064) (0.090) (0.083) (0.075) (0.092)
More than 5 bedrooms 0.0118 0.1418 0.0917 0.0544 0.0126 0.0262
(0.088) (0.096) (0.101) (0.103) (0.095) (0.114)
More than 2 bedrooms 0.1505 0.2891 0.3267 0.0255 0.2095 0.1622
(0.268) (0.343) (0.314) (0.387) (0.290) (0.367)
Ethnicity
Black ethnicity 0.0167 0.0258 0.2052 0.1210 0.2270 0.0932
(0.089) (0.071) (0.109) (0.093) (0.115) (0.115)
Asian ethnicity 0.0064 0.0790 0.0487 0.2134 0.0987 0.0301
(0.055) (0.054) (0.088) (0.079) (0.082) (0.081)
Native Canadian ethnicity 0.0541 0.1170 0.2716 0.2039 0.0261 0.4794
(0.095) (0.062) (0.092) (0.077) (0.070) (0.077)
Ethnicity not reported 0.0477 0.1181 0.1378 0.1481 0.1915 0.1315
(0.087) (0.102) (0.114) (0.103) (0.115) (0.153)
Other controls not reported include indicator variables for province and population size of region of residence, the current
unemployment rate, and an indicator variable for 2001 plus interactions with age and age-squared.Denotes significant at the 5% level.
Table 5
Tests of joint significance of year of arrival and years since migration—specific chronic conditions ( p-values)
Incidence of specific chronic
condition
Men Women
Cohort effects Cohort and YSM
effects
Cohort effects Cohort and YSM
effects
Type A
Allergies 0.729 0.000 0.139 0.000
Asthma 0.154 0.000 0.495 0.000
Backpain 0.437 0.000 0.844 0.000
High blood pressure 0.243 0.019 0.945 0.469
Migraine 0.152 0.222 0.713 0.005
Ulcer 0.425 0.484 0.132 0.066
Arthritis 0.240 0.000 0.849 0.000
Bronchitis 0.067 0.032 0.557 0.000
J.T. McDonald, S. Kennedy / Social Science & Medicine 59 (2004) 1613–1627 1626

7/21/2019 Mcdonald
http://slidepdf.com/reader/full/mcdonald-56def3dfe0197 16/16
References
Bailis, D., Segall, A., & Chipperfield, J. (2003). Two views of self-rated general health status. Social Science & Medicine,
56 (2), 203–217.
Baker, M., Stabile, M., & Deri, C. (2001). What do self-reported
objective measures of health measure? NBER Working Paper
8419.
Biddle, N., Kennedy, S., & McDonald, J.T. (2003). Health
assimilation patterns among Australian immigrants,
mimeo.
Borjas, G. (1985). Assimilation and changes in cohort quality
revisited: What happened to immigrant earnings in the
1980s? Journal of Labor Economics, 13, 201–245.
Chen, J., Ng, E., & Wilkins, R. (1996). The health of Canada’s
immigrants in 1994–95. Health Reports, 7 (4), 33–45.
Crossley, T., & Kennedy, S. (2002). The reliability of self-assessed health status. Journal of Health Economics, 21,
643–658.
Donovan, J., d’Espaignet, C.M., & van Ommeren, M. Eds.
(1992). Immigrants in Australia: A health profile, Canberra:
AGPS.
Dunn, J., & Dyck, I. (2000). Social determinants of health in
Canada’s immigrant population: Results from the national
population health survey. Social Science & Medicine, 51,
1573–1593.
Ettner, S. (1996). New evidence on the relationship between
income and health. Journal of Health Economics, 15,
67–85.
Frank, J. (1995). Why Population Health? Canadian Journal of
Public Health, 86 (3), 162–164.
Globerman, S. (1998). Immigration and health care utilization
patterns in Canada. Vancouver: Research on Immigration
and Integration in the Metropolis.
Hyman, I. (2001). Immigration and health. Health Policy
Working Paper 01-05. Ottawa: Health Canada.
Jasso, G., Massey, D., Rosenzweig, M., & Smith, J. (2003).
Immigrant health—selectivity and acculturation. RAND
unpublished manuscript.Jenkins, C. (2002) ‘Asthma’, http://www.healthinsite.gov.au/
expert/Asthma, accessed December 19, 2003.
Kinnon, D. (1999). Canadian research on immigration and
health. Ottawa: Health Canada.
Lalonde, R., & Topel, R. (1991). Immigrants in the American
labor market: Quality, assimilation and distributional
effects. AEA Papers and Proceedings, 297–302.
Laroche, M. (2000). Health status and health services utiliza-
tion of Canada’s immigrant and non-immigrant popula-
tions. Canadian Public Policy, 26 (2), 51–75.
Leclere, F., Jensen, L., & Biddlecom, A. (1994). Health care
utilization, family context, and adaptation among immi-
grants to the United States. Journal of Health and Social
Behavior, 35(4), 370–384.Menec, V., Chipperfield, J., & Perry, R. (1999). Self-perceptions
of health: A prospective analysis of mortality, control, and
health. Journal of Gerontology: Psychological Sciences,
54B (2), P85–P93.
Newbold, K. B., & Danforth, J. (2003). Health status and
Canada’s immigrant population. Social Science & Medicine,
57 (10), 1981–1995.
Perez, C. (2002). Health status and health behaviour among
immigrants. Health Reports (Supplement), 13. Statistics
Canada Catalogue 82-003.
Ratner, P., Johnson, J., & Jeffrey, B. (1998). Examining
emotional, physical, social and spiritual health as determi-
nants of self-rated health status. American Journal of Health
Promotion, 12(4), 275–282.
Shields, M., & Shooshtari, S. (2001). Determinants of self-
perceived health. Health Reports, 13(1), 35–50.
Stephen, E., Foote, K., Hendershot, G., & Schoenborn, C.
(1994). Health of the foreign-born population. Advance
Data from Vital and Health Statistics, 241, 1–10.
ARTICLE IN PRESS
Table 5 (continued )
Incidence of specific chronic
condition
Men Women
Cohort effects Cohort and YSM
effects
Cohort effects Cohort and YSM
effects
Type B Heart disease 0.129 0.251 0.013 0.026
Cancer 0.073 0.095 0.413 0.011
Diabetes 0.077 0.136 0.217 0.002
Crohn’s disease 0.353 0.005 0.456 0.002
Thyroid 0.057 0.004 0.253 0.065
These results are based on estimation of Eq. (1) for the incidence of specific chronic conditions, and refer to the results of statistical
tests that the specified sets of regressors are jointly insignificant.
J.T. McDonald, S. Kennedy / Social Science & Medicine 59 (2004) 1613–1627 1627