McCurtain County Data & Information
66
McCurtain County Data & Information Oklahoma Cooperative Extension Service Oklahoma Center for Rural Health Oklahoma State University October 2012 Traffic Crime Education Health Economic
Transcript of McCurtain County Data & Information
McCurtain County Data & Information
Oklahoma Cooperative Extension Service Oklahoma Center for Rural Health
Oklahoma State University
October 2012
Traffic Crime
Education Health Economic

AE 12086
Economic Data, Health/Behavioral Data, Education Data, Traffic Accident Data, and Crime Data
for McCurtain County and the State of Oklahoma
Data and Information Reports for all Oklahoma Counties are available on the website: http://www.okruralhealthworks.org
Gerald A. Doeksen - Extension Economist/Regents Professor Brian E. Whitacre - Extension Economist/Associate Professor
Cheryl F. St. Clair - Associate State Extension Specialist
Fred C. Eilrich - Assistant State Extension Specialist
Oklahoma Cooperative Extension Service, OSU, Stillwater 405-744-6083
Bradley J. Bain - County Extension Director
McCurtain County Extension Office, OSU, Idabel 580-286-7558
Corie Kaiser - Director
Oklahoma Office of Rural Health, Oklahoma City 405-840-6505
Oklahoma Cooperative Extension Service
County Extension Offices Oklahoma Office of Rural Health
Oklahoma State University
October 2012

A. ECONOMIC DATA

Payne
Pittsburg Pontotoc
Pottawatomie
Pushmataha
Roger Mills
Rogers
Sequoyah
Stephens
Texas
Tillman
Tulsa Wagoner
Washita
Woods
Woodward
Adair
Alfalfa
Atoka
Beaver
Beckham
Blaine
Bryan
Caddo
Canadian
Carter
Cherokee
Choctaw
Cimarron
Cleveland
Coal Comanche
Cotton
Craig
Creek
Custer
Delaware
Dewey
Ellis Garfield
Garvin
Grady
Grant
Greer
Harmon
Harper
Haskell Hughes
Jackson
Jefferson Johnston
Kay
Kingfisher
Kiowa Latimer Le Flore
Lincoln Logan
Love
McClain
McCurtain
McIntosh
Major
Marshall
Mayes
Murray
Muskogee
Noble
Nowata
Okfuskee Oklahoma Okmulgee
Osage
Ottawa
Pawnee
Seminole
Washington
1.1
3.3 -0.2
Table 3. Population Change for Oklahoma Counties and the State of Oklahoma, 2010-2011
SOURCE: U.S. Census Bureau, (www.census.gov [August 2012]).
-18.1% to -1.1%
-0.9% to -0.3%
-0.2% to 0.2%
0.3% to 0.9%
1.0% to 3.4%
0.5 0.3
-1.2 0.4
-2.4 -0.2
1.7 0.1
1.3
-0.9
0.1 -0.1 0.9
0.9 0.3 0.0
0.4 0.3
1.8 1.2
1.0 1.5
-18.1
-0.2
-0.5 0.8
-0.3 -1.8 -0.1
0.0
0.9
1.4
-0.2
1.2
3.4
1.1
0.3
0.5
1.6
1.9
0.8
-0.3
2.2 2.1
1.2
-0.4
-0.7
0.7
1.3
-0.5
-0.3
-1.1
0.8
0.6
1.1 0.2
-0.4
1.7
1.6 1.3
0.1
0.3
-0.8
0.1
0.5 0.0
0.3 0.5
1.4
-0.1 0.0
-0.3 1.2
0.9 1.0

Payne
Pittsburg
Pontotoc
Pottawatomie
Pushmataha
Roger Mills
Rogers
Sequoyah
Stephens
Texas
Tillman
Tulsa Wagoner
Washita
Woods
Woodward
Adair
Alfalfa
Atoka
Beaver
Beckham
Blaine
Bryan
Caddo
Canadian
Carter
Cherokee
Choctaw
Cimarron
Cleveland
Coal Comanche
Cotton
Craig
Creek
Custer
Delaware
Dewey
Ellis Garfield
Garvin
Grady
Grant
Greer
Harmon
Harper
Haskell Hughes
Jackson
Jefferson Johnston
Kay
Kingfisher
Kiowa Latimer Le Flore
Lincoln Logan
Love
McClain
McCurtain
McIntosh
Major
Marsha
Mayes
Murray
Muskogee
Noble
Nowata
Okfuskee Oklahoma Okmulgee
Osage
Ottawa
Pawnee
Seminole
Washington
6.2
5.1 3.3
Table 1. Unemployment Rates for Oklahoma Counties and the State of Oklahoma, 2011
SOURCE: U.S. Department of Labor, Bureau of Labor Statistics (www.bls.gov [August 2012]).
4.0% and lower
4.1%-5.5%
5.6%-7.5%
7.6%-9.5%
9.0% and higher
3.8
3.6
3.7 4.8
3.3 4.0 3.8
4.1
3.7 7.2
4.8 7.4 8.2
7.9 6.0 6.0
6.5 7.8
5.7 3.3
3.9 2.9
6.8
6.8
4.2 3.5
5.7 7.7 5.3
5.3 5.9
6.7
5.3
3.8
5.0
5.8
5.5
7.0
5.2
6.1
5.4
5.9
5.1 5.3
5.7
4.9
7.8
7.2
8.5
6.1
9.7
9.6
4.9
3.6
5.1 7.3
4.5
6.4
5.4 6.3
7.5
7.6
7.5
9.9
9.4 10.9
7.2 8.9
6.5
9.6 7.4
7.3
6.7
6.5 5.1

Section A, Table 1 Census Populations, Population Estimates and Percent Changes
For McCurtain County Cities and Towns, McCurtain County, and the State of Oklahoma Census Population Estimated
Population Percent Change
10 Years 10 Years 10 Years 1 Year 1980 1990 2000 2010 2011 80 -90 90 - 00 00 - 10 10 - 11
Broken Bow 3,965 3,961 4,230 4,120 4,123 - 0.1% 6.8% - 2.6% 0.1%Garvin 162 128 143 256 254 -21.0% 11.7% 79.0% - 0.8%Haworth 341 293 354 297 296 -14.1% 20.8% -16.1% - 0.3%Idabel 7,622 6,957 6,952 7,010 7,018 - 8.7% - 0.1% 0.8% 0.1%Millerton 262 234 359 320 320 -10.7% 53.4% -10.9% 0.0%Smithville NA 111 123 113 NA NA 10.8% - 8.1% NAValliant 927 873 771 754 756 - 5.8% -11.7% - 2.2% 0.3%Wright City 1,168 836 848 762 764 -28.4% 1.4% -10.1% 0.3%
Balance of McCurtain County
21,704 20,040 20,622 19,519 19,664 - 7.7% 2.9% - 5.3% 0.7%
McCurtain County 36,151 33,433 34,402 33,151 33,195 - 7.5% 2.9% - 3.6% 0.1%
State of Oklahoma 3,025,487 3,145,585 3,450,654 3,642,631 3,687,050 4.0% 9.7% 6.9% 1.2%
SOURCE: U.S. Census Bureau, 1980, 1990, 2000 & 2010 Census population, 2011 Census population estimates (www.census.gov). *Cities labeled (part) are located in more than one county. The data here represents only the portion of the city found in McCurtain county.
A-1

Section A, Table 2 Population by Age Groups and Sex
For McCurtain County
Age Group Male Female Total Percent of Total
0-4 1,175 1,127 2,302 6.9%5-9 1,214 1,129 2,343 7.1%
10-14 1,272 1,188 2,460 7.4%15-19 1,251 1,148 2,399 7.2%
20-24 889 932 1,821 5.5%25-29 888 952 1,840 5.6%
30-34 916 974 1,890 5.7%35-39 979 1,059 2,038 6.1%
40-44 1,005 1,042 2,047 6.2%45-49 1,174 1,152 2,326 7.0%
50-54 1,108 1,190 2,298 6.9%55-59 1,073 1,147 2,220 6.7%
60-64 956 1,071 2,027 6.1%65-69 834 881 1,715 5.2%
70-74 636 628 1,264 3.8%75-79 443 575 1,018 3.1%
80-84 260 354 614 1.9%85+ 172 357 529 1.6%
Total 16,245 16,906 33,151 100.0%
SOURCE: 2010 Census population, U.S. Census Bureau (www.census.gov).
A-2

Section A, Table 3 Persons < 18 Years of Age
Population Numbers and Percent of Total Population For McCurtain County and the State of Oklahoma
McCurtain County State of Oklahoma
1980 Population < 18 Years 12,011 854,884 Percent of Total Population 33.2% 28.3% 1990 Population < 18 Years 9,894 837,007 Percent of Total Population 29.6% 26.6% 2000 Population < 18 Years 9,693 892,360 Percent of Total Population 28.2% 25.9% 2010 Population < 18 Years 8,599 929,666 Percent of Total Population 25.9% 24.8%
SOURCE: 1980, 1990, 2000, and 2010 Census populations, U.S. Census Bureau (www.census.gov).
A-3

Section A, Table 4 Persons ≥ 65 Years of Age
Population Numbers and Percent of Total Population For McCurtain County and the State of Oklahoma
McCurtain County State of Oklahoma
1980 Population ≥ 65 Years 4,697 376,126 Percent of Total Population 13.0% 12.4% 1990 Population ≥ 65 Years 4,730 424,213 Percent of Total Population 14.1% 13.5% 2000 Population ≥ 65 Years 4,811 455,950 Percent of Total Population 14.0% 13.2% 2010 Population ≥ 65 Years 5,140 506,714 Percent of Total Population 15.5% 13.5%
SOURCE: 1980, 1990, 2000, and 2010 Census populations, U.S. Census Bureau (www.census.gov).
A-4

Section A, Table 5 Race and Ethnic Groups
Census Populations, Population Estimates, and Percent of Total Population For McCurtain County and the State of Oklahoma
McCurtain County State of Oklahoma Race/Ethnic Group Number Percent Number Percent
1990 Census White 24,821 74.2% 2,583,512 82.1% Black 3,452 10.3% 233,801 7.4% Native American 1 4,873 14.6% 252,420 8.0% Other 2 287 0.9% 75,852 2.4% Two or more races 3 N/A N/A N/A N/A
Hispanic Origin 4 459 1.4% 86,160 2.7%
2000 Census White 24,765 72.0% 2,628,434 76.2% Black 3,206 9.3% 260,968 7.6% Native American 1 4,727 13.7% 273,230 7.9% Other 2 83 0.2% 132,037 3.8% Two or more races 3 1,621 4.7% 155,985 4.5% Hispanic Origin 4 1,064 3.1% 179,304 5.2%
2010 Census White 22,259 67.1% 2,706,845 72.2% Black 2,894 8.7% 277,644 7.4% Native American 1 5,017 15.1% 321,687 8.6% Other 2 923 2.8% 223,854 6.0% Two or more races 3 2,058 6.2% 221,321 5.9% Hispanic Origin 4 1,552 4.7% 332,007 8.9% SOURCE: 1990, 2000, and 2010 Census data, U.S. Census Bureau (www.census.gov). 1 Native American includes American Indians and Alaska Natives. 2 Other is defined as Asian Americans, Native Hawaiians, Pacific Islanders and all others. 3 Two or more races category indicates a person is included in more than one race group. This category was introduced in the 2000 Census. 4 Hispanic is not a race, but rather a description of ethnic origin; Hispanics are included in the five race groups. *Represents a percentage less than 0.1%.
A-5

Section A, Table 6 Per Capita Income and Transfer Receipts as a Percent of Personal Income
For McCurtain County and the State of Oklahoma
Per Capita Income (Current $) Transfer Receipts as a % of Personal Income McCurtain County State of Oklahoma McCurtain County State of Oklahoma
2000 $18,319 $24,602 23.5% 15.0% 2001 $20,685 $26,200 23.4% 15.5% 2002 $20,753 $26,185 25.9% 16.6% 2003 $20,721 $26,862 27.7% 16.9% 2004 $22,717 $28,702 27.0% 16.7% 2005 $23,381 $30,333 28.0% 16.9% 2006 $24,079 $33,040 29.9% 16.7% 2007 $25,065 $34,329 31.1% 17.1% 2008 $26,136 $37,694 32.5% 16.8% 2009 $25,705 $34,001 36.8% 20.6% 2010 $27,540 $35,389 35.9% 20.7%
SOURCE: U.S. Department of Commerce, Bureau of Economic Analysis (www.bea.gov).
A-6

Section A, Table 7 Labor Force Data
For McCurtain County, the State of Oklahoma, and the United States
McCurtain County McCurtain State of United County Oklahoma States Labor Force Employment Unemployment Unemployment Rate
2001 15,634 14,805 829 5.3% 3.7% 4.7% 2002 14,908 13,896 1,012 6.8% 4.8% 5.8% 2003 14,831 13,466 1,365 9.2% 5.6% 6.0% 2004 14,686 13,549 1,137 7.7% 5.0% 5.5% 2005 13,974 13,043 931 6.7% 4.5% 5.1% 2006 14,023 13,136 887 6.3% 4.1% 4.6% 2007 13,924 13,031 893 6.4% 4.0% 4.6% 2008 14,078 13,144 934 6.6% 3.7% 5.8% 2009 14,773 13,165 1,608 10.9% 6.4% 9.3% 2010 15,333 13,672 1,661 10.8% 7.0% 9.6%
2011 15,737 14,186 1,551 9.9% 6.2% 8.9% 2012* 15,880 14,516 1,364 8.6% 5.4% 8.4%
SOURCE: U.S. Department of Labor, Bureau of Labor Statistics (www.bls.gov). *Data for 2012 are the average of January through July 2012.
A-7
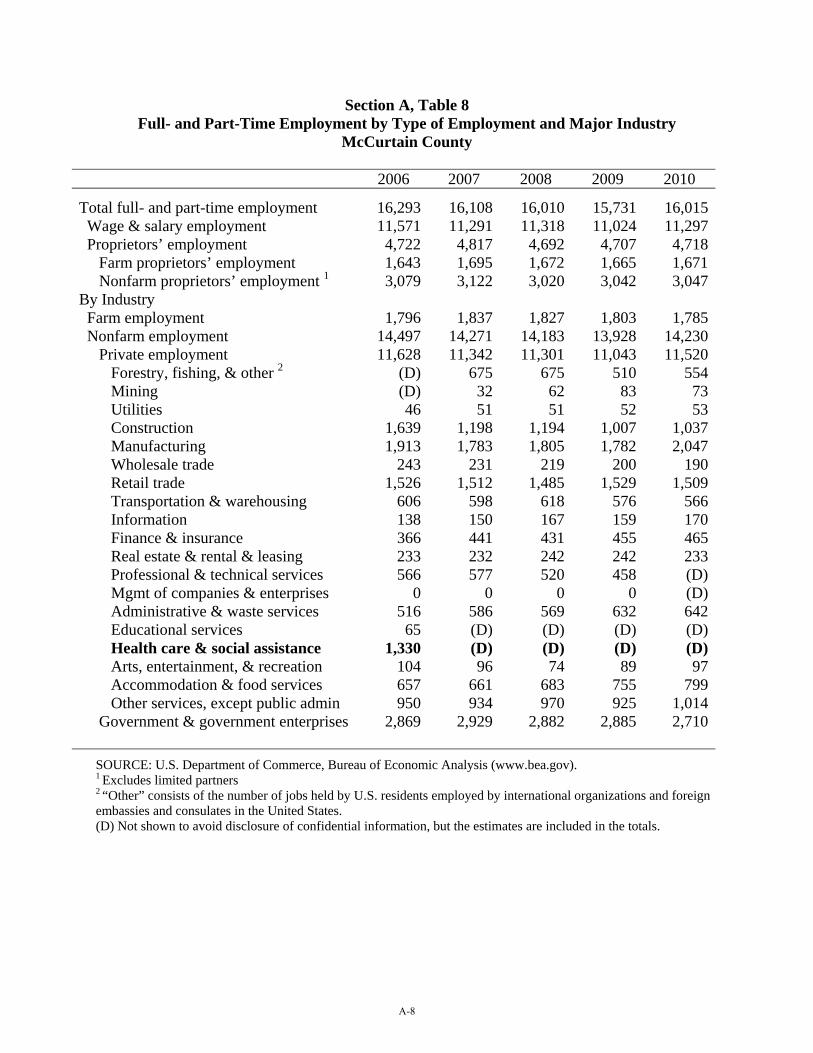
Section A, Table 8 Full- and Part-Time Employment by Type of Employment and Major Industry
McCurtain County
2006 2007 2008 2009 2010
Total full- and part-time employment 16,293 16,108 16,010 15,731 16,015 Wage & salary employment 11,571 11,291 11,318 11,024 11,297 Proprietors’ employment 4,722 4,817 4,692 4,707 4,718 Farm proprietors’ employment 1,643 1,695 1,672 1,665 1,671 Nonfarm proprietors’ employment 1 3,079 3,122 3,020 3,042 3,047By Industry Farm employment 1,796 1,837 1,827 1,803 1,785 Nonfarm employment 14,497 14,271 14,183 13,928 14,230 Private employment 11,628 11,342 11,301 11,043 11,520 Forestry, fishing, & other 2 (D) 675 675 510 554 Mining (D) 32 62 83 73 Utilities 46 51 51 52 53 Construction 1,639 1,198 1,194 1,007 1,037 Manufacturing 1,913 1,783 1,805 1,782 2,047 Wholesale trade 243 231 219 200 190 Retail trade 1,526 1,512 1,485 1,529 1,509 Transportation & warehousing 606 598 618 576 566 Information 138 150 167 159 170 Finance & insurance 366 441 431 455 465 Real estate & rental & leasing 233 232 242 242 233 Professional & technical services 566 577 520 458 (D) Mgmt of companies & enterprises 0 0 0 0 (D) Administrative & waste services 516 586 569 632 642 Educational services 65 (D) (D) (D) (D) Health care & social assistance 1,330 (D) (D) (D) (D) Arts, entertainment, & recreation 104 96 74 89 97 Accommodation & food services 657 661 683 755 799 Other services, except public admin 950 934 970 925 1,014 Government & government enterprises 2,869 2,929 2,882 2,885 2,710
SOURCE: U.S. Department of Commerce, Bureau of Economic Analysis (www.bea.gov). 1 Excludes limited partners 2 “Other” consists of the number of jobs held by U.S. residents employed by international organizations and foreign embassies and consulates in the United States. (D) Not shown to avoid disclosure of confidential information, but the estimates are included in the totals.
A-8
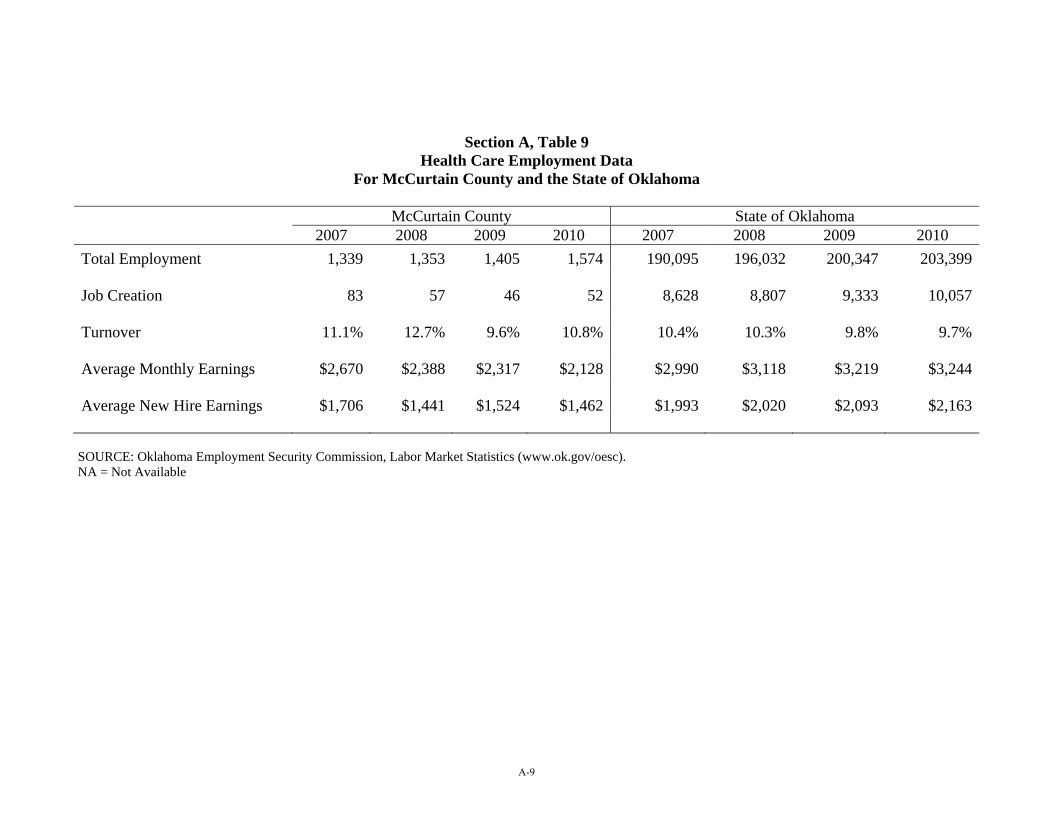
Section A, Table 9 Health Care Employment Data
For McCurtain County and the State of Oklahoma
McCurtain County State of Oklahoma 2007 2008 2009 2010 2007 2008 2009 2010
Total Employment 1,339 1,353 1,405 1,574 190,095 196,032 200,347 203,399 Job Creation 83 57 46 52 8,628 8,807 9,333 10,057 Turnover 11.1% 12.7% 9.6% 10.8% 10.4% 10.3% 9.8% 9.7% Average Monthly Earnings $2,670 $2,388 $2,317 $2,128 $2,990 $3,118 $3,219 $3,244 Average New Hire Earnings $1,706 $1,441 $1,524 $1,462 $1,993 $2,020 $2,093 $2,163
SOURCE: Oklahoma Employment Security Commission, Labor Market Statistics (www.ok.gov/oesc). NA = Not Available
A-9

Section A, Table 10 Earnings by Place of Work and by Major Industry for McCurtain County
($1,000s)
2006 2007 2008 2009 2010 Earnings by Place of Work $543,580 $523,611 $517,871 $488,250 $541,900 Farm earnings 20,028 13,665 13,846 5,593 $32,627 Nonfarm earnings 523,552 509,946 504,025 482,657 $509,273 Private earnings 410,185 387,599 379,578 356,332 $383,869 Forestry, fishing, & related activities (D) 35,580 29,256 22,718 $24,265 Mining (D) 615 1,621 2,748 $1,495 Utilities 3,472 3,532 3,799 3,673 $3,821 Construction 69,226 39,956 40,688 33,801 $38,489 Manufacturing 116,135 108,659 113,339 99,911 $108,975 Wholesale trade 7,774 7,851 11,209 10,721 $10,709 Retail trade 35,616 35,857 32,894 36,419 $37,972 Transportation & warehousing 28,715 29,598 27,861 24,288 $25,874 Information 6,992 7,559 8,768 8,598 $9,134 Finance & insurance 9,632 11,213 11,064 11,069 $11,463 RE rental & leasing 3,123 2,549 4,365 3,353 $37,972 Professional & technical services 14,134 15,761 15,160 14,362 (D) Mgmt of companies & enterprises 0 0 0 0 (D) Administration & waste services 8,482 9,671 9,642 10,365 $11,079 Educational services 1,096 (D) (D) (D) (D) Health care & social services 34,746 (D) (D) (D) (D) Arts, entertainment & recreation 670 533 532 540 $ 621 Accommodations & food services 8,331 8,602 9,550 10,973 $12,313 Other services 25,098 25,716 23,004 24,478 $30,079 Govt & govt enterprises 113,367 122,347 124,447 126,325 $125,404
SOURCE: U.S. Department of Commerce, Bureau of Economic Analysis (www.bea.gov). (D) Not shown to avoid disclosure of confidential information, but the estimates are included in the totals. (L) Less than $50,000, but the estimates for this item are included in the totals.
A-10
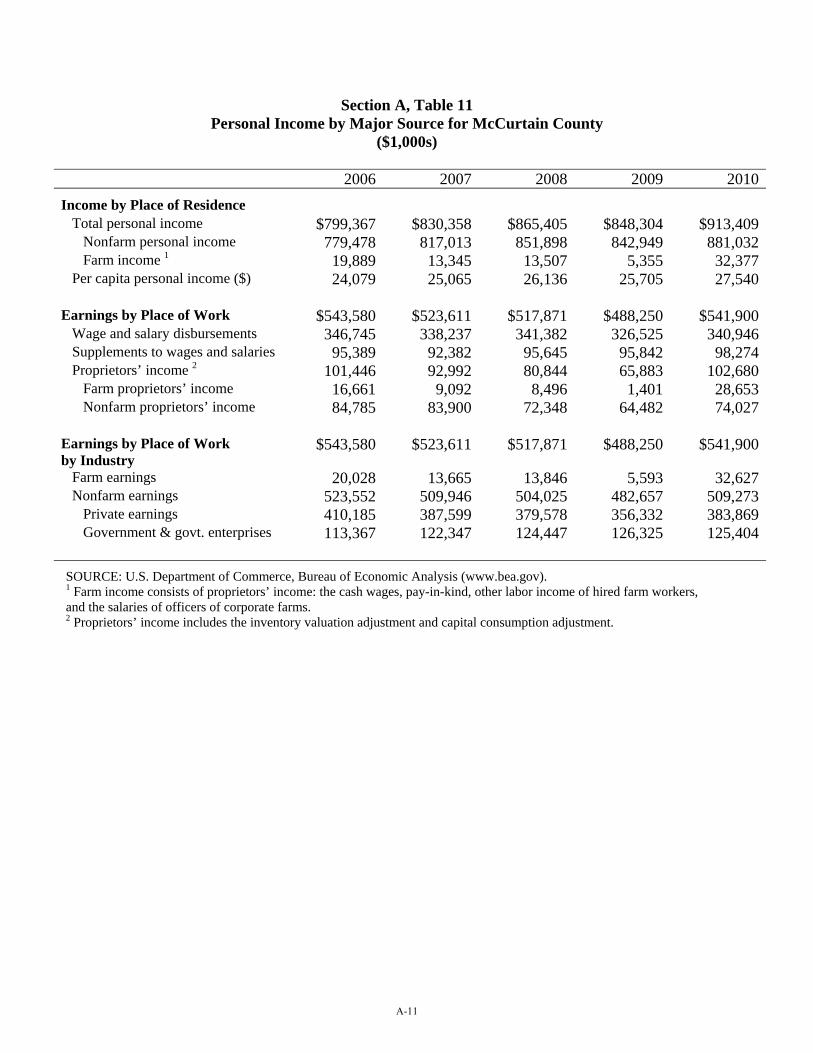
Section A, Table 11 Personal Income by Major Source for McCurtain County
($1,000s)
2006 2007 2008 2009 2010
Income by Place of Residence Total personal income $799,367 $830,358 $865,405 $848,304 $913,409 Nonfarm personal income 779,478 817,013 851,898 842,949 881,032 Farm income 1 19,889 13,345 13,507 5,355 32,377 Per capita personal income ($) 24,079 25,065 26,136 25,705 27,540 Earnings by Place of Work $543,580 $523,611 $517,871 $488,250 $541,900 Wage and salary disbursements 346,745 338,237 341,382 326,525 340,946 Supplements to wages and salaries 95,389 92,382 95,645 95,842 98,274 Proprietors’ income 2 101,446 92,992 80,844 65,883 102,680 Farm proprietors’ income 16,661 9,092 8,496 1,401 28,653 Nonfarm proprietors’ income 84,785 83,900 72,348 64,482 74,027 Earnings by Place of Work by Industry
$543,580 $523,611 $517,871 $488,250 $541,900
Farm earnings 20,028 13,665 13,846 5,593 32,627 Nonfarm earnings 523,552 509,946 504,025 482,657 509,273 Private earnings 410,185 387,599 379,578 356,332 383,869 Government & govt. enterprises 113,367 122,347 124,447 126,325 125,404
SOURCE: U.S. Department of Commerce, Bureau of Economic Analysis (www.bea.gov). 1 Farm income consists of proprietors’ income: the cash wages, pay-in-kind, other labor income of hired farm workers, and the salaries of officers of corporate farms. 2 Proprietors’ income includes the inventory valuation adjustment and capital consumption adjustment.
A-11

Section A, Table 12 Transfer Receipts for McCurtain County
($1,000s)
2006 2007 2008 2009 2010 Total transfer receipts $238,822 $257,834 $281,170 $311,843 $327,908Current receipts of individuals from government 234,415 252,476 275,104 305,508 321,510 Retirement & disability insurance benefits 73,807 78,376 82,744 90,865 93,722 Old-age, survivor & disability ins benefits 71,405 75,922 80,250 88,289 91,089 Railroad retirement & disability benefits 807 815 810 863 877 Workers’ compensation 1496 1538 1593 1629 1,666 Other govt disability ins & ret benefits 1 99 101 91 84 90 Medical benefits 115,417 126,874 134,887 142,733 147,592 Medicare benefits 68,463 73,192 79,483 84,937 89,022 Public assistance medical care benefits 2 46,348 53,105 54,760 57,146 57,897 Military medical insurance benefits 3 606 577 644 650 673 Income maintenance benefits 31,140 32,067 40,623 41,682 49,717 Supplemental security income (SSI) benefits 7,667 7,994 9,256 9,385 9,670 Family assistance 4 1,727 1,698 2,007 2,545 3,105 Supplemental nutrition assistance program 7,852 8,176 8,829 12,919 14,213 Other income maintenance benefits 5 13,894 14,199 20,531 16,833 22,729 Unemployment insurance compensation 1,785 2,134 3,483 12,009 12,829 State unemployment insurance compensation 1,762 2,087 3,417 11,835 12,679 Unemp comp for federal civilian empl (UCFE) (L) (L) (L) (L) (L) Unemp comp for railroad employees 0 (L) (L) 97 63 Unemp comp for veterans (UCX) (L) (L) (L) 69 73 Other unemployment compensation 6 0 0 0 0 0 Veterans benefits 9,621 10,223 10,325 11,590 12,547 Veterans pension & disability benefits 9,381 9,969 10,052 11,274 12,143 Veterans readjustment benefits 7 160 123 123 171 258 Veterans life insurance benefits 80 131 150 145 146 Other assistance to veterans 8 0 0 0 0 0 Federal education & training assistance 9 2,452 2,526 2,789 3,089 3,394 Other transfer receipt of individuals from govt 10 193 276 253 3,540 1,709Current receipts of nonprofit institutions 3,666 3,544 3,404 3,641 3,854 Receipts from Federal government 1,234 1,219 1,279 1,366 1,434 Receipts from state and local governments 11 768 738 775 857 913 Receipts from businesses 1,664 1,587 1,350 1,418 1,507Current receipts of individuals form businesses 12 741 1,814 2,662 2,694 2,544
SOURCE: U.S. Department of Commerce, Bureau of Economic Analysis (www.bea.gov).
A-12

Section A, Table 12 (continued)
Footnotes: 1 Consists largely of temporary disability payments and black lung payments. 2 Consists of Medicaid and other medical vendor payments. 3 Consists of payments made under the TriCare Management Program (formerly called CHAMPUS) for the medical care of dependents of active duty military personnel and of retired military personnel and their dependents at nonmilitary medical facilities. 4 Consists of benefits – generally known as temporary assistance for needy families—provided under the Personal Responsibility and Work Opportunity Reconciliation Act of 1996. 5 Consists of largely of general assistance; expenditures for food under the supplemental program for women, infants and children; other needs assistance; refugee assistance; foster home care and adoption assistance; earned income tax credits; child tax credits; and energy assistance. 6 Consists of trade readjustment allowance payments, Redwood Park benefit payments, public service employment benefit payments, and transitional benefit payments. 7 Consists largely of veterans’ readjustment benefit payments, educational assistance to spouses and children of disabled or deceased veterans, payments to paraplegics, and payments for autos and conveyances for disabled veterans. 8 Consists of State and local government payments to veterans. 9 Consists largely of federal fellowship payments (National Science Foundation fellowships and traineeships, subsistence payments to State maritime academy cadets, and other federal fellowships), interest subsidy on higher education loans, basic educational opportunity grants, and Job Corps payments. 10 Consists largely of Bureau of Indian Affairs payments, education exchange payment, Alaska Permanent Fund dividend payments, compensation of survivors of public safety officer, compensation of victims of crime, disaster relief payments, compensation for Japanese internment, and other special payments to individuals. 11 Consists of State and local government educational assistance payments to nonprofit institutions, and other State and local government payments to nonprofit institutions. 12 Consists largely of personal injury payments to individuals other than employees and other business transfer payments. (L) Less than $50,000, but the estimates for this item are included in the totals.
A-12 (Continued)
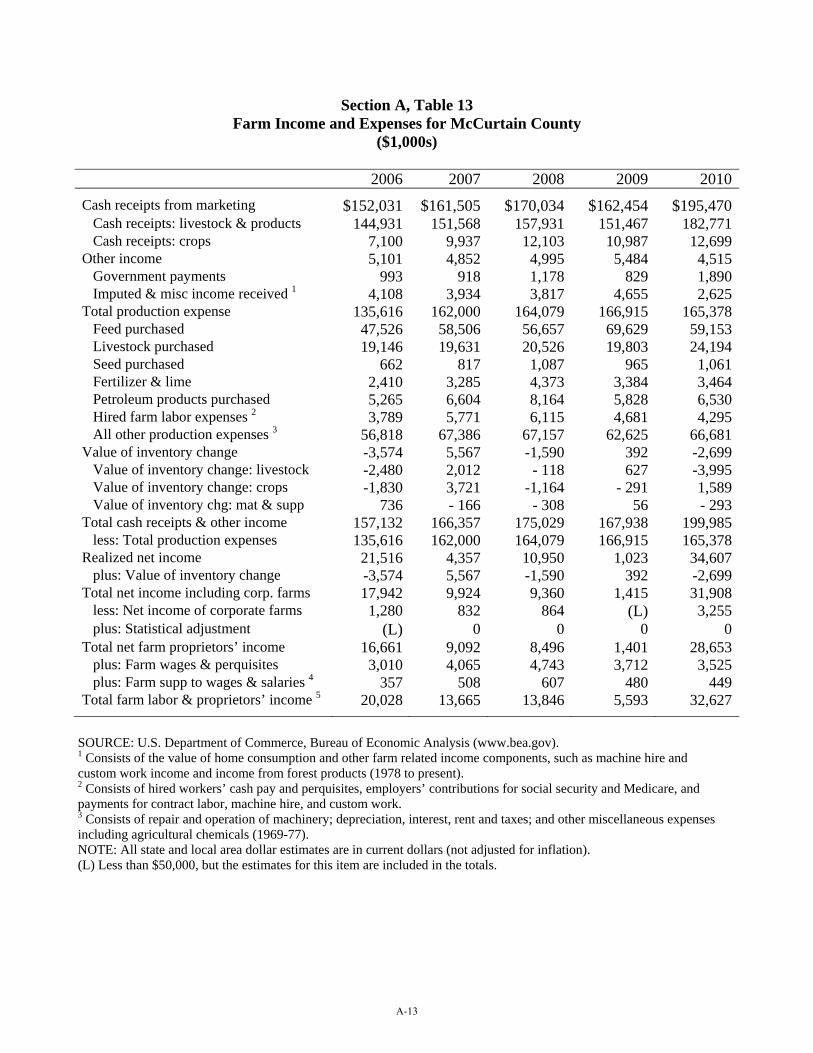
Section A, Table 13 Farm Income and Expenses for McCurtain County
($1,000s)
2006 2007 2008 2009 2010
Cash receipts from marketing $152,031 $161,505 $170,034 $162,454 $195,470 Cash receipts: livestock & products 144,931 151,568 157,931 151,467 182,771 Cash receipts: crops 7,100 9,937 12,103 10,987 12,699Other income 5,101 4,852 4,995 5,484 4,515 Government payments 993 918 1,178 829 1,890 Imputed & misc income received 1 4,108 3,934 3,817 4,655 2,625Total production expense 135,616 162,000 164,079 166,915 165,378 Feed purchased 47,526 58,506 56,657 69,629 59,153 Livestock purchased 19,146 19,631 20,526 19,803 24,194 Seed purchased 662 817 1,087 965 1,061 Fertilizer & lime 2,410 3,285 4,373 3,384 3,464 Petroleum products purchased 5,265 6,604 8,164 5,828 6,530 Hired farm labor expenses 2 3,789 5,771 6,115 4,681 4,295 All other production expenses 3 56,818 67,386 67,157 62,625 66,681Value of inventory change -3,574 5,567 -1,590 392 -2,699 Value of inventory change: livestock -2,480 2,012 - 118 627 -3,995 Value of inventory change: crops -1,830 3,721 -1,164 - 291 1,589 Value of inventory chg: mat & supp 736 - 166 - 308 56 - 293Total cash receipts & other income 157,132 166,357 175,029 167,938 199,985 less: Total production expenses 135,616 162,000 164,079 166,915 165,378Realized net income 21,516 4,357 10,950 1,023 34,607 plus: Value of inventory change -3,574 5,567 -1,590 392 -2,699Total net income including corp. farms 17,942 9,924 9,360 1,415 31,908 less: Net income of corporate farms 1,280 832 864 (L) 3,255 plus: Statistical adjustment (L) 0 0 0 0Total net farm proprietors’ income 16,661 9,092 8,496 1,401 28,653 plus: Farm wages & perquisites 3,010 4,065 4,743 3,712 3,525 plus: Farm supp to wages & salaries 4 357 508 607 480 449Total farm labor & proprietors’ income 5 20,028 13,665 13,846 5,593 32,627
SOURCE: U.S. Department of Commerce, Bureau of Economic Analysis (www.bea.gov). 1 Consists of the value of home consumption and other farm related income components, such as machine hire and custom work income and income from forest products (1978 to present). 2 Consists of hired workers’ cash pay and perquisites, employers’ contributions for social security and Medicare, and payments for contract labor, machine hire, and custom work. 3 Consists of repair and operation of machinery; depreciation, interest, rent and taxes; and other miscellaneous expenses including agricultural chemicals (1969-77). NOTE: All state and local area dollar estimates are in current dollars (not adjusted for inflation). (L) Less than $50,000, but the estimates for this item are included in the totals.
A-13
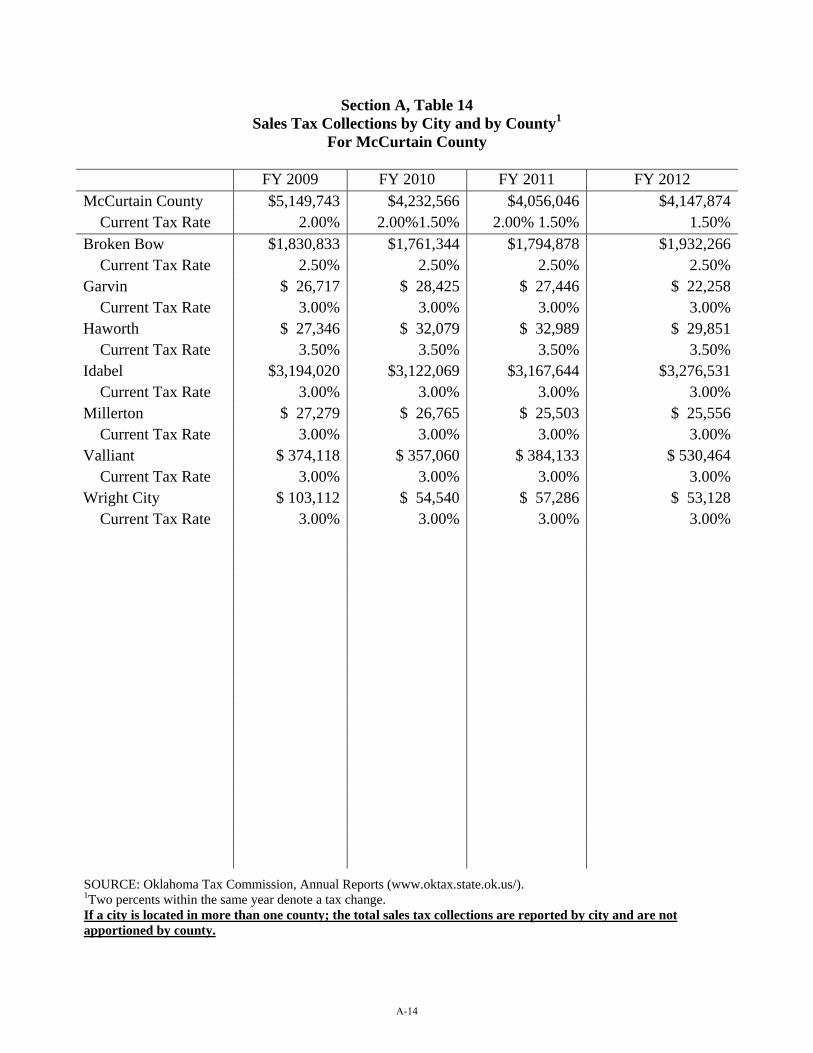
Section A, Table 14 Sales Tax Collections by City and by County1
For McCurtain County
FY 2009 FY 2010 FY 2011 FY 2012 McCurtain County $5,149,743 $4,232,566 $4,056,046 $4,147,874
Current Tax Rate 2.00% 2.00%1.50% 2.00% 1.50% 1.50%Broken Bow $1,830,833 $1,761,344 $1,794,878 $1,932,266
Current Tax Rate 2.50% 2.50% 2.50% 2.50%Garvin $ 26,717 $ 28,425 $ 27,446 $ 22,258 Current Tax Rate 3.00% 3.00% 3.00% 3.00%Haworth $ 27,346 $ 32,079 $ 32,989 $ 29,851
Current Tax Rate 3.50% 3.50% 3.50% 3.50%Idabel $3,194,020 $3,122,069 $3,167,644 $3,276,531
Current Tax Rate 3.00% 3.00% 3.00% 3.00%Millerton $ 27,279 $ 26,765 $ 25,503 $ 25,556 Current Tax Rate 3.00% 3.00% 3.00% 3.00%Valliant $ 374,118 $ 357,060 $ 384,133 $ 530,464 Current Tax Rate 3.00% 3.00% 3.00% 3.00%Wright City $ 103,112 $ 54,540 $ 57,286 $ 53,128 Current Tax Rate 3.00% 3.00% 3.00% 3.00%
SOURCE: Oklahoma Tax Commission, Annual Reports (www.oktax.state.ok.us/). 1Two percents within the same year denote a tax change. If a city is located in more than one county; the total sales tax collections are reported by city and are not apportioned by county.
A-14

Section A, Table 15 Use Tax Collections by City and by County1
For McCurtain County
FY 2009 FY 2010 FY 2011 FY 2012 McCurtain County $266,384 $191,982 $184,168 $281,298
Current Tax Rate 2.00% 2.00% 1.50% 1.50% 1.50%
Broken Bow $107,598 $83,827 $75,114 $101,532Current Tax Rate 2.50% 2.50% 2.50% 2.50%
Idabel $107,895 $96,917 $122,184 $159,562 Current Tax Rate 3.00% 3.00% 3.00% 3.00%Millerton $ 369 $3,816 $1,676 $1,288
Current Tax Rate 3.00% 3.00% 3.00% 3.00%Valliant $51,337 $73,359 $95,202 $142,326
Current Tax Rate 3.00% 3.00% 3.00% 3.00%Wright City $4,473 $2,773 $3,955 $5,942 Current Tax Rate 3.00% 3.00% 3.00% 3.00%
SOURCE: Oklahoma Tax Commission, Annual Reports (www.oktax.state.ok.us/). 1Two Percents within the same year denote a tax change. If a city is located in more than one county; the total sales tax collections are reported by city and are not apportioned by county.
A-15
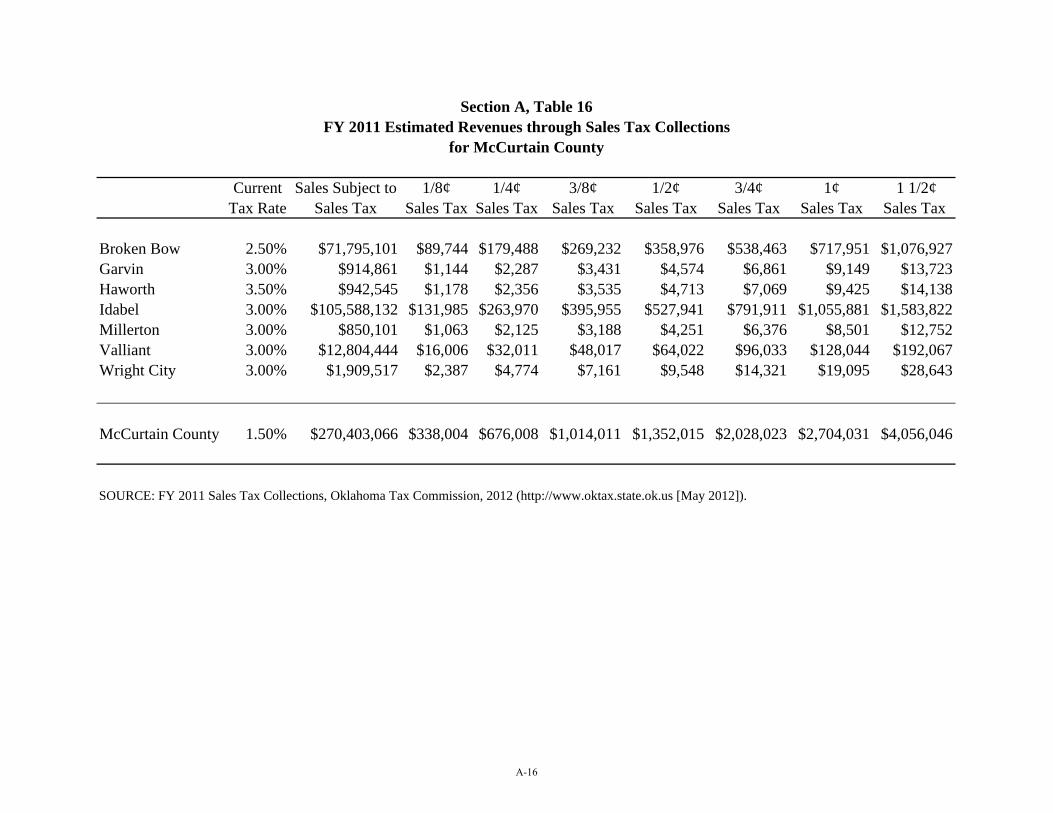
Current Sales Subject to 1/8¢ 1/4¢ 3/8¢ 1/2¢ 3/4¢ 1¢ 1 1/2¢Tax Rate Sales Tax Sales Tax Sales Tax Sales Tax Sales Tax Sales Tax Sales Tax Sales Tax
Broken Bow 2.50% $71,795,101 $89,744 $179,488 $269,232 $358,976 $538,463 $717,951 $1,076,927Garvin 3.00% $914,861 $1,144 $2,287 $3,431 $4,574 $6,861 $9,149 $13,723Haworth 3.50% $942,545 $1,178 $2,356 $3,535 $4,713 $7,069 $9,425 $14,138Idabel 3.00% $105,588,132 $131,985 $263,970 $395,955 $527,941 $791,911 $1,055,881 $1,583,822Millerton 3.00% $850,101 $1,063 $2,125 $3,188 $4,251 $6,376 $8,501 $12,752Valliant 3.00% $12,804,444 $16,006 $32,011 $48,017 $64,022 $96,033 $128,044 $192,067Wright City 3.00% $1,909,517 $2,387 $4,774 $7,161 $9,548 $14,321 $19,095 $28,643
McCurtain County 1.50% $270,403,066 $338,004 $676,008 $1,014,011 $1,352,015 $2,028,023 $2,704,031 $4,056,046
Section A, Table 16FY 2011 Estimated Revenues through Sales Tax Collections
for McCurtain County
SOURCE: FY 2011 Sales Tax Collections, Oklahoma Tax Commission, 2012 (http://www.oktax.state.ok.us [May 2012]).
A-16
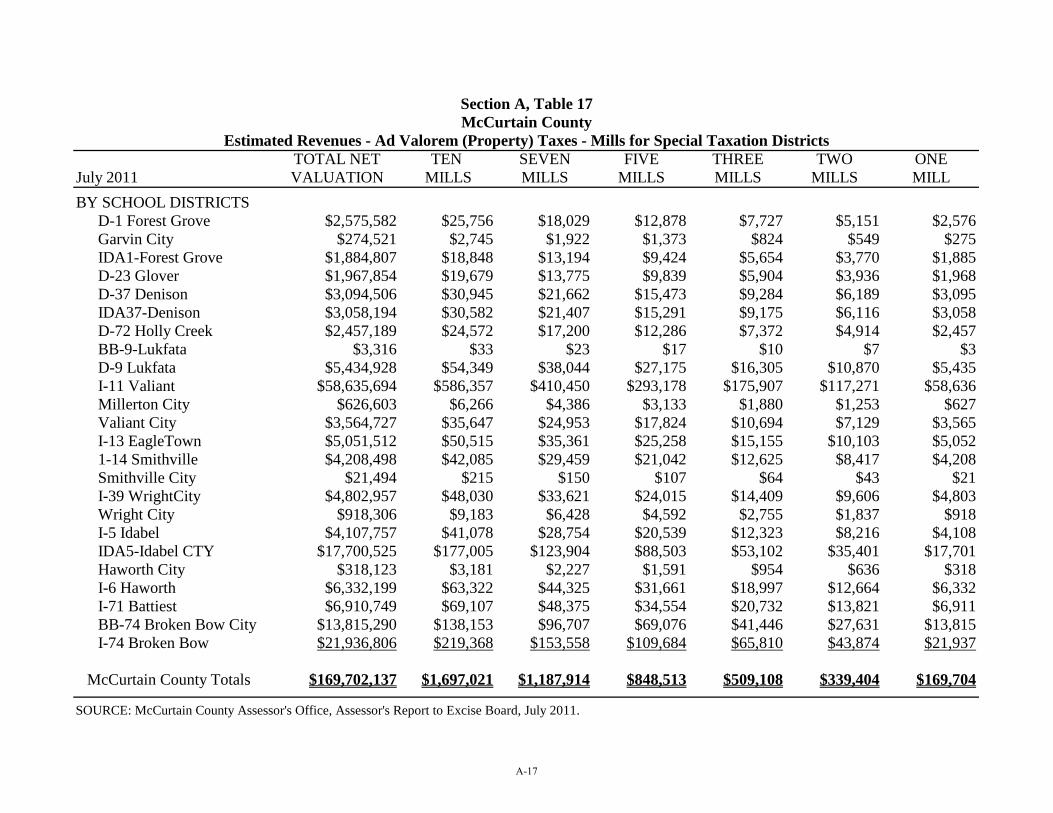
TOTAL NET TEN SEVEN FIVE THREE TWO ONEJuly 2011 VALUATION MILLS MILLS MILLS MILLS MILLS MILLBY SCHOOL DISTRICTS
D-1 Forest Grove $2,575,582 $25,756 $18,029 $12,878 $7,727 $5,151 $2,576Garvin City $274,521 $2,745 $1,922 $1,373 $824 $549 $275IDA1-Forest Grove $1,884,807 $18,848 $13,194 $9,424 $5,654 $3,770 $1,885D-23 Glover $1,967,854 $19,679 $13,775 $9,839 $5,904 $3,936 $1,968D-37 Denison $3,094,506 $30,945 $21,662 $15,473 $9,284 $6,189 $3,095IDA37-Denison $3,058,194 $30,582 $21,407 $15,291 $9,175 $6,116 $3,058D-72 Holly Creek $2,457,189 $24,572 $17,200 $12,286 $7,372 $4,914 $2,457BB-9-Lukfata $3,316 $33 $23 $17 $10 $7 $3D-9 Lukfata $5,434,928 $54,349 $38,044 $27,175 $16,305 $10,870 $5,435I-11 Valiant $58,635,694 $586,357 $410,450 $293,178 $175,907 $117,271 $58,636Millerton City $626,603 $6,266 $4,386 $3,133 $1,880 $1,253 $627Valiant City $3,564,727 $35,647 $24,953 $17,824 $10,694 $7,129 $3,565I-13 EagleTown $5,051,512 $50,515 $35,361 $25,258 $15,155 $10,103 $5,0521-14 Smithville $4,208,498 $42,085 $29,459 $21,042 $12,625 $8,417 $4,208Smithville City $21,494 $215 $150 $107 $64 $43 $21I-39 WrightCity $4,802,957 $48,030 $33,621 $24,015 $14,409 $9,606 $4,803Wright City $918,306 $9,183 $6,428 $4,592 $2,755 $1,837 $918I-5 Idabel $4,107,757 $41,078 $28,754 $20,539 $12,323 $8,216 $4,108IDA5-Idabel CTY $17,700,525 $177,005 $123,904 $88,503 $53,102 $35,401 $17,701Haworth City $318,123 $3,181 $2,227 $1,591 $954 $636 $318I-6 Haworth $6,332,199 $63,322 $44,325 $31,661 $18,997 $12,664 $6,332I-71 Battiest $6,910,749 $69,107 $48,375 $34,554 $20,732 $13,821 $6,911BB-74 Broken Bow City $13,815,290 $138,153 $96,707 $69,076 $41,446 $27,631 $13,815I-74 Broken Bow $21,936,806 $219,368 $153,558 $109,684 $65,810 $43,874 $21,937
McCurtain County Totals $169,702,137 $1,697,021 $1,187,914 $848,513 $509,108 $339,404 $169,704
McCurtain CountyEstimated Revenues - Ad Valorem (Property) Taxes - Mills for Special Taxation Districts
Section A, Table 17
SOURCE: McCurtain County Assessor's Office, Assessor's Report to Excise Board, July 2011.
A-17

B. BEHAVORIAL DATA

Payne
Pittsburg
Pontotoc
Pottawatomie
Pushmataha
Roger Mills
Rogers
Sequoyah
Stephens
Texas
Tillman
Tulsa Wagoner
Washita
Woods
Woodward
Adair
Alfalfa
Atoka
Beaver
Beckham
Blaine
Bryan
Caddo
Canadian
Carter
Cherokee
Choctaw
Cimarron
Cleveland
Coal Comanche
Cotton
Craig
Creek
Custer
Delaware
Dewey
Ellis Garfield
Garvin
Grady
Grant
Greer
Harmon
Harper
Haskell Hughes
Jackson
Jefferson Johnston
Kay
Kingfisher
Kiowa Latimer Le Flore
Lincoln Logan
Love
McClain
McCurtain
McIntosh
Major
Marshall
Mayes
Murray
Muskogee
Noble
Nowata
Okfuskee Oklahoma Okmulgee
Osage
Ottawa
Pawnee
Seminole
Washington
16.8
12.1 11.6
Table 2. Poverty Rates for Oklahoma Counties and the State of Oklahoma, 2010
SOURCE: United States Census Bureau (www.census.gov [August 2012]).
Lower than 12%
12.0%-15.9%
16.0%-19.9%
20.0%-23.9%
24% and higher
17.7 11.5
16.2 17.6
13.9 15.1
12.4 15.7
12.8
17.5
14.3 16.5 16.5
15.6 15.9 20.5
22.8 18.1
22.0 14.1
17.5 13.2
19.9
21.6
15.3 17.7
23.7 21.9 26.9
16.9
25.9
17.4
15.6
11.9
9.3
16.4
15.5
21.6
14.3
17.6
21.7
14.2
13.5 11.3
18.5
16.3
24.1
15.6
27.3
18.8
21.4
25.9
18.0
15.1
18.4 22.7
15.6
22.1
17.1 17.9
21.7
25.5
23.9
23.9
22.3 17.8
17.5 20.0
11.5
19.7 20.6
26.5 15.8
9.8 13.7

Section B, Table 1 Economic Distress Indicators
For McCurtain County and the State of Oklahoma
McCurtain County State of Oklahoma 2007 2008 2009 2010 2007 2008 2009 2010
Persons in Poverty Number 8,291 8,436 8,839 7,812 552,915 554,237 575,711 613,067 Percent of People in Poverty* 25.2% 25.6% 27.0% 23.9% 15.8% 15.7% 16.1% 16.8% County Ranking (1 = Most Favorable) 40 39 21 46 -- -- -- -- Children < 18 in Poverty Number 2,925 3,136 3,231 2,850 196,160 195,823 199,277 223,349 Percent of Children in Poverty* 34.3% 36.7% 37.3% 33.6% 22.2% 22.0% 22.1% 24.4 County Ranking (1 = Most Favorable) 48 75 76 68 -- -- --
SOURCE: U.S. Census Bureau (www.census.gov). *Poverty is measured by using 48 thresholds that vary by family size and number of children within the family and age of householder. To determine whether a person is in poverty, one compares the total income of that person’s family with the threshold appropriate for that family. If the total income is less than the threshold, then the person is considered in poverty, together with every member of his or her family. Institutionalized people, people in military quarters, people living in college dormitories, and unrelated individuals less than 15 years old are excluded from the calculation of poverty rates.
B-1

Section B, Table 2 Assistance Programs
For McCurtain County and the State of Oklahoma
McCurtain County State of Oklahoma 2009 2010 2011 2009 2010 2011
TANF (Monthly Averages) Total Cases 146 151 151 8,756 9,760 9,371Total Persons Receiving TANF 319 344 92 19,092 22,131 21,406 Rate per 1,000 Population 9.5 10.3 2.8 5.2 6.0 5.7Total Children Receiving TANF 267 283 70 15,831 17,832 17,317 Rate per 1,000 Children 29.9 32.1 8.1 17.4 19.4 18.6
SNAP (Monthly Averages) Total Unduplicated Cases 5,186 5,685 1,498 188,635 241,326 268,988Payments per Case $235 $272 $277 $253 $298 $291No. of Persons 8,053 9,146 2,465 445,364 559,626 609,723 Rate per 1,000 Population 240.5 274.1 74.4 122.2 151.8 162.5 Medicaid (Monthly Averages) Total Medicaid Cases 6,310 1,998 NA 383,178 413,097 NATotal Persons Receiving Medicaid 9,749 3,243 NA 620,285 678,868 NA Rate per 1,000 Population 291.1 97.2 NA 170.3 184.1 NA Total Children Receiving Medicaid 5,927 6,170 NA 398,902 439,359 NA Rate per 1,000 Children 663.0 700.1 NA 440.3 478.2 NA Age 5 and Under 2,186 2,266 NA 169,685 185,379 NA Rate per 1,000 Children 244.5 257.1 NA 187.3 201.8 NA Age 6-12 2,255 2,335 NA 145,697 163,913 NA Rate per 1,000 Children 252.3 264.9 NA 161.9 178.4 NA Age 13-17 1,486 1,569 NA 82,520 90,067 NA Rate per 1,000 Children 166.2 178.0 NA 91.1 98.0 NA SOURCE: Oklahoma Department of Human Services, Facts and Figures (www.okdhs.org) U.S. Census Bureau, Population Estimates (www.census.gov). NA = Not Available
B-2

Section B, Table 3 Elderly Support Services
For McCurtain County and the State of Oklahoma
For McCurtain County State of Oklahoma 2005 2006 2007 2005 2006 2007
Medicare Persons Receiving Medicare 5,759 5,927 6,135 529,370 548,027 563,034 Percent of Total Population 17.2% 17.7% 18.3% 14.9% 15.3% 15.6% 2009 2010 2011 2009 2010 2011 Medicaid > 65 Total Persons Receiving > 65 1,169 1,150 NA 55,366 55,623 NA Percent of Population > 65 24.0% 23.5% NA 11.3% 11.2% NA Food Services Congregate Meals 55,519 45,744 14,278 2,083,247 1,821,353 1,878,973Meals Served at Home 22,951 16,579 17,725 1,819,750 1,401,105 1,451,480 Total Meals Served 78,470 62,323 32,003 3,902,997 3,222,458 3,330,453 Rate per Person > 65 16.1 12.8 6.2 8.0 6.5 6.6 Adult Day Care Total Persons Served 0 NA NA 1,272 NA NATotal Facilities NA NA 0 NA NA 42
SOURCE: Oklahoma Department of Human Services, Facts and Figures (www.okdhs.org); Center for Medicare and Medicaid Services (www.cms.hhs.gov); Oklahoma State Department of Health (www.ok.gov/health); U.S. Census Bureau (www.census.gov). NA = Not Available
B-3

Section B, Table 4 Child Abuse and Child Deaths
For McCurtain County and the State of Oklahoma
McCurtain County State of Oklahoma 2003-
2005 2006-2008
2009-20111
2003-2005
2006-2008
2009-20111
Child Abuse and Neglect No. of Confirmed Cases 222 112 55 38,646 38,677 8,110 Rate per 1,000 Children 14.5 3.9 2.0 17.09 12.91 8.7 County Ranking (1 = Most Favorable)
74 3 3 -- -- --
Child Deaths Ages 1-4 2 1 2 250 271 259Ages 5-9 4 1 2 147 155 138Ages 10-14 4 1 0 153 175 158 Total Ages 1-14 10 3 4 550
601 555
Child Death Rates Ages 1-14 0.9 0.1 0.2 0.32 0.27 0.24 County Ranking (1 = Most Favorable)
73 21 30 -- -- --
SOURCE: Oklahoma State Department of Health, OK2SHARE (www.ok.gov/health). 12010 and 2011 data are preliminary. NA = Not Available
B-4

Section B, Table 5 Infant Mortality
For McCurtain County and the State of Oklahoma1
McCurtain County State of Oklahoma 2003-2005 2006-2008 2009-2011 2003-2005 2006-2008 2009-2011 Total Infant Mortality Total Infant Deaths 13 12 17 1,215 1,301 1,194 Rate per 1,000 Live Births 9.3 7.9 13.4 7.9 7.9 7.7County Ranking (1 = Most Favorable)
58 42 71 -- -- --
Neonatal Mortality Total Neonatal Deaths 9 5 13 707 750 689 Rate per 1,000 Live Births 6.4 3.3 10.2 4.6 4.6 4.4
Post-Neonatal Mortality Total Post-Neonatal Mortality 4 7 4 508 551 505 Rate per 1,000 Live Births 2.9 4.6 3.2 3.3 3.4 3.2
SOURCE: Oklahoma State Department of Health, OK2SHARE (www.ok.gov/health). 12010 and 2011 data are preliminary.
B-5

Section B, Table 6 Births by Age of Mother, Birth Weights, and Mother’s Marital Status1
For McCurtain County and the State of Oklahoma
2009 2010 2011 2009 2010 2011 No. % No. % No. % No. % No. % No. % Births by Age of Mother Ages 10-14 * NA * NA * NA 91 0.2% 98 0.2% 62 0.1% Ages 15-17 19 4.3% 25 6.1% 30 7.3% 2,169 4.1% 1,881 3.6% 1,653 3.2% Ages 18-19 68 15.5% 68 16.5% 46 11.1% 5,115 9.6% 4,474 8.6% 4,233 8.3% Ages 20-24 196 44.6% 178 43.1% 190 45.9% 16,457 30.9% 15,892 30.6% 15,434 30.3% Ages 25-29 103 23.5% 90 21.8% 90 21.7% 15,891 29.9% 15,548 30.0% 15,415 30.3% Ages 30-34 29 6.6% 33 8.0% 43 10.4% 9,031 17.0% 9,566 18.4% 9,532 18.7% Ages 35-39 22 5.0% 13 3.2% 10 2.4% 3,710 7.0% 3,613 7.0% 3,751 7.4% Ages 40-44 * NA 5 1.2% * NA 689 1.3% 768 1.5% 773 1.5% Ages 45-54 * NA * NA * NA 49 0.1% 39 0.1% 32 0.1% Total Births 439 100.0% 413 100.0% 414 100.0% 53,202 100.0% 51,879 100.0% 50,885 100.0% Total births < Age 20 87 19.8% 94 22.8% 78 18.8% 7,735 13.9% 6,453 12.4% 5,948 11.7% Low Weight Births Low Birth Weight2 30 6.8% 35 8.5% 32 7.7% 3,662 6.9% 3,595 6.9% 3,565 7.0% Very Low Birth Weight3 9 2.1% 7 1.7% 10 2.4% 785 1.5% 730 1.4% 731 1.4% % of Births to Single Women 262 59.7% 249 60.3% 271 65.5% 22,421 42.1% 21,732 41.9% 21,359 42.0%
SOURCE: Oklahoma State Department of Health, OK2SHARE (www.ok.gov/health). 1All data are preliminary. 2Low birth weight is defined as 1500 to 2499 grams. 3Very low birth weight is defined as less than 1500 grams. NA = Not Available *Calculations have been suppressed due to small cell size (less than 5 births/populations less than 20).
B-6

Section B, Table 7 Resident Live Births by Mother’s Race and Level of Education1
For McCurtain County and the State of Oklahoma
McCurtain County State of Oklahoma 2009 2010 2011 2009 2010 2011 No. % No. % No. % No. % No. % No. % Mother’s Race White 254 57.9% 240 58.1% 226 54.6% 40,145 77.5% 39,079 73.8% 38,205 75.1% Black 47 10.7% 47 11.4% 43 10.4% 5,359 10.1% 5,120 10.5% 5,122 10.1% Native American2 137 31.2% 120 29.1% 120 29.0% 6,310 11.9% 6,320 12.9% 6,068 11.9% Other3 * NA 6 6.0% 25 6.0% 1,366 2.6% 1,355 2.8% 1,490 2.9% Unknown 1 0.2% 0 0.0% 0 0.0% 0 0.0% 0 0.0% 0 0.0%
Total Births 439 100.0% 413 100.0% 414 100.0% 53,180 100.0% 48,874 100.0% 50,885 100.0%
Hispanic4 30 6.8% 31 7.5% 25 6.0% 7,197 13.5% 6,897 13.3% 6,641 13.1%
Maternal Level of Education <12 Grades 97 22.1% 124 30.0% 95 22.9% 12,057 22.7% 11,231 21.6% 10,321 20.3% >12 Grades 341 77.7% 289 70.0% 316 76.3% 40,904 76.9% 40,517 78.1% 40,429 79.5%
SOURCE: Oklahoma State Department of Health, OK2SHARE (www.ok.gov/health). 1All data are preliminary. 2Native American includes American Indians and Alaska Natives. 3Other is defined as Asian Pacific Islanders. 4Hispanic population is not a race group, but rather a description of ethnic origin. Hispanics are included in all other race groups. NA = Not Available *Calculations have been suppressed due to small cell size (less than 5 births/populations less than 20).
B-7
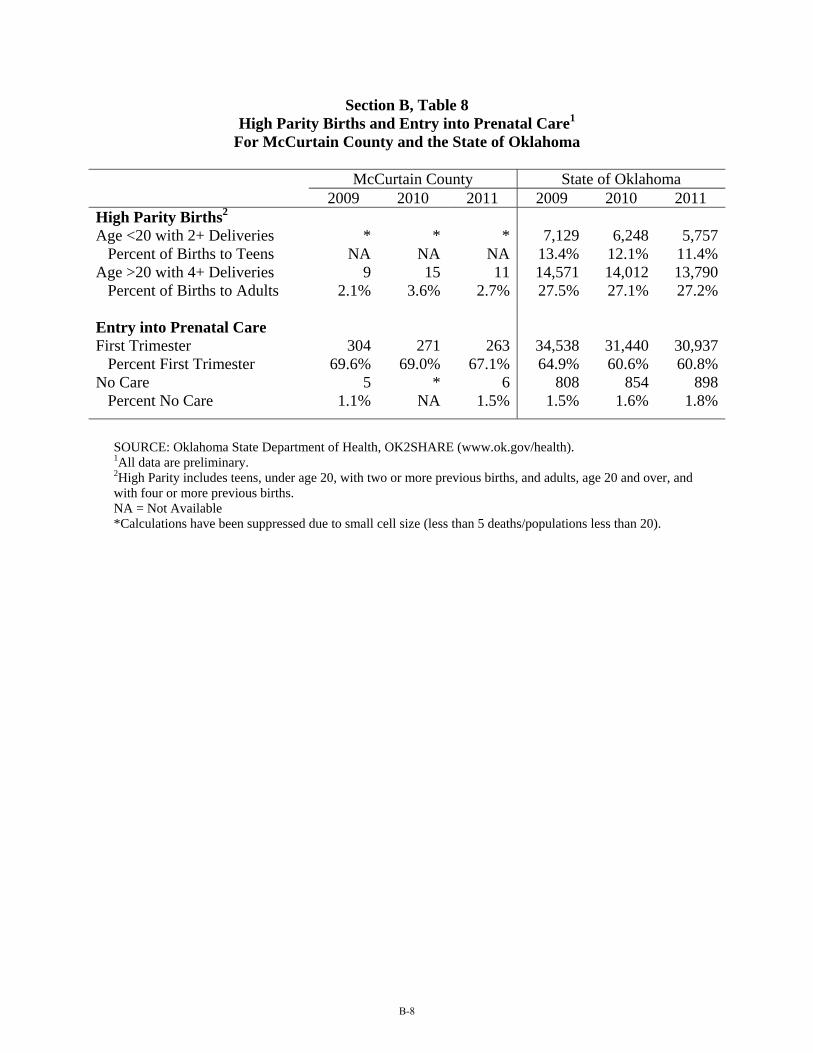
Section B, Table 8 High Parity Births and Entry into Prenatal Care1
For McCurtain County and the State of Oklahoma
McCurtain County State of Oklahoma 2009 2010 2011 2009 2010 2011 High Parity Births2 Age <20 with 2+ Deliveries * * * 7,129 6,248 5,757 Percent of Births to Teens NA NA NA 13.4% 12.1% 11.4%Age >20 with 4+ Deliveries 9 15 11 14,571 14,012 13,790 Percent of Births to Adults 2.1% 3.6% 2.7% 27.5% 27.1% 27.2% Entry into Prenatal Care First Trimester 304 271 263 34,538 31,440 30,937
Percent First Trimester 69.6% 69.0% 67.1% 64.9% 60.6% 60.8%No Care 5 * 6 808 854 898
Percent No Care 1.1% NA 1.5% 1.5% 1.6% 1.8%
SOURCE: Oklahoma State Department of Health, OK2SHARE (www.ok.gov/health). 1All data are preliminary. 2High Parity includes teens, under age 20, with two or more previous births, and adults, age 20 and over, and with four or more previous births. NA = Not Available *Calculations have been suppressed due to small cell size (less than 5 deaths/populations less than 20).
B-8

Section B, Table 9 Leading Causes of Death in 20101 by County of Residence
For McCurtain County, the State of Oklahoma, and the United States
McCurtain County State of Oklahoma1 United States1
Leading Causes DeathsRate
per 1,000 Rank Deaths Rate
per 1,000 Rank Deaths Rate
per 1,000 Rank
Diseases of heart 78 2.4 1 7,811 2.1 1 595,444 1.9 1Malignant neoplasms 65 2.0 2 6,514 1.7 2 573,855 1.9 2Missing 37 1.1 3 586 0.2 9 NA NA NAAccidents (unintentional injuries) 24 0.7 4 1,621 0.4 5 118,043 0.4 5Chronic lower respiratory diseases 20 0.6 5 2,322 0.6 3 137,789 0.4 3Alzheimer's disease 13 0.4 6 879 0.2 7 83,308 0.3 6Diabetes mellitus 10 0.3 7 913 0.2 6 68,905 0.2 7Cerebrovascular diseases 10 0.3 8 1,646 0.4 4 129,180 0.4 4Atherosclerosis 9 0.3 9 0 0.0 0 NA NA NAIntentional self-harm (suicide) 7 0.2 10 484 0.1 10 37,793 0.1 10
SOURCE: Oklahoma State Department of Health, OK2SHARE (www.health.state.ok.us); Center for Disease Control and Prevention, National Vital Statistics Report (www.cdc.gov); U.S. Census Bureau, Population Estimates (www.census.gov). 12010 data for the United States and the State of Oklahoma are preliminary data. N/A = Not Applicable due to some counties having less than 10 rankable causes of death. NA = Not Available.
B-9

Section B, Table 10 Total Number of Mental Health Clients Treated by ODMHSAS1
For McCurtain County and the State of Oklahoma
McCurtain County State of Oklahoma 2008 2009 2010 2008 2009 2010 No. % No. % No. % No. % No. % No. %
Total2 388 100.0% 368 100.0% 337 100.0% 53,226 100.0% 59,493 100.0% 60,135 100.0% Sex Female 195 50.3% 186 50.5% 164 48.7% 28,603 53.7% 31,771 53.4% 32,399 53.9% Male 193 49.7% 182 49.5% 173 51.3% 24,663 46.3% 27,722 46.6% 27,736 46.1% Age 0-6 2 0.5% 1 0.3% 0 0.0% 1,058 2.0% 1,251 2.1% 832 1.4% 7-12 10 2.6% 6 1.6% 6 1.8% 2,840 5.3% 3,167 5.3% 2,740 4.6% 13-17 8 2.1% 9 2.4% 12 3.6% 3,194 6.0% 3,676 6.2% 3,564 5.9% 18-24 41 10.6% 43 11.7% 36 10.7% 6,599 12.4% 7,547 12.7% 7,366 12.2% 25-64 323 83.2% 305 82.9% 279 82.8% 38,748 72.7% 42,917 72.1% 44,578 74.1% 65+ 4 1.0% 4 1.1% 4 1.2% 827 1.6% 935 1.6% 1,055 1.8% Race3 White 304 78.4% 279 75.8% 248 73.6% 41,816 78.5% 46,466 78.1% 46,509 77.3% Black 53 13.7% 57 15.5% 54 16.0% 6,474 12.2% 7,208 12.1% 7,190 12.0% Native American 25 6.4% 22 6.0% 28 8.3% 3,108 5.8% 3,483 5.9% 3,625 6.0% Asian 1 0.3% 1 0.3% 0 0.0% 238 0.4% 291 0.5% 266 0.4% Hawaiian Pacific Islander 0 0.0% 0 0.0% 1 0.3% 83 0.2% 107 0.2% 109 0.2% Two or More 5 1.3% 9 2.4% 6 1.8% 1,547 2.9% 1,938 3.3% 2,436 4.1% Other 0 0.0% 0 0.0% 0 0.0% 0 0.0% 0 0.0% 0 0.0%
SOURCE: Oklahoma Department of Mental Health and Substance Abuse Service (www.ok.gov/odmhsas). 1The agencies represented are only those that are funded by DMHSAS, either a state-operated facility or a private, nonprofit which contracts with DMHSAS. 2Persons are only counted once each year regardless of how many times they receive treatment (unduplicated count). Persons must be admitted to a DMHSAS-funded agency and have received a service during the year. 3Due to reporting errors, total cases by race are slightly different from total cases.
B-10
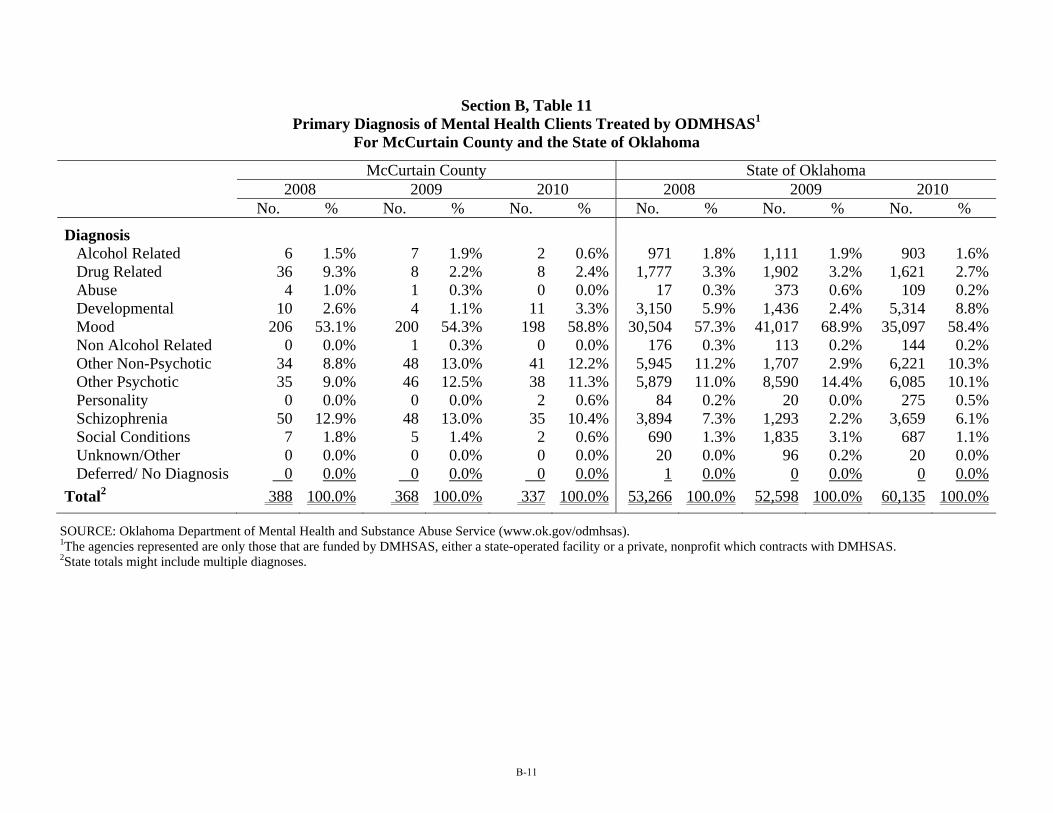
Section B, Table 11 Primary Diagnosis of Mental Health Clients Treated by ODMHSAS1
For McCurtain County and the State of Oklahoma
McCurtain County State of Oklahoma 2008 2009 2010 2008 2009 2010 No. % No. % No. % No. % No. % No. %
Diagnosis Alcohol Related 6 1.5% 7 1.9% 2 0.6% 971 1.8% 1,111 1.9% 903 1.6% Drug Related 36 9.3% 8 2.2% 8 2.4% 1,777 3.3% 1,902 3.2% 1,621 2.7% Abuse 4 1.0% 1 0.3% 0 0.0% 17 0.3% 373 0.6% 109 0.2% Developmental 10 2.6% 4 1.1% 11 3.3% 3,150 5.9% 1,436 2.4% 5,314 8.8% Mood 206 53.1% 200 54.3% 198 58.8% 30,504 57.3% 41,017 68.9% 35,097 58.4% Non Alcohol Related 0 0.0% 1 0.3% 0 0.0% 176 0.3% 113 0.2% 144 0.2% Other Non-Psychotic 34 8.8% 48 13.0% 41 12.2% 5,945 11.2% 1,707 2.9% 6,221 10.3% Other Psychotic 35 9.0% 46 12.5% 38 11.3% 5,879 11.0% 8,590 14.4% 6,085 10.1% Personality 0 0.0% 0 0.0% 2 0.6% 84 0.2% 20 0.0% 275 0.5% Schizophrenia 50 12.9% 48 13.0% 35 10.4% 3,894 7.3% 1,293 2.2% 3,659 6.1% Social Conditions 7 1.8% 5 1.4% 2 0.6% 690 1.3% 1,835 3.1% 687 1.1% Unknown/Other 0 0.0% 0 0.0% 0 0.0% 20 0.0% 96 0.2% 20 0.0% Deferred/ No Diagnosis 0 0.0% 0 0.0% 0 0.0% 1 0.0% 0 0.0% 0 0.0% Total2 388 100.0% 368 100.0% 337 100.0% 53,266 100.0% 52,598 100.0% 60,135 100.0%
SOURCE: Oklahoma Department of Mental Health and Substance Abuse Service (www.ok.gov/odmhsas). 1The agencies represented are only those that are funded by DMHSAS, either a state-operated facility or a private, nonprofit which contracts with DMHSAS. 2State totals might include multiple diagnoses.
B-11
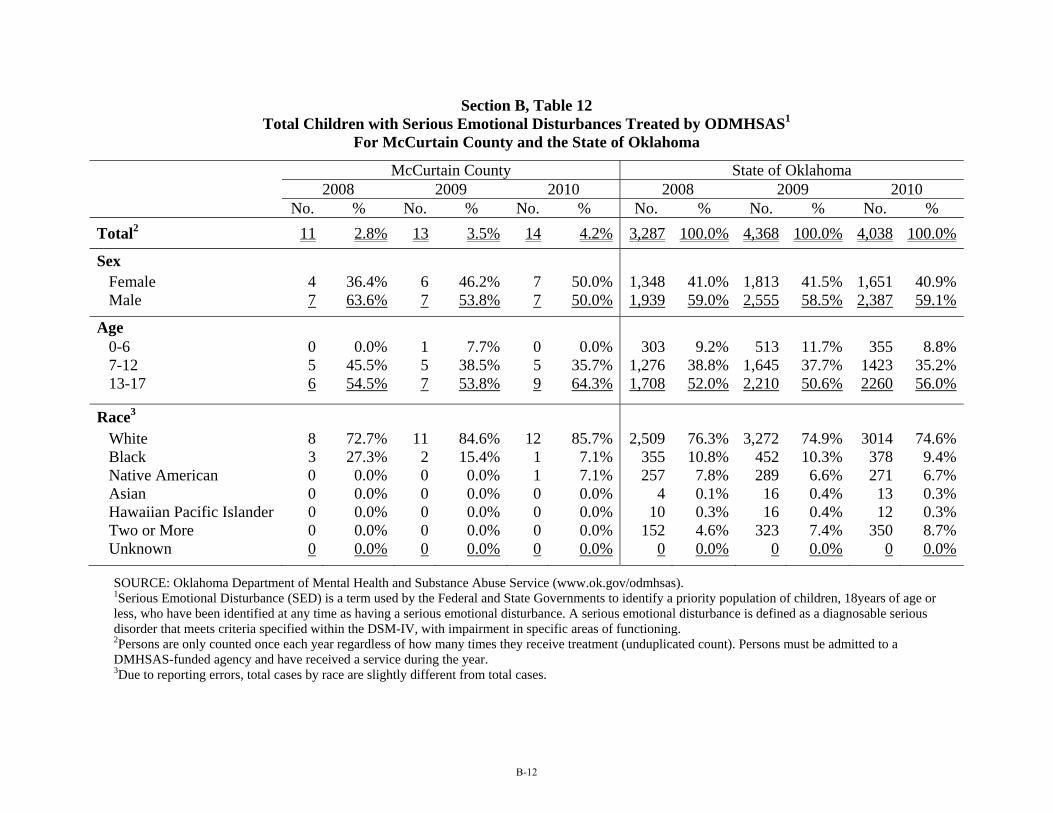
Section B, Table 12 Total Children with Serious Emotional Disturbances Treated by ODMHSAS1
For McCurtain County and the State of Oklahoma
McCurtain County State of Oklahoma 2008 2009 2010 2008 2009 2010 No. % No. % No. % No. % No. % No. % Total2 11 2.8% 13 3.5% 14 4.2% 3,287 100.0% 4,368 100.0% 4,038 100.0%
Sex Female 4 36.4% 6 46.2% 7 50.0% 1,348 41.0% 1,813 41.5% 1,651 40.9% Male 7 63.6% 7 53.8% 7 50.0% 1,939 59.0% 2,555 58.5% 2,387 59.1%
Age 0-6 0 0.0% 1 7.7% 0 0.0% 303 9.2% 513 11.7% 355 8.8% 7-12 5 45.5% 5 38.5% 5 35.7% 1,276 38.8% 1,645 37.7% 1423 35.2% 13-17 6 54.5% 7 53.8% 9 64.3% 1,708 52.0% 2,210 50.6% 2260 56.0%
Race3 White 8 72.7% 11 84.6% 12 85.7% 2,509 76.3% 3,272 74.9% 3014 74.6% Black 3 27.3% 2 15.4% 1 7.1% 355 10.8% 452 10.3% 378 9.4% Native American 0 0.0% 0 0.0% 1 7.1% 257 7.8% 289 6.6% 271 6.7% Asian 0 0.0% 0 0.0% 0 0.0% 4 0.1% 16 0.4% 13 0.3% Hawaiian Pacific Islander 0 0.0% 0 0.0% 0 0.0% 10 0.3% 16 0.4% 12 0.3% Two or More 0 0.0% 0 0.0% 0 0.0% 152 4.6% 323 7.4% 350 8.7% Unknown 0 0.0% 0 0.0% 0 0.0% 0 0.0% 0 0.0% 0 0.0%
SOURCE: Oklahoma Department of Mental Health and Substance Abuse Service (www.ok.gov/odmhsas). 1Serious Emotional Disturbance (SED) is a term used by the Federal and State Governments to identify a priority population of children, 18years of age or less, who have been identified at any time as having a serious emotional disturbance. A serious emotional disturbance is defined as a diagnosable serious disorder that meets criteria specified within the DSM-IV, with impairment in specific areas of functioning. 2Persons are only counted once each year regardless of how many times they receive treatment (unduplicated count). Persons must be admitted to a DMHSAS-funded agency and have received a service during the year. 3Due to reporting errors, total cases by race are slightly different from total cases.
B-12
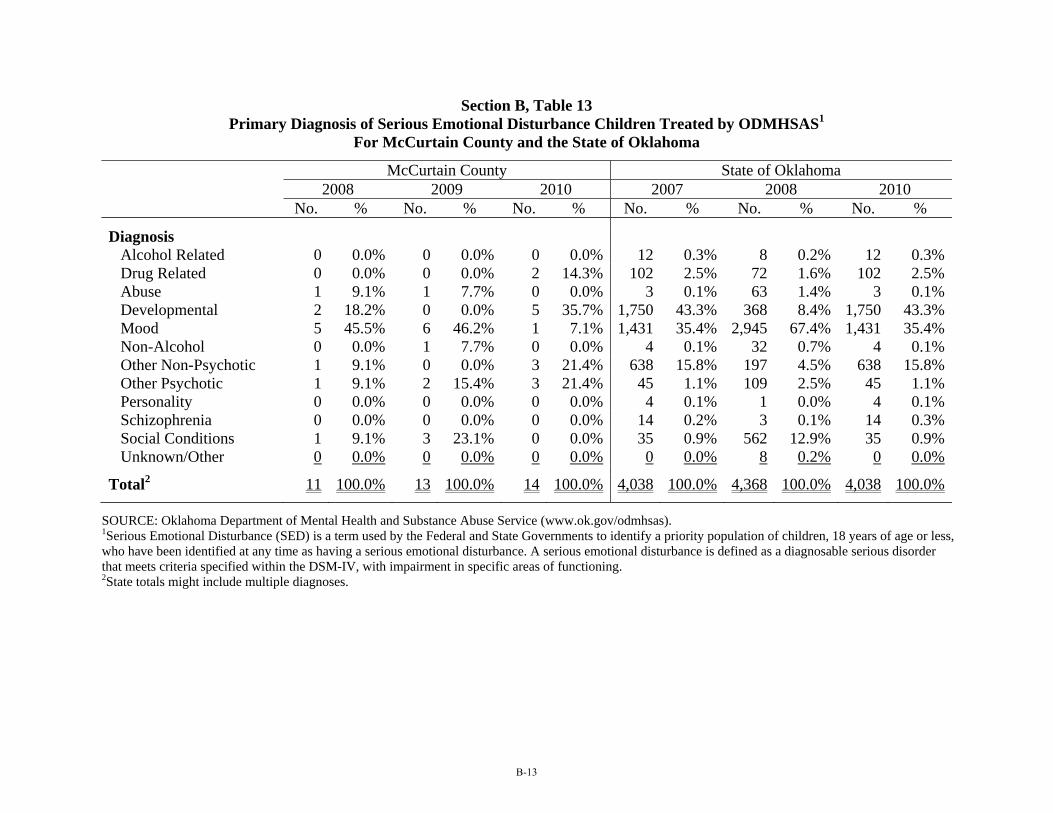
Section B, Table 13 Primary Diagnosis of Serious Emotional Disturbance Children Treated by ODMHSAS1
For McCurtain County and the State of Oklahoma
McCurtain County State of Oklahoma 2008 2009 2010 2007 2008 2010 No. % No. % No. % No. % No. % No. %
Diagnosis Alcohol Related 0 0.0% 0 0.0% 0 0.0% 12 0.3% 8 0.2% 12 0.3% Drug Related 0 0.0% 0 0.0% 2 14.3% 102 2.5% 72 1.6% 102 2.5% Abuse 1 9.1% 1 7.7% 0 0.0% 3 0.1% 63 1.4% 3 0.1% Developmental 2 18.2% 0 0.0% 5 35.7% 1,750 43.3% 368 8.4% 1,750 43.3% Mood 5 45.5% 6 46.2% 1 7.1% 1,431 35.4% 2,945 67.4% 1,431 35.4% Non-Alcohol 0 0.0% 1 7.7% 0 0.0% 4 0.1% 32 0.7% 4 0.1% Other Non-Psychotic 1 9.1% 0 0.0% 3 21.4% 638 15.8% 197 4.5% 638 15.8% Other Psychotic 1 9.1% 2 15.4% 3 21.4% 45 1.1% 109 2.5% 45 1.1% Personality 0 0.0% 0 0.0% 0 0.0% 4 0.1% 1 0.0% 4 0.1% Schizophrenia 0 0.0% 0 0.0% 0 0.0% 14 0.2% 3 0.1% 14 0.3% Social Conditions 1 9.1% 3 23.1% 0 0.0% 35 0.9% 562 12.9% 35 0.9% Unknown/Other 0 0.0% 0 0.0% 0 0.0% 0 0.0% 8 0.2% 0 0.0%
Total2 11 100.0% 13 100.0% 14 100.0% 4,038 100.0% 4,368 100.0% 4,038 100.0%
SOURCE: Oklahoma Department of Mental Health and Substance Abuse Service (www.ok.gov/odmhsas). 1Serious Emotional Disturbance (SED) is a term used by the Federal and State Governments to identify a priority population of children, 18 years of age or less, who have been identified at any time as having a serious emotional disturbance. A serious emotional disturbance is defined as a diagnosable serious disorder that meets criteria specified within the DSM-IV, with impairment in specific areas of functioning. 2State totals might include multiple diagnoses.
B-13

Section B, Table 14 Total Adults with Serious Mental Illness Treated by ODMHSAS1
For McCurtain County and the State of Oklahoma
McCurtain County State of Oklahoma 2008 2009 2010 2008 2009 2010 No. % No. % No. % No. % No. % No. % Total2 174 44.8% 192 52.3% 200 59.3% 40,911 100.0% 45,457 100.0% 46,634 100.0%Sex Female 93 53.4% 101 52.6% 103 51.5% 22,520 55.0% 24,940 54.9% 25,701 55.1% Male 81 46.6% 91 47.4% 97 48.5% 18,391 45.0% 20,517 45.1% 20,933 44.9%Age 18-24 13 7.5% 18 9.4% 19 9.5% 5,347 13.1% 6,110 13.4% 5,728 12.3% 25-64 158 90.8% 170 88.5% 177 88.5% 34,821 85.1% 38,494 84.7% 39,931 85.6% 65+ 3 1.7% 4 2.1% 4 2.0% 743 1.8% 853 1.9% 975 2.1%Race3 White 135 77.6% 142 74.0% 146 73.0% 32,137 78.6% 35,512 78.1% 36,166 77.6% Black 23 13.2% 34 17.7% 34 17.0% 5,188 12.7% 5,838 12.8% 5,915 12.7% Native American 11 6.3% 10 5.2% 17 8.5% 2,250 5.5% 2,510 5.5% 2,648 5.7% Asian 1 0.6% 1 0.5% 0 0.0% 196 0.5% 246 0.5% 213 0.5% Hawaiian Pacific Islander 0 0.0% 0 0.0% 0 0.0% 54 0.1% 74 0.2% 78 0.2% Two or More 4 2.3% 5 2.6% 3 1.5% 1,086 2.7% 1,277 2.8% 1,614 3.5% Unknown 0 0.0% 0 0.0% 0 0.0% 0 0.0% 0 0.0% 0 0.0%
SOURCE: Oklahoma Department of Mental Health and Substance Abuse Service (www.ok.gov/odmhsas). 1Serious Mental Illness (SMI) is a term used by the Federal and State Governments to identify a priority population of persons, 18 years or older, who have been identified at any time as having a serious mental illness. A serious mental illness is defined as a diagnosable mental, behavioral, or emotional disorder of sufficient duration that meets criteria specified within the DSM-IV, with impairment in specific areas of functioning. 2Persons are only counted once each year regardless of how many times they receive treatment (unduplicated count). Persons must be admitted to a DMHSAS-funded agency and have received a service during the year. 3Due to reporting errors, total cases by race may be slightly different from total cases.
B-14

Section B, Table 15 Primary Diagnosis of Serious Mental Illness Persons Treated by ODMHSAS1
For McCurtain County and the State of Oklahoma
McCurtain County State of Oklahoma 2008 2009 2010 2008 2009 2010 No. % No. % No. % No. % No. % No. % Diagnosis Alcohol Related 5 2.9% 3 1.6% 2 0.6% 730 1.8% 812 1.8% 662 1.4% Drug Related 4 2.3% 3 1.6% 6 1.7% 1,271 3.1% 1,286 2.8% 1,096 2.4% Abuse 0 0.0% 0 0.0% 0 0.0% 6 0.0% 57 0.1% 5 0.0% Developmental 6 3.4% 4 2.1% 5 2.3% 693 1.7% 751 1.7% 1,514 3.2% Mood 81 46.6% 94 49.0% 109 50.0% 25,135 61.4% 31,762 69.9% 29,423 63.1% Non-Alcohol 0 0.0% 0 0.0% 0 0.0% 122 0.3% 56 0.1% 112 0.2% Other Non-Psychotic 8 4.6% 17 8.9% 18 8.5% 3,191 7.8% 891 2.0% 3,828 8.2% Other Psychotic 29 16.7% 30 15.6% 26 15.3% 5,681 13.9% 8,097 17.8% 5,868 12.6% Personality 0 0.0% 0 0.0% 2 0.0% 79 0.2% 17 0.0% 241 0.5% Schizophrenia 41 23.6% 41 21.4% 30 21.6% 3,806 9.3% 1,251 2.8% 3,594 7.7% Social Conditions 0 0.0% 0 0.0% 2 0.0% 177 0.4% 422 0.9% 272 0.6% Unknown/Other 0 0.0% 0 0.0% 0 0.0% 19 0.0% 55 0.1% 19 0.0% Deferred/No Diagnosis 0 0.0% 0 0.0% 0 0.0% 1 0.0% 0 0.0% 0 0.0% Total2 174 100.0% 192 100.0% 200 100.0% 40,911 100.0% 45,457 100.0% 46,634 100.0%
SOURCE: Oklahoma Department of Mental Health and Substance Abuse Service (www.ok.gov/odmhsas). 1Serious Mental Illness (SMI) is a term used by the Federal and State Governments to identify a priority population of persons, 18years or older, who have been identified at any time as having a serious mental illness. A serious mental illness is defined as a diagnosable mental, behavioral, or emotional disorder of sufficient duration that meets criteria specified within the DSM-IV, with impairment in specific areas of functioning. 2State totals may include multiple diagnoses.
B-15
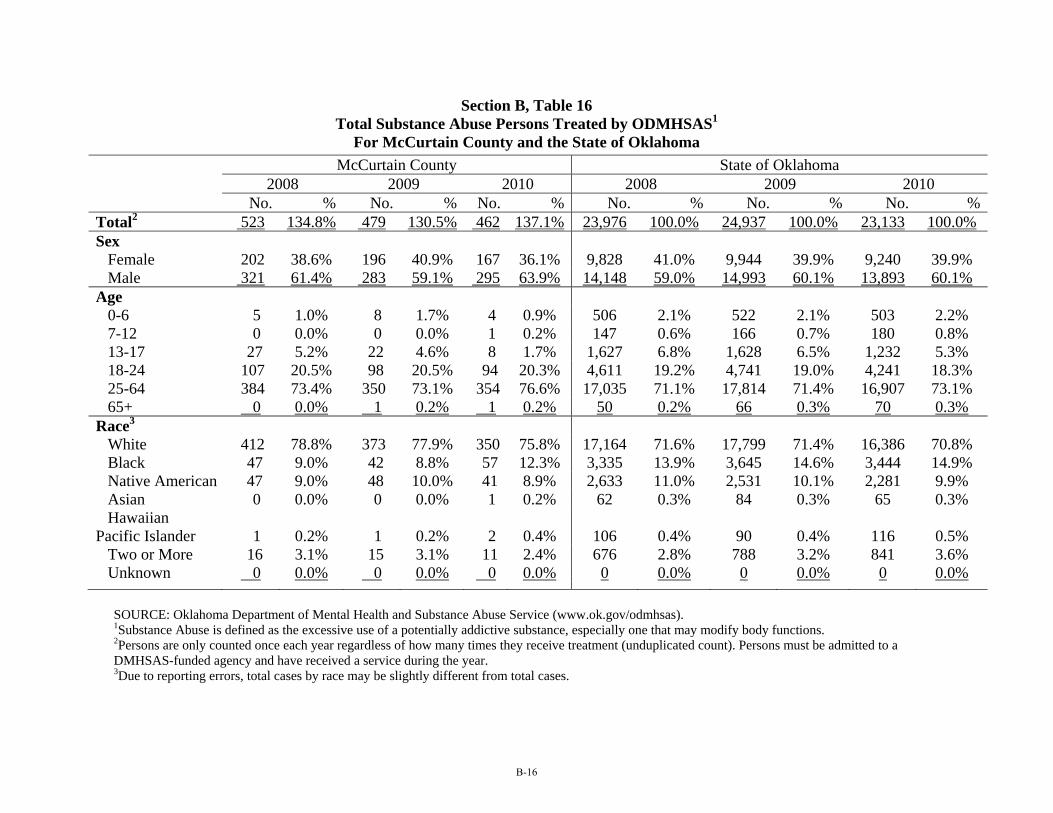
Section B, Table 16 Total Substance Abuse Persons Treated by ODMHSAS1
For McCurtain County and the State of Oklahoma
SOURCE: Oklahoma Department of Mental Health and Substance Abuse Service (www.ok.gov/odmhsas). 1Substance Abuse is defined as the excessive use of a potentially addictive substance, especially one that may modify body functions. 2Persons are only counted once each year regardless of how many times they receive treatment (unduplicated count). Persons must be admitted to a DMHSAS-funded agency and have received a service during the year. 3Due to reporting errors, total cases by race may be slightly different from total cases.
McCurtain County State of Oklahoma 2008 2009 2010 2008 2009 2010 No. % No. % No. % No. % No. % No. %Total2 523 134.8% 479 130.5% 462 137.1% 23,976 100.0% 24,937 100.0% 23,133 100.0% Sex Female 202 38.6% 196 40.9% 167 36.1% 9,828 41.0% 9,944 39.9% 9,240 39.9% Male 321 61.4% 283 59.1% 295 63.9% 14,148 59.0% 14,993 60.1% 13,893 60.1% Age 0-6 5 1.0% 8 1.7% 4 0.9% 506 2.1% 522 2.1% 503 2.2% 7-12 0 0.0% 0 0.0% 1 0.2% 147 0.6% 166 0.7% 180 0.8% 13-17 27 5.2% 22 4.6% 8 1.7% 1,627 6.8% 1,628 6.5% 1,232 5.3% 18-24 107 20.5% 98 20.5% 94 20.3% 4,611 19.2% 4,741 19.0% 4,241 18.3% 25-64 384 73.4% 350 73.1% 354 76.6% 17,035 71.1% 17,814 71.4% 16,907 73.1% 65+ 0 0.0% 1 0.2% 1 0.2% 50 0.2% 66 0.3% 70 0.3% Race3 White 412 78.8% 373 77.9% 350 75.8% 17,164 71.6% 17,799 71.4% 16,386 70.8% Black 47 9.0% 42 8.8% 57 12.3% 3,335 13.9% 3,645 14.6% 3,444 14.9% Native American 47 9.0% 48 10.0% 41 8.9% 2,633 11.0% 2,531 10.1% 2,281 9.9% Asian 0 0.0% 0 0.0% 1 0.2% 62 0.3% 84 0.3% 65 0.3% Hawaiian Pacific Islander 1 0.2% 1 0.2% 2 0.4% 106 0.4% 90 0.4% 116 0.5% Two or More 16 3.1% 15 3.1% 11 2.4% 676 2.8% 788 3.2% 841 3.6% Unknown 0 0.0% 0 0.0% 0 0.0% 0 0.0% 0 0.0% 0 0.0%
B-16

Section B, Table 17 Primary Diagnosis of Substance Abuse Persons Treated by ODMHSAS1
For McCurtain County and the State of Oklahoma
McCurtain County State of Oklahoma 2008 2009 2010 2008 2009 2010 No. % No. % No. % No. % No. % No. %
Diagnosis Alcohol Related 73 14.0% 69 14.4% 73 15.8% 4,532 18.9% 5,292 21.2% 4,728 20.4% Drug Related 414 79.2% 391 81.6% 373 80.7% 15,203 63.4% 17,033 68.3% 14,874 64.3% Abuse Victim 0 0.0% 1 0.2% 0 0.0% 1 0.0% 5 0.0% 0 0.0% Developmental Disorder 2 0.4% 0 0.0% 6 1.3% 1,250 5.2% 72 0.3% 968 4.2% Mood Disorder 15 2.9% 2 0.4% 0 0.0% 1,715 7.2% 1,358 5.4% 1,297 5.6% Non-Alcohol 0 0.0% 0 0.0% 0 0.0% 1 0.0% 1 0.0% 1 0.0% Other Non-Psychotic 5 1.0% 0 0.0% 5 1.1% 377 1.6% 22 0.1% 359 1.6% Other Psychotic 3 0.6% 1 0.2% 0 0.0% 76 0.3% 87 0.3% 78 0.3% Personality Disorder 0 0.0% 0 0.0% 0 0.0% 2 0.0% 0 0.0% 2 0.0% Schizophrenia 4 0.8% 0 0.0% 0 0.0% 51 0.2% 1 0.0% 37 0.2% Social Conditions 6 1.1% 10 2.1% 5 1.1% 733 3.1% 789 3.2% 697 3.0% Unknown/Other 1 0.2% 5 1.0% 0 0.0% 35 0.1% 276 1.1% 92 0.4% Deferred/No Diagnosis 0 0.0% 0 0.0% 0 0.0% 0 0.0% 1 0.0% 0 0.0% Total2 523 100.0% 479 100.0% 462 100.0% 23,976 100.0% 24,937 100.0% 23,133 100.0%
SOURCE: Oklahoma Department of Mental Health and Substance Abuse Service (www.ok.gov/odmhsas). Percentages represent the percent of all occurrences in a particular category. 1Substance Abuse is defined as the excessive use of a potentially addictive substance, especially one that may modify body functions. 2 State totals may include multiple diagnoses
B-17

C. EDUCATION DATA

Section C, Table 1 American College Test (ACT) Scores
For School Districts in McCurtain County
School Year 2008-2009 2009-2010 2010-2011National 21.1 21.0 21.1
State of Oklahoma 20.7 20.7 20.7BATTIEST 17.9 18.0 16.8BROKEN BOW 19.7 19.3 18.8DENISON N/A N/A N/AEAGLETOWN 15.7 15.3 19.5FOREST GROVE N/A N/A N/AGLOVER N/A N/A N/AHAWORTH 17.6 18.8 18.2HOLLY CREEK N/A N/A N/AIDABEL 18.9 19.5 19.8LUKFATA N/A N/A N/ASMITHVILLE 19.7 21.2 17.8VALLIANT 18.2 19.9 18.0WATSON N/A N/A N/AWRIGHT CITY 19.5 19.9 19.0
SOURCE: OK Office of Accountability, District Reports (www.schoolreportcard.org). *School Closed. **Data Protected by Privacy laws (small number of students). N/A = Not Applicable due to no High School in School District. NA = Not Available NR = None Reported
C-1
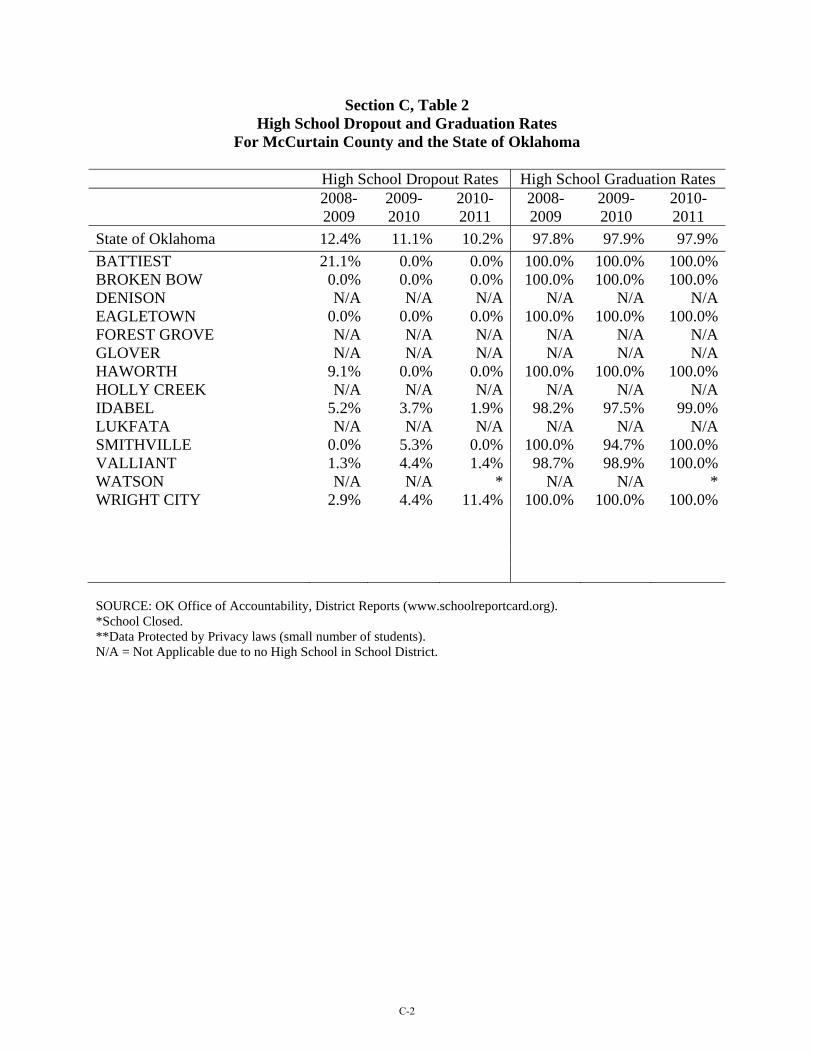
Section C, Table 2 High School Dropout and Graduation Rates
For McCurtain County and the State of Oklahoma
High School Dropout Rates High School Graduation Rates 2008-
2009 2009-2010
2010-2011
2008-2009
2009-2010
2010-2011
State of Oklahoma 12.4% 11.1% 10.2% 97.8% 97.9% 97.9%BATTIEST 21.1% 0.0% 0.0% 100.0% 100.0% 100.0% BROKEN BOW 0.0% 0.0% 0.0% 100.0% 100.0% 100.0% DENISON N/A N/A N/A N/A N/A N/AEAGLETOWN 0.0% 0.0% 0.0% 100.0% 100.0% 100.0% FOREST GROVE N/A N/A N/A N/A N/A N/AGLOVER N/A N/A N/A N/A N/A N/AHAWORTH 9.1% 0.0% 0.0% 100.0% 100.0% 100.0% HOLLY CREEK N/A N/A N/A N/A N/A N/AIDABEL 5.2% 3.7% 1.9% 98.2% 97.5% 99.0% LUKFATA N/A N/A N/A N/A N/A N/ASMITHVILLE 0.0% 5.3% 0.0% 100.0% 94.7% 100.0% VALLIANT 1.3% 4.4% 1.4% 98.7% 98.9% 100.0% WATSON N/A N/A * N/A N/A *WRIGHT CITY 2.9% 4.4% 11.4% 100.0% 100.0% 100.0%
SOURCE: OK Office of Accountability, District Reports (www.schoolreportcard.org). *School Closed. **Data Protected by Privacy laws (small number of students). N/A = Not Applicable due to no High School in School District.
C-2

Section C, Table 3 School Enrollment
For School Districts in McCurtain County and the State of Oklahoma1
2008-2009 2009-2010 2010-2011 3-Year Change from 2008-09 to 2010-11
1-Year Change from 2009-10 to 2010-11
State of Oklahoma 637,762 646,704 656,251 0.8% 0.6%
BATTIEST 251 259 254 1.2% -1.9%BROKEN BOW 1,785 1,749 1,724 -3.4% -1.4%DENISON 280 293 309 10.4% 5.5%EAGLETOWN 217 230 228 5.1% -0.9%FOREST GROVE 96 126 156 62.5% 23.8%GLOVER 100 92 77 -23.0% -16.3%HAWORTH 586 597 579 -1.2% -3.0%HOLLY CREEK 205 209 205 0.0% -1.9%IDABEL 1,440 1,337 1,350 -6.3% 1.0%LUKFATA 314 319 322 2.5% 0.9%SMITHVILLE 290 292 324 11.7% 11.0%VALLIANT 1,044 1,004 977 -6.4% -2.7%WATSON 51 54 * NA NAWRIGHT CITY 478 473 433 -9.4% -8.5%
SOURCE: OK Office of Accountability, District Reports (www.schoolreportcard.org). 1Represents the average daily enrollment for school districts in the State of Oklahoma. *School Closed. **Data Protected by Privacy laws (small number of students). N/A = Not Applicable NA = Not Available NR = None Reported
C-3

Section C, Table 4 Percent of Students Eligible for Free/Reduced Lunches
For School Districts in McCurtain County and the State of Oklahoma
2008-2009 2009-2010 2010-2011 State of Oklahoma 56.3% 58.9% 60.6%
BATTIEST 80.1% 81.5% 80.7%BROKEN BOW 73.3% 80.1% 74.6%DENISON 57.9% 58.0% 56.6%EAGLETOWN 80.2% 80.0% 80.3%FOREST GROVE 72.9% 73.0% 78.2%GLOVER 71.0% 89.1% 88.3%HAWORTH 77.1% 83.4% 83.4%HOLLY CREEK 75.1% 81.3% 82.9%IDABEL 82.4% 87.2% 85.0%LUKFATA 63.7% 68.0% 66.8%SMITHVILLE 81.7% 81.9% 82.1%VALLIANT 62.3% 67.2% 76.4%WATSON 60.8% 66.7% *WRIGHT CITY 73.6% 66.0% 74.4%
SOURCE: OK Office of Accountability, District Reports (www.schoolreportcard.org). *School Closed.
C-4
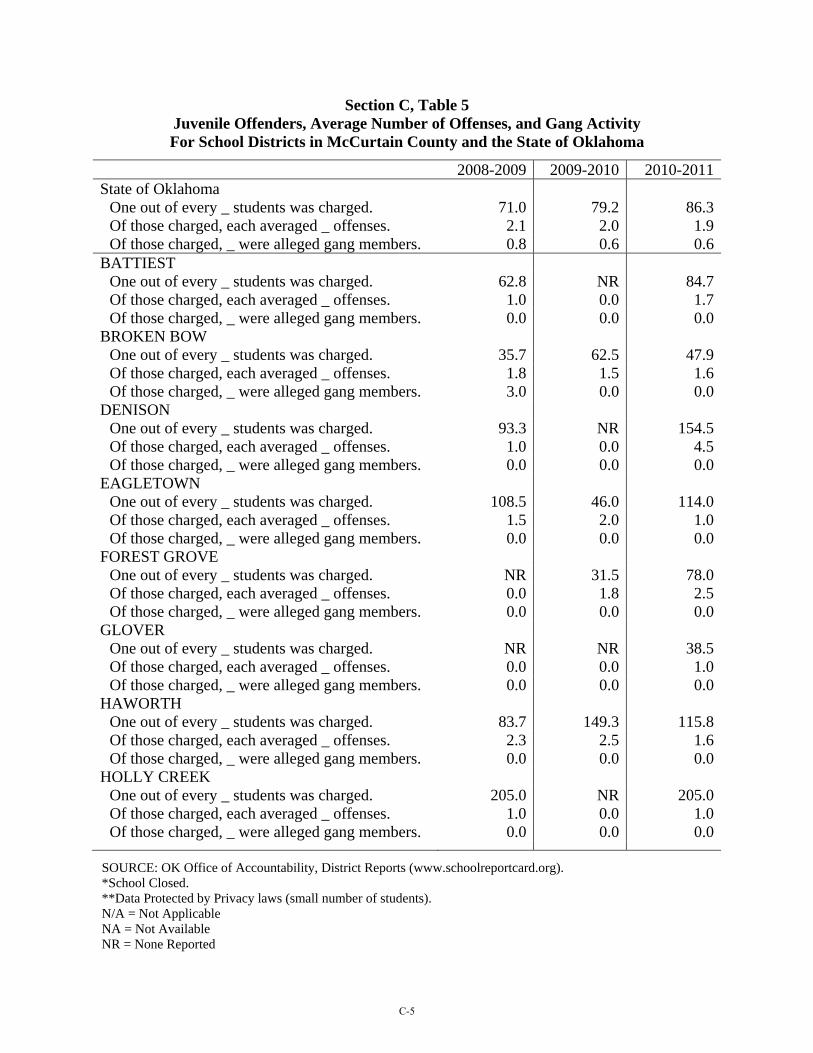
Section C, Table 5 Juvenile Offenders, Average Number of Offenses, and Gang Activity For School Districts in McCurtain County and the State of Oklahoma
2008-2009 2009-2010 2010-2011State of Oklahoma
One out of every _ students was charged. 71.0 79.2 86.3Of those charged, each averaged _ offenses. 2.1 2.0 1.9Of those charged, _ were alleged gang members. 0.8 0.6 0.6
BATTIEST One out of every _ students was charged. 62.8 NR 84.7Of those charged, each averaged _ offenses. 1.0 0.0 1.7Of those charged, _ were alleged gang members. 0.0 0.0 0.0
BROKEN BOW One out of every _ students was charged. 35.7 62.5 47.9Of those charged, each averaged _ offenses. 1.8 1.5 1.6Of those charged, _ were alleged gang members. 3.0 0.0 0.0
DENISON One out of every _ students was charged. 93.3 NR 154.5Of those charged, each averaged _ offenses. 1.0 0.0 4.5Of those charged, _ were alleged gang members. 0.0 0.0 0.0
EAGLETOWN One out of every _ students was charged. 108.5 46.0 114.0Of those charged, each averaged _ offenses. 1.5 2.0 1.0Of those charged, _ were alleged gang members. 0.0 0.0 0.0
FOREST GROVE One out of every _ students was charged. NR 31.5 78.0Of those charged, each averaged _ offenses. 0.0 1.8 2.5Of those charged, _ were alleged gang members. 0.0 0.0 0.0
GLOVER One out of every _ students was charged. NR NR 38.5Of those charged, each averaged _ offenses. 0.0 0.0 1.0Of those charged, _ were alleged gang members. 0.0 0.0 0.0
HAWORTH One out of every _ students was charged. 83.7 149.3 115.8Of those charged, each averaged _ offenses. 2.3 2.5 1.6Of those charged, _ were alleged gang members. 0.0 0.0 0.0
HOLLY CREEK One out of every _ students was charged. 205.0 NR 205.0Of those charged, each averaged _ offenses. 1.0 0.0 1.0Of those charged, _ were alleged gang members. 0.0 0.0 0.0
SOURCE: OK Office of Accountability, District Reports (www.schoolreportcard.org). *School Closed. **Data Protected by Privacy laws (small number of students). N/A = Not Applicable NA = Not Available NR = None Reported
C-5
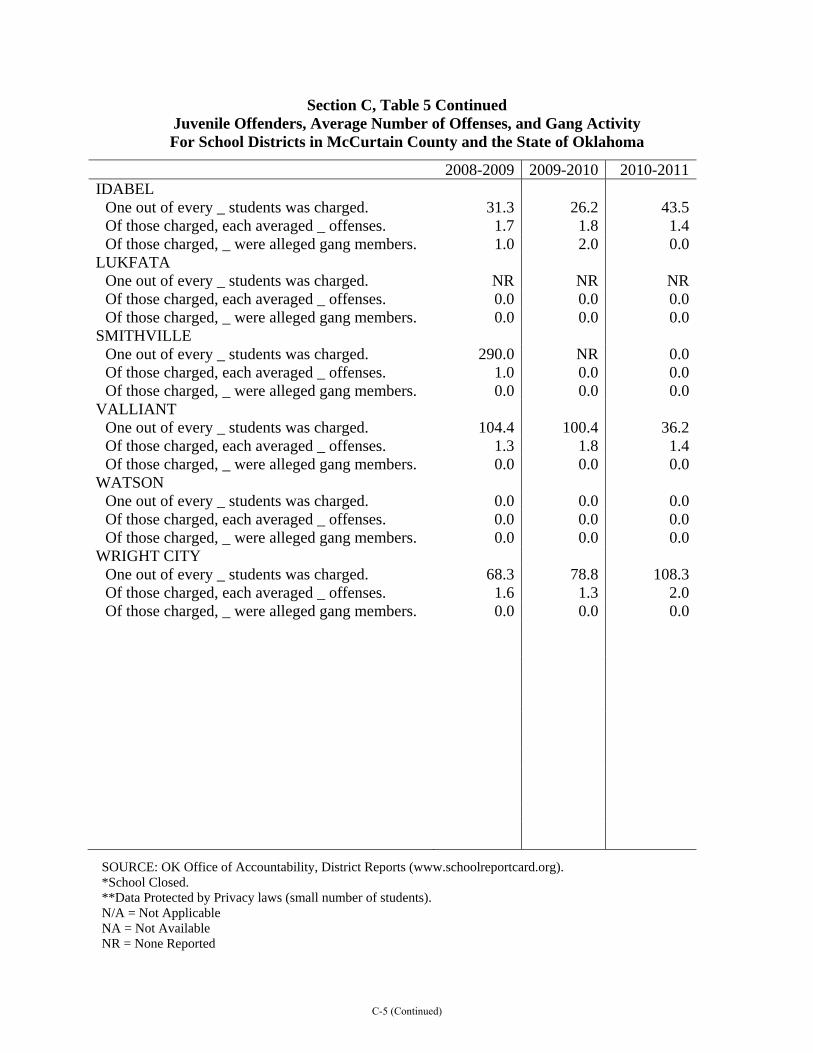
Section C, Table 5 Continued Juvenile Offenders, Average Number of Offenses, and Gang Activity For School Districts in McCurtain County and the State of Oklahoma
2008-2009 2009-2010 2010-2011IDABEL
One out of every _ students was charged. 31.3 26.2 43.5Of those charged, each averaged _ offenses. 1.7 1.8 1.4Of those charged, _ were alleged gang members. 1.0 2.0 0.0
LUKFATA One out of every _ students was charged. NR NR NROf those charged, each averaged _ offenses. 0.0 0.0 0.0Of those charged, _ were alleged gang members. 0.0 0.0 0.0
SMITHVILLE One out of every _ students was charged. 290.0 NR 0.0Of those charged, each averaged _ offenses. 1.0 0.0 0.0Of those charged, _ were alleged gang members. 0.0 0.0 0.0
VALLIANT One out of every _ students was charged. 104.4 100.4 36.2Of those charged, each averaged _ offenses. 1.3 1.8 1.4Of those charged, _ were alleged gang members. 0.0 0.0 0.0
WATSON One out of every _ students was charged. 0.0 0.0 0.0Of those charged, each averaged _ offenses. 0.0 0.0 0.0Of those charged, _ were alleged gang members. 0.0 0.0 0.0
WRIGHT CITY One out of every _ students was charged. 68.3 78.8 108.3Of those charged, each averaged _ offenses. 1.6 1.3 2.0Of those charged, _ were alleged gang members. 0.0 0.0 0.0
SOURCE: OK Office of Accountability, District Reports (www.schoolreportcard.org). *School Closed. **Data Protected by Privacy laws (small number of students). N/A = Not Applicable NA = Not Available NR = None Reported
C-5 (Continued)

D. TRAFFIC DATA
Payne
Pittsburg
Pontotoc
Pottawatomie
Pushmataha
Roger Mills
Rogers
Sequoyah
Stephens
Texas
Tillman
Tulsa Wagoner
Washita
Woods
Woodward
Adair
Alfalfa
Atoka
Beaver
Beckham
Blaine
Bryan
Caddo
Canadian
Carter
Cherokee
Choctaw
Cimarron
Cleveland
Coal Comanche
Cotton
Craig
Creek
Custer
Delaware
Dewey
Ellis Garfield
Garvin
Grady
Grant
Greer
Harmon
Harper
Haskell Hughes
Jackson
Jefferson Johnston
Kay
Kingfisher
Kiowa Latimer
Le Flore
Lincoln Logan
Love
McClain
McCurtain
McIntosh
Major
Marshall
Mayes
Murray
Muskogee
Noble
Nowata
Okfuskee Oklahoma Okmulgee
Osage
Ottawa
Pawnee
Seminole
Washington
0.18
0.48 0.53
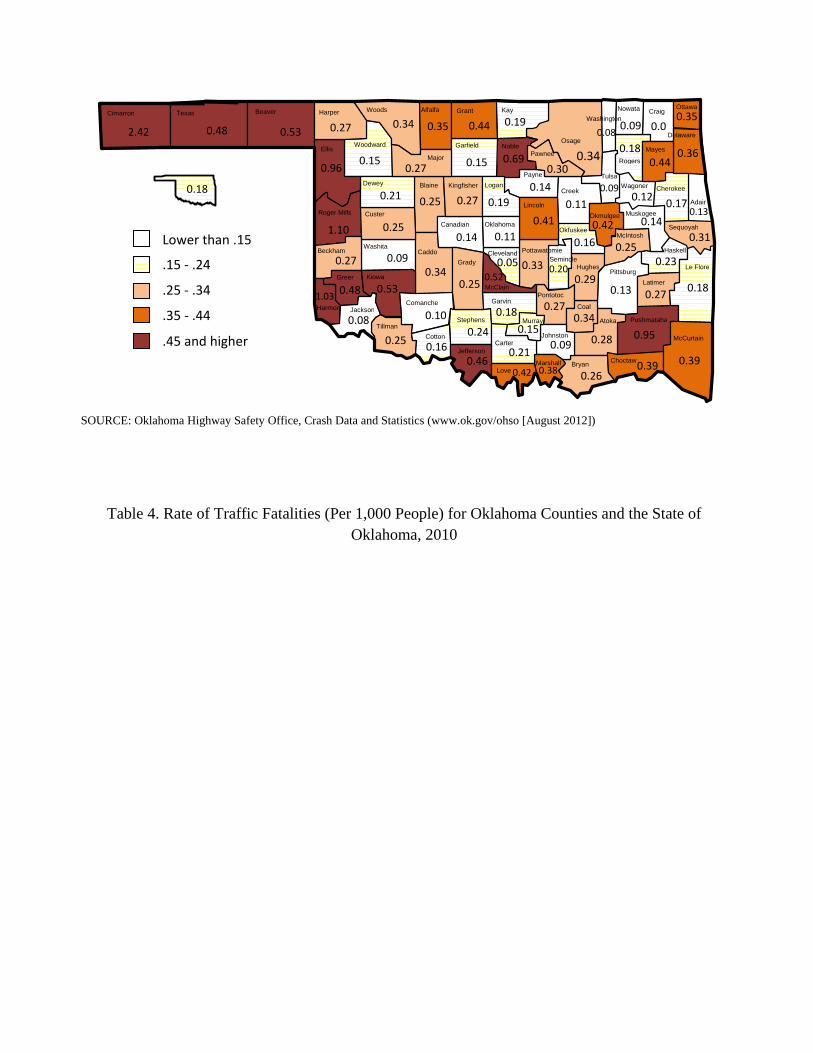
Table 4. Rate of Traffic Fatalities (Per 1,000 People) for Oklahoma Counties and the State of Oklahoma, 2010
SOURCE: Oklahoma Highway Safety Office, Crash Data and Statistics (www.ok.gov/ohso [August 2012])
Lower than .15
.15 - .24
.25 - .34
.35 - .44
.45 and higher
2.42 0.27
0.34 0.35
0.96 0.15 0.27 0.15
0.44
0.19
0.69 0.34 0.30
0.09 0.0 0.35
0.36 0.44
0.17 0.21
0.25 1.10
0.25
0.34
0.09 0.27
0.53 0.48 1.03
0.08
0.25
0.10
0.16
0.27
0.14
0.25
0.24
0.46
0.19
0.11
0.14
0.41
0.05 0.52
0.33
0.18
0.20
0.11
0.16
0.13
0.42
0.29
0.27
0.15
0.21 0.28
0.42
0.09
0.26 0.38
0.34
0.39
0.95
0.39
0.18 0.27
0.23 0.25
0.12
0.31 0.14
0.13
0.09
0.18 0.08

Section D, Table 1 Traffic Fatalities and Rates
For McCurtain County and the State of Oklahoma
McCurtain County State of Oklahoma
Year Number Rate per 1,000
Population Number Rate per 1,000
Population
2005 19 0.6 800 0.2 2006 14 0.4 765 0.2 2007 12 0.4 770 0.2 2008 8 0.2 751 0.2 2009 15 0.4 737 0.2 2010 13 0.4 668 0.2
SOURCE: Oklahoma Highway Safety Office, Crash Data and Statistics (www.ok.gov/ohso).
D-1

Section D, Table 2 Number of Traffic Collisions by Highway Class
For McCurtain County and the State of Oklahoma
McCurtain County State of Oklahoma 2007 2008 2009 2010 2007 2008 2009 2010 No. % No. % No. % No. % % Highway Class Rural U.S. Highways 94 13.9% 71 12.3% 82 15.1% 72 11.9% 4.0% 4.0% 3.8% 3.6% Interstate Highways 0 0.0% 0 0.0% 0 0.0% 0 0.0% 11.1% 10.9% 11.2% 11.9% Interstate Turnpikes 0 0.0% 0 0.0% 0 0.0% 0 0.0% 1.1% 1.2% 1.0% 0.9% Rural State Highways 66 9.7% 63 10.9% 67 12.3% 65 10.8% 4.9% 4.6% 4.4% 4.4% County Roads 156 23.0% 142 24.6% 119 21.9% 126 20.9% 7.4% 6.9% 7.1% 6.9% City Streets 198 29.2% 171 29.6% 141 25.9% 178 29.5% 50.3% 50.3% 51.3% 51.6% Urban U.S. Highways 150 22.2% 121 20.9% 129 23.7% 149 24.7% 11.4% 11.8% 11.6% 11.5% Urban State Highways 12 1.8% 10 1.7% 6 1.1% 13 2.2% 8.8% 8.8% 8.7% 8.4% Non-interstate Turnpike 0 0.0% 0 0.0% 0 0.0% 0 0.0% 1.0% 0.9% 1.0% 0.9% Unknown 1 0.1% 0 0.0% 0 0.0% 0 0.0% 0.0% 0.9% 0.0% 0.0%
Total 677 100.0% 578 100.0% 544 100.0% 603 100.0% 100.0% 100.0% 100.0% 100.0%
SOURCE: Oklahoma Highway Safety Office, Crash Data and Statistics (www.ok.gov/ohso).
D-2

Section D, Table 3 Number of Traffic Collisions by Injury Severity
For McCurtain County and the State of Oklahoma
McCurtain County State of Oklahoma 2007 2008 2009 2010 2007 2008 2009 2010 No. % No. % No. % No. % %
Total Fatal Collisions 11 1.6% 8 1.4% 14 2.6% 13 2.2% 0.9% 0.9% 0.9% 0.9%
Injuries Incapacitating 33 5.0% 30 5.3% 24 4.5% 28 4.7% 4.3% 4.1% 4.1% 4.3% Non-Incapacitating 91 13.7% 49 8.6% 79 14.9% 60 10.2% 13.0% 12.7% 12.3% 13.2% Possible 124 18.6% 146 25.6% 113 21.3% 133 22.5% 17.1% 17.8% 17.9% 17.9% Non-Injury 418 62.8% 345 60.5% 314 59.2% 369 62.5% 64.7% 64.5% 64.9% 64.7% Unknown 0 0.0% 0 0.0% 0 0.0% 0 0.0% 0.0% 0.0% 0.0% 0.0%Total Collisions 666 98.4% 570 98.6% 530 97.4% 590 97.8% 99.1% 99.1% 99.1% 99.1%
Grand Total 677 100.0% 578 100.0% 544 100.0% 603 100.0% 100.0% 100.0% 100.0% 100.0%
SOURCE: Oklahoma Highway Safety Office, Crash Data and Statistics (www.ok.gov/ohso).
D-3
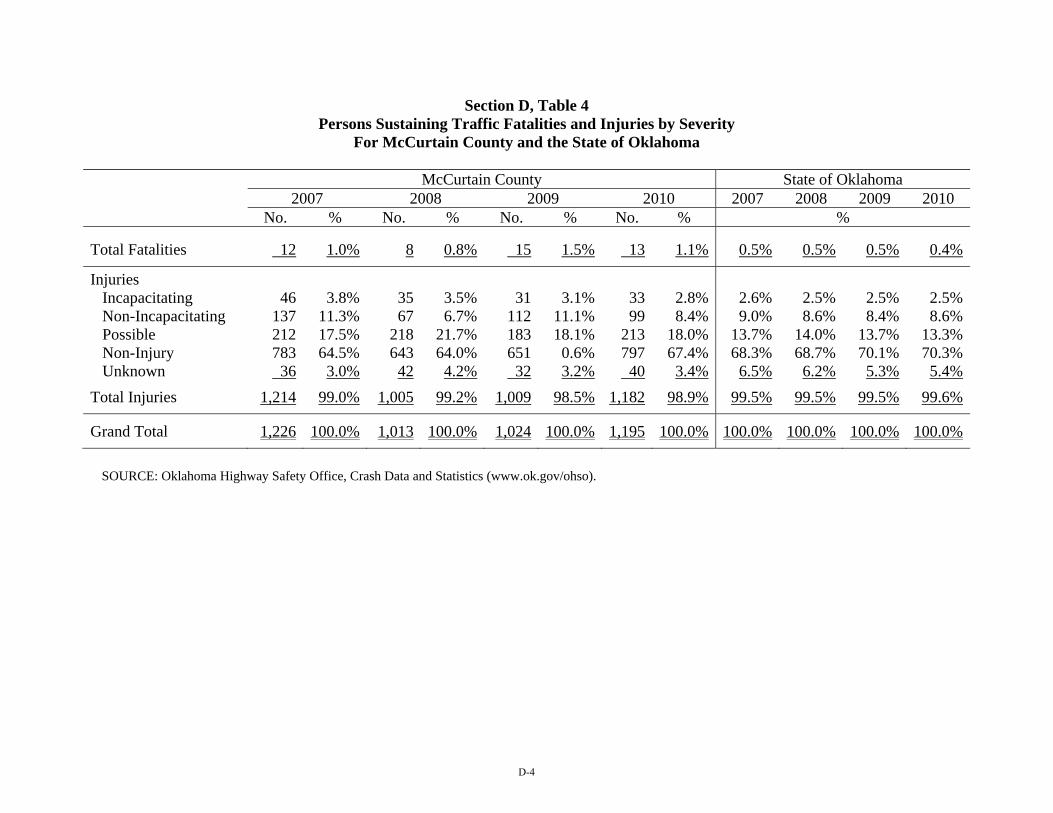
Section D, Table 4 Persons Sustaining Traffic Fatalities and Injuries by Severity
For McCurtain County and the State of Oklahoma
McCurtain County State of Oklahoma 2007 2008 2009 2010 2007 2008 2009 2010 No. % No. % No. % No. % %
Total Fatalities 12 1.0% 8 0.8% 15 1.5% 13 1.1% 0.5% 0.5% 0.5% 0.4%
Injuries Incapacitating 46 3.8% 35 3.5% 31 3.1% 33 2.8% 2.6% 2.5% 2.5% 2.5% Non-Incapacitating 137 11.3% 67 6.7% 112 11.1% 99 8.4% 9.0% 8.6% 8.4% 8.6% Possible 212 17.5% 218 21.7% 183 18.1% 213 18.0% 13.7% 14.0% 13.7% 13.3% Non-Injury 783 64.5% 643 64.0% 651 0.6% 797 67.4% 68.3% 68.7% 70.1% 70.3% Unknown 36 3.0% 42 4.2% 32 3.2% 40 3.4% 6.5% 6.2% 5.3% 5.4%
Total Injuries 1,214 99.0% 1,005 99.2% 1,009 98.5% 1,182 98.9% 99.5% 99.5% 99.5% 99.6%
Grand Total 1,226 100.0% 1,013 100.0% 1,024 100.0% 1,195 100.0% 100.0% 100.0% 100.0% 100.0%
SOURCE: Oklahoma Highway Safety Office, Crash Data and Statistics (www.ok.gov/ohso).
D-4

Section D, Table 5 Number of Alcohol Related Traffic Collisions by Injury Severity
For McCurtain County and the State of Oklahoma
McCurtain County State of Oklahoma 2007 2008 2009 2010 2007 2008 2009 2010 No. % No. % No. % No. % %
Total Fatal Collisions 4 6.3% 4 7.8% 7 9.1% 4 6.2% 4.0% 4.5% 3.8% 4.9%
Injuries Incapacitating 12 20.3% 4 8.5% 6 8.6% 11 18.0% 10.5% 11.0% 10.8% 11.2% Non-Incapacitating 8 13.6% 10 21.3% 18 25.7% 10 16.4% 22.0% 21.3% 20.3% 21.4% Possible 9 15.3% 14 29.8% 14 20.0% 13 21.3% 15.4% 16.4% 16.9% 16.1% Non-Injury 30 50.8% 19 40.4% 32 45.7% 27 44.3% 52.1% 51.3% 51.9% 51.3% Unknown 0 0.0% 0 0.0% 0 0.0% 0 0.0% 0.0% 0.0% 0.0% 0.0%
Total Collisions 59 93.7% 47 90.9% 70 90.9% 61 93.8% 96.0% 95.5% 96.2% 95.1%
Grand Total 63 100.0% 51 100.0% 77 100.0% 65 100.0% 100.0% 100.0% 100.0% 100.0%
SOURCE: Oklahoma Highway Safety Office, Crash Data and Statistics (www.ok.gov/ohso).
D-5
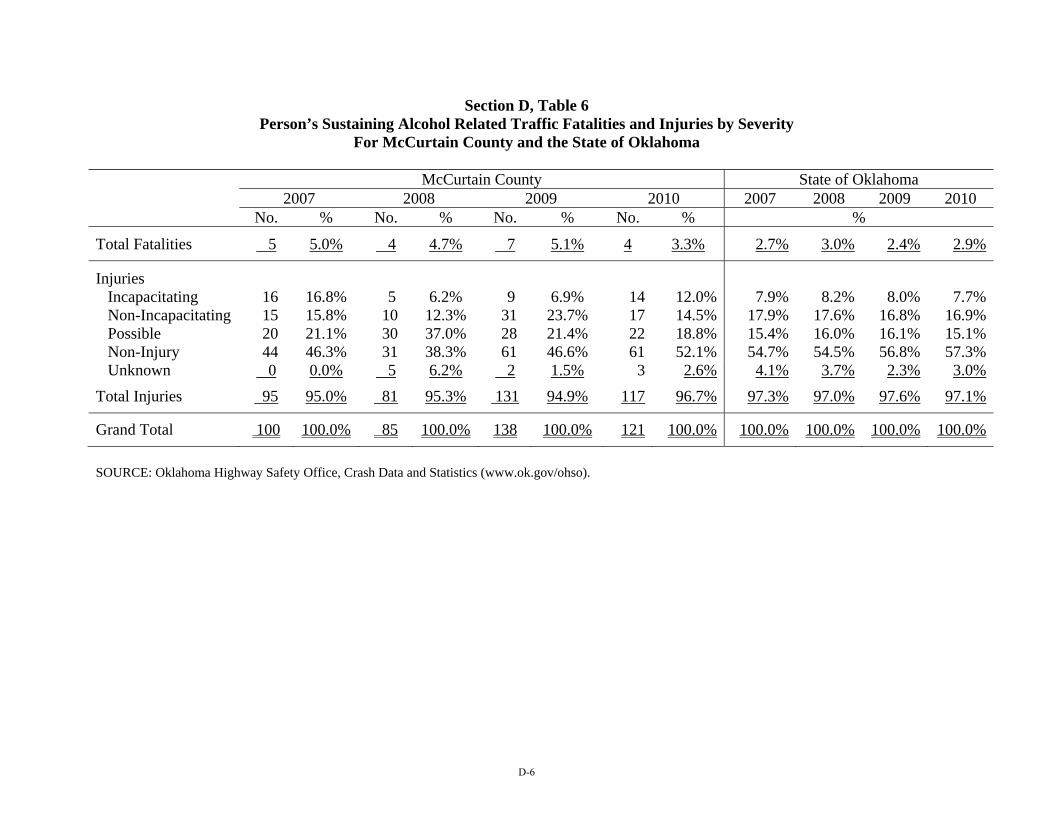
Section D, Table 6 Person’s Sustaining Alcohol Related Traffic Fatalities and Injuries by Severity
For McCurtain County and the State of Oklahoma
McCurtain County State of Oklahoma 2007 2008 2009 2010 2007 2008 2009 2010 No. % No. % No. % No. % %
Total Fatalities 5 5.0% 4 4.7% 7 5.1% 4 3.3% 2.7% 3.0% 2.4% 2.9%
Injuries Incapacitating 16 16.8% 5 6.2% 9 6.9% 14 12.0% 7.9% 8.2% 8.0% 7.7% Non-Incapacitating 15 15.8% 10 12.3% 31 23.7% 17 14.5% 17.9% 17.6% 16.8% 16.9% Possible 20 21.1% 30 37.0% 28 21.4% 22 18.8% 15.4% 16.0% 16.1% 15.1% Non-Injury 44 46.3% 31 38.3% 61 46.6% 61 52.1% 54.7% 54.5% 56.8% 57.3% Unknown 0 0.0% 5 6.2% 2 1.5% 3 2.6% 4.1% 3.7% 2.3% 3.0%
Total Injuries 95 95.0% 81 95.3% 131 94.9% 117 96.7% 97.3% 97.0% 97.6% 97.1%
Grand Total 100 100.0% 85 100.0% 138 100.0% 121 100.0% 100.0% 100.0% 100.0% 100.0%
SOURCE: Oklahoma Highway Safety Office, Crash Data and Statistics (www.ok.gov/ohso).
D-6

Section D, Table 7 Number of Unsafe Speed Related Collisions by Injury Severity
For McCurtain County and the State of Oklahoma
McCurtain County State of Oklahoma 2007 2008 2009 2010 2007 2008 2009 2010 No. % No. % No. % No. % %
Total Fatal Collisions 2 1.8% 2 1.7% 3 3.2% 1 1.2% 1.5% 1.9% 1.8% 1.7%
Injuries Incapacitating 10 9.3% 11 9.7% 8 8.8% 11 11.0% 6.0% 6.4% 6.5% 6.7% Non-Incapacitating 22 20.6% 12 10.6% 24 26.4% 12 14.5% 17.2% 17.9% 18.0% 18.5% Possible 25 23.4% 32 28.3% 25 27.5% 25 30.1% 19.7% 20.3% 20.0% 20.5% Non-Injury 50 46.7% 58 51.3% 34 37.4% 35 42.2% 57.0% 55.5% 55.5% 54.4% Unknown 0 0.0% 0 0.0% 0 0.0% 0 0.0% 0.0% 0.0% 0.0% 0.0%Total Collisions 107 98.2% 113 98.3% 91 96.8% 83 98.8% 98.5% 98.1% 98.2% 98.3%
Grand Total 109 100.0% 115 100.0% 94 100.0% 84 100.0% 100.0% 100.0% 100.0% 100.0%
SOURCE: Oklahoma Highway Safety Office, Crash Data and Statistics (www.ok.gov/ohso).
D-7
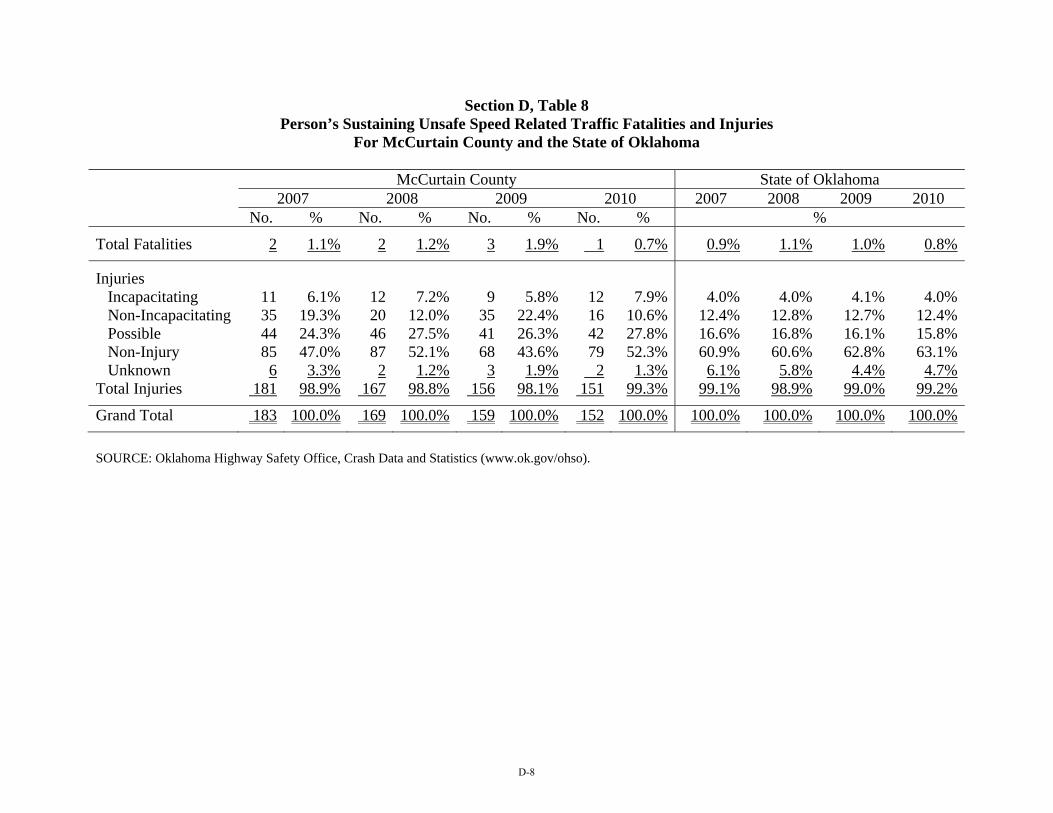
Section D, Table 8 Person’s Sustaining Unsafe Speed Related Traffic Fatalities and Injuries
For McCurtain County and the State of Oklahoma
McCurtain County State of Oklahoma 2007 2008 2009 2010 2007 2008 2009 2010 No. % No. % No. % No. % %
Total Fatalities 2 1.1% 2 1.2% 3 1.9% 1 0.7% 0.9% 1.1% 1.0% 0.8%
Injuries Incapacitating 11 6.1% 12 7.2% 9 5.8% 12 7.9% 4.0% 4.0% 4.1% 4.0% Non-Incapacitating 35 19.3% 20 12.0% 35 22.4% 16 10.6% 12.4% 12.8% 12.7% 12.4% Possible 44 24.3% 46 27.5% 41 26.3% 42 27.8% 16.6% 16.8% 16.1% 15.8% Non-Injury 85 47.0% 87 52.1% 68 43.6% 79 52.3% 60.9% 60.6% 62.8% 63.1% Unknown 6 3.3% 2 1.2% 3 1.9% 2 1.3% 6.1% 5.8% 4.4% 4.7%Total Injuries 181 98.9% 167 98.8% 156 98.1% 151 99.3% 99.1% 98.9% 99.0% 99.2%
Grand Total 183 100.0% 169 100.0% 159 100.0% 152 100.0% 100.0% 100.0% 100.0% 100.0%
SOURCE: Oklahoma Highway Safety Office, Crash Data and Statistics (www.ok.gov/ohso).
D-8

Section D, Table 9 Number of Roll Over Related Traffic Collisions by Injury Severity
For McCurtain County and the State of Oklahoma
McCurtain County State of Oklahoma 2007 2008 2009 2010 2007 2008 2009 2010 No. % No. % No. % No. % %
Total Fatal Collisions 4 4.6% 3 4.4% 6 6.8% 5 7.9% 5.2% 5.7% 5.5% 5.5%
Injuries Incapacitating 15 18.1% 7 10.8% 9 11.0% 10 17.2% 14.0% 15.2% 13.8% 14.9% Non-Incapacitating 21 25.3% 10 15.4% 33 40.2% 17 29.3% 32.8% 31.3% 33.2% 33.2% Possible 26 31.3% 26 40.0% 18 22.0% 12 20.7% 19.8% 20.4% 20.0% 19.5% Non-Injury 21 25.3% 22 33.8% 22 26.8% 19 32.8% 33.4% 33.2% 33.1% 32.4% Unknown 0 0.0% 0 0.0% 0 0.0% 0 0.0% 0.0% 0.0% 0.0% 0.0%Total Collisions 83 95.4% 65 95.6% 82 93.2% 58 92.1% 94.8% 94.4% 94.5% 94.5
Grand Total 87 100.0% 68 100.0% 88 100.0% 63 100.0% 100.0% 100.0% 100.0% 100.0%
SOURCE: Oklahoma Highway Safety Office, Crash Data and Statistics (www.ok.gov/ohso).
D-9
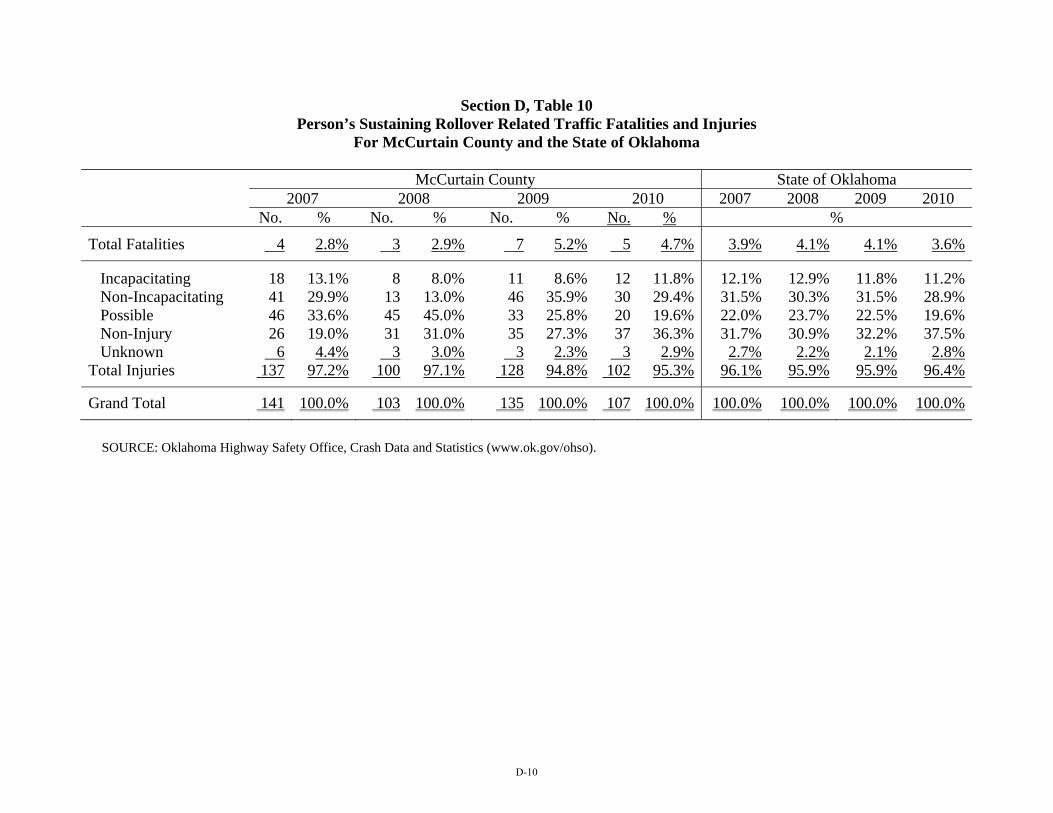
Section D, Table 10 Person’s Sustaining Rollover Related Traffic Fatalities and Injuries
For McCurtain County and the State of Oklahoma
McCurtain County State of Oklahoma 2007 2008 2009 2010 2007 2008 2009 2010 No. % No. % No. % No. % %
Total Fatalities 4 2.8% 3 2.9% 7 5.2% 5 4.7% 3.9% 4.1% 4.1% 3.6%
Incapacitating 18 13.1% 8 8.0% 11 8.6% 12 11.8% 12.1% 12.9% 11.8% 11.2% Non-Incapacitating 41 29.9% 13 13.0% 46 35.9% 30 29.4% 31.5% 30.3% 31.5% 28.9% Possible 46 33.6% 45 45.0% 33 25.8% 20 19.6% 22.0% 23.7% 22.5% 19.6% Non-Injury 26 19.0% 31 31.0% 35 27.3% 37 36.3% 31.7% 30.9% 32.2% 37.5% Unknown 6 4.4% 3 3.0% 3 2.3% 3 2.9% 2.7% 2.2% 2.1% 2.8%Total Injuries 137 97.2% 100 97.1% 128 94.8% 102 95.3% 96.1% 95.9% 95.9% 96.4%
Grand Total 141 100.0% 103 100.0% 135 100.0% 107 100.0% 100.0% 100.0% 100.0% 100.0%
SOURCE: Oklahoma Highway Safety Office, Crash Data and Statistics (www.ok.gov/ohso).
D-10
E. CRIME DATA

Payne
Pittsburg
Pontotoc
Pottawatomie
Pushmataha
Roger Mills
Rogers
Sequoyah
Stephens
Texas
Tillman
Tulsa Wagoner
Washita
Woods
Woodward
Adair
Alfalfa
Atoka
Beaver
Beckham
Blaine
Bryan
Caddo
Canadian
Carter
Cherokee
Choctaw
Cimarron
Cleveland
Coal Comanche
Cotton
Craig
Creek
Custer
Delaware
Dewey
Ellis Garfield
Garvin
Grady
Grant
Greer
Harmon
Harper
Haskell Hughes
Jackson
Jefferson Johnston
Kay
Kingfisher
Kiowa Latimer Le Flore
Lincoln Logan
Love
McClain
McCurtain
McIntosh
Major
Marshall
Mayes
Murray
Muskogee
Noble
Nowata
Okfuskee Oklahoma Okmulgee
Osage
Ottawa
Pawnee
Seminole
Washington
20.4
24.2 2.7
Table 6. Juvenile Arrest Rates (Per 1,000 People) for Oklahoma Counties and the State of Oklahoma, 2010
SOURCE: Oklahoma State Bureau of Investigation, Uniform Crime Report (www.ok.gov/osbi [August 2012]).
Less than 3
3.0 - 10
10.1 - 17
17.1 - 24
24.1 and higher
0.0 3.2
14.4 0.0
16.5 36.2 49.8 34.6
0.0
54.9
10.2 2.5 3.4
7.4 18.8 11.2
6.0 2.0
8.7 0.0
20.1 0.0
5.9
13.4
3.7 12.2
4.5 7.3 9.3
16.9
25.8
31.5
3.9
0.8
16.9
16.8
16.7
0.6
9.2
30.6
25.0
4.7
28.1 0.1
17.6
20.6
13.1
21.7
5.3
11.2
13.9
13.2
26.9
6.2
19.2 5.4
2.2
13.4
9.7 18.8
3.3
5.7
4.2
8.1
6.9 2.6
3.7 20.9
11.9
14.8 28.0
3.0 20.8
9.8 16.5

Payne
Pittsburg
Pontotoc
Pottawatomie
Pushmataha
Roger Mills
Rogers
Sequoyah
Stephens
Texas
Tillman
Tulsa Wagoner
Washita
Woods
Woodward
Adair
Alfalfa
Atoka
Beaver
Beckham
Blaine
Bryan
Caddo
Canadian
Carter
Cherokee
Choctaw
Cimarron
Cleveland
Coal Comanche
Cotton
Craig
Creek
Custer
Delaware
Dewey
Ellis Garfield
Garvin
Grady
Grant
Greer
Harmon
Harper
Haskell Hughes
Jackson
Jefferson Johnston
Kay
Kingfisher
Kiowa Latimer Le Flore
Lincoln Logan
Love
McClain
McCurtain
McIntosh
Major
Marshall
Mayes
Murray
Muskogee
Noble
Nowata
Okfuskee Oklahoma Okmulgee
Osage
Ottawa
Pawnee
Seminole
Washington
49.4
32.4 13.4
Table 5. Adult Arrest Rates (Per 1,000 People) for Oklahoma Counties and the State of Oklahoma, 2010
SOURCE: Oklahoma State Bureau of Investigation, Uniform Crime Report (www.ok.gov/osbi [August 2012]).
Lower than 25
25-49.9
50-74.9
75-99.9
100 and higher
38.5 35.6
32.2 27.5
24.4 76.8 133.8 53.2
10.0
45.3
40.8 19.5 65.8
52.7 58.3 41.3
39.0 17.1
29.6 66.6
94.6 29.7
24.2
54.8
51.4 123.5
28.9 16.0 72.9
86.9
31.2
55.4
51.8
46.3
41.3
23.8
63.8
10.4
28.3
50.1
54.9
15.9
58.2 11.3
68.4
60.7
51.0
35.8
18.7
29.9
55.6
32.9
75.6
38.6
78.8 49.0
25.7
82.2
74.2 114.7
34.7
54.5
40.3
23.2
55.4 71.8
32.0 101.7
34.0
58.9 81.8
51.7
44.6
30.4 53.7

Agency Year Population
Total Index
Crimes1
Crime Rate per
1,000 Murder Rape RobberyFelonious Assault
Breaking and
Entering Larceny
Motor Vehicle Theft Arson2
McCurtain County Sheriff's Office2010 21,125 576 27.3 0 5 2 43 194 293 39 272009 21,148 594 28.1 1 8 2 44 195 311 33 242008 20,955 516 24.6 3 5 3 30 190 257 28 22
Broken Bow Police Department 2010 4,135 229 55.4 0 4 2 24 59 119 21 42009 4,136 347 83.9 0 6 3 32 119 167 20 52008 4,137 257 62.1 1 5 3 25 82 116 25 7
Idabel Police Department 2010 6,829 297 43.5 1 8 3 25 67 184 9 02009 6,831 257 37.6 2 7 7 35 43 153 10 22008 6,841 267 39.0 3 2 7 29 61 149 16 3
Valliant Police Department 2010 743 23 31.0 0 0 0 6 7 10 0 02009 740 28 37.8 0 1 0 4 5 16 2 02008 741 29 39.1 0 0 0 1 7 20 1 0
Wright City Police Department 2010 788 19 24.1 0 1 0 2 2 13 1 02009 785 21 26.8 0 1 0 0 2 15 3 02008 789 27 34.2 0 0 0 4 5 18 0 0
McCurtain County 2010 33,620 1,144 34.0 1 18 7 100 329 619 70 312009 33,640 1,247 37.1 3 23 12 115 364 662 68 312008 33,463 1,096 32.8 7 12 13 89 345 560 70 32
Section E, Table 1Crime Incidence for McCurtain County
SOURCE: Oklahoma State Bureau of Investigation, Uniform Crime Report (www.ok.gov/osbi).
2The Arson offenses in the contributor report have not been included in the Total Index Crimes1 or Crime Rate per 1,000 figures.
1Crime Index is defined as murder, rape, robbery, felonious assault, breaking and entering, larceny, and motor vehicle theft.
E-1

Section E, Table 2 Arrests by Category
For McCurtain County and the State of Oklahoma
McCurtain County State of Oklahoma 2007 2008 2009 2010 2007 2008 2009 2010 Juvenile Crime Arrests Total Juvenile Arrests 34 57 54 70 21,463 21,818 20,880 18,493 Rate per 1,000 Juveniles 3.8 6.4 6.1 8.1 23.8 24.0 22.7 20.4 County Ranking2 12 20 20 33 -- -- -- --Juvenile Arrests – Index Crimes1 5 3 9 6 5,149 5,920 6,258 5,210 Rate per 1,000 Juveniles 0.6 0.3 1.0 0.7 5.7 6.5 6.8 5.6Juvenile Arrests – Drug Related 11 10 25 17 2,023 1,875 1,862 1,767 Rate per 1,000 Juveniles 1.2 1.1 2.8 2.0 2.2 2.1 2.0 1.9Juvenile Arrests – Alcohol Related 11 22 14 20 1,661 1,644 1,343 1,248 Rate per 1,000 Juveniles 1.2 2.5 1.6 2.3 1.8 1.8 1.5 1.3
Adult Crime Arrests Total Adult Arrests 719 436 471 570 140,868 140,388 144,390 139,319 Rate per 1,000 Adults 29.4 17.8 19.2 23.2 52.0 51.3 52.2 49.4 County Ranking2 19 8 7 10 -- -- -- --Adult Arrests – Index Crimes1 36 38 46 61 15,515 16,900 19,809 19,064 Rate per 1,000 Adults 1.5 1.9 1.9 2.5 5.7 6.2 7.2 6.8Adult Arrests – Drug Related 213 76 84 101 20,301 18,754 19,295 18,699 Rate per 1,000 Adults 8.7 3.1 3.4 4.1 7.5 6.9 7.0 6.6Adult – Alcohol Related 363 249 272 349 45,226 46,039 44,660 41,906 Rate per 1,000 Adults 14.8 10.1 11.1 14.2 16.7 16.8 16.1 14.9
SOURCE: Oklahoma State Bureau of Investigation, Uniform Crime Report (www.ok.gov/osbi). 1Index Crimes do not include manslaughter and other non-aggravated assaults. 2Ranked as being the most favorable of the 77 counties in Oklahoma with one being the most favorable
E-2