McCormick & Company, Inc.
35
The following slides accompany a January 28, 2016 presentation to investment analysts. This information should be read in conjunction with the press release issued on that date. McCormick & Company, Inc. 4 th Quarter 2015 Financial Results and Business Outlook January 28, 2016 McCormick & Company, Inc. 4 th Quarter 2015 Financial Results and Business Outlook January 28, 2016
Transcript of McCormick & Company, Inc.

The following slides accompany a January 28, 2016 presentation to investment analysts. This information should be read in conjunction with the press release issued on that date.
McCormick & Company, Inc.4th Quarter 2015 Financial Results and Business OutlookJanuary 28, 2016
McCormick & Company, Inc.4th Quarter 2015 Financial Results and Business OutlookJanuary 28, 2016

Forward-looking information
Certain information contained in these materials and our remarks are “forward-looking statements” within the meaning of Section 21E of the Securities Exchange Act of 1934. These statements may be identified by the use of words such as “may,” “will,” “expect,” “should,” “anticipate,” “intend,” “believe” and “plan.” These statements may relate to: the expected results of operations of businesses acquired by us, the expected impact of raw material costs and our pricing actions on our results of operations and gross margins, the expected productivity and working capital improvements, the expectations regarding growth potential in various geographies and markets, expected trends in net sales and earnings performance and other financial measures, the expectations of pension and postretirement plan contributions and anticipated charges associated with such plans, the holding period and market risks associated with financial instruments, the impact of foreign exchange fluctuations, the adequacy of internally generated funds and existing sources of liquidity, such as the availability of bank financing, our ability to issue additional debt or equity securities and our expectations regarding purchasing shares of our common stock under the existing authorization.
These and other forward-looking statements are based on management’s current views and assumptions and involve risks and uncertainties that could significantly affect expected results. Results may be materially affected by factors such as: damage to our reputation or brand name; loss of brand relevance; increased private label use; product quality, labeling, or safety concerns; negative publicity about our products; business interruptions due to natural disasters or unexpected events; actions by, and the financial condition of, competitors and customers; our inability to achieve expected and/or needed cost savings or margin improvements; negative employee relations; the lack of successful acquisition and integration of new businesses; issues affecting our supply chain and raw materials, including fluctuations in the cost and availability of raw and packaging materials; government regulation, and changes in legal and regulatory requirements and enforcement practices; global economic and financial conditions generally, including the availability of financing, and interest and inflation rates; the investment return on retirement plan assets, and the costs associated with pension obligations; foreign currency fluctuations; the stability of credit and capital markets; risks associated with our information technology systems, the threat of data breaches and cyber attacks; volatility in our effective tax rate; impact of climate change on raw materials; infringement of our intellectual property rights, and those of customers; litigation, legal and administrative proceedings; and other risks described in our filings with the Securities and Exchange Commission.
Actual results could differ materially from those projected in the forward-looking statements. We undertake no obligation to update or revise publicly any forward-looking statements, whether as a result of new information, future events or otherwise, except as may be required by law.
2

3
Alan WilsonExecutive Chairman
Alan WilsonExecutive Chairman

Leadership transition at McCormick
Well-planned succession effective February 1st
� Alan Wilson named Executive Chairman
� Lawrence Kurzius promoted to President & CEO
4

5
Lawrence KurziusPresident & Chief Executive Officer
Lawrence KurziusPresident & Chief Executive Officer

Leadership transition at McCormick
Well-planned succession effective February 1st
� Alan Wilson’s named Executive Chairman
� Lawrence Kurzius promoted to President & CEO
Alan Wilson, CEO from January 1, 2008 to January 31, 2016� Grew sales by $1 billion to $4.3 billion
� Completed 11 acquisitions
� Expanded geographic presence, taking sales in emerging markets to 17% from 7%
� Doubled brand marketing
� Generated fuel for growth, with nearly $450 million in cost savings from Comprehensive Continuous Improvement (CCI) program
� Increased cash flow from operations to nearly $600 million, up from $225 million in 2007
� McCormick’s stock price more than doubled and quarterly dividend is $0.43, up from $0.20 per share
Business segment leadership � Malcolm Swift named President, Global Industrial Segment and McCormick International
� Brendan Foley named President, Global Consumer Segment and North America
6

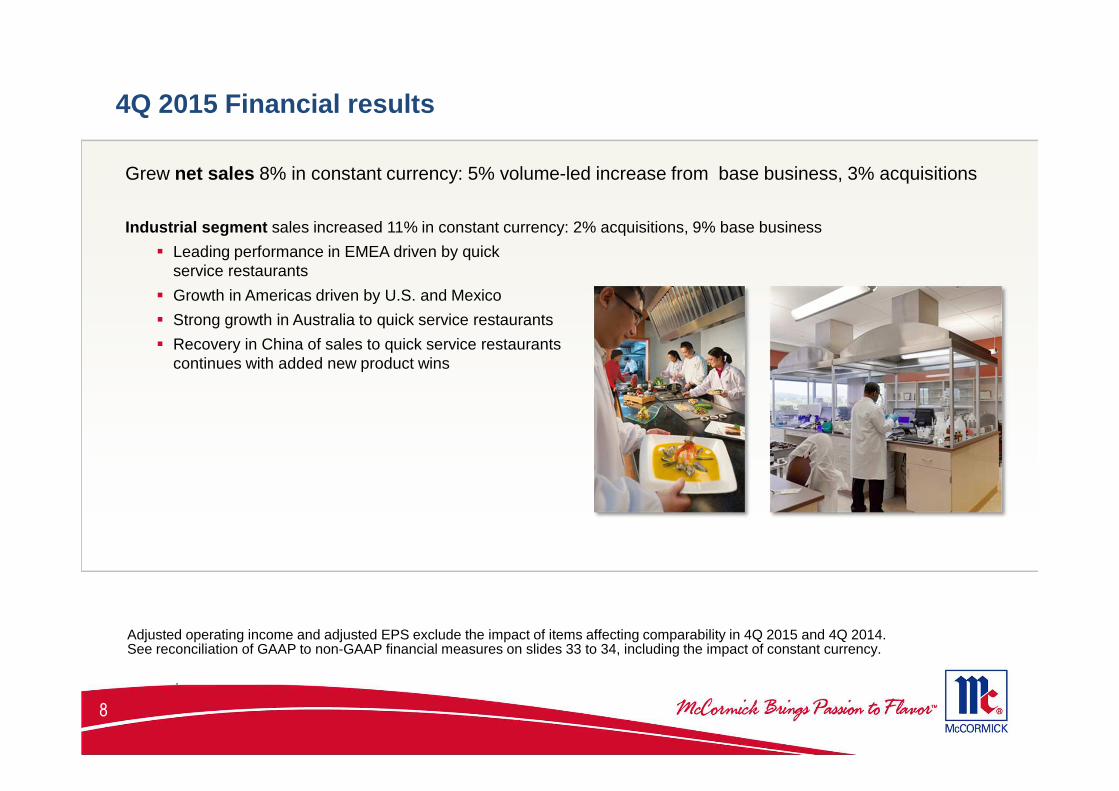
4Q 2015 Financial results
Grew net sales 8% in constant currency: 5% volume-led increase from base business, 3% acquisitions
Consumer segment sales increased 6% in constant currency: 3% acquisitions, 3% base business
� Improvement in U.S. consumer business … from turnaround to way of working
o Category growth for spices and seasonings 5%
o Retail takeaway 4% for McCormick spices and seasonings
o Launched purity campaign
o Gourmet relaunch drove 5% retail takeaway
o Greater category analytics and insights a win for McCormick and our customers
o 26 consecutive months of share gains for recipe mixes
� New distribution in Poland, product innovation and brand marketing in France drove sales in Europe, Middle East and Africa (EMEA)
� In China, grew constant currency sales 5% in 4Q and 12% for FY 2015; with strong start to the year, expect high-single digit to low double-digit constant currency consumer sales growth in 2016
7
-2.0%
-1.0%0.0%1.0%
2.0%3.0%4.0%
5.0%
1Q 2015 2Q 2015 3Q 2015 4Q 2015
Category McCormick brand
Increases in retail takeaway U.S. spices and seasonings vs year-ago quarter
Adjusted operating income and adjusted EPS exclude the impact of items affecting comparability in 4Q 2015 and 4Q 2014. See reconciliation of GAAP to non-GAAP financial measures on slides 33 to 34, including the impact of constant currency.
.
4Q 2015 Financial results
Grew net sales 8% in constant currency: 5% volume-led increase from base business, 3% acquisitions
Industrial segment sales increased 11% in constant currency: 2% acquisitions, 9% base business
� Leading performance in EMEA driven by quick service restaurants
� Growth in Americas driven by U.S. and Mexico
� Strong growth in Australia to quick service restaurants
� Recovery in China of sales to quick service restaurants continues with added new product wins
8
Adjusted operating income and adjusted EPS exclude the impact of items affecting comparability in 4Q 2015 and 4Q 2014. See reconciliation of GAAP to non-GAAP financial measures on slides 33 to 34, including the impact of constant currency.
.

4Q 2015 Financial results
Grew adjusted operating income 10% in constant currency. Adjusted operating income margin rose 70 bps
Industrial segment operating income margin rose 350 bps to 11%
� Shifting portfolio toward more value-added products, through innovation and acquisition of Brand Aromatics
� Benefit of cost savings activity and leverage with higher sales
Consumer segment operating income margin declined 70 bps to 22%
� Increased brand marketing by 11%, which more than accounted for lower margin (90 bps impact)
� Benefit of cost savings activity
Adjusted earnings per share of $1.18 compared to $1.16 in 4Q 2014� Consistent with guidance for 4Q 2015
� Higher adjusted operating income partly offset by impact of higher tax rate
� Impact of unfavorable currency rates
9
Adjusted operating income and adjusted EPS exclude the impact of items affecting comparability in 4Q 2015 and 4Q 2014. See reconciliation of GAAP to non-GAAP financial measures on slides 33 to 34, including the impact of constant currency.
.

FY 2015 Financial results
Grew net sales 6% in constant currency� Turnaround in U.S. consumer business and strong international
consumer sales growth
� Industrial sales up 7%, excluding currency and acquisitions
� Completed 3 acquisitions
� China became #2 market in sales
� 8% of sales comprised of new products
� ~40% of industrial new product briefs had wellness attribute
� U.S. dietary guidelines recommend spices and herbs to help reduce sodium in diet
Delivered $98 million of cost savings, up 42% from 2014
Increased investment in brand marketing 6%� Digital ~40% of advertising, up from ~10% in 2010
� L2’s digital IQ index ranked McCormick brand #5 of 114 U.S. food brands
� Recognized for leadership in e-commerce
10
Adjusted operating income and adjusted EPS exclude the impact of items affecting comparability in 2015 and 2014. See reconciliation of GAAP to non-GAAP financial measures on slides 33 to 34, including the impact of constant currency.
.
FY 2015 Financial results
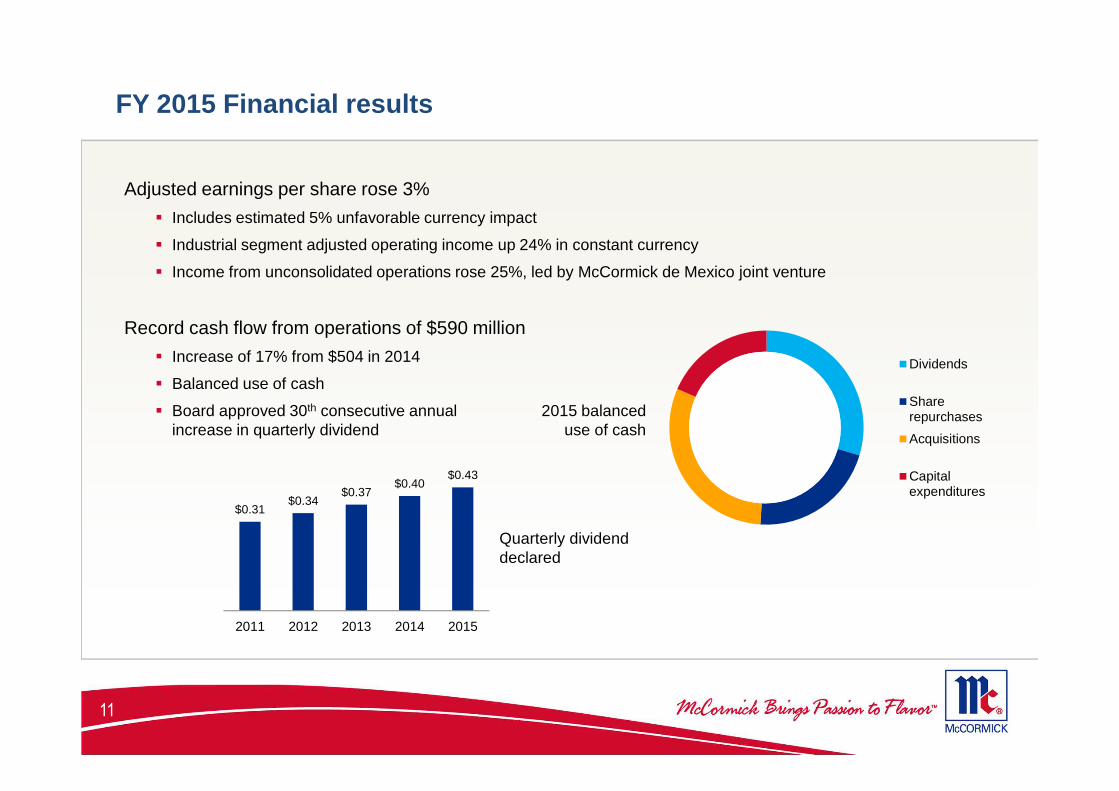
Adjusted earnings per share rose 3%
� Includes estimated 5% unfavorable currency impact
� Industrial segment adjusted operating income up 24% in constant currency
� Income from unconsolidated operations rose 25%, led by McCormick de Mexico joint venture
Record cash flow from operations of $590 million
� Increase of 17% from $504 in 2014
� Balanced use of cash
� Board approved 30th consecutive annual increase in quarterly dividend
11
Dividends
Sharerepurchases
Acquisitions
Capitalexpenditures
2015 balanced use of cash
$0.31$0.34
$0.37$0.40
$0.43
2011 2012 2013 2014 2015
Quarterly dividend declared

Non-GMO
FY 2016 Guidance
12
Converting 70% U.S. spices and seasoning to
Non-GMO label and 80% of gourmet line to
organic
North America roll-out of herb grinders
Flavor Forecast inspired blends
China’s Thai chili sauce in squeeze pouch
Recipe mixes across Europe
McCormick’s business aligned with today’s consumer� Bolder flavors, ethnic cuisine, fresh ingredients, wellness, convenience
� Global growth of spices and seasonings category was 7% in 2015; 5% CAGR projected by Euromonitor through 2020
� On leading edge with Flavor Forecast, product innovation, actions to renovate core
Expect 4% to 6% constant currency sales growth � Base business increase
� Product innovation
� Incremental impact of 2015 acquisitions
� Increase brand marketing ~$20 million
Dessert items in France

Non-GMO
FY 2016 Guidance
McCormick’s business aligned with today’s consumer
Expect 4% to 6% constant currency sales growth
Targeting at least $95 million in cost savings; ~2% net sales
Excluding impact from currency, project 9% to 11% increase in adjusted earnings per share from $3.48 adjusted earnings per share in 2015
13
Adjusted EPS exclude the impact of items affecting comparability in FY 2015. See reconciliation of GAAP to non-GAAP financial measures on slides 33 to 34.
.
$0
$10
$20
$30
$40
$50
$60
$70
$80
$90
$100
2009 2010 2011 2012 2013 2014 2015 2016 goal
Cost savings from organization and streamlining actions
Cost savings from CCI
Greater cost savings activity in 2015 and 2016
(in millions)

Summary
14
� 2015 results demonstrate alignment of our business with today’s consumer and effective strategies
� Plans and potential for great growth in 2016
� Aggressive cost savings programs underway
� Culture of participation and high performance
� Focus on growth, performance and people driving success

Gordon StetzExecutive Vice President & CFO
Gordon StetzExecutive Vice President & CFO
15

4Q 2015 Sales results
4.2%
-7.0%
11.2%
7.1%
2.4% 1.7%
Net sales Currency Constantcurrency
sales
Volume/Mix
Acquisitions Price
2.4%
-5.3%
7.7%
4.1%2.6%
1.0%
Net sales Currency Constantcurrency
sales
Volume/Mix
Acquisitions Price
1.5%
-4.5%
6.0%
2.6% 2.8%0.6%
Net sales Currency Constantcurrency
sales
Volume/Mix
Acquisitions Price
Total Company
Industrial
Consumer
16
See reconciliation of GAAP to non-GAAP financial measures on slides 33 to 34, including the impact of constant currency.
.

4Q 2015 Sales results: Consumer segment
� Growth in volume and product mix of U.S. spices and seasonings, including Grill Mates, Lawry’s, gourmet items, Hispanic products
� Acquisition of Stubb’s in August 2015
1.4%
-1.6%
3.0%
1.9%
0.9%0.2%
Net sales Currency Constantcurrency
sales
Volume/Mix
Acquisitions Price
Americas
17
See reconciliation of GAAP to non-GAAP financial measures on slides 33 to 34, including the impact of constant currency.
.

4Q 2015 Sales results: Consumer segment
� Growth in volume and product mix led by expanded distribution in Poland, new products and brand marketing in France
� Acquisition of Drogheria & Alimentari in May 2015
5.4%
-13.0%
18.4%
7.1%
10.7%
0.6%
Net sales Currency Constantcurrency
sales
Volume/Mix
Acquisitions Price
EMEA
18
See reconciliation of GAAP to non-GAAP financial measures on slides 33 to 34, including the impact of constant currency.
.

4Q 2015 Sales results: Consumer segment
� Constant currency sales increase of 5% in China; included impact of customer purchases driven by Chinese New Year promotions
� High single digit sales increase in Australia
� Lower volume and product mix in India due to discontinuation of low margin product line-5.8%
-7.0%
1.2%
-2.2%
0.0%
3.4%
Total NetSales
Currency Constantcurrency
sales
Volume/Mix
Acquisitions Price
Asia/Pacific
19
See reconciliation of GAAP to non-GAAP financial measures on slides 33 to 34, including the impact of constant currency.
.
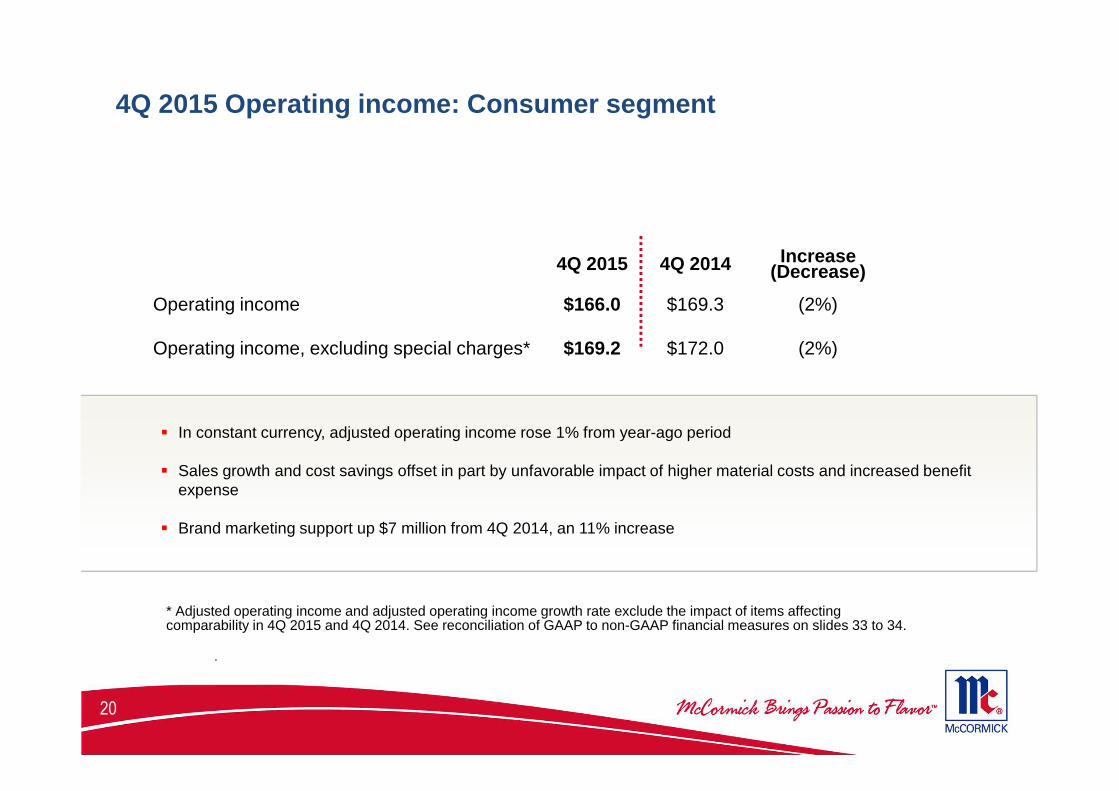
4Q 2015 Operating income: Consumer segment
� In constant currency, adjusted operating income rose 1% from year-ago period
� Sales growth and cost savings offset in part by unfavorable impact of higher material costs and increased benefit expense
� Brand marketing support up $7 million from 4Q 2014, an 11% increase
4Q 2015 4Q 2014 Increase (Decrease)
Operating income $166.0 $169.3 (2%)
Operating income, excluding special charges* $169.2 $172.0 (2%)
* Adjusted operating income and adjusted operating income growth rate exclude the impact of items affecting comparability in 4Q 2015 and 4Q 2014. See reconciliation of GAAP to non-GAAP financial measures on slides 33 to 34.
.
20

4Q 2015 Sales results
4.2%
-7.0%
11.2%
7.1%
2.4% 1.7%
Net sales Currency Constantcurrency
sales
Volume/Mix
Acquisitions Price
2.4%
-5.3%
7.7%
4.1%2.6%
1.0%
Net sales Currency Constantcurrency
sales
Volume/Mix
Acquisitions Price
1.5%
-4.5%
6.0%
2.6% 2.8%0.6%
Net sales Currency Constantcurrency
sales
Volume/Mix
Acquisitions Price
Total Company
Industrial
Consumer
21
See reconciliation of GAAP to non-GAAP financial measures on slides 33 to 34, including the impact of constant currency.
.
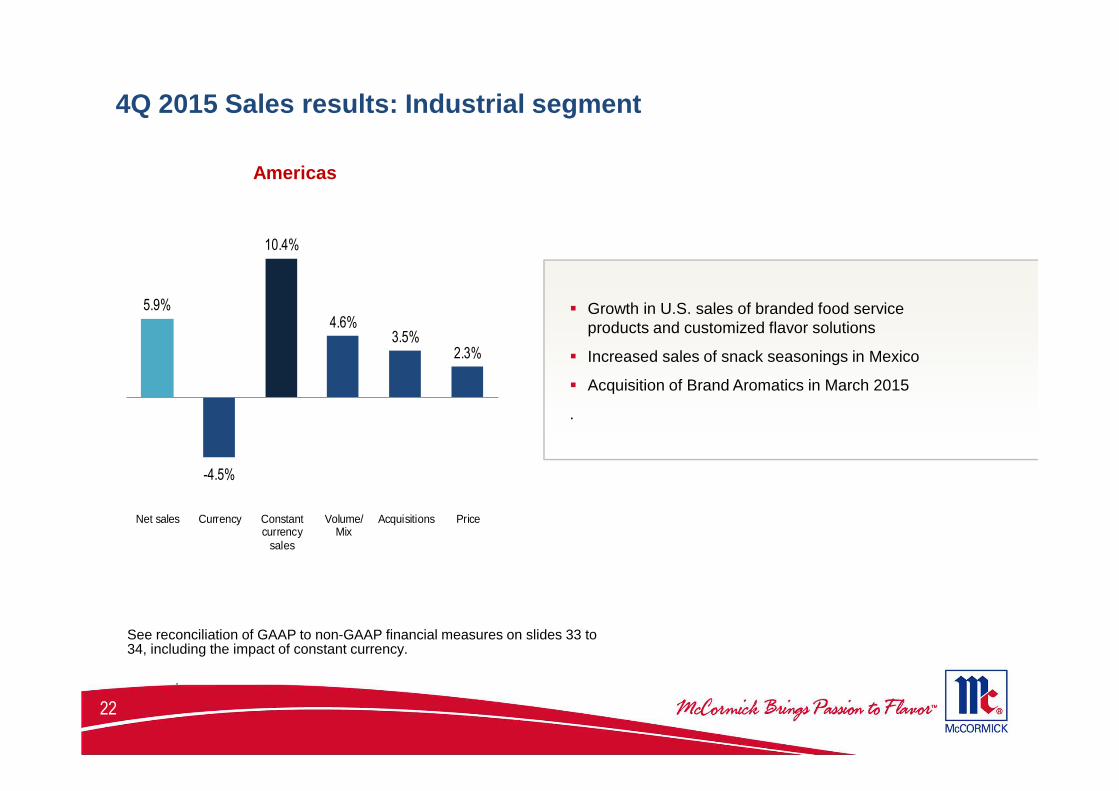
4Q 2015 Sales results: Industrial segment
5.9%
-4.5%
10.4%
4.6%3.5%
2.3%
Net sales Currency Constantcurrency
sales
Volume/Mix
Acquisitions Price
� Growth in U.S. sales of branded food service products and customized flavor solutions
� Increased sales of snack seasonings in Mexico
� Acquisition of Brand Aromatics in March 2015
.
Americas
22
See reconciliation of GAAP to non-GAAP financial measures on slides 33 to 34, including the impact of constant currency.
.

4Q 2015 Sales results: Industrial segment
1.5%
-12.8%
14.3%12.4%
0.0%1.9%
Net sales Currency Constantcurrency
sales
Volume/Mix
Acquisitions Price
EMEA
� Continued strong growth with product innovation, distribution gains and geographic expansion
23
See reconciliation of GAAP to non-GAAP financial measures on slides 33 to 34, including the impact of constant currency.
.

4Q 2015 Sales results: Industrial segment
� Further recovery in demand from quick service restaurants in China following weakness in 2014
� Strong increase in Australia includes product innovation with quick service restaurants
-0.3%
-10.8%
10.5%11.8%
0.0%
-1.3%
Net sales Currency Constantcurrency
sales
Volume/Mix
Acquisitions Price
Asia/Pacific
24
See reconciliation of GAAP to non-GAAP financial measures on slides 33 to 34, including the impact of constant currency.
.
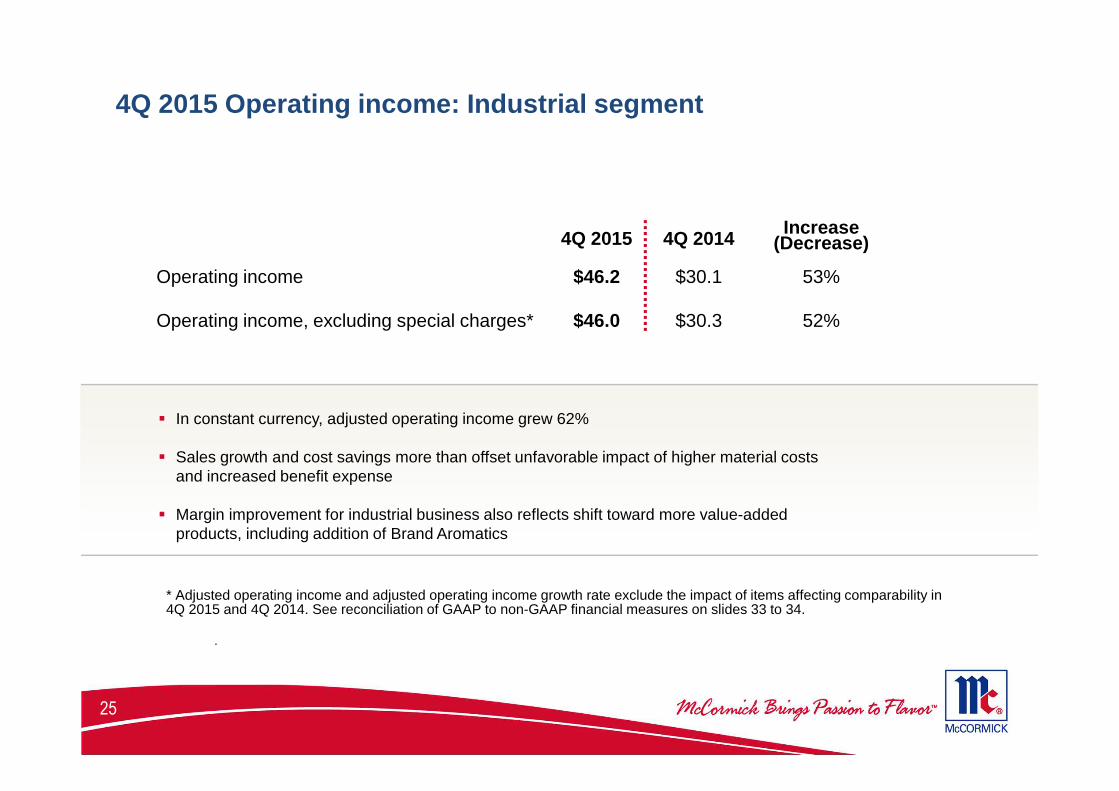
4Q 2015 Operating income: Industrial segment
� In constant currency, adjusted operating income grew 62%
� Sales growth and cost savings more than offset unfavorable impact of higher material costs and increased benefit expense
� Margin improvement for industrial business also reflects shift toward more value-added products, including addition of Brand Aromatics
* Adjusted operating income and adjusted operating income growth rate exclude the impact of items affecting comparability in 4Q 2015 and 4Q 2014. See reconciliation of GAAP to non-GAAP financial measures on slides 33 to 34.
.
4Q 2015 4Q 2014Increase
(Decrease)
Operating income $46.2 $30.1 53%
Operating income, excluding special charges* $46.0 $30.3 52%
25

Operating income, gross profit, SG&A
4Q 2015 4Q 2014Increase
(Decrease)
Operating income $212.2 $199.4 6%
Operating income, excluding special charges* $215.2 $202.3 6%
Gross profit margin 43.4% 43.1% 30 bps
Selling, general & administrative expenses as percent of net sales
25.5% 25.9% (40 bps)
Promotion & advertising $81.0 $71.7 13%
� Excluding impact from both special charges and currency, operating income rose 10%
� Higher gross profit margin driven by full benefit of 2015 cost savings activity and pricing actions more than offsetting higher material costs; also leverage with higher sales
� Decline in SG&A as a percentage of net sales due to cost savings activity and leverage with higher sales; includes $9 million increase in brand marketing.
� Special charges were $3.0 million, with $0.6 million recorded in cost of goods sold
* Adjusted operating income and adjusted operating income growth rate exclude the impact of items affecting comparability in 4Q 2015 and 4Q 2014. See reconciliation of GAAP to non-GAAP financial measures on slides 33 to 34.
.26

Income taxes
4Q 2015 4Q 2014
Income taxes $59.4 $48.6
Income tax rate 29.9% 25.9%
� Tax rate of 29.9% significantly higher than 4Q 2014. The 4Q 2014 tax rate included the favorable impact of discrete tax items.
� For 2016, expect a tax rate of approximately 28%.
27

Income from unconsolidated operations
4Q 2015 4Q 2014 Increase (Decrease)
Income from unconsolidated operations
$9.7 $9.3 4%
� Significant impact from unfavorable currency exchange rates affected year-to-year growth rate in 4Q 2015. Underlying results remain strong.
� Performance led by joint venture in Mexico, which grew sales 10% in local currency
28

Earnings per share
4Q 2015 4Q 2014 Increase (Decrease)
Earnings per share $1.16 $1.14 2%
Adjusted earnings per share* $1.18 $1.16 2%
Growth in adjusted operating income 0.07
Higher tax rate (0.05)
Higher interest expense (0.01)
Reduction in shares outstanding 0.01
Increase in adjusted EPS* 0.02
* Adjusted earnings per share excludes the impact of items affecting comparability in 4Q 2015 and 4Q 2014. See reconciliation of GAAP to non-GAAP financial measures on slides 33 to 34.
.
29

Balance sheet and cash flow
Fiscal year 2015 cash flow from operations of $590 million vs $504 million in 2014
� Improvement in working capital was source of cash in 2015
� Returned $351 million of cash to shareholders through dividends and share repurchases
� Completed $400 million share repurchase authorization approved April 2013; $567 million remains on new $600 million authorized in March 2015
� Used $211 million of cash and short-term borrowings in 2015 to acquire Brand Aromatics, Drogheria & Alimentari and Stubbs
� Issued $250 million of 10-year notes at 3.25% during 4Q 2015 in anticipation of debt maturity
Balance sheet remains strong and well-positioned to fund investments to drive growth
30
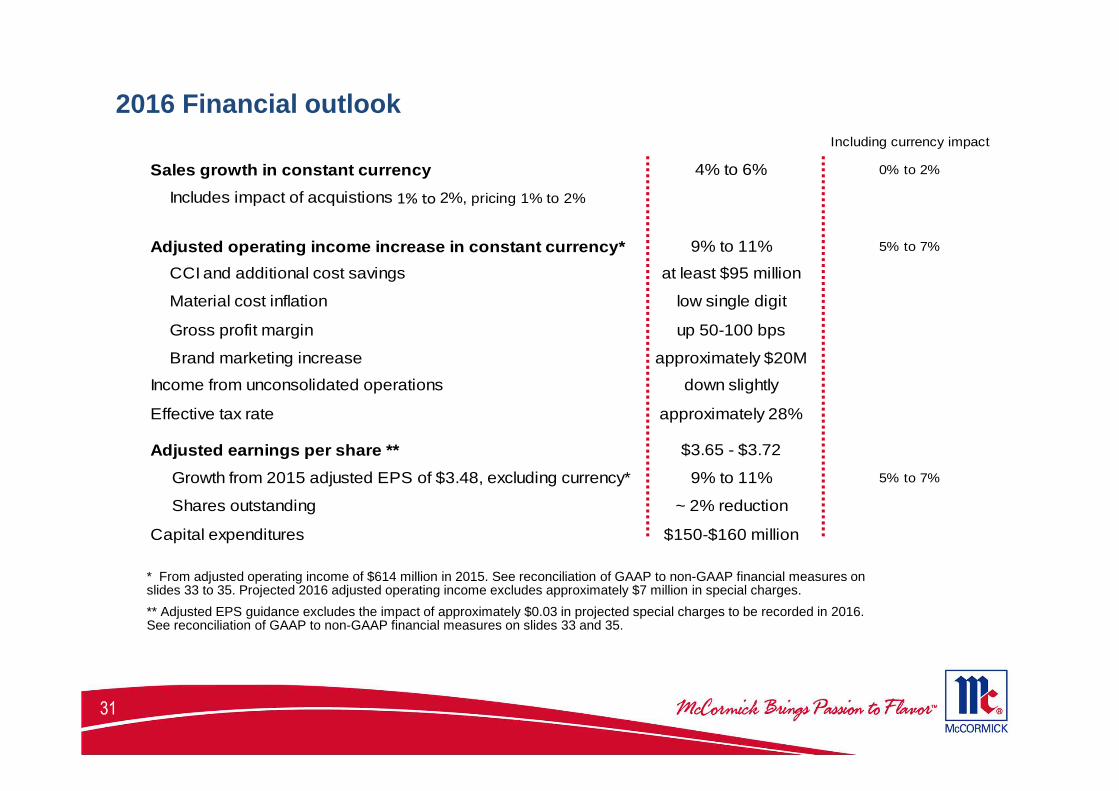
2016 Financial outlookIncluding currency impact
Sales growth in constant currency 4% to 6% 0% to 2%
Includes impact of acquistions 1% to 2%, pricing 1% to 2%
Adjusted operating income increase in constant currency* 9% to 11% 5% to 7%
CCI and additional cost savings at least $95 million
Material cost inflation low single digit
Gross profit margin up 50-100 bps
Brand marketing increase approximately $20M
Income from unconsolidated operations down slightly
Effective tax rate approximately 28%
Adjusted earnings per share ** $3.65 - $3.72
Growth from 2015 adjusted EPS of $3.48, excluding currency* 9% to 11% 5% to 7%
Shares outstanding ~ 2% reduction
Capital expenditures $150-$160 million
* From adjusted operating income of $614 million in 2015. See reconciliation of GAAP to non-GAAP financial measures on slides 33 to 35. Projected 2016 adjusted operating income excludes approximately $7 million in special charges.
** Adjusted EPS guidance excludes the impact of approximately $0.03 in projected special charges to be recorded in 2016. See reconciliation of GAAP to non-GAAP financial measures on slides 33 and 35.
31

32

The tables below include financial measures of adjusted operating income and adjusted diluted earnings per share, each excluding the impact of special charges for the periods presented. These represent non-GAAP financial measures which are prepared as a complement to our financial results prepared in accordance with United States generally accepted accounting principles. In our consolidated income statement, we include a separate line item captioned “special charges” in arriving at our consolidated operating income. Additionally, we recorded $3.4 million in cost of goods sold in our income statement for three and nine months ended August 31, 2015 which we classified as special charges. Special charges consist of expenses associated with certain actions undertaken by the company to reduce fixed costs, simplify or improve processes, and improve our competitiveness and are of such significance in terms of both up-front costs and organizational/structural impact to require advance approval by our Management Committee, comprised of our Chairman and Chief Executive Officer, President and Chief Operating Officer, Executive Vice President and Chief Financial Officer; President, Global Industrial Segment and McCormick International ; President Global Consumer Segment and North America; and Senior Vice President, Human Relations. Upon presentation of any such proposed action (including details with respect to estimated costs, which generally consist principally of employee severance and related benefits, together with ancillary costs associated with the action that may include a non-cash component or a component which relates to inventory adjustments that are included in cost of goods sold; impacted employees or operations; expected timing; and expected benefits) to the Management Committee and the Committee’s advance approval, expenses associated with the approved action are classified as special charges upon recognition and monitored on an on-going basis through completion.
We believe that these non-GAAP financial measures are important for purposes of comparison to prior periods and development of future projections and earnings growth prospects. This information is also used by management to measure the profitability of our ongoing operations and analyze our business performance and trends.
These non-GAAP financial measures may be considered in addition to results prepared in accordance with GAAP, but it should not be considered a substitute for, or superior to, GAAP results. In addition, these non-GAAP financial measures may not be comparable to similarly titled measures of other companies because other companies may not calculate them in the same manner that we do. We intend to continue to provide these non-GAAP financial measures as part of our future earnings discussions and, therefore, the inclusion of these non-GAAP financial measures will provide consistency in our financial reporting. A reconciliation of these non-GAAP financial measures to the related GAAP financial measures is provided below:
Non-GAAP Financial Measures
(in millions except per share data)
11/30/2015 11/30/2014 11/30/2015 11/30/2014
Operating income 212.2$ 199.4$ 548.4$ 603.0$
Impact of special charges included in cost of goods sold 0.6 4.0
Impact of other special charges (including non-cash impairment charge of
$9.6 million for the tw elv e months ended Nov ember 30, 2015) 2.4 2.9 61.5 5.2
Adjusted operating income 215.2$ 202.3$ 613.9$ 608.2$
% increase v ersus prior period 6.4% 0.9%
Earnings per share - diluted 1.16$ 1.14$ 3.11$ 3.34$
Includes per share impact of special charges abov e net of special charges
attributable to non-controlling interests 0.02 0.02 0.37 0.03
Adjusted earnings per share - diluted 1.18$ 1.16$ 3.48$ 3.37$
% increase v ersus prior period 1.7% 3.3%
Three Months Ended Tw elv e Months Ended
33
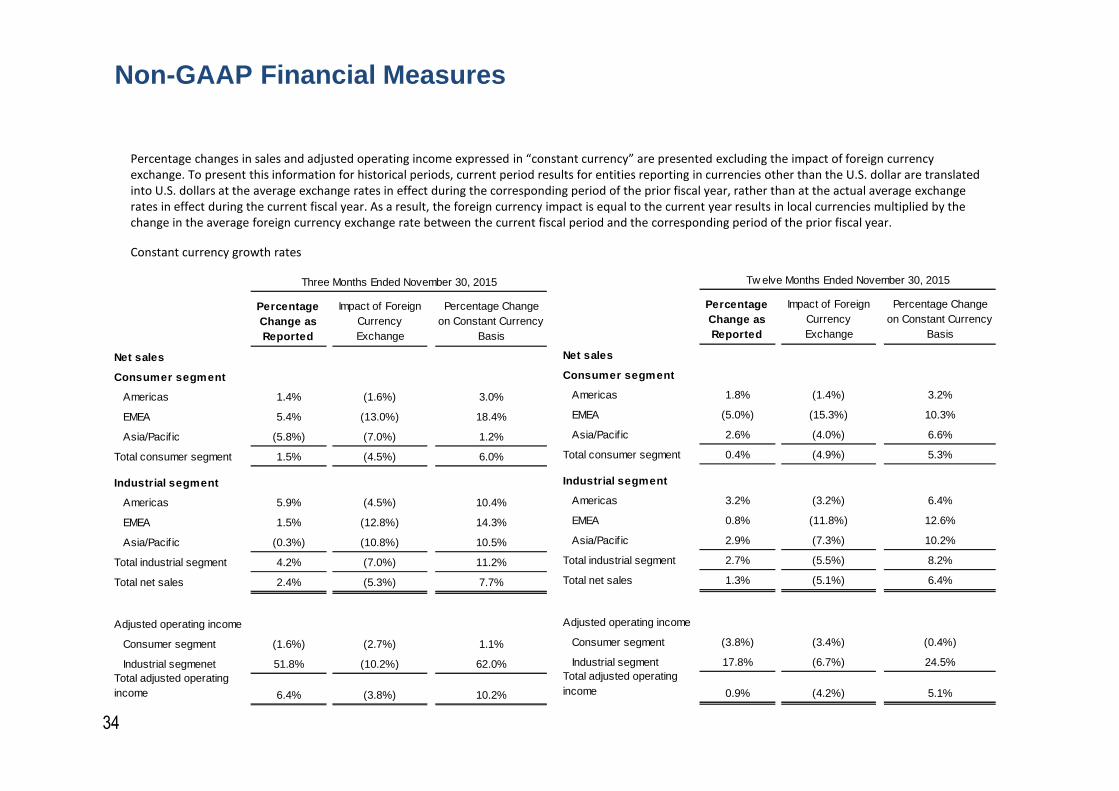
Non-GAAP Financial Measures
Percentage changes in sales and adjusted operating income expressed in “constant currency” are presented excluding the impact of foreign currency
exchange. To present this information for historical periods, current period results for entities reporting in currencies other than the U.S. dollar are translated
into U.S. dollars at the average exchange rates in effect during the corresponding period of the prior fiscal year, rather than at the actual average exchange
rates in effect during the current fiscal year. As a result, the foreign currency impact is equal to the current year results in local currencies multiplied by the
change in the average foreign currency exchange rate between the current fiscal period and the corresponding period of the prior fiscal year.
Constant currency growth rates
Percentage Change as Reported
Impact of Foreign Currency Exchange
Percentage Change on Constant Currency
Basis
Net sales
Consumer segment
Americas 1.4% (1.6%) 3.0%
EMEA 5.4% (13.0%) 18.4%
Asia/Pacif ic (5.8%) (7.0%) 1.2%
Total consumer segment 1.5% (4.5%) 6.0%
Industrial segment
Americas 5.9% (4.5%) 10.4%
EMEA 1.5% (12.8%) 14.3%
Asia/Pacif ic (0.3%) (10.8%) 10.5%
Total industrial segment 4.2% (7.0%) 11.2%
Total net sales 2.4% (5.3%) 7.7%
Adjusted operating income
Consumer segment (1.6%) (2.7%) 1.1%
Industrial segmenet 51.8% (10.2%) 62.0%Total adjusted operating income 6.4% (3.8%) 10.2%
Three Months Ended November 30, 2015
Percentage Change as Reported
Impact of Foreign Currency Exchange
Percentage Change on Constant Currency
Basis
Net sales
Consumer segment
Americas 1.8% (1.4%) 3.2%
EMEA (5.0%) (15.3%) 10.3%
Asia/Pacif ic 2.6% (4.0%) 6.6%
Total consumer segment 0.4% (4.9%) 5.3%
Industrial segment
Americas 3.2% (3.2%) 6.4%
EMEA 0.8% (11.8%) 12.6%
Asia/Pacif ic 2.9% (7.3%) 10.2%
Total industrial segment 2.7% (5.5%) 8.2%
Total net sales 1.3% (5.1%) 6.4%
Adjusted operating income
Consumer segment (3.8%) (3.4%) (0.4%)
Industrial segment 17.8% (6.7%) 24.5%Total adjusted operating income 0.9% (4.2%) 5.1%
Tw elve Months Ended November 30, 2015
34

Non-GAAP Financial Measures
To present the percentage change in projected 2016 adjusted earnings per share on a constant currency basis, projected sales and adjusted operating
income for entities reporting in currencies other than the U.S. dollar are translated into U.S. dollars at the company's budgeted exchange rate for 2016 and
are compared to the 2015 results, translated into U.S. dollars using the same 2016 budgeted exchange rate, rather than at the average actual exchange
rates in effect during fiscal year 2015. This calculation is performed to arrive at adjusted net income (however, no adjustment is made for the company's
share of income in unconsolidated operations that are denominated in currencies other than the U.S. dollar) divided by historical shares outstanding for
fiscal year 2015 or projected shares outstanding for fiscal year 2016, as appropriate.
Fiscal year 2016 projection
2016 Projection
Earnings per share $3.62 to $3.69
Impact of special charges 0.03
Adjusted earnings per share $3.65 to $3.72
Percentage change in adjusted earnings per share 5% to 7%
Impact of foreign currency exchange rates (4%)
Percentage change in adjusted earnings per share on constant currency basis 9% to 11%
35