MCB GROUP · MCB GROUP RATINGS UPDATE o We revise our Fair Value (FV) for MCB to Rs347.77 (-3% on...
17
MCB GROUP Q2-FY19 EARNINGS REVIEW
Transcript of MCB GROUP · MCB GROUP RATINGS UPDATE o We revise our Fair Value (FV) for MCB to Rs347.77 (-3% on...

MCB GROUP
Q2-FY19 EARNINGS
REVIEW

| 2
DISCLAIMER
AXYS Stockbroking Ltd (ASL) has issued this document without consideration of the
investment objectives, financial situation or particular needs of any individual
recipient. ASL will not be under any liability for loss or damage of any kind
whatsoever arising in connection with the contents of this document. This document
is not, and should not be construed as, an offer to sell or the solicitation of an offer
to purchase or subscribe for any investment. This document has been based on
information obtained from sources believed to be reliable but which have not been
independently verified. ASL makes no guarantee, representation or warranty and
accepts no responsibility or liability as to its accuracy or completeness. ASL is a
member of the Stock Exchange of Mauritius and is licensed by the Financial Services
Commission.

CONTENTS
EXECUTIVE SUMMARY 4
KEY FINANCIALS 5 – 11
BALANCE SHEET 6 – 8
INCOME & RETURNS 9 – 11
APPENDIX 12 – 16
GLOSSARY 13 – 15
|
#REF!#REF!#REF!#REF!#REF!
RATING
BUY
4
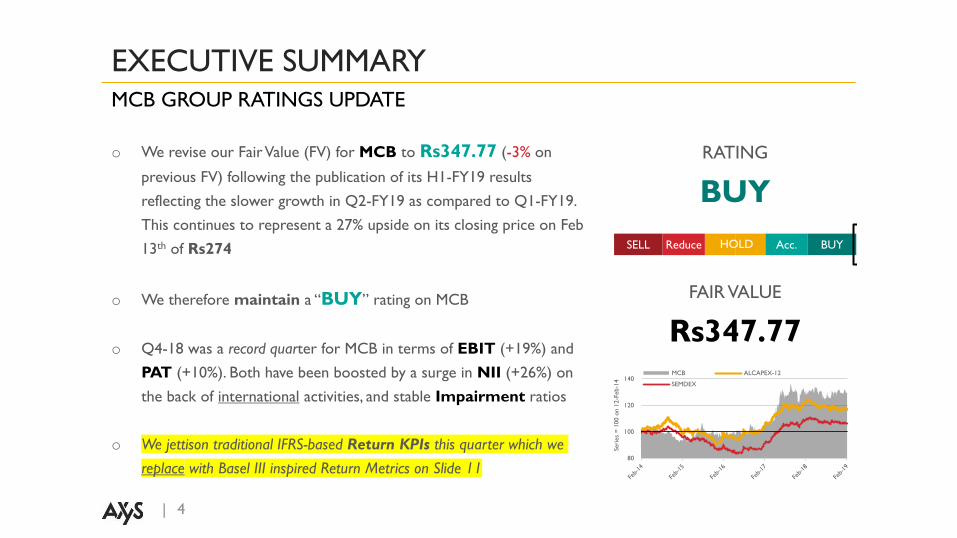
EXECUTIVE SUMMARYMCB GROUP RATINGS UPDATE
o We revise our Fair Value (FV) for MCB to Rs347.77 (-3% on
previous FV) following the publication of its H1-FY19 results
reflecting the slower growth in Q2-FY19 as compared to Q1-FY19.
This continues to represent a 27% upside on its closing price on Feb
13th of Rs274
o We therefore maintain a “BUY” rating on MCB
o Q4-18 was a record quarter for MCB in terms of EBIT (+19%) and
PAT (+10%). Both have been boosted by a surge in NII (+26%) on
the back of international activities, and stable Impairment ratios
o We jettison traditional IFRS-based Return KPIs this quarter which we
replace with Basel III inspired Return Metrics on Slide 11
FAIR VALUE
Rs347.77
80
100
120
140
Seri
es
= 1
00 o
n 1
2-F
eb-1
4
MCB ALCAPEX-12
SEMDEX
HOLDReduceSELL Acc. BUY

MOVE THE PHOTO BACK TO ITS PLACE
DEAR COLLEAGUE AND POWERPOINT AFFICIONADO
KEY FINACIALS

BALANCE SHEET

|
Equity Interbank Liab Depos Market Liab Other Liab
Interbank Assets Loans Market Assets Other Assets
49 65 82 70 68
156
164 167 181
224
43
52
67 94
99
17
19
20
24
27
266
299
336
370
417
Q4-14 Q4-15 Q4-16 Q4-17 Q4-18
35 40 45 51 55
35
205
238
265
290
307
266
299
336
370
417
Q4-14 Q4-15 Q4-16 Q4-17 Q4-18
7
BALANCE SHEETASSET & LIABILITY MATCHING
Q4-14 Q4-15 Q4-16 Q4-17 Q4-18
ASSETS & LIABILITIES [Rs bn]
+12%
o MCB’s balance sheet has grown at
an annualised (ann.) rate of 12% since
2014
o MCB is principally funded through
customer deposits [77% of total
assets] which it has increasingly re-
deployed into markets whose share
of total assets has increased from 16%
in 2014 to 24% in Q4-18
o Deposits have grown at an ann. rate
of 11% since 2014 and Loans at a
slower 9%. On a QoQ basis, Deposits
edged up by 6% against an 24% surge
in Loans – on the back of
foreign/international lending – which is
expected to translate into higher
Interest Income
key
ASSETS are on the Left
LIABILITIES on the Right

|
156 164 167
181
224
57
73
77 79 78
Q4-14 Q4-15 Q4-16 Q4-17 Q4-18
Loans [Rs bn] NIR [bps]
8
BALANCE SHEETDEPLOYMENT, EFFECTIVENESS & QUALITY
76 69
63 62
73
95 88 86
93
102
4.2
4.3
4.4
3.9
4.0
Q4-14 Q4-15 Q4-16 Q4-17 Q4-18
LDR [%] LDR w Mkt [%] NIS [%]
DEPLOYMENT & EFFECTIVENESS QUALITY
o Strong growth in deposits against tepid local demand for credit led to a
steady decline in the LDR to 62% in Q4-17 which only returned to 73%
in Q4-18 on the back of an acceleration in international activities linked
to Energy, Commodities & Structured Finance. Consequently, the LDR
including investment in securities shows full deployment of funds at
102%
o Unsurprisingly therefore – albeit below 2016 levels – interest rate
spreads/margins (NIS) experienced a marginal uptick
o As previously discussed loans have grown at an annualized rate of 9%
since Q4-14 to Rs224bn boosted by international operations
o After a deterioration of loan book quality as evidenced by the jump in
Net Impairment Ratio (NIR) in 2015 into the 70s, the rate has since
hovered at ~78bps

INCOME & RETURNS

|
3,386 3,641
4,051 4,326
4,941
1,389 1,470 1,615 1,831 1,974
4140 40
42
40
4948
49
52
46
Q4-14 Q4-15 Q4-16 Q4-17 Q4-18
Op Income [RsM] NIE
CIR [%] Core CIR [%]
2,045 2,176 2,421
2,619
3,292 788 875
881 904
1,032
553 591
749 803
616
3,386 3,641
4,051 4,326
4,941
Q4-14 Q4-15 Q4-16 Q4-17 Q4-18
NII [RsM] NFCI [RsM] OI [RsM]
10
INCOMEGROWTH & EFFECTIVENESS
OPERATING INCOME EFFECTIVENESS
o Since Q4-14, NII has grown at an ann. rate of 13% to Rs3.29bn growing
at an accelerated 26% QoQ boosted by greater international lending as
well as higher yield on government securities
o Over the same period, NFCI has grown at an ann. rate of 7% to
Rs1.03bn and a stronger 14% QoQ on the back of a pick up in trade
finance, and its capital markets division
o Other Income (OI) has grown by 13% ann. peaking at Rs802M in Q4-17,
then plunged to Rs616M (-23%) this quarter mainly due to the absence of
gains on sale of investments
o While Operating Income (Op. Inc) has been growing at an ann. rate of
10% these past your years to a record Rs4.9bn, Non-Interest Expenses
(NIE) have grown at a slightly slower 9%. Consequently, MCB’s Cost
Income Ratio (CIR) which has averaged 40% in recent years peaking at
42% in Q4-17 but has since returned – i.e. improved – to 40%
o Similarly, Core CIR, i.e. CIR excluding OI have averaged 48% since 2014,
peaked at 52% in Q4-17 thereafter returning to 48%

|
13.5 14.4
15.6 16.0 15.7 15.9
17.0
18.3
18.3 17.6
Q4-14 Q4-15 Q4-16 Q4-17 Q4-18
CET1 CAR [%] CAR [%]
24 2423
22
182.4 2.4
2.6
2.8
2.5
RAROC [%] RORWA [%]
140 159
180
204 220
19.91 24.98
27.90 29.20 33.10
Q4-14 Q4-15 Q4-16 Q4-17 Q4-18
NAVPS [Rs] Adj. R4Q EPS [Rs]
18.8
17.3
17.0
16.7
17.0
ROTE [%]
11
RETURNS & KEY INDICATORSSHAREHOLDER & RISK-ADJUSTED
SHAREHOLDER RISK ADJUSTED
o NAV has grown at an ann. rate of 12% since 2014 to a record Rs220, i.e.
PBV of 1.24x down from 1.31x a quarter ago
o Adj R4Q EPS has grown at 13.5% over the corresponding period to its
highest ever Rs33, i.e. corresponding to a PER of 8.3x which is its lowest
since Q1-17!
o Return on Tangible Equity (ROTE) which had been slipping year after
year, experienced a slight uptick to 17%
o As a consequence of the recent increased lending and implementation
Basel III, both MCB’s CET1 CAR and CAR have slipped to 15.7% and
17.6% respectively therein shrinking its buffer above regulatory minima
from ~5.0%-pts to ~3.3%-pts
o Return on Risk Weighted Assets (RORWA) has declined to 2.5%
after having steadily risen in recent years – reflecting greater investments
in Govies between 2016-17 – as a result of the significant growth in loans
o Risk Adjusted Return on Capital (RAROC) on the other hand, has
been steadily declining in recent years in spite of growing profits thereby
spelling out the non-negligible impact of Basel III requirements on bank
profitability

MOVE THE PHOTO BACK TO ITS PLACE
DEAR COLLEAGUE AND POWERPOINT AFFICIONADO
APPENDIX

| 13
GLOSSARYA – I
WHAT IT MEANS BRIEF EXPLANATION
Adj. Adjusted Usually adjusted for non-recurrent and/or exceptional items
Assoc. Associate A company in which MCB has an appreciable but non-controlling stake
Att. Attributable Usually refers to NAV or PAT which is attributable to shareholders of MCB
Basel III 3rd iteration of banking regulations developed by Bank for International Settlements
CAR Capital Adequacy Ratio Total Equity as computed under Basle III instead of IFRS measured against RWA
CET1 Core Equity Tier 1 Core Equity as computed under Basle III instead of IFRS
CIR Cost Income RatioThe inverse of a margin whereby we measure the efficiency as Costs measured against Income rather than Net Income over
Revenue
Core CIR Core Cost Income Ratio CIR as measured against Operating Income less Other Income
EBIT Earnings before Impairment and Taxes Operating Profits before credit impairments and taxes
EPS Earnings per Share Profits after Tax attributable to shareholders typically calcultated on a re-current basis, i.e. excluding exceptional items
FV Fair Value What we calculate to be MCB's valuation per share
FY-19 Financial Year ended June 2019
H1 1st half of Financial Year
IFRS International Financial Reporting Standards

| 14
GLOSSARYK – P
WHAT IT MEANS BRIEF EXPLANATION
KPI Key Performance Indicator A measure of operational or financial performance
LDR Loan to Deposit Ratio Measures the rate of deployment of deposits in the form of credit facilities
LDR w MktLoan to Deposit Ratio including (with) Investments &
Borrowings from capital markets
Measures the rate of deployment of deposits and borrowings from markets in the form of credit facilities and investments in
capital markets
MCB MCB Group Ltd The largest banking & financials services group in Mauritius both by Market Cap. & Assets
NAV Net Asset Value Also referred to as "Book Value" or "Equity"
NAVPS Net Asset Value per Share Net Asset Value attributable to shareholders
NFCI Net Fee and Commission Income Fees & Commissions earned from assets less Fees & Commissions paid on liabilities
NIE Non Interest Expenses All operating expenses including depreciation and amortisation excluding impairments of credit facilities and taxes
NII Net Interest Income Interest earned from assets less interest paid on liabilities
NIR Net Impairment Ratio Measures the fraction of net credit facilities written off by the bank on an annualised basis
NIS Net Interest Spread Measures the annualised effective margin/spread between costs of funds and interest rate earned on lending and investments
OI Other Income All other income earned including from dealing on markets
PAT Profits after Tax
| 15
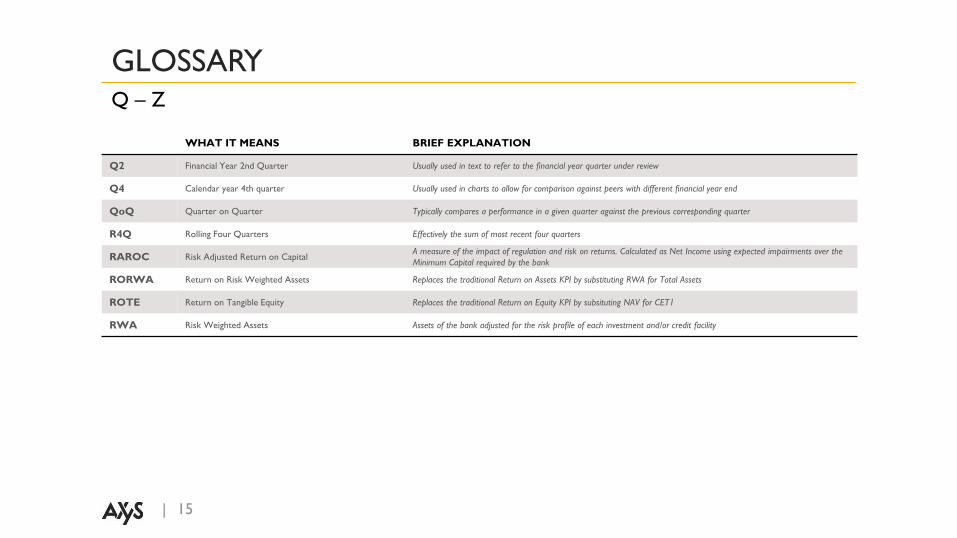
GLOSSARYQ – Z
WHAT IT MEANS BRIEF EXPLANATION
Q2 Financial Year 2nd Quarter Usually used in text to refer to the financial year quarter under review
Q4 Calendar year 4th quarter Usually used in charts to allow for comparison against peers with different financial year end
QoQ Quarter on Quarter Typically compares a performance in a given quarter against the previous corresponding quarter
R4Q Rolling Four Quarters Effectively the sum of most recent four quarters
RAROC Risk Adjusted Return on CapitalA measure of the impact of regulation and risk on returns. Calculated as Net Income using expected impairments over the
Minimum Capital required by the bank
RORWA Return on Risk Weighted Assets Replaces the traditional Return on Assets KPI by substituting RWA for Total Assets
ROTE Return on Tangible Equity Replaces the traditional Return on Equity KPI by subsituting NAV for CET1
RWA Risk Weighted Assets Assets of the bank adjusted for the risk profile of each investment and/or credit facility

| 16
REFERENCES & AUTHORS
REFERENCES AUTHORS TRADING
For buying or selling stocks, bonds
and ETFs please liaise with:
Adlette RIOUX or
Akash BABOOLALL or
Melvyn CHUNG KAITO
Bhavik DESAI
Head of Research
Yuviraj A. PUTTEN
Investment Analyst
MCB Group Ltd, ‘Annual Reports’ &
‘Abridged Financial Statements’ &
‘Management Statements’ [2012-2018]
RATING SCALE
ReduceSELL HOLD Acc. BUY
> 12%< -12% ± 5% + 5-12%- 5-12%
6th Floor, Dias Pier Building, Le Caudan
Waterfront, Caudan, Port-Louis, 11307
(230) 405 4000
www.axys-group.com
CONTACT US