McAree Engineering Ltd. ~The Journey Towards Lean ...
25
McAree Engineering Ltd. ~The Journey Towards Lean ~ November 2016
Transcript of McAree Engineering Ltd. ~The Journey Towards Lean ...

McAree Engineering Ltd.
~The Journey Towards Lean ~
November 2016

2
Business Structure
Agri Bulk
Storage Fabricated
Parts
Sheet
Metal
Projects/
New Products
4 Lines of Business
Projects
R&D
5 – 200 tonne Cab components
Agri equipment Cut, Fold
Punch

What am I going to tell you about this morning
• McAree Engineering – Background and my role
• Lean
• The projects we worked on
• The benefits to the business
• Key Learning / Lessons
3

4
Who are we? McAree Engineering Ltd. was founded in 1946, celebrating 70 years in business this year.
Origins are in the agricultural sector, which led to the development of the award winning range of V-Mac Silo‟s.
Over the last 5 years business has developed by;
– Identifying new engineering opportunities;
– Focusing on providing outstanding service to customers and
– Providing a solutions based approach to meeting customers needs.
100+ team operating one of Ireland‟s most modern laser cutting and sheet metal fabrication facilities over two sites in Monaghan.

What is Lean?
5
REDUCTION of TIME,
MONEY & EFFORT

The McAree Journey
6

7

Project Issue Systems Leadership Behaviour Results Sheet Metal
Material Flow
Inefficient flow of
material through the
shop floor
Structured problem
solving in teams
Visual Management
Work place layout
organisation (5S)
Process Mapping
Kaizen Teams
Utilise a central planning
system, visible to all.
Clear communication
around orders / priorities
Managed Shift changeovers
Communication skills
around the visual planning
board.
Systems dictate next
process steps as
opposed to local
knowledge
Team based approach
across shifts
Clearly defined
process
Throughput improved
from 60T per week to
75T per week with
limited extra
resources.
Predictable, visual
work order
management
Silo Material
Flow
Improve quality
levels to a number
of key account
customers.
Development of system
BOMs
Mapped process to
develop optimum material
availability
Kitting material to point of
use.
Material “ordered” from
sheet metal Dept.
Closer communication with
Sales, and agreement of
specifications.
Visual Updates of
Production Status, allowed
supervisor up skilling to
manage material demands
Requirement agreed
before production
commences
Don‟t start until
material is released
Visual Planning
system used to drive
material requirements
16 men =>13 Units,
now 21 men => 21
Units
Financial
Reporting Pack -
KPIs
Limited regular
financial data being
generated for
Management Team
Mapped reporting
structure
Developed month end
routines
Developed systems for
generating data
Develop a set of KPI, and
basic headline financial data
to help manage the
business
Financial Data tracked
against targets and
budgets
“What is measured... is
Managed”
With a subsequent
change in personnel
this has been
significantly developed
with all financial data
shared with the
Management team and
Dept. Managers
Summary of projects

Project Issue Systems Leadership Behaviour Results Combi-lift
Quality Gate
Improve quality
levels to that of a
tier 1 strategic
supplier.
Quality standards
Quality performance
Quality gap analysis
Structured problem
solving in teams
Visual Management
Work place layout *
organisation( 5S)
2 shift process over 5 days
a week involving 2 shift
leaders and 1 production
manager.
Communication skills
around the visual
management board.
Capability to talk about
performance and generate
actions.
Introduction of the voice of
the customer (VOC) on to
the shop floor.
Dialogue with shift
people.
Holding individuals
accountable for quality
not right first time.
Getting involved in
quality solutions.
The normal result for
Right First Time is now
accepted as 100%
We now have a formal
response system,
where we immediately
contain the issue, and
then instigate the
corrective actions
Sheet Metal
Quality Gate
Improve quality
levels to a number
of key account
customers.
Replicate Combi-lift
approach.
Mapped process to get
optimum quality position
of QG for customer.
Heat map of customer
quality problems.
Voice of customer (VOC)
identified at kitting area
prior to dispatch.
Restructure of quality
function established a
Quality Manager and a
Continuous Improvement
change agent.
Based on learning from the
1st QG a greater focus on
coaching the supervisors in
the area by the new quality
function leaders.
Key individuals
identified for coaching
at the visual stand-up
boards.
Issues and actions
exposed and captured
against specific
individuals.
Challenging people for
capability and
accountability.
Issues are now
captured and reported,
and we instigate a
Corrective Action
“Find a problem, Fix it,
Stop it coming back”
External quality was
previously approx 90%
although not
consistently
measured. Now at
98%
Internal quality was
not previous measured
but now runs at 96%
Exposure of defects
allows us the
opportunity to fix the
issue / process before
it gets to the customer
Summary of projects

Project Issue Systems Leadership Behaviour Results Abcon Order
Management
Increasing sales
were becoming
difficult to manage
Mapped the process from
raw material to customer
dispatch.
Reduction in the no. of
steps to process the order.
Internal capability built
around a purchased part
sub-contract process to
remove administration and
reduce lead time.
Simplification of the process
and exploitation of the
company sage system
allowed easier
communication of customer
demand.
Production leader and supply
chain manager on one page
at all times.
SC manager able to
communicate to customer
production status.
Standards established
and new order
management driving
improved
performance.
Visual Traceability
System for Order
progress
OTIF delivery figure
improved by over 50%.
This figure is currently
about 80%, but was
under 40%. Low score
is primarily due to very
short lead time
demands
Abcon
production layout
Increasing sales
was causing
material and
information flow
issues on the shop
floor
Shop floor flow layout
introduced.
Kanban „pull‟ management
on purchased parts steady
runner material.
Organisation of shop floor
and material facilitated a
leadership restructure to
allow skilled supervisor to
concentrate on more
bespoke work.
All operators trained in
5S to facilitate work
place organisation and
cell ownership.
5S fab/weld bench
developed.
On floor production
lead time was halved
Significant less time
chasing material for
managers
Sheet Metal
Order Readiness
The quality of
production
information was
causing issues on
the shop floor and
late delivery to the
customer
Engineering change
process mapped around
the order and quotation
management process.
Functional map
established to expose
current state and wastes.
New process agreed using
the project charter
approach and stage &
gate reviews.
Order category system
introduced.
Roles and responsibility
confirmed in relation to
customer management,
quotation lead time readiness
and production change
readiness.
Production manager taking
greater ownership of order
delivery as he was involved
in the improvement process
through stage & gates.
Metric introduced on
to the shop floor to
capture the level of
readiness.
95% plus target
accuracy expected
from new standard
and people held
accountable to it.
Sheet Metal Order
Readiness (SHOR)
improved from <85% to
over 95%
Summary of projects

The Quality Gate Project
.
The Quality Gate process is an integral part of our
business and is being implemented to drive a zero-defect
culture in McAree Engineering Ltd.
In basic terms, the Quality Gate is a quality control plan
detailing inspection and validation tests that are carried out
at key points within our processes. Unlike quality control
the Quality Gate challenges the business to get to the root
cause of chronic problems and fix them permanently.
11

Customer‟s poor quality
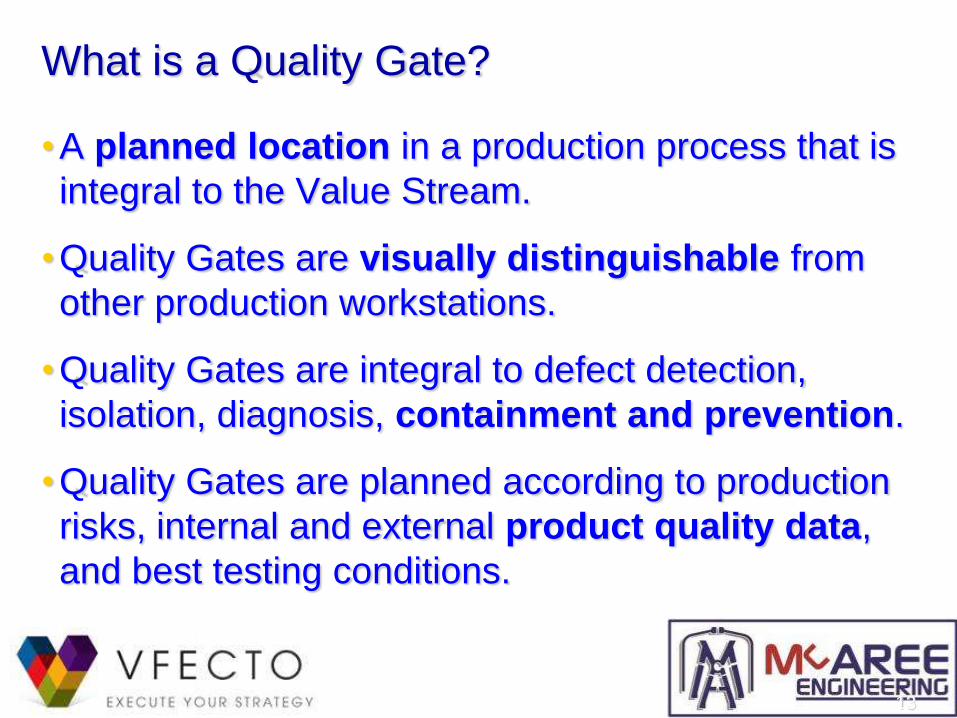
What is a Quality Gate?
•A planned location in a production process that is
integral to the Value Stream.
•Quality Gates are visually distinguishable from
other production workstations.
•Quality Gates are integral to defect detection,
isolation, diagnosis, containment and prevention.
•Quality Gates are planned according to production
risks, internal and external product quality data,
and best testing conditions.
13

14
A Quality Gate must have visual „Standards‟
QG check list
QG standard work
QG standard work
5S area standard
QG process audit
chart
5S audit chart

A Quality Gate must have visual „Performance‟
RFT daily data sheet Product drawing with pareto
quality defects
Product drawing with pareto
quality defects
Daily defects chart
Daily defects chart

A Quality Gate must fix problems
Customer quality chart
Pareto defect categories
chart
Communication & feedback
Quality alert sheets
Daily Defects per Unit chart
Defect category description

A structured team approach to solving problems
Define the Problem
Measure the Problem
Analyse the Problem
What is the Root Cause
Improve with solutions
Control the solution

A Quality Gate location is planned!

Quality Gates satisfy your customers

Benefits to our Business ?
Silo Output at 21 units p/w (peak measure) – 16 men =>13 Units, now 21 men => 21 Units
– Improved efficiency of 23% versus 2013 = €120k
Sheet Metal Output increased by 25% with no
additional resources – From 60 tonne p/w to 75 tonne p/w with capacity for more.
– Theoretical labour saving of over €150k (5 men)
Turnover and Profit at record levels
We share delivery and performance data with
customers
20
Benefits to our Business? (Cont‟d 2/2)
Visual Management Information with QG – we
have since completed another for Sheet Metal and
plan 2 more......
Recognise the value in formal Continuous
Improvement Projects
Significant upskilling of resources
Data driven decisions – “What gets measured gets
managed”
Confidence to keep going forward, and apply lean
techniques to other processes within the business
21

22

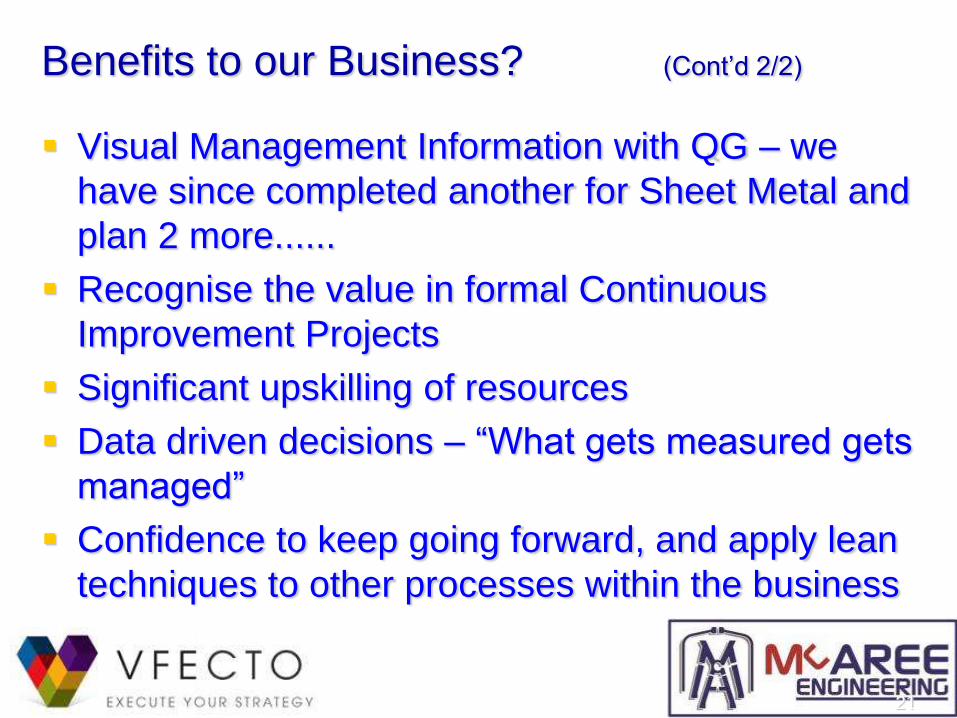
Benefits to our Business? (Cont‟d 2/2)
Visual Management Information with QG – we
have since completed another for Sheet Metal and
plan 2 more......
Recognise the value in formal Continuous
Improvement Projects
Significant upskilling of resources
Data driven decisions – “What gets measured gets
managed”
Confidence to keep going forward, and apply lean
techniques to other processes within the business
23

The Key Messages / Lessons
Absolute buy in from management and a
strong internal champion(s)
Voice of Customer – Internal and External
Continuous Process – takes time
It is not just a manufacturing “thing”
Make a good start – then build momentum
Some people will resist, some will change,
move around or beyond those that don‟t
24


![Training lean journey[1]](https://static.fdocuments.in/doc/165x107/5552a3b2b4c905d9508b456b/training-lean-journey1.jpg)


![My Lean + BIM Journey [Nathan Wood, Brazil Lean Conference]](https://static.fdocuments.in/doc/165x107/587a7cbb1a28abf0468b64a7/my-lean-bim-journey-nathan-wood-brazil-lean-conference.jpg)