MBTA FY16 Budget Update
27
Preliminary Fiscal Year 2016 Budget Update Standing Committee on Finance & Audit February 5, 2015 Leading the Nation in Transportation Excellence Massachusetts Bay Transportation Authority Ten Park Plaza, Suite 3910, Boston, MA 02116 www.mbta.com DRAFT
description
From MBTA financials page:http://www.mbta.com/about_the_mbta/financials/?id=1054
Transcript of MBTA FY16 Budget Update

Preliminary Fiscal Year 2016 Budget Update
Standing Committee on Finance & Audit
February 5, 2015
Leading the Nation in Transportation Excellence Massachusetts Bay Transportation AuthorityTen Park Plaza, Suite 3910, Boston, MA 02116
www.mbta.com
DRAFT
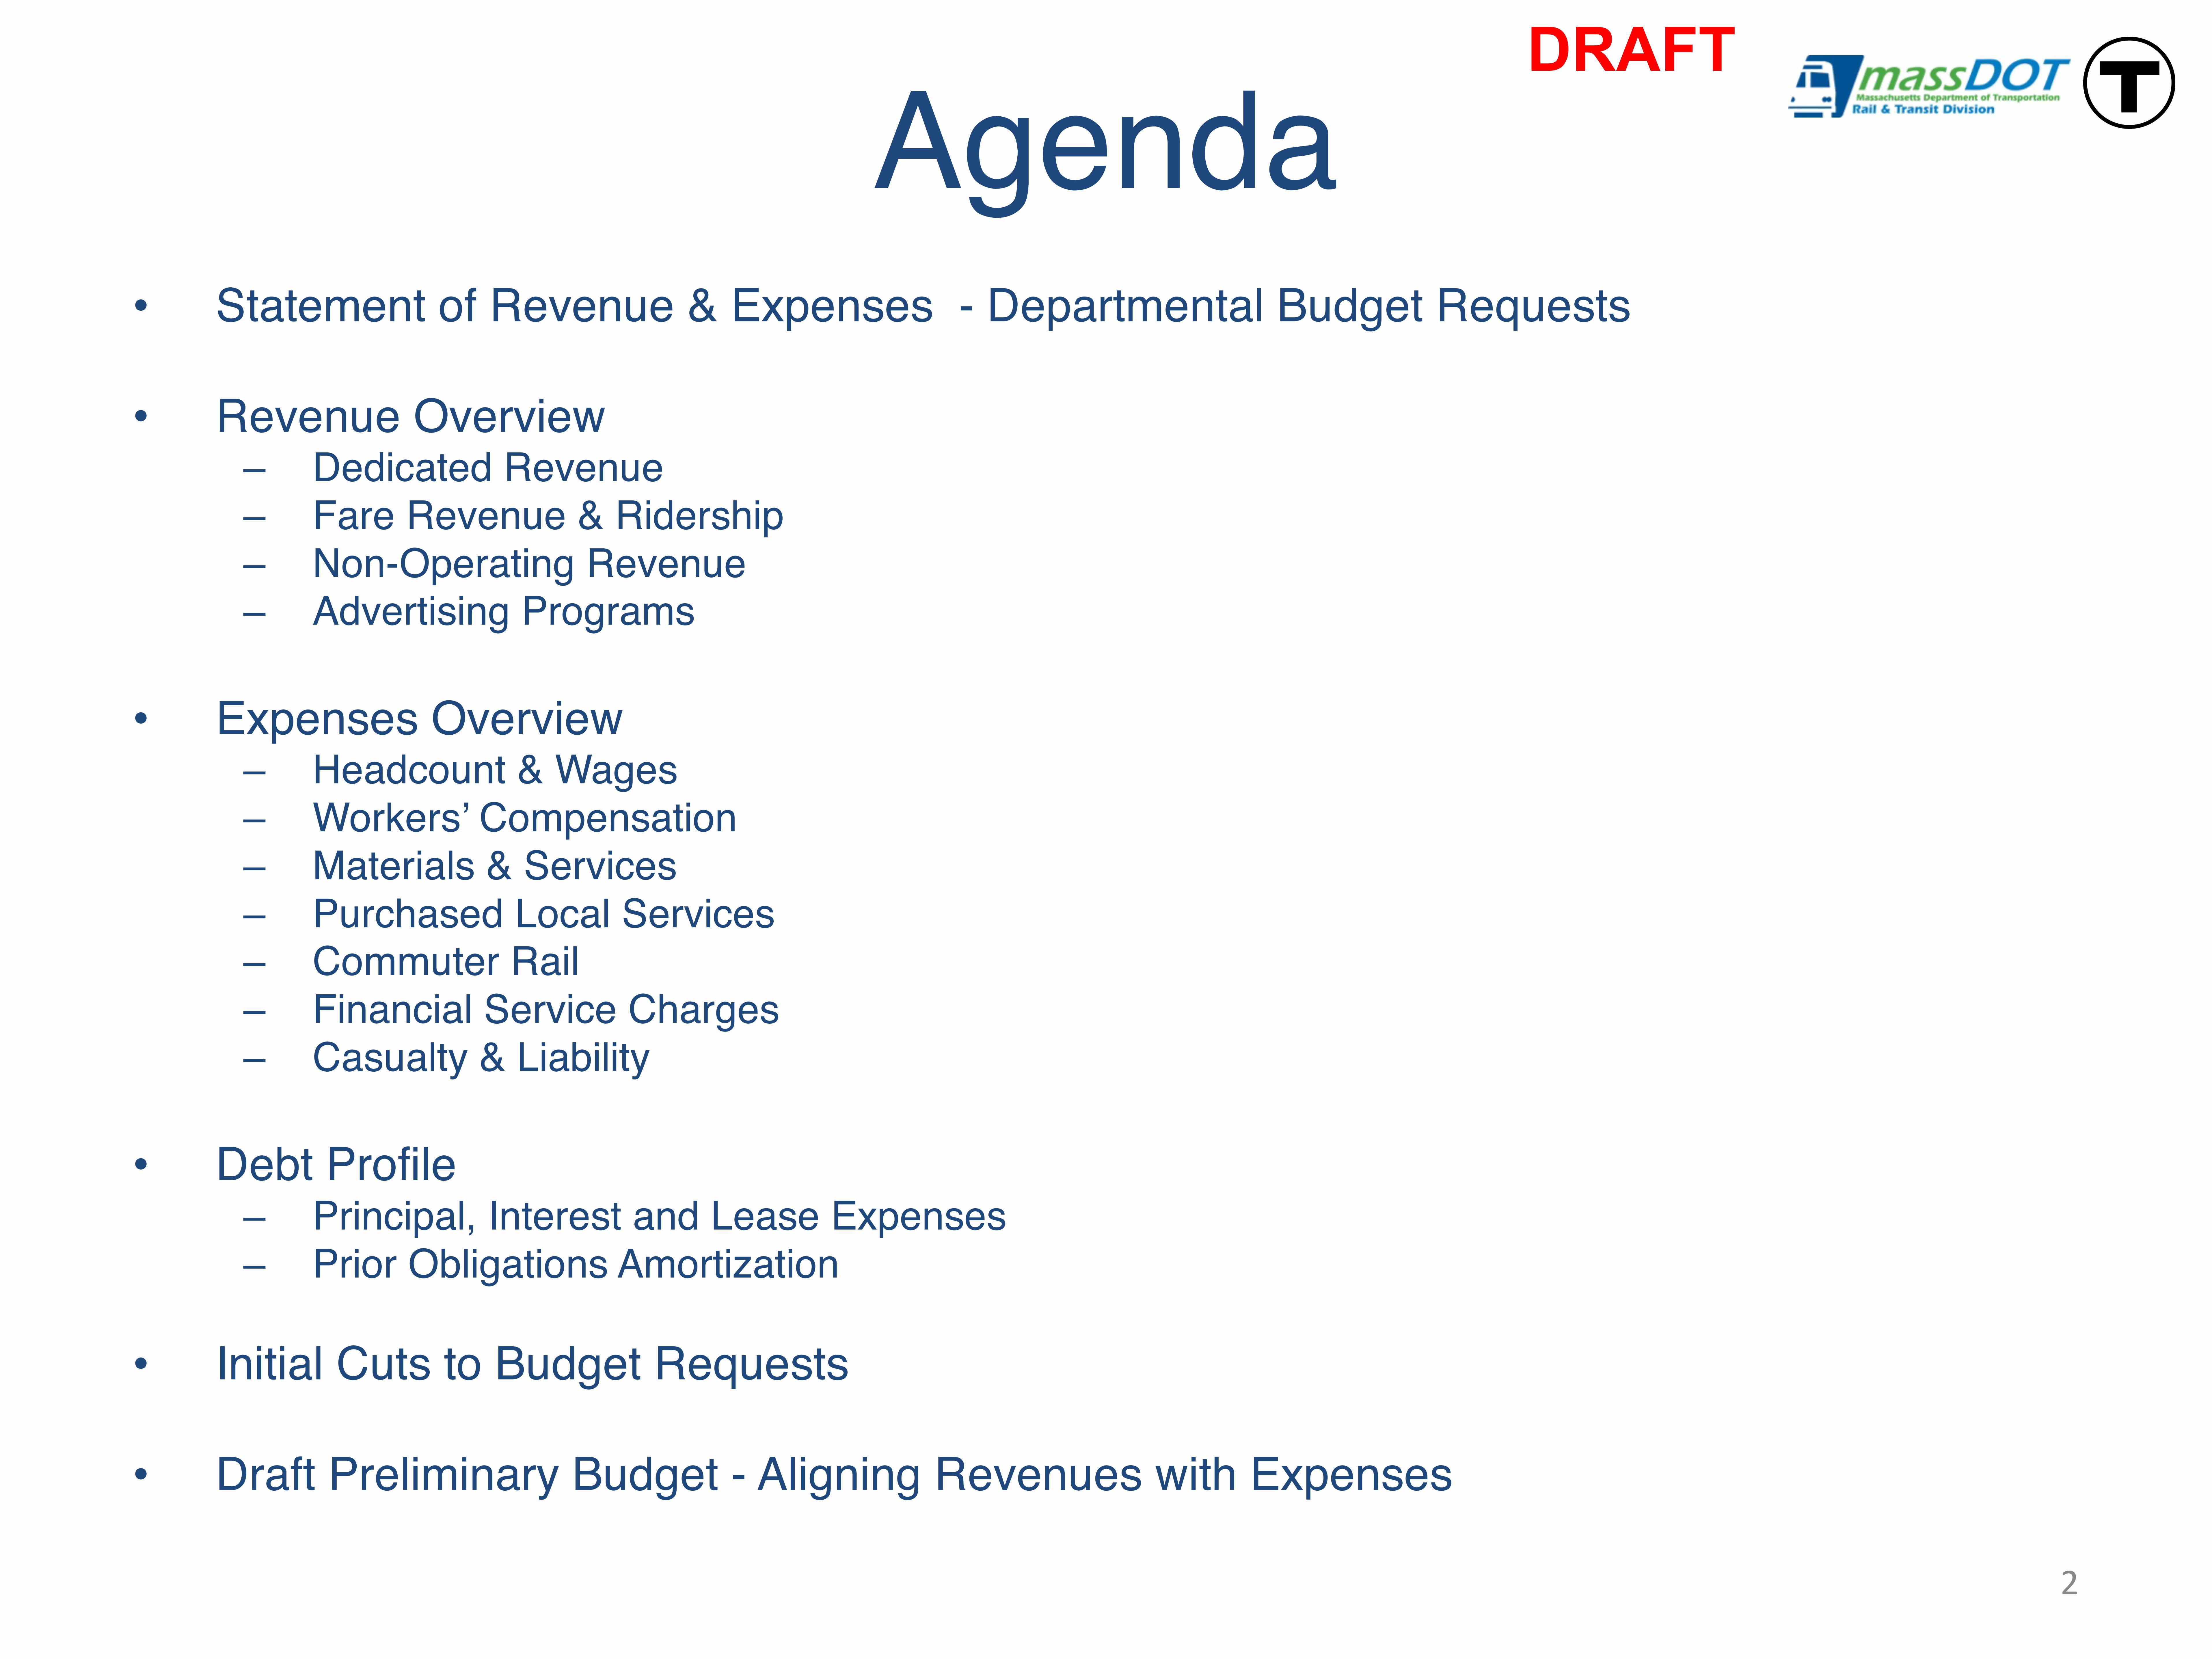
Agenda• Statement of Revenue & Expenses - Departmental Budget Requests
• Revenue Overview– Dedicated Revenue– Fare Revenue & Ridership– Non-Operating Revenue– Advertising Programs
• Expenses Overview– Headcount & Wages– Workers’ Compensation– Materials & Services– Purchased Local Services– Commuter Rail – Financial Service Charges– Casualty & Liability
• Debt Profile– Principal, Interest and Lease Expenses– Prior Obligations Amortization
• Initial Cuts to Budget Requests
• Draft Preliminary Budget - Aligning Revenues with Expenses
2
DRAFT
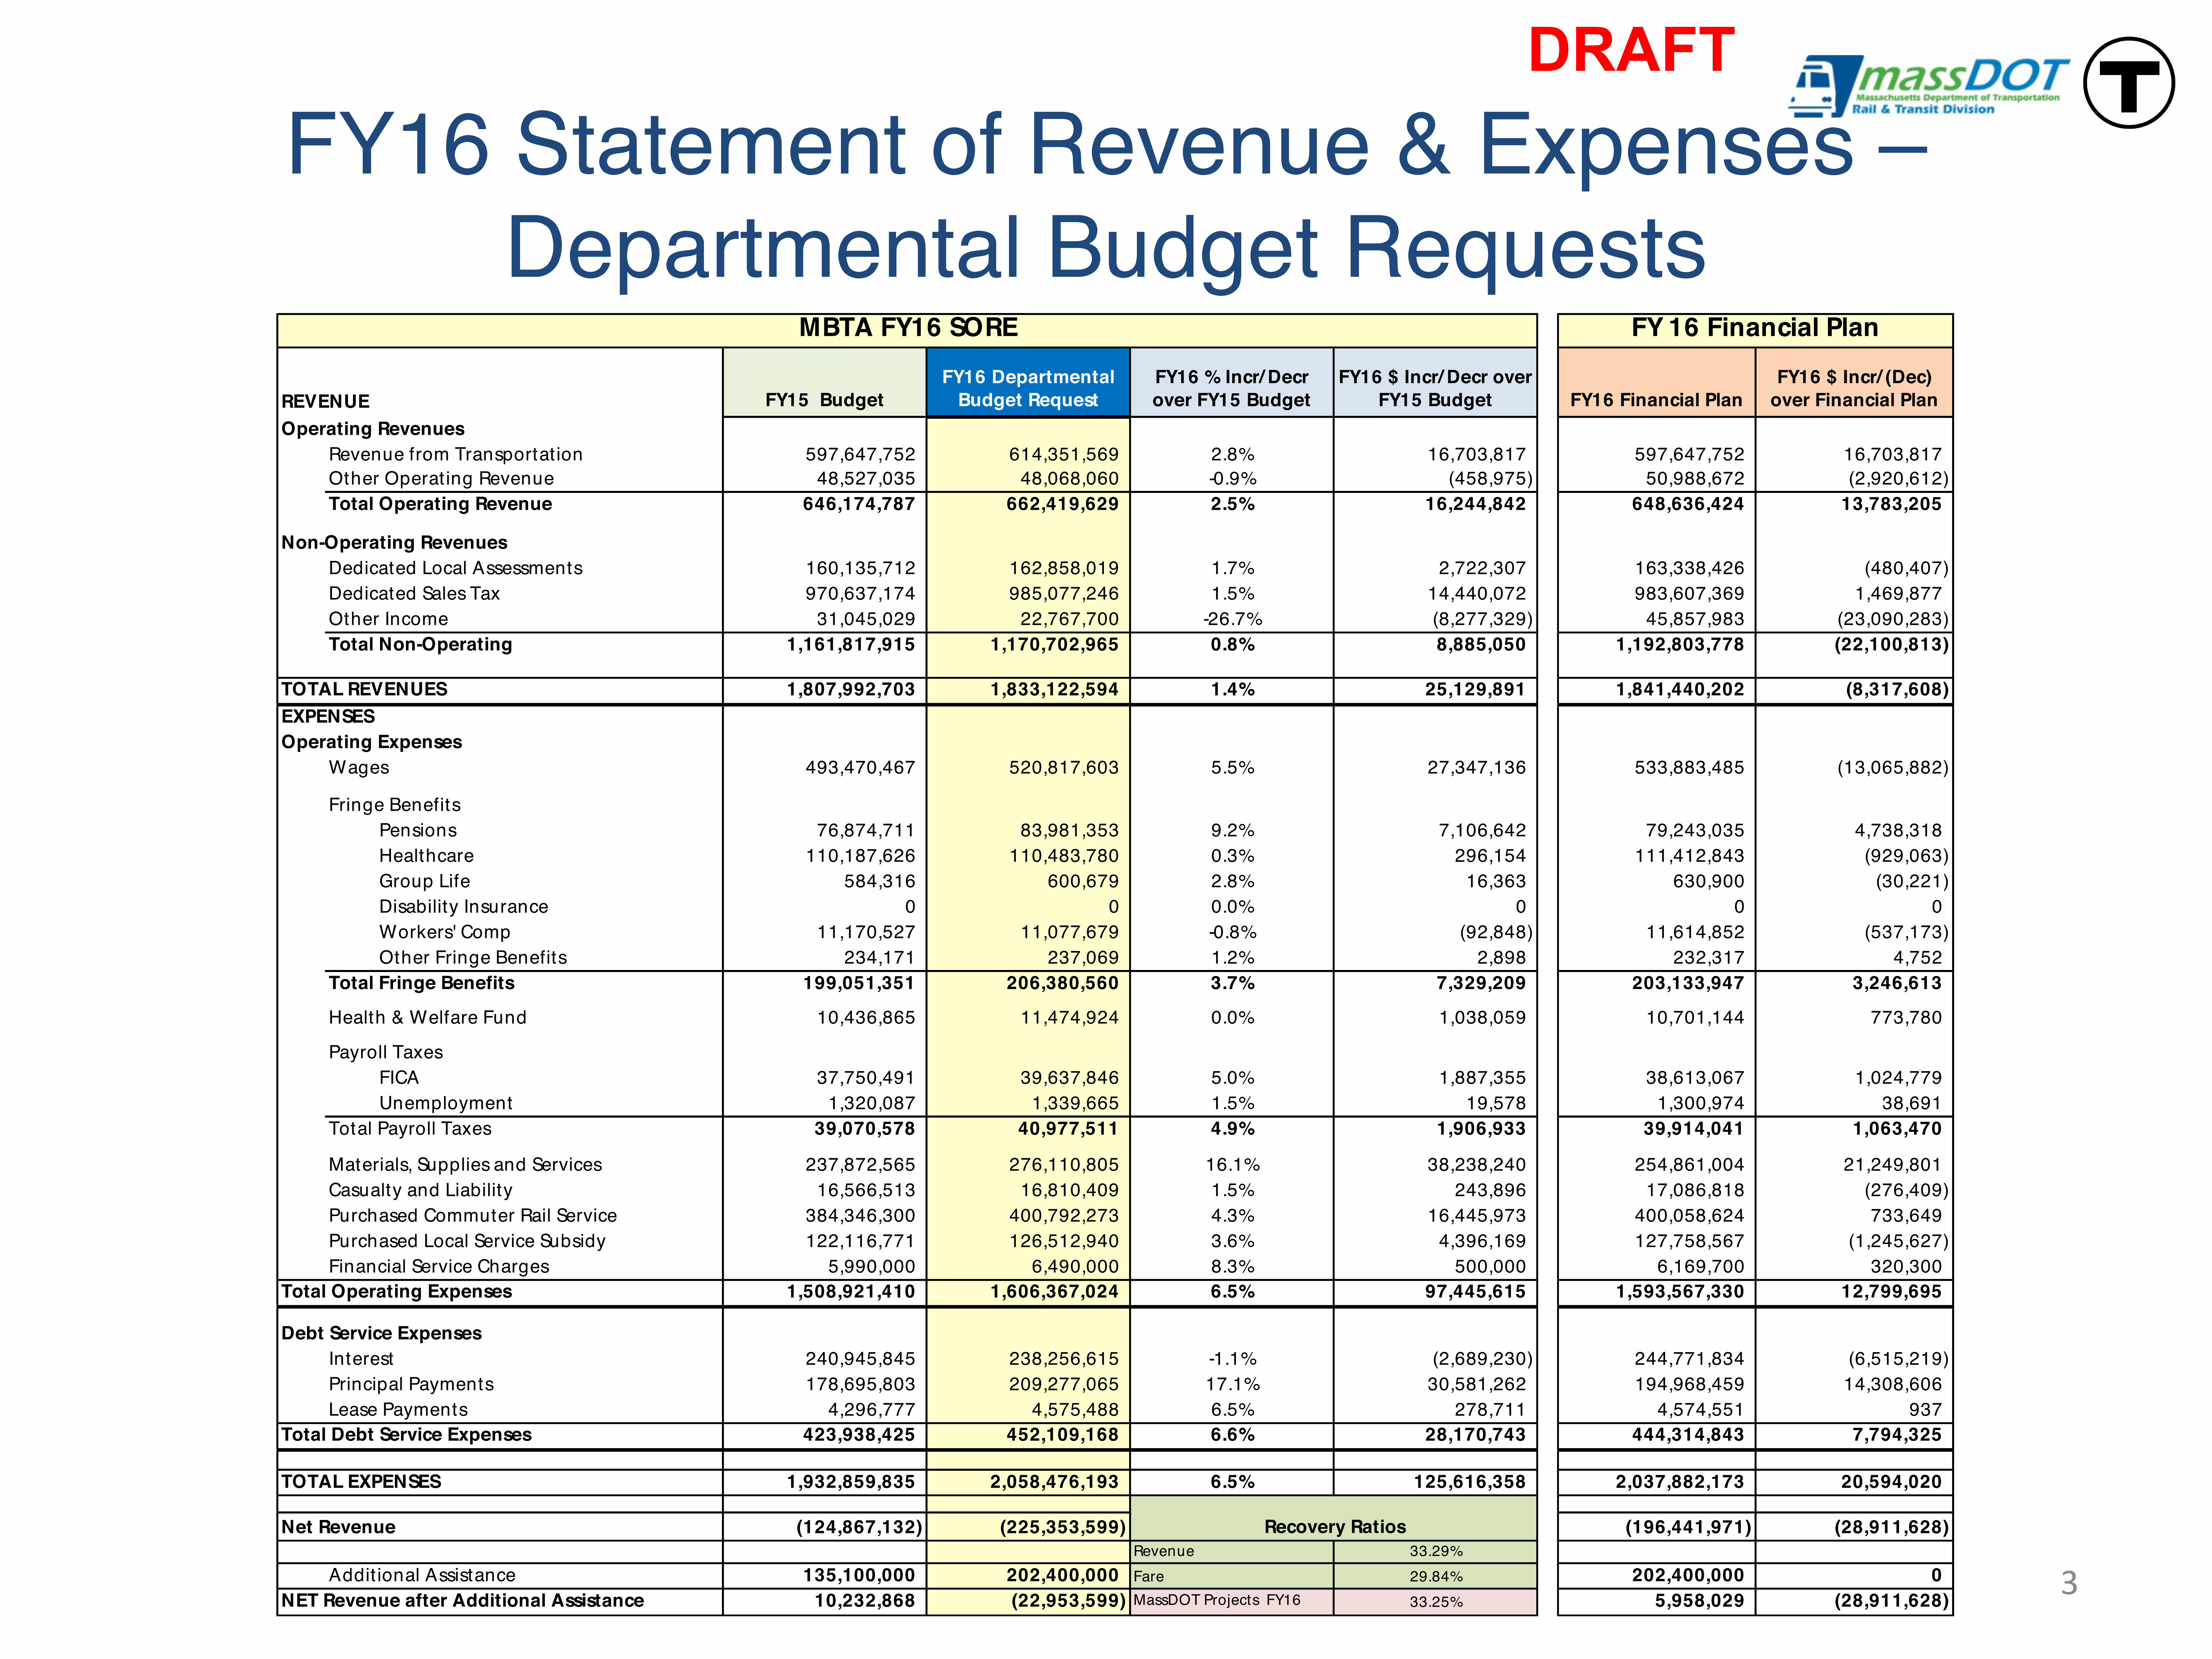
FY16 Statement of Revenue & Expenses –Departmental Budget Requests
3
DRAFT
REVENUE FY15 BudgetFY16 Departmental
Budget RequestFY16 % Incr/ Decr over FY15 Budget
FY16 $ Incr/ Decr over FY15 Budget FY16 Financial Plan
FY16 $ Incr/ (Dec) over Financial Plan
Operating RevenuesRevenue from Transportat ion 597,647,752 614,351,569 2.8% 16,703,817 597,647,752 16,703,817Other Operat ing Revenue 48,527,035 48,068,060 -0.9% (458,975) 50,988,672 (2,920,612)Total Operating Revenue 646,174,787 662,419,629 2.5% 16,244,842 648,636,424 13,783,205
Non-Operating RevenuesDedicated Local Assessments 160,135,712 162,858,019 1.7% 2,722,307 163,338,426 (480,407)Dedicated Sales Tax 970,637,174 985,077,246 1.5% 14,440,072 983,607,369 1,469,877Other Income 31,045,029 22,767,700 -26.7% (8,277,329) 45,857,983 (23,090,283)Total Non-Operating 1,161,817,915 1,170,702,965 0.8% 8,885,050 1,192,803,778 (22,100,813)
TOTAL REVENUES 1,807,992,703 1,833,122,594 1.4% 25,129,891 1,841,440,202 (8,317,608)EXPENSESOperating Expenses
Wages 493,470,467 520,817,603 5.5% 27,347,136 533,883,485 (13,065,882)
Fringe BenefitsPensions 76,874,711 83,981,353 9.2% 7,106,642 79,243,035 4,738,318Healthcare 110,187,626 110,483,780 0.3% 296,154 111,412,843 (929,063)Group Life 584,316 600,679 2.8% 16,363 630,900 (30,221)Disability Insurance 0 0 0.0% 0 0 0Workers' Comp 11,170,527 11,077,679 -0.8% (92,848) 11,614,852 (537,173)Other Fringe Benefits 234,171 237,069 1.2% 2,898 232,317 4,752
Total Fringe Benefits 199,051,351 206,380,560 3.7% 7,329,209 203,133,947 3,246,613
Health & Welfare Fund 10,436,865 11,474,924 0.0% 1,038,059 10,701,144 773,780
Payroll TaxesFICA 37,750,491 39,637,846 5.0% 1,887,355 38,613,067 1,024,779Unemployment 1,320,087 1,339,665 1.5% 19,578 1,300,974 38,691
Total Payroll Taxes 39,070,578 40,977,511 4.9% 1,906,933 39,914,041 1,063,470
Materials, Supplies and Services 237,872,565 276,110,805 16.1% 38,238,240 254,861,004 21,249,801Casualty and Liability 16,566,513 16,810,409 1.5% 243,896 17,086,818 (276,409)Purchased Commuter Rail Service 384,346,300 400,792,273 4.3% 16,445,973 400,058,624 733,649Purchased Local Service Subsidy 122,116,771 126,512,940 3.6% 4,396,169 127,758,567 (1,245,627)Financial Service Charges 5,990,000 6,490,000 8.3% 500,000 6,169,700 320,300
Total Operating Expenses 1,508,921,410 1,606,367,024 6.5% 97,445,615 1,593,567,330 12,799,695
Debt Service ExpensesInterest 240,945,845 238,256,615 -1.1% (2,689,230) 244,771,834 (6,515,219)Principal Payments 178,695,803 209,277,065 17.1% 30,581,262 194,968,459 14,308,606Lease Payments 4,296,777 4,575,488 6.5% 278,711 4,574,551 937
Total Debt Service Expenses 423,938,425 452,109,168 6.6% 28,170,743 444,314,843 7,794,325
TOTAL EXPENSES 1,932,859,835 2,058,476,193 6.5% 125,616,358 2,037,882,173 20,594,020
Net Revenue (124,867,132) (225,353,599) (196,441,971) (28,911,628)Revenue 33.29%
Addit ional Assistance 135,100,000 202,400,000 Fare 29.84% 202,400,000 0NET Revenue after Additional Assistance 10,232,868 (22,953,599) MassDOT Projects FY16 33.25% 5,958,029 (28,911,628)
MBTA FY16 SORE FY 16 Financial Plan
Recovery Ratios

FY 2016 Revenue OverviewDedicated Sales Tax RevenuePursuant to MBTA’s enabling act, Dedicated Sales Tax receipts to
MBTA are the greater of the base revenue amount (BRA) or the dedicated sales tax revenue amount, which is 16% of statewide sales tax excluding the meals tax. An additional $160 million (previously a separate appropriation) was added to the BRA ($810,637,174) commencing in FY2015 and resetting the BRA to the amount of $970,637,174.
State AssistanceAdditional assistance projected to be provided by the
Commonwealth from Transportation Finance legislation.
Fare RevenuesRevenue generated from transportation services provided by the
Authority.
Non-fare RevenuesRevenue generated from advertising, parking and income from
real estate operations.
Local AssessmentsRevenue generated from the communities served by the MBTA.
All communities associated with the Authority must contribute to the MBTA.
4
Dedicated State Sales Tax Revenue
$985.1 48%
Local Assessments
$162.9 8%
Non-fare Revenues
$70.8 4%
Fare Revenues $614.4 30%
State Assistance$202.4 10%
State Contribution$ Amount % of Revenue
$1.2 Billion 58%
State and Local Funding = $1.35 BillionTotal Revenue = $2.03 Billion
DRAFT

FY 2016 Dedicated Sales Tax Revenue
5
600,000,000
650,000,000
700,000,000
750,000,000
800,000,000
2001 2002 2003 2004 2005 2006 2007 2008 2009 2010 2011 2012 2013 2014 2015
$ In Millions 2001 2002 2003 2004 2005 2006 2007 2008 2009 2010 2011 2012 2013 2014 2015BRA¹ 645 664 684 684 705 713 734 756 767 767 767 779 787 799 811
Dedicated Sales Tax¹ 655 639 639 642 666 684 692 691 648 637 655 670 682 728 771 est. 2
YOY % Change in Dedicated Sales Tax 5.3% -2.5% 0.1% 0.5% 3.6% 2.6% 1.1% -0.1% -6.6% -1.7% 2.7% 2.4% 1.7% 6.7% 5.9%
est.
___________________________1. Amounts are from POS;; BRA for FY15 was confirmed February 28, 2014.2. FY15 Dedicated Sales Tax is an estimate based upon Office of Comptroller report dated February 28, 2014.
DRAFT

FY 2016 Fare Revenue & Ridership
6
Fiscal A ct ual/ A verage FareYear Project ion Ridersh ip Fare Revenue
FY 2013 A ct ual 391,879,047 $1.44 $564,560,142
FY 2014 A ct ual 397,161,378 $1.45 $576,686,288
FY 2015 Forecast 400,527,210 $1.51 $606,007,645
FY 2016 Project ion 409,123,337 $1.51 $617,848,214
Total - All Modes
System-wide ridership from FY2013 to FY2014 increased by 1.3%. FY2015 is forecast to increase at more moderate levels—0.8%, which is lower than FY2014 due to impacts from the July 2014 fare increase. FY2016 is expected to see ridership growth at a rate of 2.1% if recent trends hold.
For most modes, the baseline ridership growth is sufficient to offset impacts of the 5% fare increase from July 2014. In the case of bus, growth rate from FY2013 to FY2014 was lower than other modes at 0.9%, and so when combined with the July 2014 fare increase, the FY2015 forecast is for a slight 0.7% decrease in ridership. Without a fare increase in FY2016 bus ridership is projected to grow by 2.6%.
380,000,000 385,000,000 390,000,000 395,000,000 400,000,000 405,000,000 410,000,000
FY 2013FY 2014FY 2015 Fcst
FY 2016 Proj
Total - All Modes
228,000,000 232,000,000 236,000,000 240,000,000 244,000,000 248,000,000 252,000,000
FY 2013FY 2014FY 2015 Fcst
FY 2016 Proj
Rapid Transit
100,000,000
104,000,000
108,000,000
112,000,000
116,000,000
120,000,000
FY 2013FY 2014FY 2015 Fcst
FY 2016 Proj
Bus
34,000,000 34,500,000 35,000,000 35,500,000 36,000,000 36,500,000 37,000,000 37,500,000
FY 2013 FY 2014 FY 2015 Fcst
FY 2016 Proj
Commuter Rail
1,150,000
1,250,000
1,350,000
1,450,000
1,550,000
FY 2013 FY 2014 FY 2015 Fcst
FY 2016 Proj
Commuter Boat
DRAFT

FY 2016 Other Revenue
Advertising$16.2 23%
South Station$0.1 0%
Parking$17.2 24%
Interest Income$1.6 2%
Real Estate$12.5 18%
Utility Reimbursements
$2.1 3%
GLX, Gas Rebates, Cape Flyer
$15.9 22%
Massport Silverline$2.0 3% MassDOT
Interagency Share$3.2 5%
Total Non-Operating Revenue
$70.8 Million
7
Operating Revenue* $31.1 $32.6 $31.8 $31.6 $32.6Parking Securitization ($15.8) ($15.4) ($15.4) ($15.4) ($15.4)Parking Net Revenue $15.3 $17.2 $16.4 $16.2 $17.2
*Note: Operating Revenue is net of Operating Costs
Revenue Type
FY 12 Actual
FY13 Actual
FY14 Actual
FY15 Budget
FY16 Budget
Advertising $11.4 $13.5 $14.9 $16.2 $16.2
Parking* $15.3 $17.2 $16.4 $16.2 $17.2
Real Estate $14.2 $16.1 $13.6 $13.3 $12.5
All Other $57.4 $80.2 $25.9 $33.9 $24.9
DRAFT

FY 2016 Advertising Programs
8
Con t ract or Type of Revenue Descr ip t ionTit an Syst emw ide adver t ising Sells al l adver t ising on all rap id t ransit , t rol ley , bus and
commut er rai l st at ions and p lat forms, bot h above and below g round . Includes carcards, bus k ings, bus queens, veh icle w raps, d ig it al.
Mar
keti
ng
Clear Channel A dver t ising in "New St at ions" w h ich includes A irpor t , Cou r t house,
Wor ld Trade St at ions and d isp lay screen syst em of t he Sou t h St at ion
Kiosk syst em
Sells al l adver t ising at t he fol low ing st at ions: A irpor t , Cou r t house, Wor ld Trade St at ions and d isp lay screen syst em of t he Sou t h St at ion Kiosk syst em
Mun icipal Med ia Solu t ions Web A dver t ising License for al l w eb adver t ising on mb t a.comWardMaps Merchand ising sales License t o develop , manage, and market MBTA b randed
merchand ise on line and t h rough t h ird -par t y ret ailers
Filming and Samp ling Syst emw ide Includes revenue f rom f i lms using MBTA p roper t y , and organ izat ions t hat p rov ide samp le p roduct s t o MBTA r iders on t he p remises
Cemusa Inc. Bus Shelt ers License for 207 cu r ren t bus shelt ers & 25 f reest and ing panels at MBTA st ops. A n add it ional 35 bus shelt ers w il l be inst alled du r ing FY16.
MRG
Clear Channel Bil lboards License for 165 ou t door b il lboard locat ions (bot h st at ic and d ig it al).
CBS Ou t door (Former ly know n as Van Wagner
Commun icat ion )
Sponsorsh ip License for adver t ising r igh t s on 5 MBTA bu ild ings/ st ruct u re locat ions w here t here is a t ot al of 8 ou t door adver t ising panels.
DRAFT

FY 2016 Operating ExpensesTotal Operating Expenses
$1.606 Billion
9
Wages and Benefits$779.7 49%
Materials, Supplies & Services$276.1 17%Casualty &
Liability$16.8 1%
Commuter Rail Services$400.8 25%
Purchased Local Service
Expenses$126.5
8%
Financial Services
$6.5 0%
Health & Welfare Fund
FY 16 Budget Description
Medicare Part B $5.8 M Arbitrator’s Award
Dental $2.9M Status Quo
Vision $1.1M Status Quo
Life Insurance $1.6M Status Quo
Total $11.5M
Wages & Benefits
FY 16 Budget % of Total Budget
Wages $520.8M 32%
Healthcare $110.5M 7%
Pensions $84.0M 5%
Payroll Taxes $41.2M 3%
Health & Welfare Fund $11.5M 1%
Workers Comp $11.1M 1%
Group Life Insurance $0.6M .07%
Total $779.7M 49%
Medical: Group Insurance Commission
Pensions: Grandfathered 23 years New Hires 25 years , Age 55
DRAFT

FY 2016 Headcount & WagesHeadcount Increases
Bus Transportation +71Light Rail +62Police +21ITD +14Transit Facility Maintenance +11Vehicle Maintenance +19
Wage IncreasesCollective Bargaining $15.7MBus Transportation $3.8MLight Rail $4.6MPolice $1.7MBus Maintenance $1.1MRail Maintenance $653K
Headcount FY15 Budget
FY 16 Budget Difference
Operating 6,046 6,285 239
Capital 532 532 0
Total 6,578 6,817 239
FY15 Budget
FY 16 Budget Difference
Total Wages $493,470,467 $520,817,603 $27,347,136
10
DRAFT

FY 2016 Workers’ Compensation
Workers’ Compensation BudgetFY 2012 – FY 2016
1,278 1,344 1,254 1,329 1,408
149139
125133
141
337380
373395
418
792 825 756 801 849
FY 2012 Actual
FY 2013 Actual
FY 2014 Actual
FY 2015 Projected
FY 2016 Projected
Medical On ly (No Lost Time) Lost Time (6 or More Days)
Medical On ly (1-5 Days Lost Time)
Workers’ Compensation CaseloadFY 2012 – FY 2016
11
DRAFT

FY 2016 Materials & ServicesBy Spending Category
12
All Other Materials & Services
$35.6 13%
Maintenance$99.9 36%
Building Rent$2.8 1%
Agency Review Program$3.0 1%
Utility Costs$80.5 29%
Contract Cleaning$25.4 9%
Uniforms$2.5 1% IT
$23.6 9%
Public Safety$2.8 1%
Total Materials & Services Expenses$276.1 Million
DRAFT

FY 2016 Materials & ServicesBy Department and Category
13
Department E&M Maintenance Ut ilit ies Uniforms Cont ract
Cleaning
Agency Review
ProgramRent IT Public Safety
Other Materials &
ServicesTotal
Operat ions 99,894,655 22,758,086 2,044,730 25,384,702 0 0 0 0 6,668,625 156,750,798Environment 0 53,821,301 0 0 0 0 0 0 1,238,544 55,059,845
Informat ion Technology 0 3,823,272 0 0 0 0 23,551,339 0 0 27,374,612St rategic Innovat ion 0 0 0 0 0 0 0 0 6,967,708 6,967,708
Finance 0 10,200 25,000 0 3,000,000 0 0 0 2,810,761 5,845,961Legal 0 0 0 0 0 0 0 0 4,623,572 4,623,572
Interagency 0 0 0 0 0 0 0 0 3,711,345 3,711,345Public Safety 0 107,820 436,532 8,556 0 0 0 2,807,632 0 3,360,540Real Estate 0 0 0 0 0 2,813,894 0 0 33,428 2,847,322
Design & Const ruct ion 0 0 0 0 0 0 0 0 2,107,410 2,107,410System-Wide Accessibilit y 0 0 0 0 0 0 0 0 1,832,620 1,832,620
Materials 0 2,500 3,800 0 0 0 0 0 1,604,304 1,610,604Human Resources 0 1,200 0 0 0 0 0 0 1,589,438 1,590,638
Diversity 0 0 0 0 0 0 0 0 857,223 857,223Public Affairs/ Customer Service 0 0 5,000 0 0 0 0 0 779,678 784,678
General Manager 0 600 0 0 0 0 0 0 565,700 566,300OCC & Train ing 0 0 0 0 0 0 0 0 219,630 219,630
Total 99,894,655 80,524,980 2,515,062 25,393,258 3,000,000 2,813,894 23,551,339 2,807,632 35,609,986 276,110,805
DRAFT

FY 2016 Materials & Services
14
Bus Maintenance - $27.5MPreventive & Corrective Maintenance for Bus Fleet, Tires, Rims, Lubricants
Subway Maintenance - $15.1MRed LineSpin Slide Unit, Floor Blower, Door LocksOrange LineDoor Locks, Propulsion Relay, HVAC, Air CompressorsBlue LineDoor Monitoring System, Tread BrakesGreen LineAir Compressor Assemblies, Battery Replacement, ASI Control Boards
Everett Main Repairs Shop - $16.8MReplace and Repair Truck Motors, Painting and Body Repair on 200 Buses, Brakes, Suspensions, Axels, A/C & Heating Supplies
Maintenance of Way - $4.5MRail Grinding, Platform Gap Analysis, Ties, Tree Service, Rubbish Removal
Transit Facilities Maintenance - $25.2MRoof Repairs, Emergency Environmental Services, Ventilation, Hazardous Material Transport & Disposal, Support for Fareboxes and Sales Devices
Power Systems Maintenance - $5.8MDistribution Cables, Duct Bank Repair, Manhole Repairs, Gas Turbine Repairs
Signals & Communications - $4.9MSignal Bungalows Upgrade, Tunnel Lighting, Rewiring Woodland, Waban, Eliot, Newton Highlands, Newton Centre and Chestnut Hill, Signal Cutover at Reservoir and Beaconsfield Stations, System-Wide Upgrades for Vent Fans, Elevators, Escalators and Controls
DRAFT
Maintenance Costs - $99.9 Million
FY 2016 Materials & Services
15
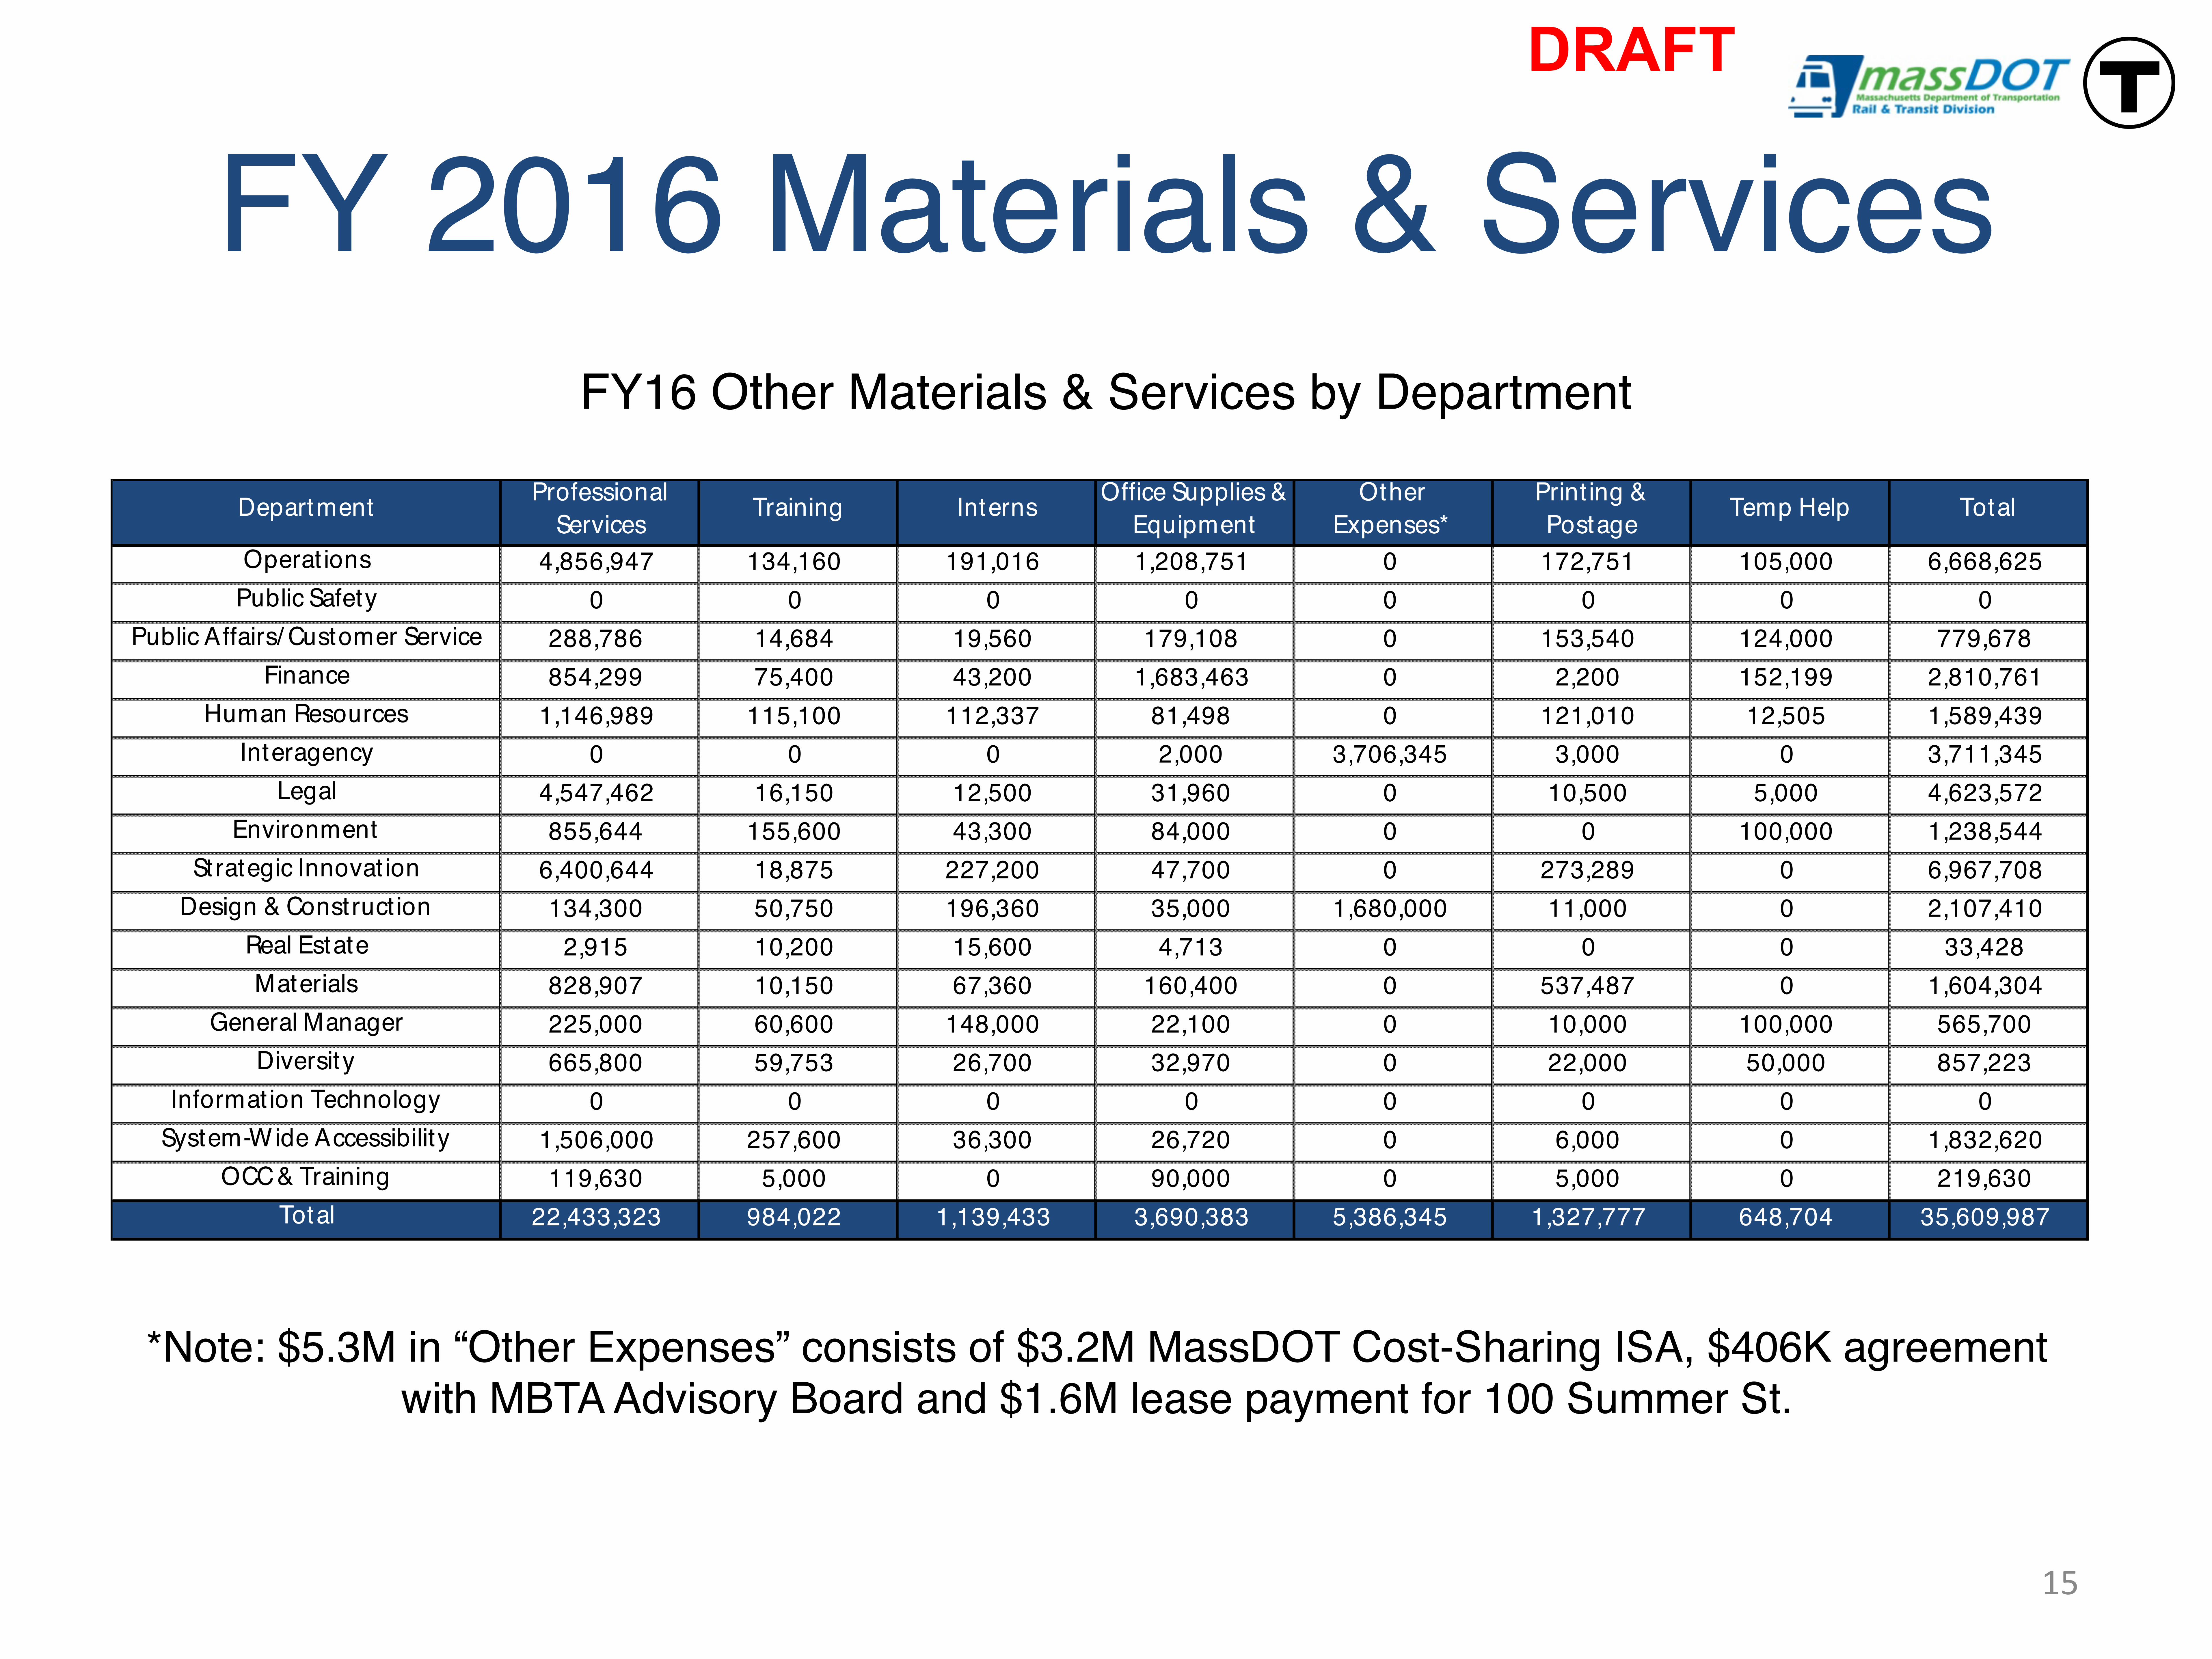
FY16 Other Materials & Services by Department
Department Professional Services Training Interns Office Supplies &
EquipmentOther
Expenses*Print ing & Postage Temp Help Total
Operat ions 4,856,947 134,160 191,016 1,208,751 0 172,751 105,000 6,668,625Public Safety 0 0 0 0 0 0 0 0
Public Affairs/ Customer Service 288,786 14,684 19,560 179,108 0 153,540 124,000 779,678Finance 854,299 75,400 43,200 1,683,463 0 2,200 152,199 2,810,761
Human Resources 1,146,989 115,100 112,337 81,498 0 121,010 12,505 1,589,439Interagency 0 0 0 2,000 3,706,345 3,000 0 3,711,345
Legal 4,547,462 16,150 12,500 31,960 0 10,500 5,000 4,623,572Environment 855,644 155,600 43,300 84,000 0 0 100,000 1,238,544
Strategic Innovat ion 6,400,644 18,875 227,200 47,700 0 273,289 0 6,967,708Design & Construct ion 134,300 50,750 196,360 35,000 1,680,000 11,000 0 2,107,410
Real Estate 2,915 10,200 15,600 4,713 0 0 0 33,428Materials 828,907 10,150 67,360 160,400 0 537,487 0 1,604,304
General Manager 225,000 60,600 148,000 22,100 0 10,000 100,000 565,700Diversity 665,800 59,753 26,700 32,970 0 22,000 50,000 857,223
Informat ion Technology 0 0 0 0 0 0 0 0System-Wide Accessibility 1,506,000 257,600 36,300 26,720 0 6,000 0 1,832,620
OCC & Training 119,630 5,000 0 90,000 0 5,000 0 219,630Total 22,433,323 984,022 1,139,433 3,690,383 5,386,345 1,327,777 648,704 35,609,987
DRAFT
*Note: $5.3M in “Other Expenses” consists of $3.2M MassDOT Cost-Sharing ISA, $406K agreement with MBTA Advisory Board and $1.6M lease payment for 100 Summer St.

FY 2016 Materials & Services
16
FY16 Professional Services by DepartmentDepartment Engineering
Services Project Support Background Checks
Trade Organizat ion Memberships
Audit Services Legal Services Advert isingMaintaining Property/
EquipmentSecurity Total
Operat ions 527,818 2,617,923 0 0 0 0 29,500 1,606,706 75,000 4,856,947Public Safety 0 0 0 0 0 0 0 0 0
Public Affairs/ Customer Service 0 212,500 120 4,500 0 0 40,000 31,666 0 288,786Finance 0 308,932 0 13,200 494,865 0 12,000 16,302 9,000 854,299
Human Resources 0 1,013,264 1,000 6,500 0 0 5,500 120,725 0 1,146,989Interagency 0 0 0 0 0 0 0 0 0 0
Legal 0 827,562 0 21,800 0 3,698,100 0 0 0 4,547,462Environment 0 50,000 0 0 0 134,144 0 671,500 0 855,644
Strategic Innovat ion 0 4,146,489 0 232,670 0 0 8,000 2,013,485 0 6,400,644Design & Construct ion 0 134,300 0 0 0 0 0 0 0 134,300
Real Estate 0 0 0 0 0 0 0 2,915 0 2,915Materials 0 806,000 0 8,500 0 0 0 14,407 0 828,907
General Manager 0 168,500 1,000 25,000 0 10,000 15,000 5,500 0 225,000Diversity 0 635,500 0 15,300 0 15,000 0 0 0 665,800
Informat ion Technology 0 0 0 0 0 0 0 0 0 0System-Wide Accessibility 0 1,429,000 0 0 0 75,000 1,000 1,000 0 1,506,000
OCC & Training 0 119,630 0 0 0 0 0 0 0 119,630Total 527,818 12,469,600 2,120 327,470 494,865 3,932,244 111,000 4,484,206 84,000 22,433,323
DRAFT
FY 2016 Materials & Services
17
DRAFT
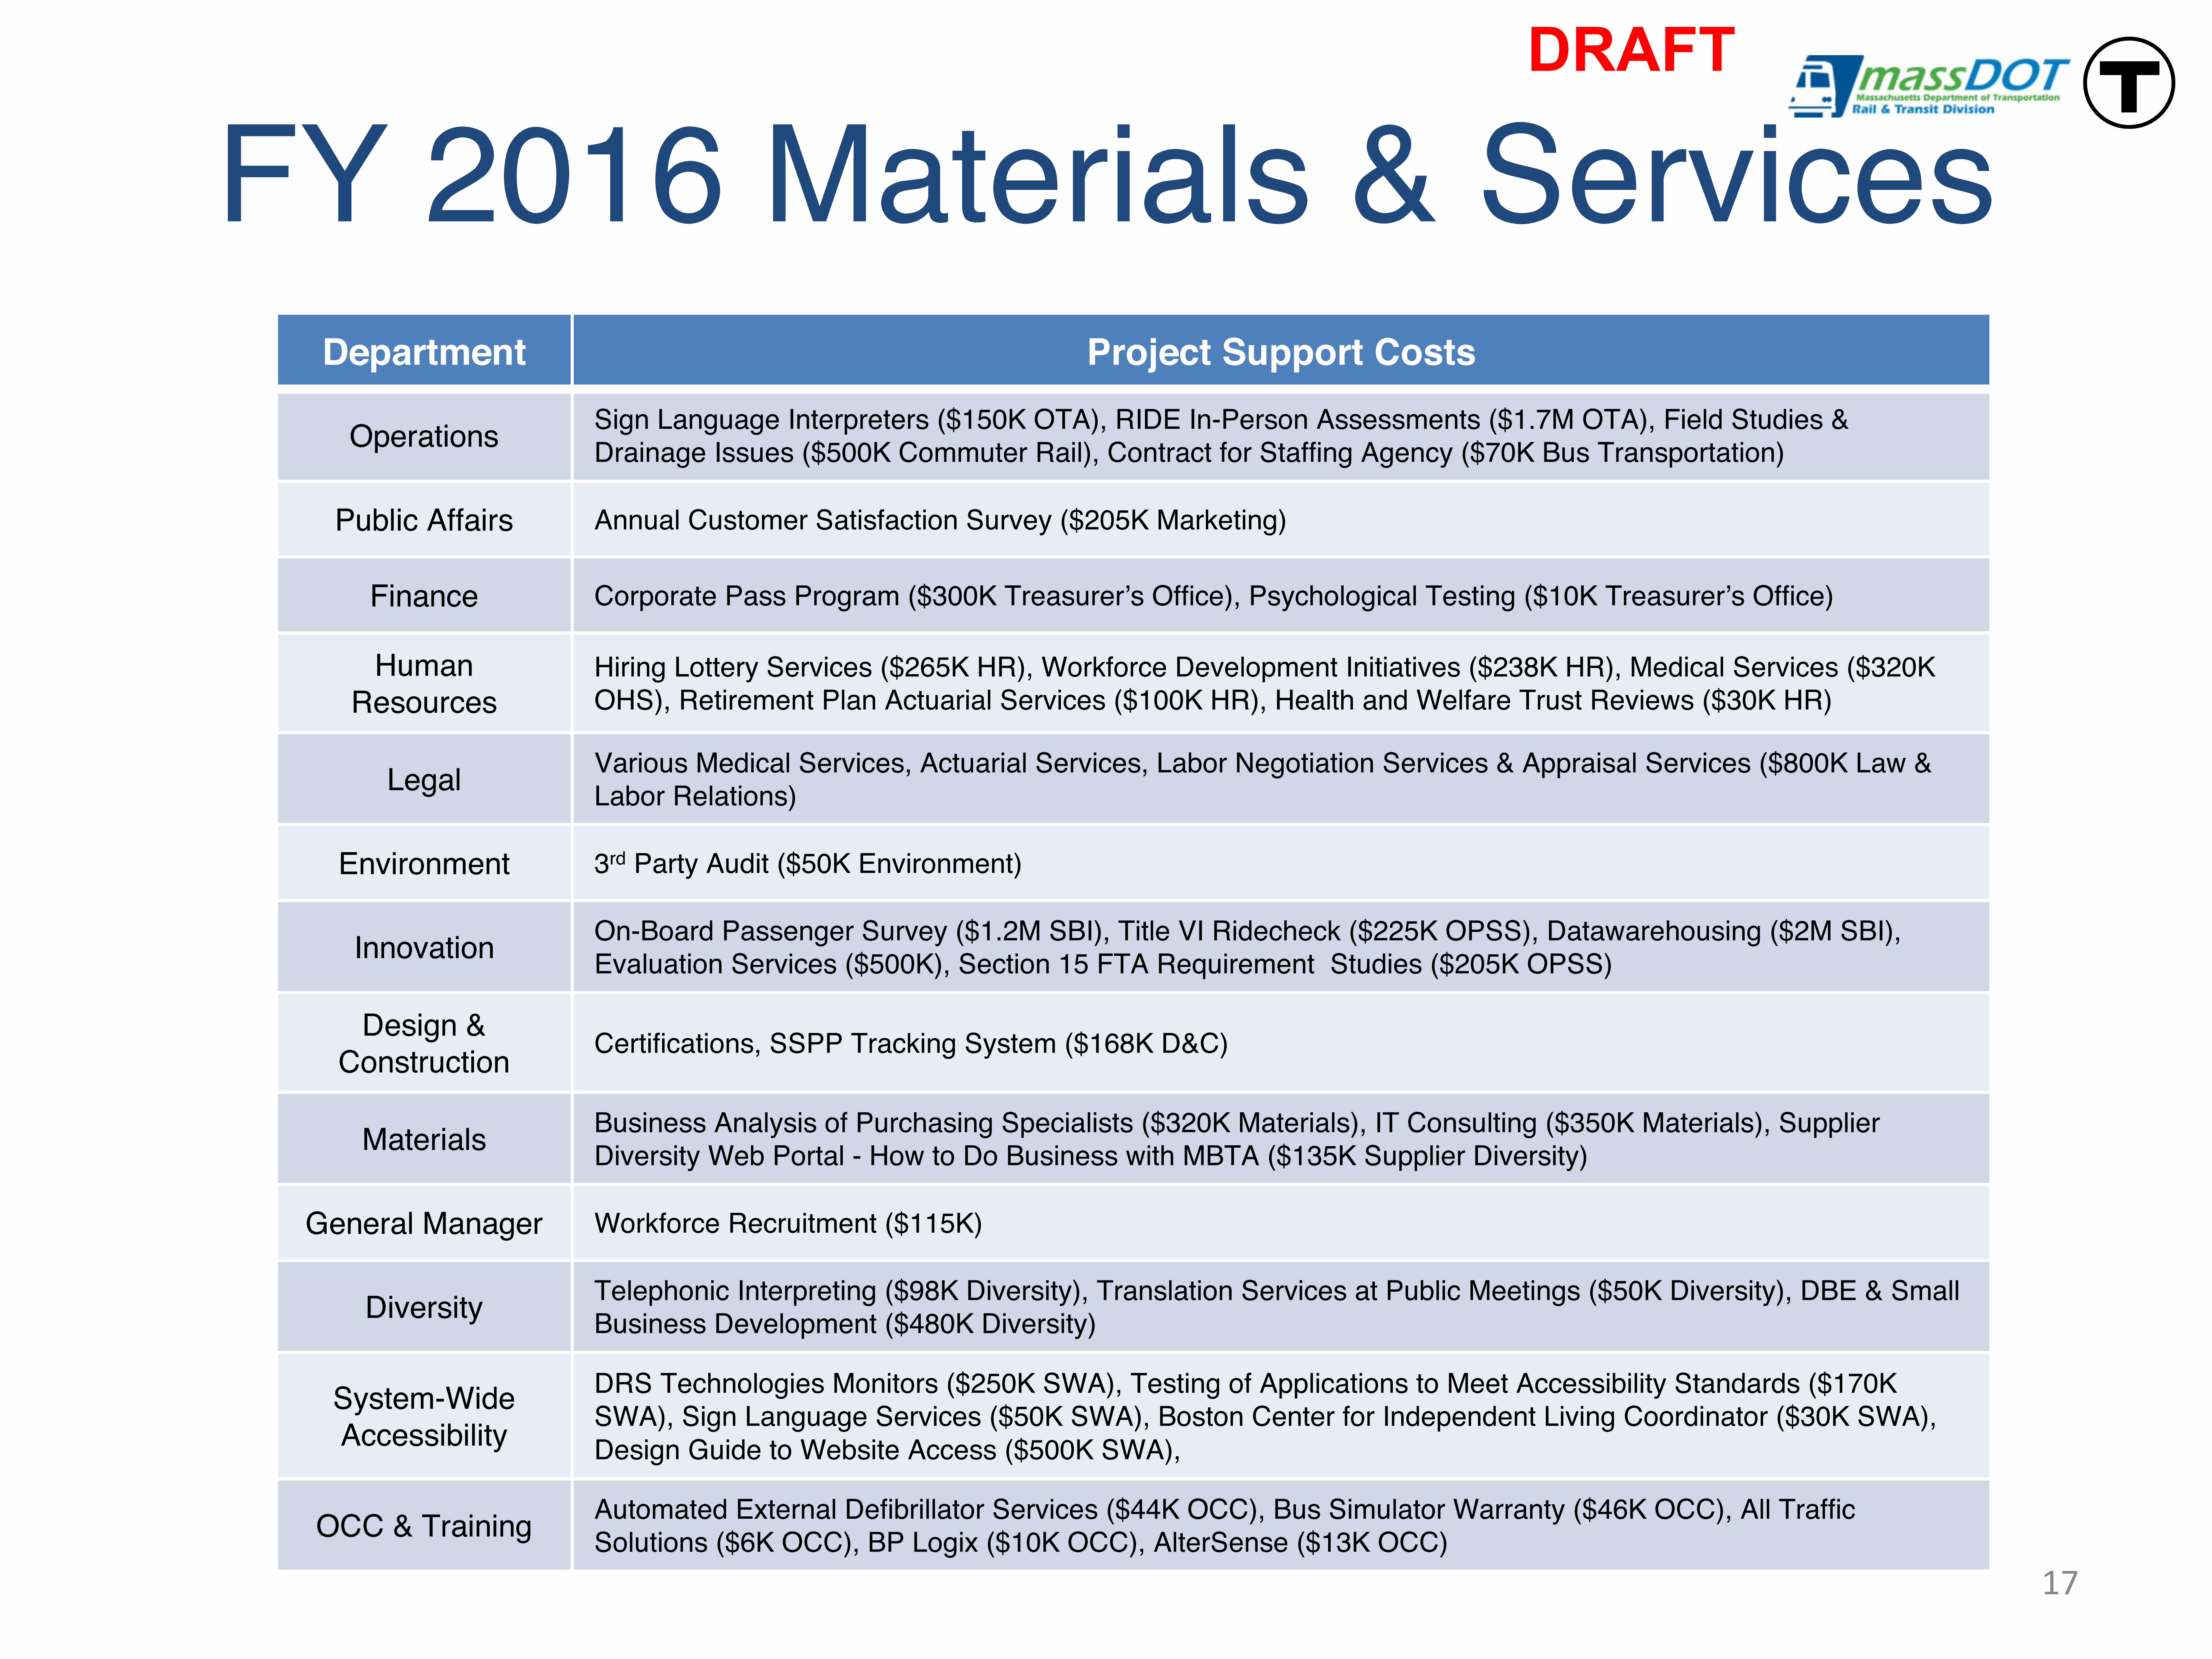
Department Project Support Costs
Operations Sign Language Interpreters ($150K OTA), RIDE In-Person Assessments ($1.7M OTA), Field Studies & Drainage Issues ($500K Commuter Rail), Contract for Staffing Agency ($70K Bus Transportation)
Public Affairs Annual Customer Satisfaction Survey ($205K Marketing)
Finance Corporate Pass Program ($300K Treasurer’s Office), Psychological Testing ($10K Treasurer’s Office)
Human Resources
Hiring Lottery Services ($265K HR), Workforce Development Initiatives ($238K HR), Medical Services ($320K OHS), Retirement Plan Actuarial Services ($100K HR), Health and Welfare Trust Reviews ($30K HR)
Legal Various Medical Services, Actuarial Services, Labor Negotiation Services & Appraisal Services ($800K Law & Labor Relations)
Environment 3rd Party Audit ($50K Environment)
Innovation On-Board Passenger Survey ($1.2M SBI), Title VI Ridecheck ($225K OPSS), Datawarehousing ($2M SBI), Evaluation Services ($500K), Section 15 FTA Requirement Studies ($205K OPSS)
Design & Construction Certifications, SSPP Tracking System ($168K D&C)
Materials Business Analysis of Purchasing Specialists ($320K Materials), IT Consulting ($350K Materials), Supplier Diversity Web Portal - How to Do Business with MBTA ($135K Supplier Diversity)
General Manager Workforce Recruitment ($115K)
Diversity Telephonic Interpreting ($98K Diversity), Translation Services at Public Meetings ($50K Diversity), DBE & Small Business Development ($480K Diversity)
System-Wide Accessibility
DRS Technologies Monitors ($250K SWA), Testing of Applications to Meet Accessibility Standards ($170K SWA), Sign Language Services ($50K SWA), Boston Center for Independent Living Coordinator ($30K SWA), Design Guide to Website Access ($500K SWA),
OCC & Training Automated External Defibrillator Services ($44K OCC), Bus Simulator Warranty ($46K OCC), All Traffic Solutions ($6K OCC), BP Logix ($10K OCC), AlterSense ($13K OCC)

FY 2016 Purchased Local Services
Service FY13 Actual FY14 Actual FY15 Budget FY16 Budget $ Increase over prior year
% Increase over prior year
THE RIDE $100,730,091 $105,923,101 $105,373,056 $110,936,812 $5,563,756 5.28%
Commuter Boat $10,003,730 $12,854,128 $14,282,703 $13,072,639 ($1,210,064) -8.47%
Private Carrier Bus $2,082,554 $2,217,765 $2,261,600 $2,296,100 $34,500 1.53%
Suburban Bus $199,119 $184,413 $199,412 $207,390 $7,978 4.00%
Total Subsidy $113,015,494 $121,179,407 $122,116,771 $126,512,941 $4,396,170 3.60%
Provides door-to-door, shared-ride transportation to eligible people who cannot use fixed-route transit all or some of the time because of a physical or cognitive disability. By combining an innovative Request for Proposals process, and in-depth and rigorous procurement process, and strategic policy changes, the MBTA secured three contracts to provide RIDE services through 2019.
The MBTA’s ferry services are provided by a contract operator and governed by operating agreements administered by the MBTA Railroad Operations & Water Transportation Department. The service is comprised of three routes and seven docks categorized into two service types: Inner Harbor Ferry (Charlestown Navy Yard to Long Wharf) & Commuter Boats (serve Hingham, Rowes Wharf, Long Wharf, Hull, and Logan Airport).
Consists of MBTA-funded bus routes which were taken over by the MBTA when previous operators were no longer able to continue. These routes are operated by private contractors (Paul Revere & Joseph’s Transportation currently) and were awarded through a bidding process. The Winthrop routes are operated using 35-foot transit buses, while the others are operated with smaller vehicles.
A subsidy program that provides partial support to municipalities that contract to provide transportation services, typically in areas which are not extensively served by MBTA transit services.
DRAFT
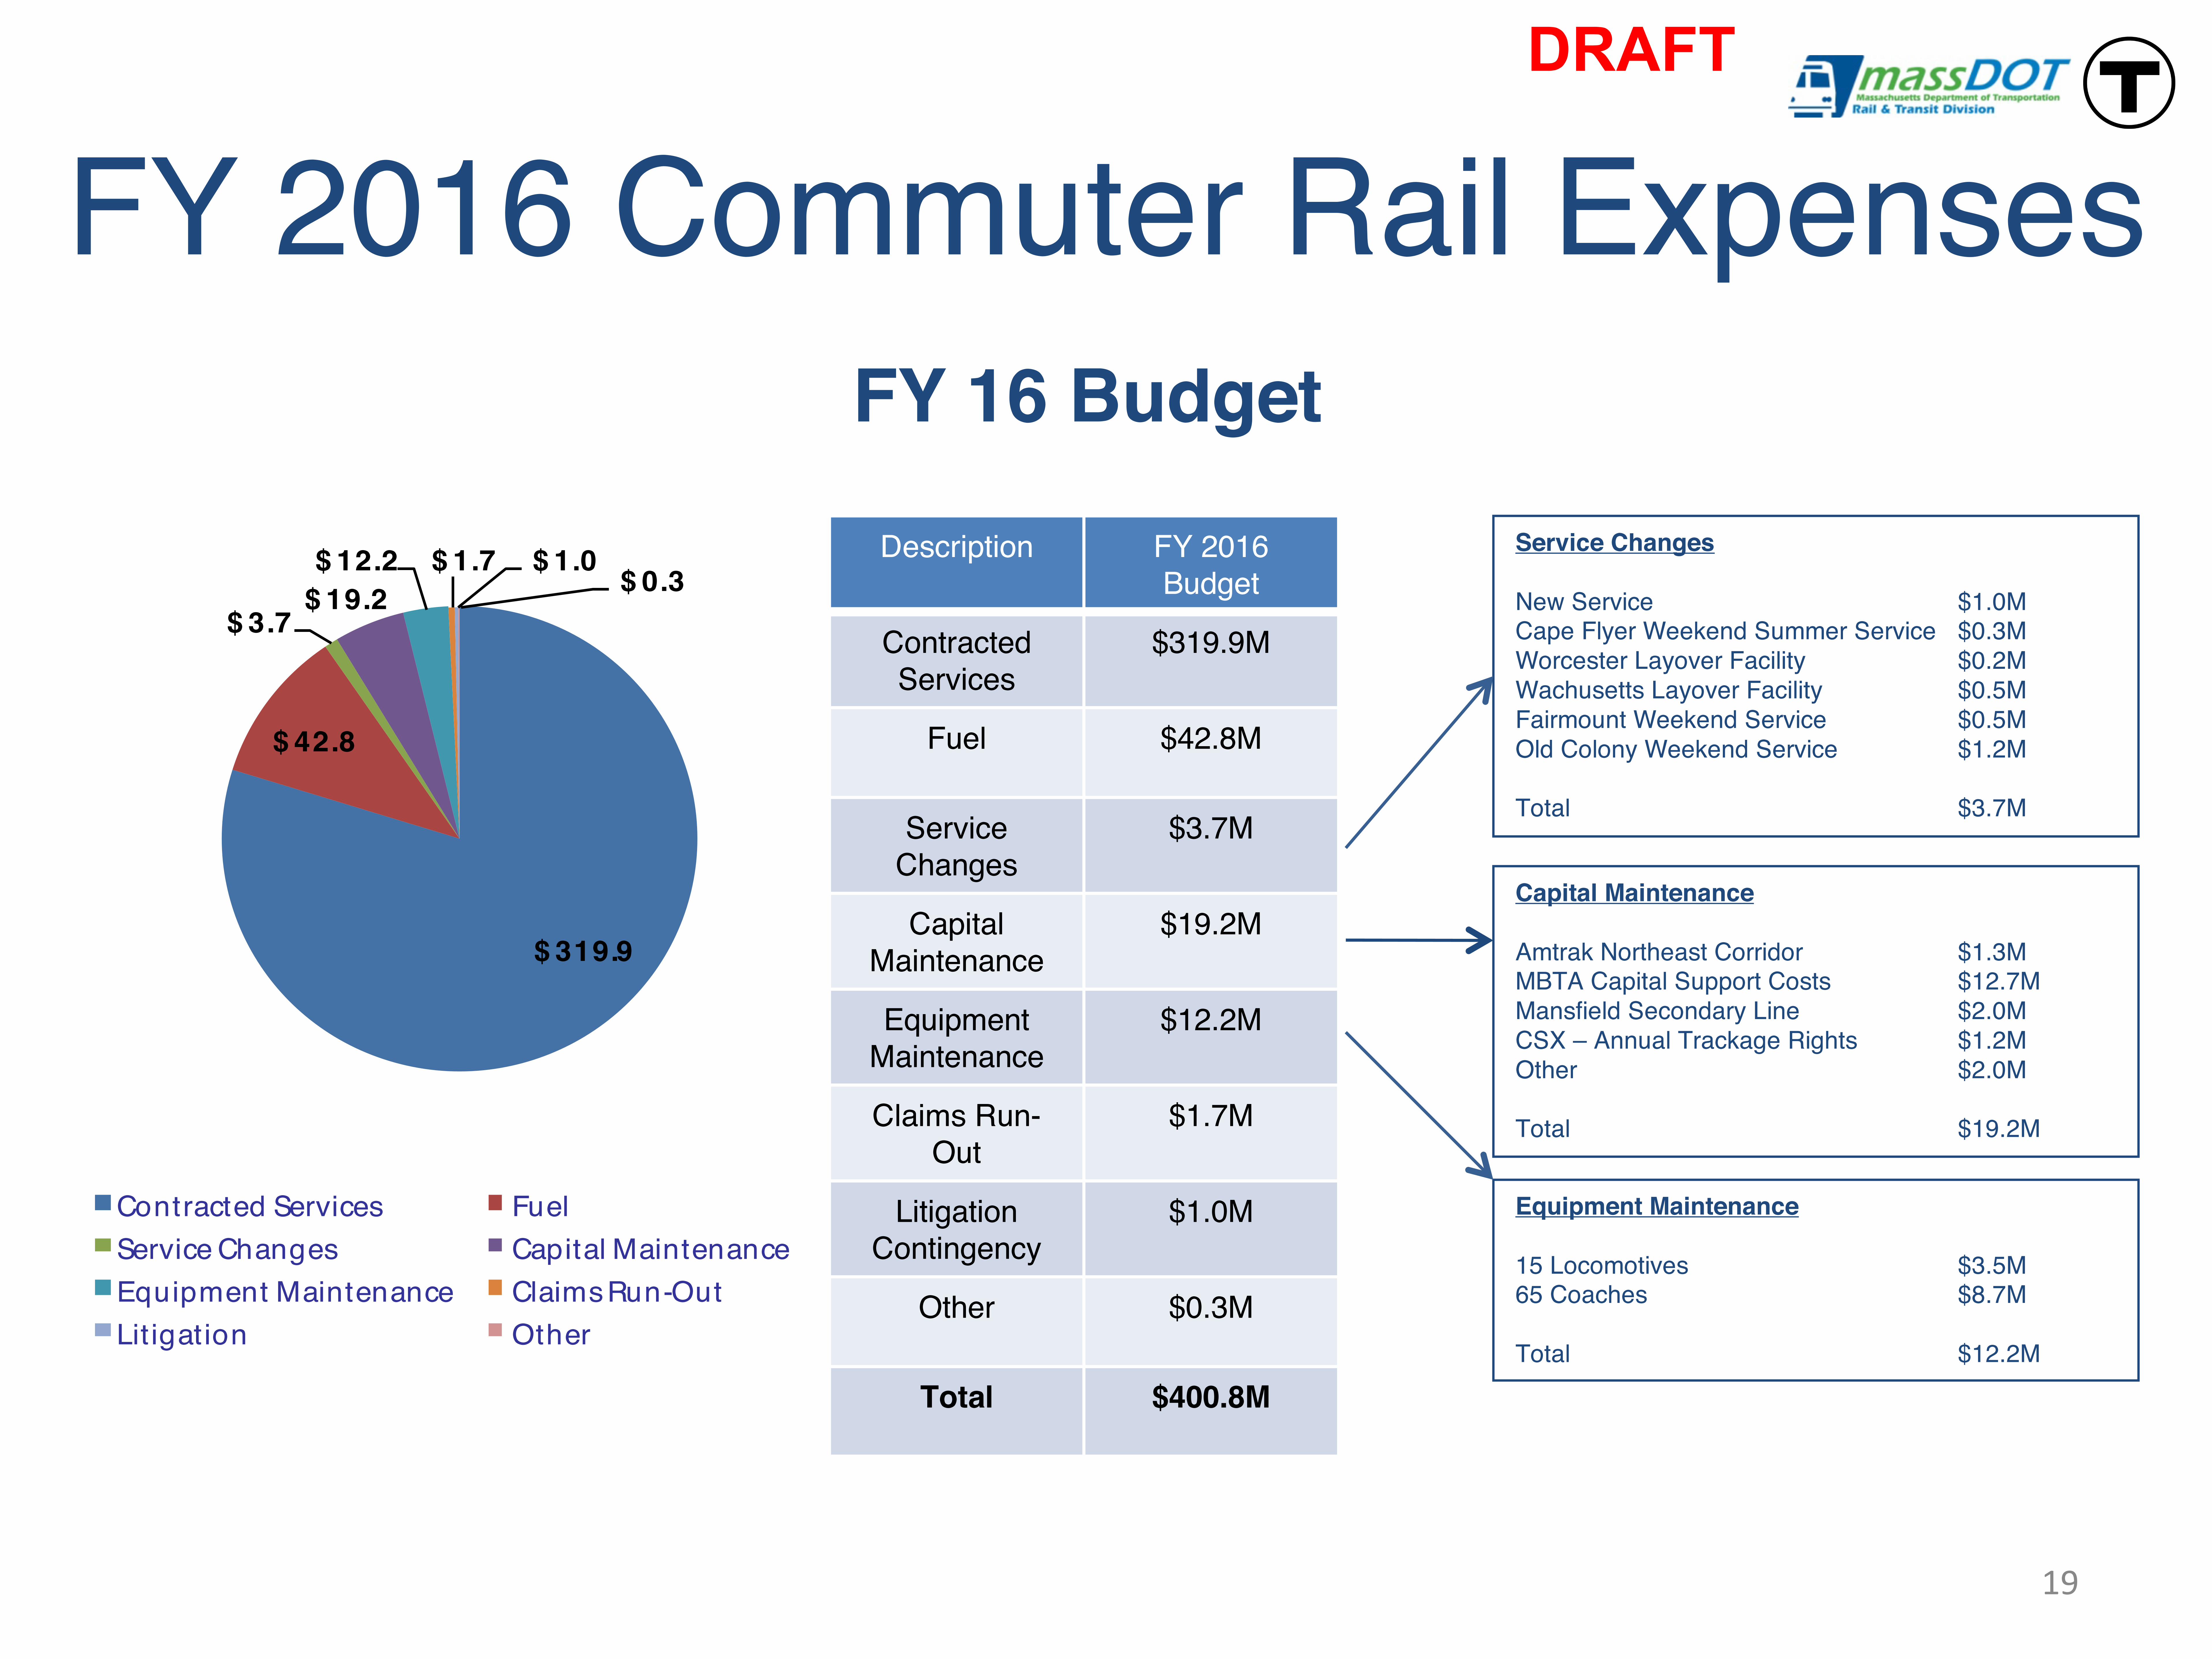
FY 2016 Commuter Rail ExpensesFY 16 Budget
$ 319.9
$ 42.8
$ 3.7 $ 19.2 $ 12.2 $ 1.7 $ 1.0
$ 0.3
Contracted Services FuelService Changes Capital MaintenanceEquipment Maintenance Claims Run-OutLit igation Other
Description FY 2016 Budget
Contracted Services
$319.9M
Fuel $42.8M
Service Changes
$3.7M
Capital Maintenance
$19.2M
EquipmentMaintenance
$12.2M
Claims Run-Out
$1.7M
Litigation Contingency
$1.0M
Other $0.3M
Total $400.8M
Capital Maintenance
Amtrak Northeast Corridor $1.3MMBTA Capital Support Costs $12.7MMansfield Secondary Line $2.0MCSX – Annual Trackage Rights $1.2MOther $2.0M
Total $19.2M
Service Changes
New Service $1.0MCape Flyer Weekend Summer Service $0.3MWorcester Layover Facility $0.2MWachusetts Layover Facility $0.5MFairmount Weekend Service $0.5MOld Colony Weekend Service $1.2M
Total $3.7M
Equipment Maintenance
15 Locomotives $3.5M65 Coaches $8.7M
Total $12.2M
19
DRAFT
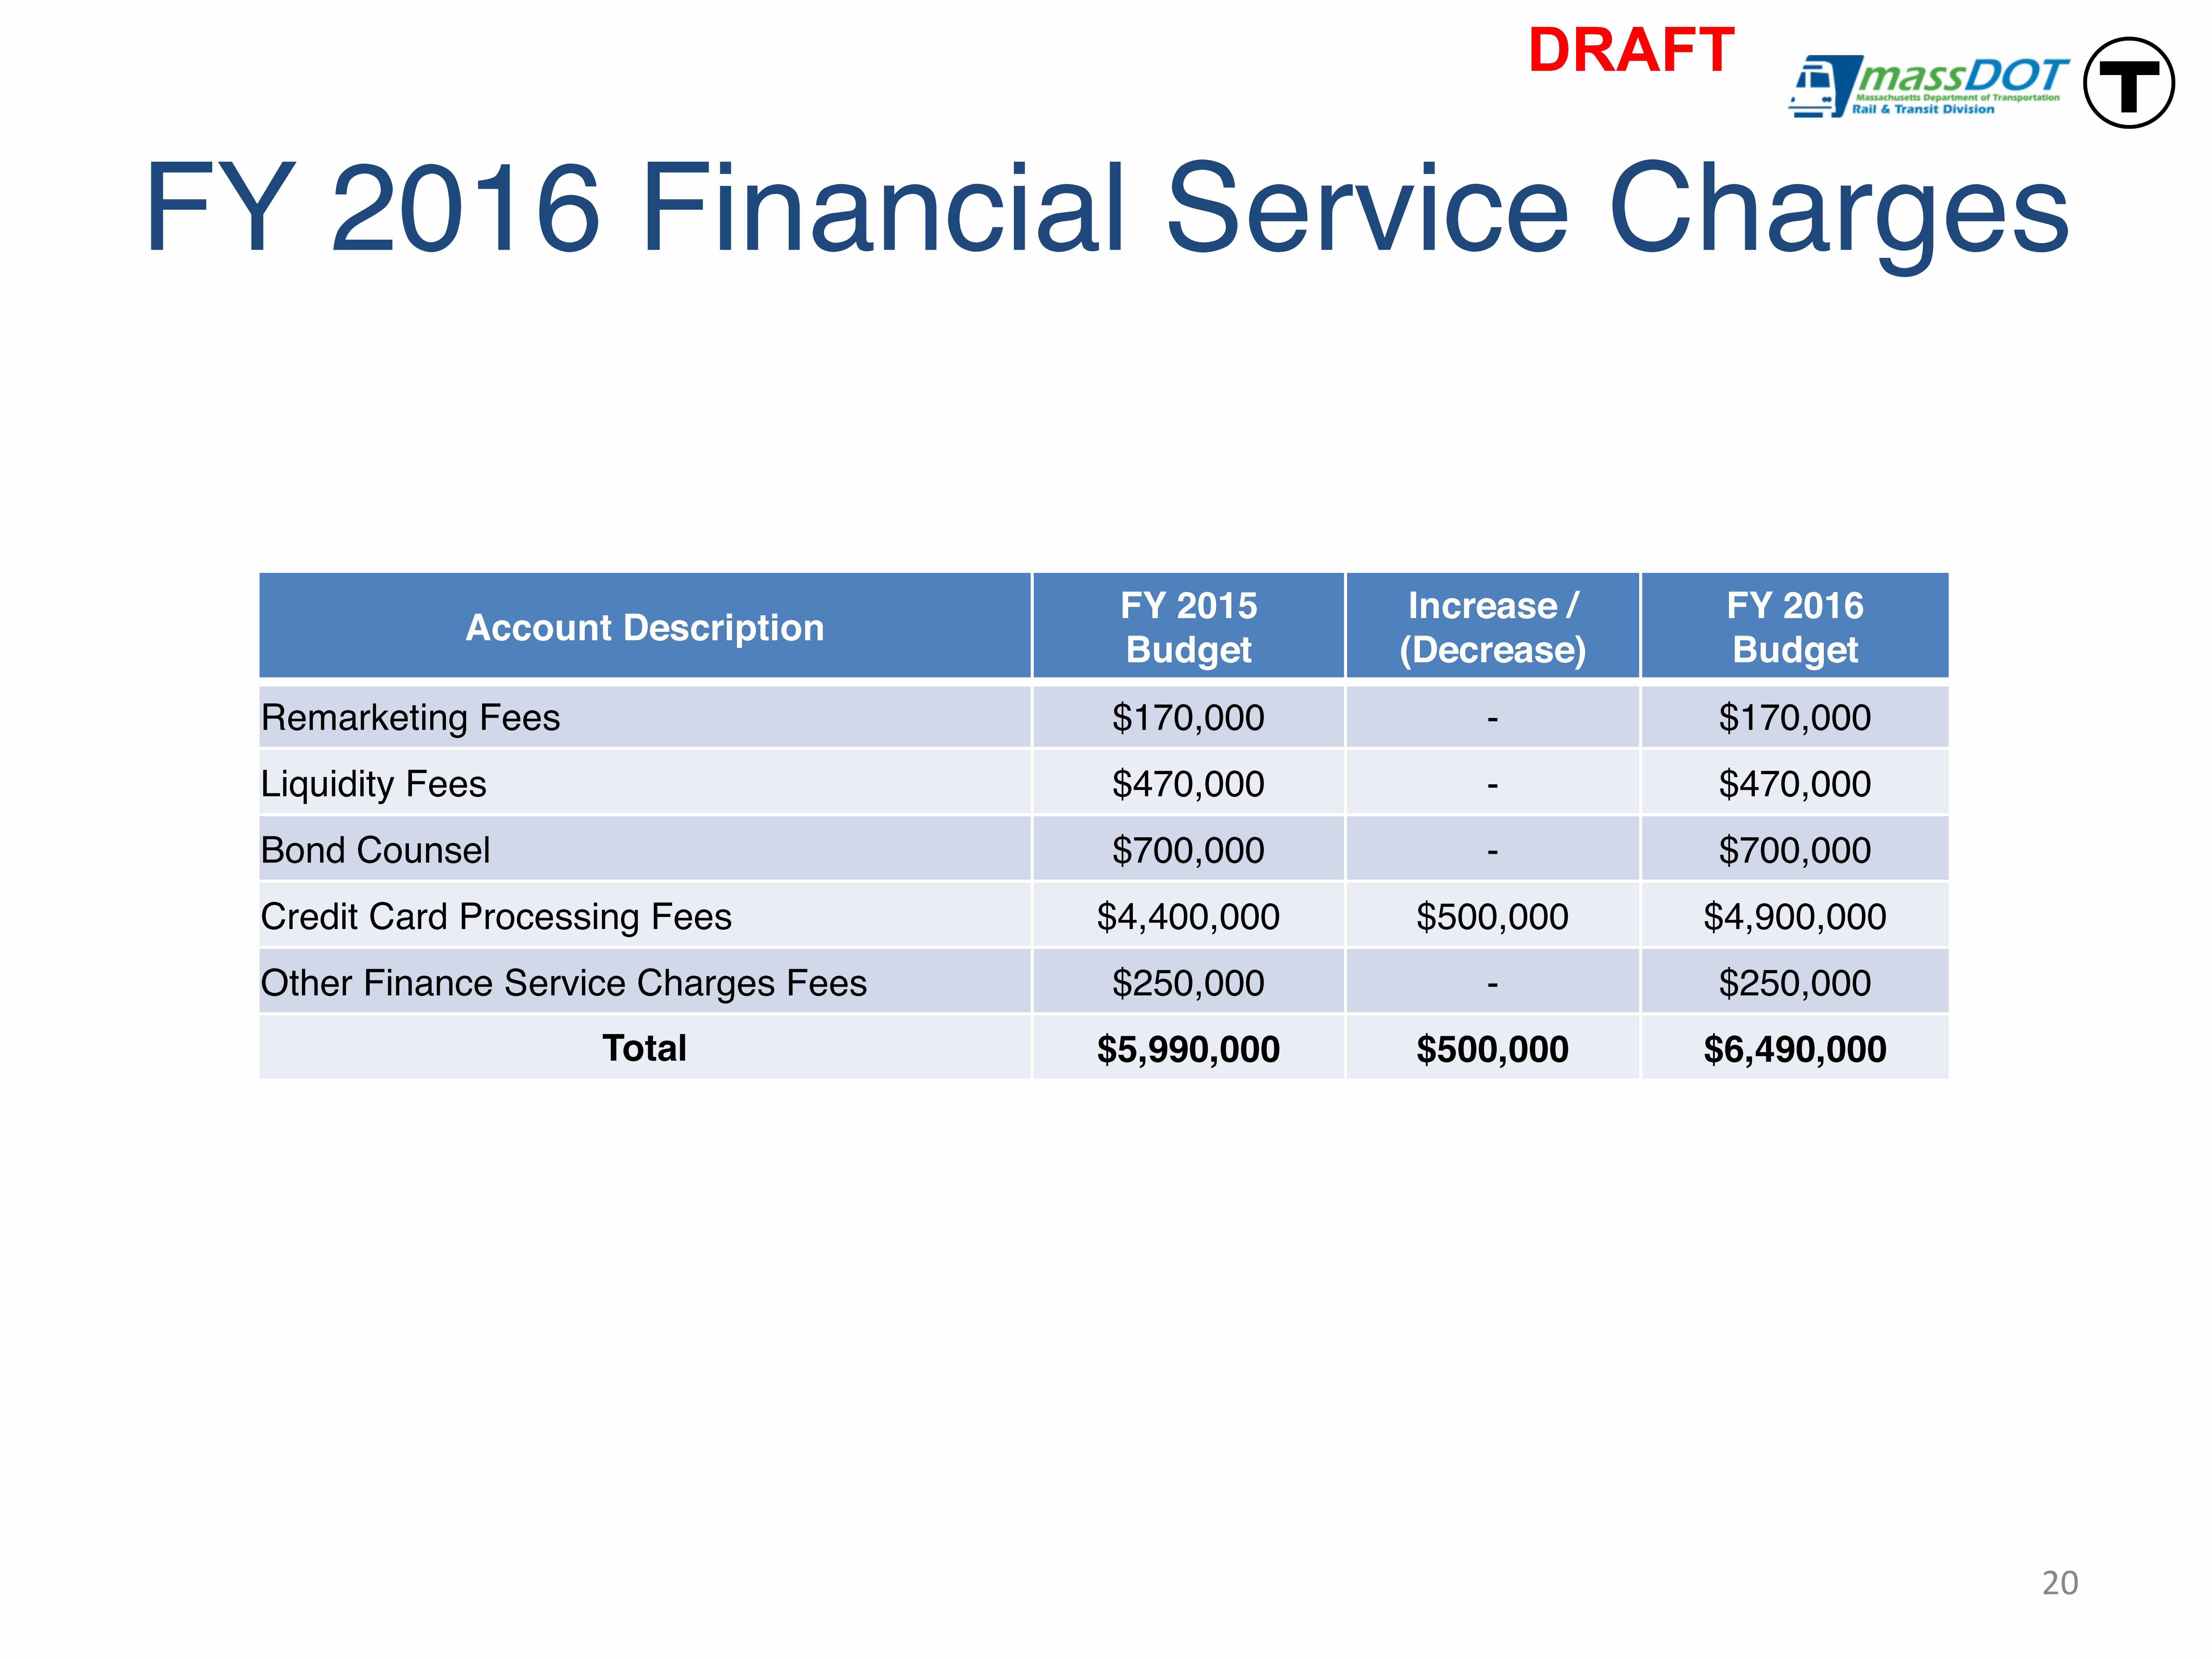
FY 2016 Financial Service Charges
20
Account Description FY 2015 Budget
Increase /(Decrease)
FY 2016Budget
Remarketing Fees $170,000 - $170,000
Liquidity Fees $470,000 - $470,000
Bond Counsel $700,000 - $700,000
Credit Card Processing Fees $4,400,000 $500,000 $4,900,000
Other Finance Service Charges Fees $250,000 - $250,000 Total $5,990,000 $500,000 $6,490,000
DRAFT

FY 2016 Casualty & LiabilityCasualty and Liability
FY 2009 – FY 2016 BudgetTransportation Reform legislation
Punitive Damages & InterestPursuant to Transportation Reform legislation enacted in 2009 and subsequent amendments, the MBTA is no longer liable at all for punitive damages or any interest pre-judgement or post-judgement and is capped at $100,000. There is no limitation on compensatory damages involving serious bodily injury.
$0
$2,000,000
$4,000,000
$6,000,000
$8,000,000
$10,000,000
$12,000,000
$14,000,000
$16,000,000
$18,000,000
$20,000,000
FY2009 Actual
FY2010 Actual
FY2011 Actual
FY2012 Actual
FY2013 Actual
FY2014 Actual
FY2015 Budget
FY2016 Budget
Risk Insurance Injuries & Damages
21
FY2009 Actual
FY2010 Actual
FY2011 Actual
FY2012 Actual
FY2013 Actual
FY2014 Actual
FY2015 Budget
FY2016 Budget
$5,709,821 $5,833,874 $6,050,194 $5,398,695 $6,449,139 $6,441,889 $7,352,900 $7,596,795
$9,213,614 $9,651,830 $9,250,211 $11,054,631 $11,099,298 $9,213,614 $9,213,613 $9,213,613
$14,923,435 $15,485,704 $15,300,405 $16,453,326 $17,548,437 $15,655,503 $16,566,513 $16,810,408
DRAFT

FY 2016 Risk InsuranceAccount Description FY 2015
BudgetIncrease /(Decrease)
FY 2016Budget
Terrorism Property Supplement $321,701 $(46,701) $275,000
Property Insurance $1,197,800 $35,934 $1,233,734
Travel and Accident Insurance $25,535 - $25,535
Director and Officer Insurance $50,380 - $50,380
Claims Administration $160,000 $15,000 $175,000
Crime Designated Employee $31,276 $10,724 $42,000
Liability* $5,515,197 $228,909 $5,744,106
Miscellaneous Insurance $51,010 $30 $51,040 Total $7,352,899 $243,896 $7,596,795
22
*Note: The increase in liability costs are related to added MBTA exposure (ridership going up and services added). Future liability insurance increases anticipated are due to limited rail/transit markets, anticipated claims/losses due to greater exposure and continued expansion of services and ridership. Based on market conditions over the past few years other rail/transit systems have experienced premium increases between 8-10% over expiring premiums. The MBTA has been able to negotiate with underwriters to keep premiums within 3-5% increase.
DRAFT

FY 2016 Debt Profile• MBTA currently has
approximately $5.5 Billion in outstanding debt
• $4.8 Billion fixed
• $659.18 Million variable including $101.03 Commercial Paper
• $557.55 Million swapped to fixed
23
Fixed Rat e88.01%
Syn t h etic Fixed10.14%
Var iable Rat e0.01%
Commercial Paper1.84%
Ot h er1.85%
Out st anding Debt as of June 30, 2014
Fiscal Year Principal Outstanding
Additional CIP New Money
Bonds*
Principal Payments
CP Amortization Payments
FYE 6/30 Principal Outstanding
Accumulative Net Change
2014 5,475,648 200,000 177,815 6,350 5,499,989 24,341
2015 5,499,989 - 173,620 6,675 5,319,694 (155,954)
2016 5,319,694 200,000 150,520 7,050 5,362,124 (113,524)
DRAFT

FY 2016 Debt Profile
24
Debt Principal Interest Leases & Fees Total
Prior Obligat ions 18,843,333 15,364,932 - 34,208,265 Assessment Bonds 1,985,000 39,881,293 - 41,866,293 Sales Tax Bonds 179,997,584 163,533,084 - 343,530,667 New Money Issue 1,159,484 5,500,000 - 6,659,484 Commercial Paper 7,291,667 100,000 - 7,391,667 Synthet ic Fixed Interest Expense - 10,103,699 - 10,103,699 Operat ing Leases - - 4,575,488 4,575,488 Liquidity Facility/ Remarket ing Fees - 3,360,707 - 3,360,707 Rebate Liability - 412,900 - 412,900
Total 209 ,277 ,068 238 ,256 ,615 4 ,575 ,488 447 ,533 ,683
Fiscal Year 2016Debt Service Budget
Massachusetts Bay Transportation Authority
DRAFT

FY 2016 Debt Profile
25
Date Principal AmortizationMarch 1, 2015 66,725,000 March 1, 2016 23,450,000 March 1, 2017 9,630,000 March 1, 2018 17,315,000 March 1, 2019 18,840,000 March 1, 2020 19,095,000 March 1, 2021 20,420,000 March 1, 2022 10,955,000 March 1, 2023 10,740,000 March 1, 2024 11,495,000 March 1, 2025 12,300,000 March 1, 2026 13,160,000 March 1, 2027 14,080,000 March 1, 2028 15,065,000 March 1, 2029 16,120,000 March 1, 2030 17,250,000
Total 296,640,000
Prior Obligations
Debt Assumed on 7/1/2000 Under Forward Funding Legislation = $3.6 Billion
DRAFT

FY16 Suggested Cuts
26
DRAFT
Initial FY16 Budget Request -‐ Departmental Requests Cutas of 02/05/15 -‐
Keep/Cut Program Department Amount0 0 Beginning Balances >>>> (22,953,600)$
Keep Add Cut SavingsKeep GLX Service Mitigation Operations -‐ Bus & Light Rail 99 -‐
Service Management OCC Dispatchers 4 -‐ Maintenance State of Good Repair Power Systems Maintenance (E&M) 24 (2,255,925)
Cut Cover List Bus Transportation -‐50 2,450,348 Technology ITD (14), Diversity (1), SBII (1) -‐16 1,277,735 Police Police -‐20 1,186,578 Environmental Environmental -‐5 401,040 Vehicle Maintenance TFM (11), Everett (5), Rail Maint(1) -‐17 1,355,700 Asset Management Everett main repair -‐4 328,140 Materials Management & Other Bus Maintenance -‐19 1,337,395
Administrative Diversity (2), MassDOT U (3) -‐5 454,907 Total Cut/add 103 24 -‐136 6,535,918
Fringe Cuts Healthcare average premium $13,000 1,456,000 Pensions @ 16.0511% 1,049,087 FICA @ 7.65% 499,998
Total Fringe Cuts -‐ -‐ -‐ 3,005,084
Other Materials & Services ITD/ITD Development 2,150,000 Materials & Services SBII 1,000,000 Commuter Rail Locomotive & Coach Maintenenace 12,200,000 Commuter Rail Service Changes 1,000,000 Commuter Rail CSX 815,073 Services to MassDOT U Duplicate Request 100,000
Total Other -‐ -‐ -‐ 17,265,073
Revenue Fare Revenue Revised number based on ridership 3,496,645 Advertising Increase from TITAN 840,852 Real Estate Tenant Revenue 750,722
Revenue Increases -‐ -‐ -‐ 5,088,219 103 24 -‐136 31,894,294$
Ending Balances>>>>> 127 8,940,694$
Headcount239

FY16 Draft Budget
27
DRAFT
REVENUE FY15 Budget FY16 Draft BudgetFY16 % Incr/ Decr over FY15 Budget
FY16 $ Incr/ Decr over FY15 Budget FY16 Financial Plan
FY16 $ Incr/ (Dec) over Financial Plan
Operating RevenuesRevenue from Transportat ion 597,647,752 617,848,214 3.4% 20,200,462 597,647,752 20,200,462Other Operat ing Revenue 48,527,035 48,908,912 0.8% 381,877 50,988,672 (2,079,760)Total Operating Revenue 646,174,787 666,757,126 3.2% 20,582,339 648,636,424 18,120,702
Non-Operating RevenuesDedicated Local Assessments 160,135,712 162,858,019 1.7% 2,722,307 163,338,426 (480,407)Dedicated Sales Tax 970,637,174 985,077,246 1.5% 14,440,072 983,607,369 1,469,877Other Income 31,045,029 23,518,422 -24.2% (7,526,607) 45,857,983 (22,339,561)Total Non-Operating 1,161,817,915 1,171,453,687 0.8% 9,635,772 1,192,803,778 (21,350,091)
TOTAL REVENUES 1,807,992,703 1,838,210,813 1.7% 30,218,110 1,841,440,202 (3,229,389)EXPENSESOperating Expenses
Wages 493,470,467 514,281,686 4.2% 20,811,219 533,883,485 (19,601,799)
Fringe BenefitsPensions 76,874,711 82,932,266 7.9% 6,057,555 79,243,035 3,689,231Healthcare 110,187,626 109,027,780 -1.1% (1,159,846) 111,412,843 (2,385,063)Group Life 584,316 600,679 2.8% 16,363 630,900 (30,221)Disability Insurance 0 0 0.0% 0 0 0Workers' Comp 11,170,527 11,077,679 -0.8% (92,848) 11,614,852 (537,173)Other Fringe Benefits 234,171 237,069 1.2% 2,898 232,317 4,752
Total Fringe Benefits 199,051,351 203,875,473 2.4% 4,824,122 203,133,947 741,526
Health & Welfare Fund 10,436,865 11,474,924 9.9% 1,038,059 10,701,144 773,780
Payroll TaxesFICA 37,750,491 39,137,848 3.7% 1,387,357 38,613,067 524,781Unemployment 1,320,087 1,339,665 1.5% 19,578 1,300,974 38,691
Total Payroll Taxes 39,070,578 40,477,513 3.6% 1,406,935 39,914,041 563,472
Materials, Supplies and Services 237,872,565 272,860,805 14.7% 34,988,240 254,861,004 17,999,801Casualty and Liability 16,566,513 16,810,409 1.5% 243,896 17,086,818 (276,409)Purchased Commuter Rail Service 384,346,300 386,777,200 0.6% 2,430,900 400,058,624 (13,281,424)Purchased Local Service Subsidy 122,116,771 126,512,940 3.6% 4,396,169 127,758,567 (1,245,627)Financial Service Charges 5,990,000 6,490,000 8.3% 500,000 6,169,700 320,300
Total Operating Expenses 1,508,921,410 1,579,560,950 4.7% 70,639,540 1,593,567,330 (14,006,380)
Debt Service ExpensesInterest 240,945,845 238,256,615 -1.1% (2,689,230) 244,771,834 (6,515,219)Principal Payments 178,695,803 209,277,065 17.1% 30,581,262 194,968,459 14,308,606Lease Payments 4,296,777 4,575,488 6.5% 278,711 4,574,551 937
Total Debt Service Expenses 423,938,425 452,109,168 6.6% 28,170,743 444,314,843 7,794,325
TOTAL EXPENSES 1,932,859,835 2,031,670,118 5.1% 98,810,283 2,037,882,173 (6,212,055)
Net Revenue (124,867,132) (193,459,305) (196,441,971) 2,982,666Revenue 33.98%
Addit ional Assistance 135,100,000 202,400,000 Fare 30.41% 202,400,000 0NET Revenue after Additional Assistance 10,232,868 8,940,695 MassDOT Projects FY16 33.25% 5,958,029 2,982,666
MBTA FY16 SORE FY 16 Financial Plan
Recovery Ratios