MBMC Efficiency and Exchange. MBMC Copyright c 2007 by The McGraw-Hill Companies, Inc. All rights...
46
MB MC Efficiency and Exchange
-
Upload
hillary-lambert -
Category
Documents
-
view
218 -
download
3
Transcript of MBMC Efficiency and Exchange. MBMC Copyright c 2007 by The McGraw-Hill Companies, Inc. All rights...

MB MC
Efficiency and Exchange
Efficiency and Exchange

Chapter 7: Efficiency and Exchange Slide 2
MB MC
Copyright c 2007 by The McGraw-HillCompanies, Inc. All rights reserved.
Market Equilibrium and Efficiency
What do you think?Are markets always efficient and
equitable?

Chapter 7: Efficiency and Exchange Slide 3
MB MC
Copyright c 2007 by The McGraw-HillCompanies, Inc. All rights reserved.
Market Equilibrium and Efficiency
A market equilibrium is efficient……if price and quantity take any other than
their equilibrium values, a transaction that will make at least some people better off without harming others can always be found.

Chapter 7: Efficiency and Exchange Slide 4
MB MC
Copyright c 2007 by The McGraw-HillCompanies, Inc. All rights reserved.
A Market in Which Price Is Below the Equilibrium Level
2.50
Quantity (1,000s of gallons/day)
Pri
ce (
$/g
allo
n)
1 2 3 4 5
2.00
1.50
1.00
.50
D
S

Chapter 7: Efficiency and Exchange Slide 5
MB MC
Copyright c 2007 by The McGraw-HillCompanies, Inc. All rights reserved.
How Excess Demand Creates an Opportunity for a Surplus-Enhancing Transaction
2.50
Quantity (1,000s of gallons/day)
Pri
ce (
$/g
allo
n)
D
S
1 2 3 4 5
2.00
1.50
1.00
.50
1.25
• If P = $1 then QS = 2,000 gallons/day
• At 2,000 gallons the consumer is willing to pay $2 and the MC = $1
• If the buyer pays $1.25 for an extra gallon, producer is $.25 better off, and the consumer is $.75 better off, or economic surplus increases by $1.00
• At $1, the market is not efficient
Chapter 7: Efficiency and Exchange Slide 6
MB MC
Copyright c 2007 by The McGraw-HillCompanies, Inc. All rights reserved.
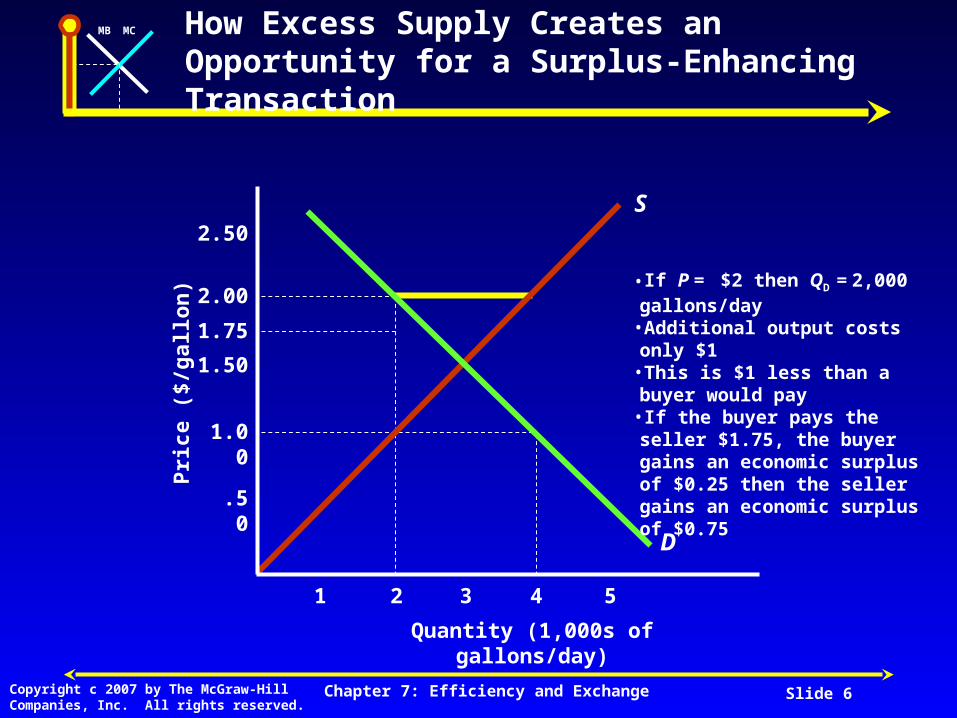
How Excess Supply Creates an Opportunity for a Surplus-Enhancing Transaction
Quantity (1,000s of gallons/day)
Pri
ce (
$/g
allo
n)
D
S
1 2 3 4 5
2.50
2.00
1.50
1.00
.50
1.75
•If P = $2 then QD = 2,000 gallons/day
•Additional output costs only $1•This is $1 less than a buyer would pay
•If the buyer pays the seller $1.75, the buyer gains an economic surplus of $0.25 then the seller gains an economic surplus of $0.75

Chapter 7: Efficiency and Exchange Slide 7
MB MC
Copyright c 2007 by The McGraw-HillCompanies, Inc. All rights reserved.
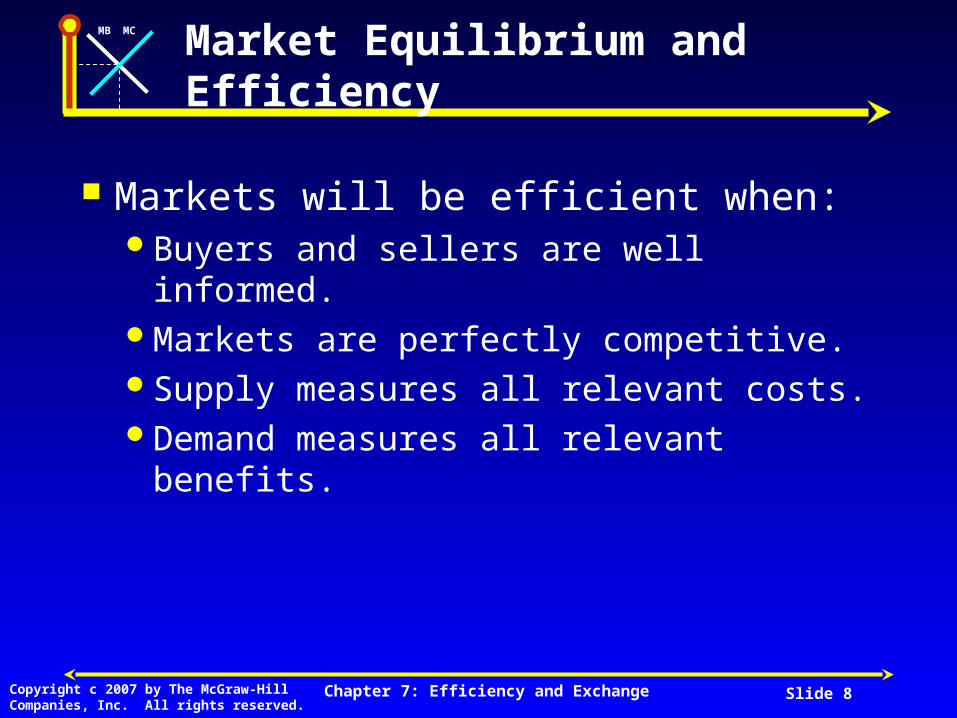
Market Equilibrium and Efficiency
Observations on EfficiencyWhen price is above or below the
equilibrium, the quantity exchanged will be below the equilibrium.
The vertical value on the demand curve (marginal benefit) is greater than the vertical value on the supply curve (MC).
Only the equilibrium will maximize economic surplus.
Chapter 7: Efficiency and Exchange Slide 8
MB MC
Copyright c 2007 by The McGraw-HillCompanies, Inc. All rights reserved.
Market Equilibrium and Efficiency
Markets will be efficient when: Buyers and sellers are well informed.Markets are perfectly competitive.Supply measures all relevant costs.Demand measures all relevant benefits.

Chapter 7: Efficiency and Exchange Slide 9
MB MC
Copyright c 2007 by The McGraw-HillCompanies, Inc. All rights reserved.
Market Equilibrium and Efficiency
What do you think?Is efficiency the only goal?Why should efficiency be the first goal?
Chapter 7: Efficiency and Exchange Slide 10
MB MC
Copyright c 2007 by The McGraw-HillCompanies, Inc. All rights reserved.
The Cost of PreventingPrice Adjustments
Price Ceilings: Do They Help the Poor?An Example
A Price Ceiling for Home Heating Oil
Chapter 7: Efficiency and Exchange Slide 11
MB MC
Copyright c 2007 by The McGraw-HillCompanies, Inc. All rights reserved.
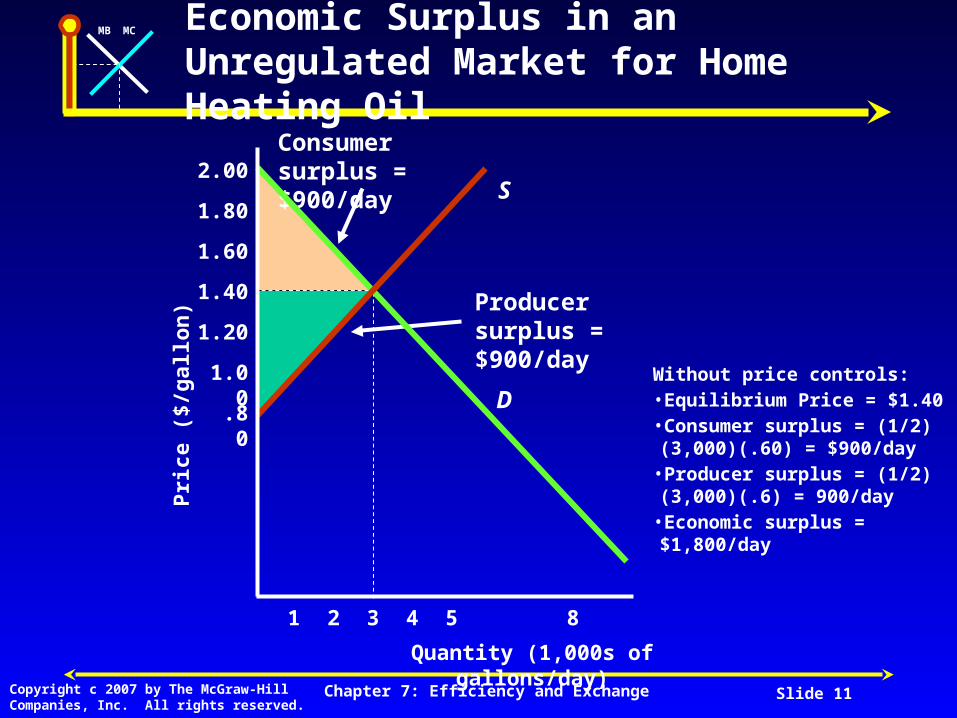
Producer surplus = $900/day
Consumer surplus = $900/day
D
S
Economic Surplus in an Unregulated Market for Home Heating Oil
2.00
Quantity (1,000s of gallons/day)
Pri
ce (
$/g
allo
n)
1 2 3 4 5
1.60
1.20
1.00
.80
1.80
1.40
8
Without price controls: •Equilibrium Price = $1.40•Consumer surplus = (1/2)(3,000)(.60) = $900/day
•Producer surplus = (1/2)(3,000)(.6) = 900/day
•Economic surplus = $1,800/day

Chapter 7: Efficiency and Exchange Slide 12
MB MC
Copyright c 2007 by The McGraw-HillCompanies, Inc. All rights reserved.
Producer surplus = $100/day
Lost economic surplus = $800/day
Consumer surplus = $900/day
The Waste Caused by Price Controls
2.00
Quantity (1,000s of gallons/day)
D
S
1 2 3 4 5
1.60
1.20
1.00
.80
1.80
1.40
8
Pri
ce (
$/g
allo
n)
With price controls: •Producer surplus = (1/2)(1,000)(.20) = $100/day or a loss of $800/day
•Economic surplus = $1,000 or a loss of $800/day
Price Ceiling set at $1.00

Chapter 7: Efficiency and Exchange Slide 13
MB MC
Copyright c 2007 by The McGraw-HillCompanies, Inc. All rights reserved.
The Cost of PreventingPrice Adjustments
The reduction in economic surplus from a price ceiling will be underestimated when The consumers who receive the product
are not the consumers who value it the most.
Consumers take costly actions to enhance their chances of being served.
Chapter 7: Efficiency and Exchange Slide 14
MB MC
Copyright c 2007 by The McGraw-HillCompanies, Inc. All rights reserved.
The Cost of PreventingPrice Adjustments
QuestionWhat program could be used to help the
poor get heating oil that would be more efficient than a price ceiling?

Chapter 7: Efficiency and Exchange Slide 15
MB MC
Copyright c 2007 by The McGraw-HillCompanies, Inc. All rights reserved.
When the Pie Is Larger, Everyone Can Have a Bigger Slice
R
P
R
P
Surplus with price controls Surplus with income transfers and no price controls
With price controls set at $1.00 the economic surplus is $1,000/day *R = economic surplus received by rich people
*P = economic surplus received by poor people
Without price controls & with income transfers economic surplus is $1,800/day *R & P have the same share and a much larger economic surplus

Chapter 7: Efficiency and Exchange Slide 16
MB MC
Copyright c 2007 by The McGraw-HillCompanies, Inc. All rights reserved.
The Cost of PreventingPrice Adjustments
QuestionWhat would be a potential cost of income
transfers?
Chapter 7: Efficiency and Exchange Slide 17
MB MC
Copyright c 2007 by The McGraw-HillCompanies, Inc. All rights reserved.
The Cost of PreventingPrice Adjustments
Price Subsidies: Do They Help the Poor?By how much do subsidies reduce total
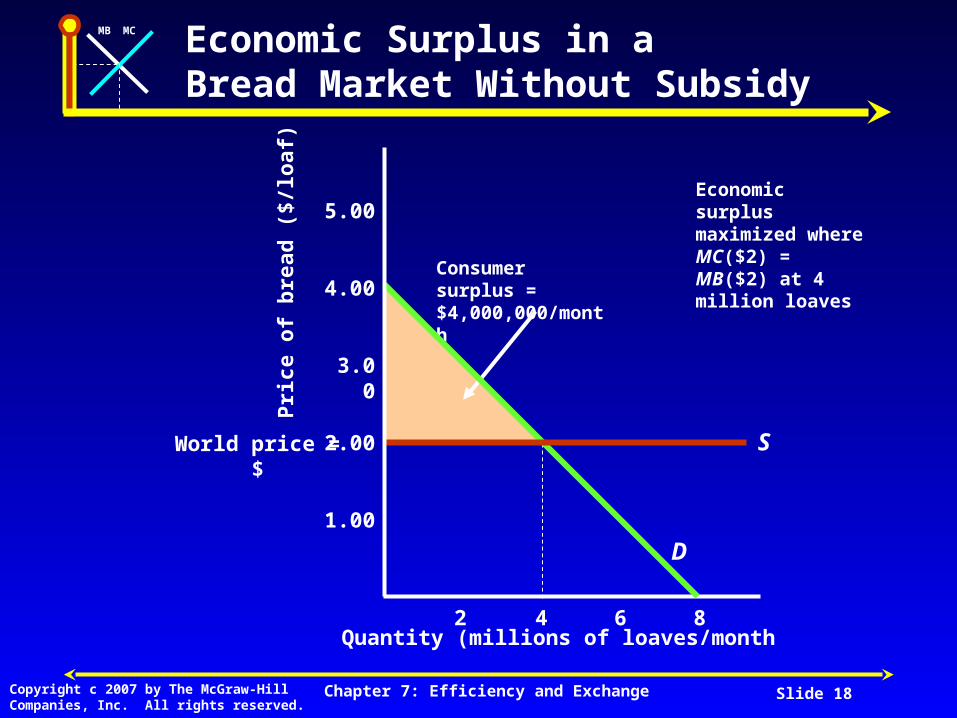
economic surplus in the market for bread?Assume a small nation imports all its bread
at the world price of $2.00
Chapter 7: Efficiency and Exchange Slide 18
MB MC
Copyright c 2007 by The McGraw-HillCompanies, Inc. All rights reserved.
Consumer surplus = $4,000,000/month
Economic surplus maximized where MC($2) = MB($2) at 4 million loaves
Economic Surplus in a Bread Market Without Subsidy
Quantity (millions of loaves/month
Pri
ce o
f b
read
($/
loaf
)
2 4 6
3.00
1.00
5.00
4.00
8
D
S2.00World price = $
Chapter 7: Efficiency and Exchange Slide 19
MB MC
Copyright c 2007 by The McGraw-HillCompanies, Inc. All rights reserved.
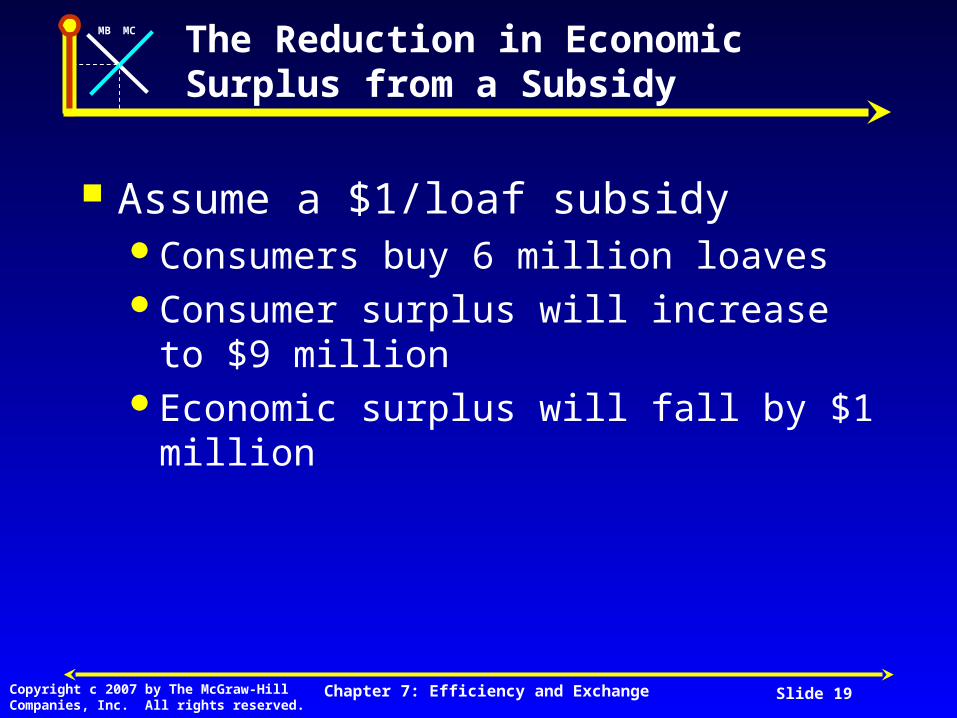
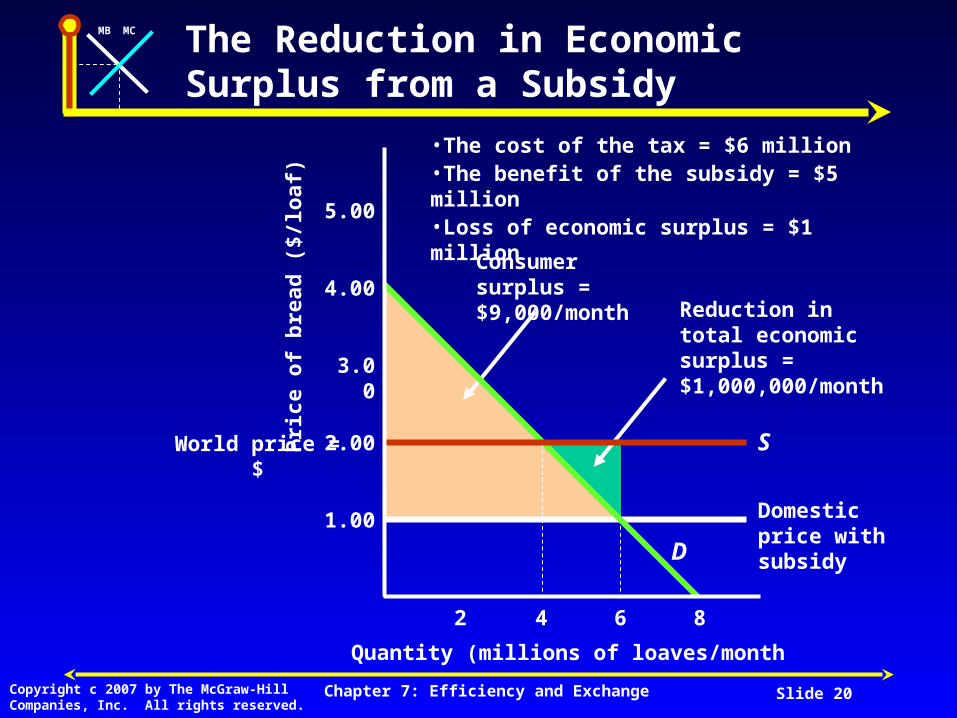
Assume a $1/loaf subsidyConsumers buy 6 million loavesConsumer surplus will increase to $9
millionEconomic surplus will fall by $1 million
The Reduction in EconomicSurplus from a Subsidy
Chapter 7: Efficiency and Exchange Slide 20
MB MC
Copyright c 2007 by The McGraw-HillCompanies, Inc. All rights reserved.
Consumer surplus = $9,000/month
Reduction in total economic surplus = $1,000,000/month
Domestic price with subsidy
The Reduction in EconomicSurplus from a Subsidy
Quantity (millions of loaves/month
Pri
ce o
f b
read
($/
loaf
)
2 4 6
3.00
1.00
5.00
4.00
8
2.00World price = $
D
S
•The cost of the tax = $6 million•The benefit of the subsidy = $5 million•Loss of economic surplus = $1 million
Chapter 7: Efficiency and Exchange Slide 21
MB MC
Copyright c 2007 by The McGraw-HillCompanies, Inc. All rights reserved.
The Cost of PreventingPrice Adjustments
Price SubsidiesHow could we provide assistance to low
income consumers more efficiently?

Chapter 7: Efficiency and Exchange Slide 22
MB MC
Copyright c 2007 by The McGraw-HillCompanies, Inc. All rights reserved.
The Cost of PreventingPrice Adjustments
Economic NaturalistFirst-Come, First-Served Policies
Why does no one complain any longer about being bumped from an overbooked flight?
Chapter 7: Efficiency and Exchange Slide 23
MB MC
Copyright c 2007 by The McGraw-HillCompanies, Inc. All rights reserved.
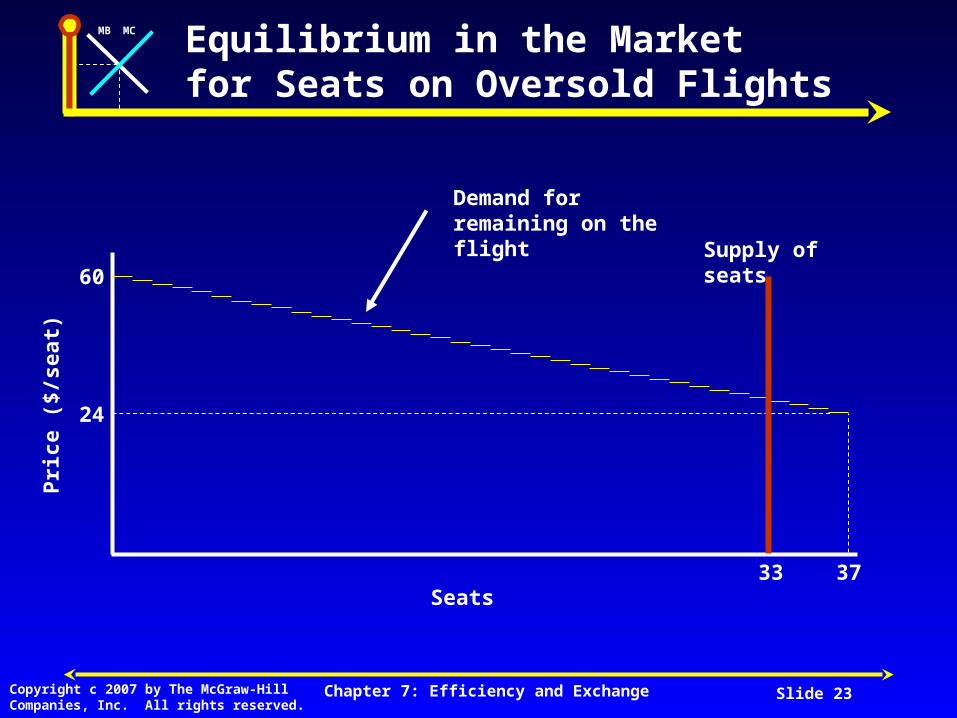
Equilibrium in the Market for Seats on Oversold Flights
Demand for remaining on the flight
60
24
37Seats
Pri
ce (
$/se
at)
33
Supply of seats
Chapter 7: Efficiency and Exchange Slide 24
MB MC
Copyright c 2007 by The McGraw-HillCompanies, Inc. All rights reserved.
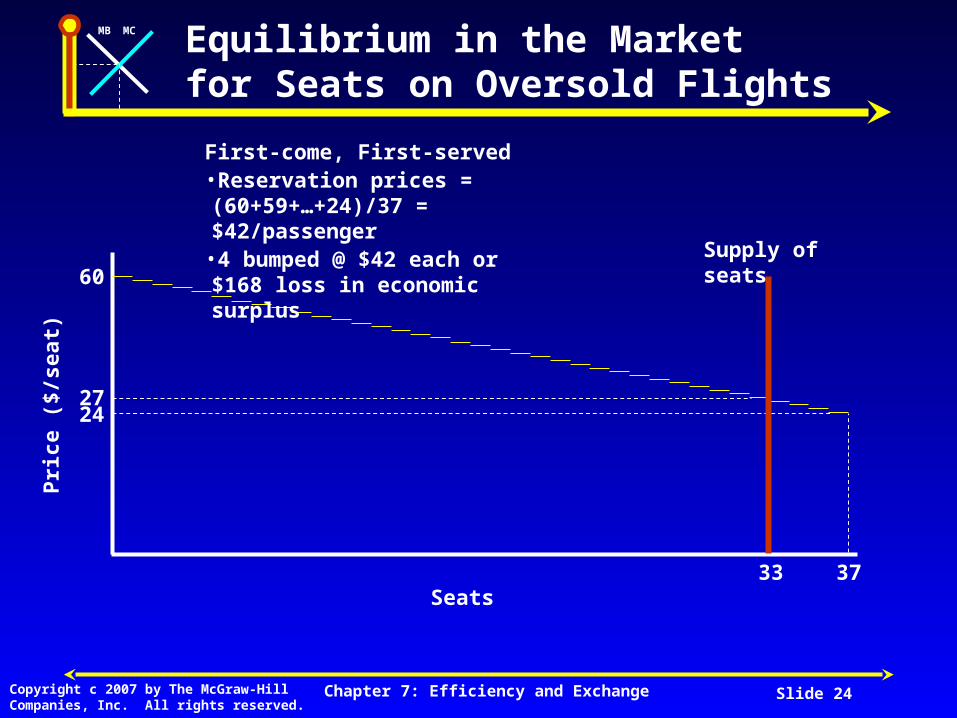
Equilibrium in the Market for Seats on Oversold Flights
60
2427
33 37Seats
Pri
ce (
$/se
at)
Supply of seats
First-come, First-served•Reservation prices = (60+59+…+24)/37 = $42/passenger
•4 bumped @ $42 each or $168 loss in economic surplus

Chapter 7: Efficiency and Exchange Slide 25
MB MC
Copyright c 2007 by The McGraw-HillCompanies, Inc. All rights reserved.
Equilibrium in the Market for Seats on Oversold Flights
60
2427
33 37Seats
Pri
ce (
$/se
at)
Supply of seats
Compensation Policy•$27 = reservation price (compensation) to get 4 passengers to volunteer to stay
•The cost of the compensation = 4 x $27 = $108 minus the economic surplus to the passengers of $6 = $102
Chapter 7: Efficiency and Exchange Slide 26
MB MC
Copyright c 2007 by The McGraw-HillCompanies, Inc. All rights reserved.
The Cost of PreventingPrice Adjustments
ExampleHow should a tennis pro handle an
overbooking problem?
Chapter 7: Efficiency and Exchange Slide 27
MB MC
Copyright c 2007 by The McGraw-HillCompanies, Inc. All rights reserved.
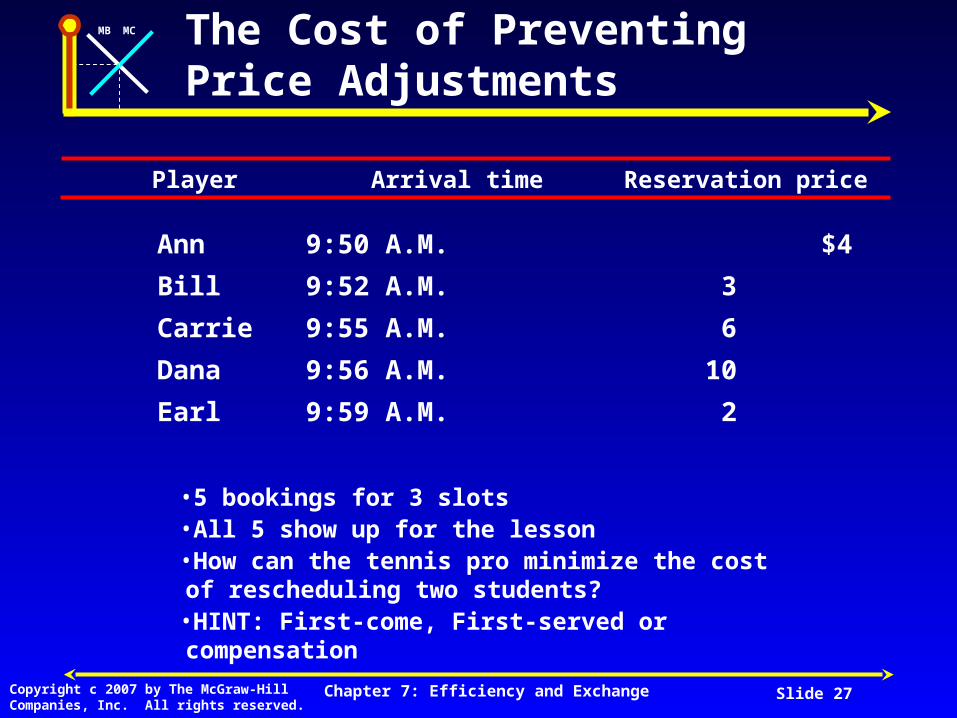
Player
Ann 9:50 A.M. $4
Bill 9:52 A.M. 3
Carrie 9:55 A.M. 6
Dana 9:56 A.M. 10
Earl 9:59 A.M. 2
Arrival time Reservation price
•5 bookings for 3 slots•All 5 show up for the lesson•How can the tennis pro minimize the cost of rescheduling two students?•HINT: First-come, First-served or compensation
The Cost of PreventingPrice Adjustments
Chapter 7: Efficiency and Exchange Slide 28
MB MC
Copyright c 2007 by The McGraw-HillCompanies, Inc. All rights reserved.
The Cost of PreventingPrice Adjustments
What do you think?Why offer compensation when the cost of
first-come, first-served to the seller is zero?

Chapter 7: Efficiency and Exchange Slide 29
MB MC
Copyright c 2007 by The McGraw-HillCompanies, Inc. All rights reserved.
The Marginal Cost Pricing of Public Services
ExampleHow much should a city charge for water,
electricity, or some other service?

Chapter 7: Efficiency and Exchange Slide 30
MB MC
Copyright c 2007 by The McGraw-HillCompanies, Inc. All rights reserved.
The Marginal Cost Curve for Water
Water supplied (millions of gallons/day)
Co
st (
cen
ts/g
allo
n)
4.0
0.8
0.2
1 3
Spring
Lake
Ocean
Three sources of water•Spring: 1 million gallons/day .02 cents/gallon•Lake: 2 million gallons/day @ .08 cents/gallon•Ocean: 4 cents/gallon

Chapter 7: Efficiency and Exchange Slide 31
MB MC
Copyright c 2007 by The McGraw-HillCompanies, Inc. All rights reserved.
The Marginal Cost Curve for Water
ExampleHow much should a city charge for water?

Chapter 7: Efficiency and Exchange Slide 32
MB MC
Copyright c 2007 by The McGraw-HillCompanies, Inc. All rights reserved.
The Marginal Cost Curve for Water
Water supplied (millions of gallons/day)
Co
st (
cen
ts/g
allo
n)
4.0
0.8
0.2
1 3
Spring
Lake
Ocean
Assume•If P = 4 cents/gallon, Q = 4 million gallons
Question•Why should all residents pay 4 cents per gallon

Chapter 7: Efficiency and Exchange Slide 33
MB MC
Copyright c 2007 by The McGraw-HillCompanies, Inc. All rights reserved.
Taxes and Efficiency
QuestionWho Pays A Tax Imposed On Sellers of a
Good?

Chapter 7: Efficiency and Exchange Slide 34
MB MC
Copyright c 2007 by The McGraw-HillCompanies, Inc. All rights reserved.
The Effect of a Tax on the Equilibrium Quantity and Price of Avocados
6
Quantity (millions of pounds/month)
Pri
ce (
$/p
ou
nd
)
1 2 3 4 5
5
4
2
1D
S
3
Without a tax P = $3/lband Q = 3 million lbs/month
2.50
3.50
S + tax
2.5
With a tax of $1/lb• MC increases by $1/lb• Supply shifts up by $1• P = $3.50; Q = 2.5 million• Consumers and producers share
the burden of the tax equally• Producers receive $2.50/lb• Consumers pay $3.50/lb
Chapter 7: Efficiency and Exchange Slide 35
MB MC
Copyright c 2007 by The McGraw-HillCompanies, Inc. All rights reserved.
Taxes and Efficiency
QuestionHow will a tax on cars affect their prices in
the long run?
Chapter 7: Efficiency and Exchange Slide 36
MB MC
Copyright c 2007 by The McGraw-HillCompanies, Inc. All rights reserved.
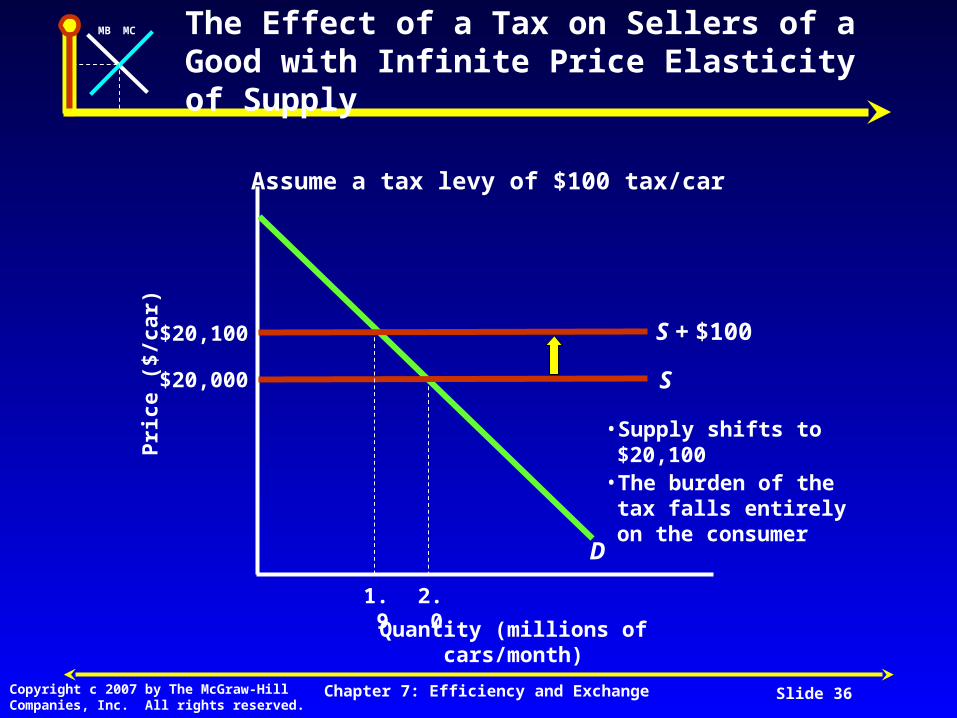
The Effect of a Tax on Sellers of a Good with Infinite Price Elasticity of Supply
Quantity (millions of cars/month)
Pri
ce (
$/ca
r)
D
S
2.0
$20,000
Assume a tax levy of $100 tax/car
1.9
S + $100$20,100
• Supply shifts to $20,100• The burden of the tax falls
entirely on the consumer

Chapter 7: Efficiency and Exchange Slide 37
MB MC
Copyright c 2007 by The McGraw-HillCompanies, Inc. All rights reserved.
Taxes and Efficiency
Who Pays a Tax?When supply is perfectly elastic, the tax
burden will fall entirely on the consumer.

Chapter 7: Efficiency and Exchange Slide 38
MB MC
Copyright c 2007 by The McGraw-HillCompanies, Inc. All rights reserved.
Total economic surplus = $9 million/month
How a tax collected for a seller affects economic surplus
The Market for Avocados Without Taxes
6
1 2 3 4 5
5
4
2
1
3
Pri
ce (
$/p
ou
nd
)
Quantity (millions of pounds/month)
D
S
Chapter 7: Efficiency and Exchange Slide 39
MB MC
Copyright c 2007 by The McGraw-HillCompanies, Inc. All rights reserved.
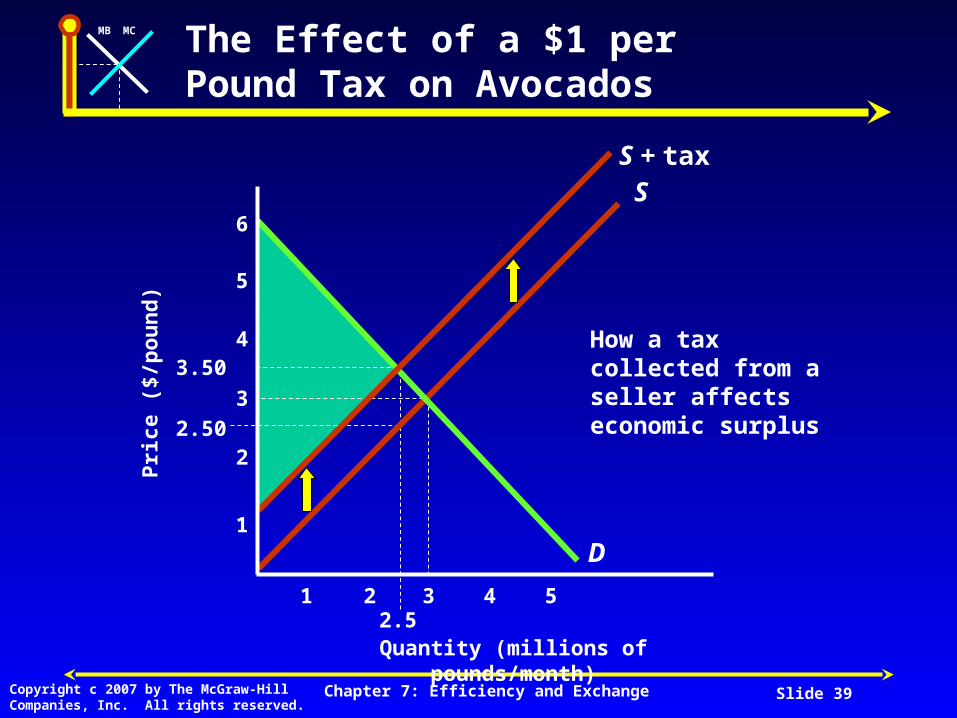
The Effect of a $1 perPound Tax on Avocados
6
Quantity (millions of pounds/month)
Pri
ce (
$/p
ou
nd
)
1 2 3 4 5
5
4
2
1
3
2.50
3.50
S + tax
2.5
D
S
How a tax collected from a seller affects economic surplus

Chapter 7: Efficiency and Exchange Slide 40
MB MC
Copyright c 2007 by The McGraw-HillCompanies, Inc. All rights reserved.
Taxes and Efficiency
Deadweight LossThe reduction in total economic surplus
that results from the adoption of a policy

Chapter 7: Efficiency and Exchange Slide 41
MB MC
Copyright c 2007 by The McGraw-HillCompanies, Inc. All rights reserved.
The Deadweight Loss Caused by a Tax
6
Quantity (millions of pounds/month)
Pri
ce (
$/p
ou
nd
)
D
S
1 2 3 4 5
5
4
2
1
3
2.50
3.50
S + tax
2.5
Deadweight loss caused by tax
Chapter 7: Efficiency and Exchange Slide 42
MB MC
Copyright c 2007 by The McGraw-HillCompanies, Inc. All rights reserved.
Taxes and Efficiency
QuestionHow would you determine the economic
feasibility of a tax?

Chapter 7: Efficiency and Exchange Slide 43
MB MC
Copyright c 2007 by The McGraw-HillCompanies, Inc. All rights reserved.
Elasticity of Demand and the Deadweight Loss from a Tax
Quantity (units/day)
Pri
ce (
$/u
nit
)
21
2.60
1.60
S + T
19
2.40
1.40
S + T
Deadweight loss Deadweight loss
Quantity (units/day)
Pri
ce (
$/u
nit
)
D1
S
24
2.00
D2
S
24
2.00
The greater the elasticity of demand, the greater the deadweight loss from a tax

Chapter 7: Efficiency and Exchange Slide 44
MB MC
Copyright c 2007 by The McGraw-HillCompanies, Inc. All rights reserved.
57
2.65
1.65
S1 + T
63
2.35
1.35
S2 + T
Deadweight Loss Deadweight Loss
Elasticity of Supply and the Deadweight Loss from a Tax
Pri
ce (
$/u
nit
)
Pri
ce (
$/u
nit
)
D
S1
72
2.00
D
S2
72
2.00
The greater the elasticity of supply, the greater the deadweight loss from a tax
Quantity (units/day) Quantity (units/day)

Chapter 7: Efficiency and Exchange Slide 45
MB MC
Copyright c 2007 by The McGraw-HillCompanies, Inc. All rights reserved.
Taxes and Efficiency
What do you think?Why would a tax on land be efficient?Would a tax on pollution increase
economic surplus?

MB MC
End ofChapterEnd of
Chapter