mbbr
37
1 INNOVATIONS IN WASTEWATER TREATMENT - THE MOVING BED BIOFILM PROCESS Xi’an May 2005 Hallvard Ødegaard Norwegian University of Science and Technology (NTNU) Department of Hydraulic and Environmental Engineering NO-7491 Trondheim, NORWAY [email protected]
description
rr
Transcript of mbbr

1
INNOVATIONS IN WASTEWATER TREATMENT -
THE MOVING BED BIOFILM PROCESS
Xi’an May 2005
Hallvard Ødegaard
Norwegian University of Science and Technology (NTNU)Department of Hydraulic and Environmental Engineering
NO-7491 Trondheim, NORWAY

2
Where is Norwayand were is Trondheim ?
Far north
3
• The country is situatedfar north (55-70 oN), but the Golf streamgives a pleasant climate
• The country has as anabundance of waterresources – both freshand saline water
• The country has anextremely long coastlinewith long fjords andthousands of islands
• The country is sparselyinhabited (4 mill) exceptfor the south-easternregion around Oslo
Norwayand
water

4
My wastewater treatment philosophy
Enhancedprimary
Removal of solubles
Organic concentrate
Carbon source
Biogas
Take out the particles first
Make use of the concentrate
Then deal with the solubles
Nutrients
Heat
Carbon
Nitrogen
Phosphorus

5
Expected trend:From area consuming open activated sludge plants to compact, covered biofilm reactor plants
6
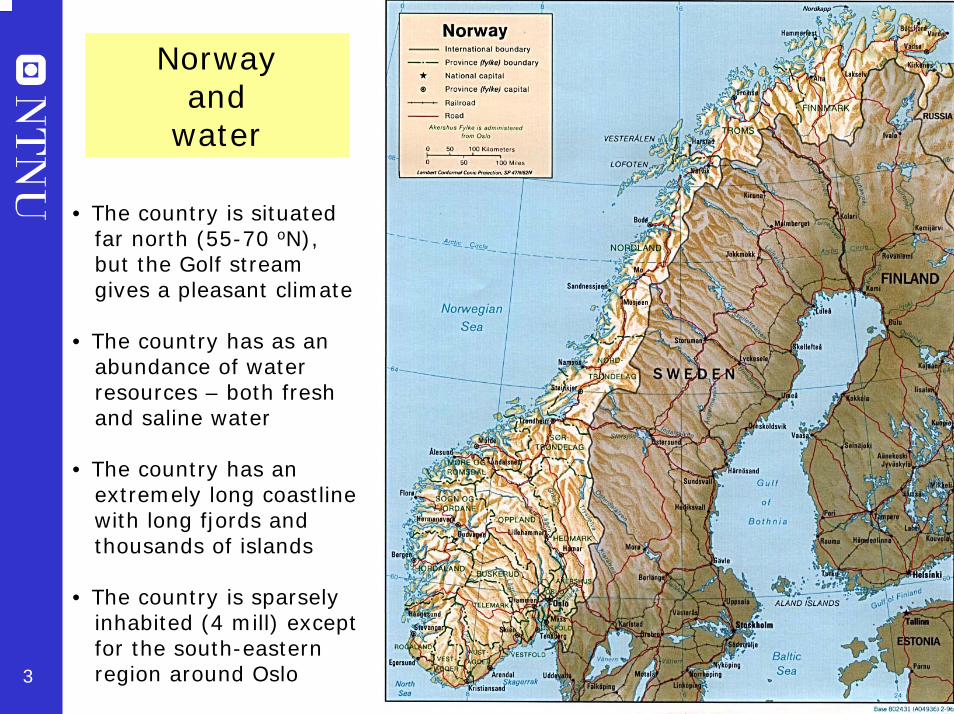
THE REASONS FOR THE GROWING INTEREST IN BIOFILM REACTORS
1. Less space required
2 Final result less dependent upon biomass separation
3. More specialized biomass at a given point in reactor train
Activated sludge system Biofilm system
Bio Sep Bio Sep
3.000-8.000 mg/l 100-200 mg/l
C,N,DN C,N,DN C,N,DN C N DN

7
THE PRINCIPLE OF THE MOVING BED BIOFILM REACTOR (MBBR)
Aerobic reactor Anoxic reactor
8
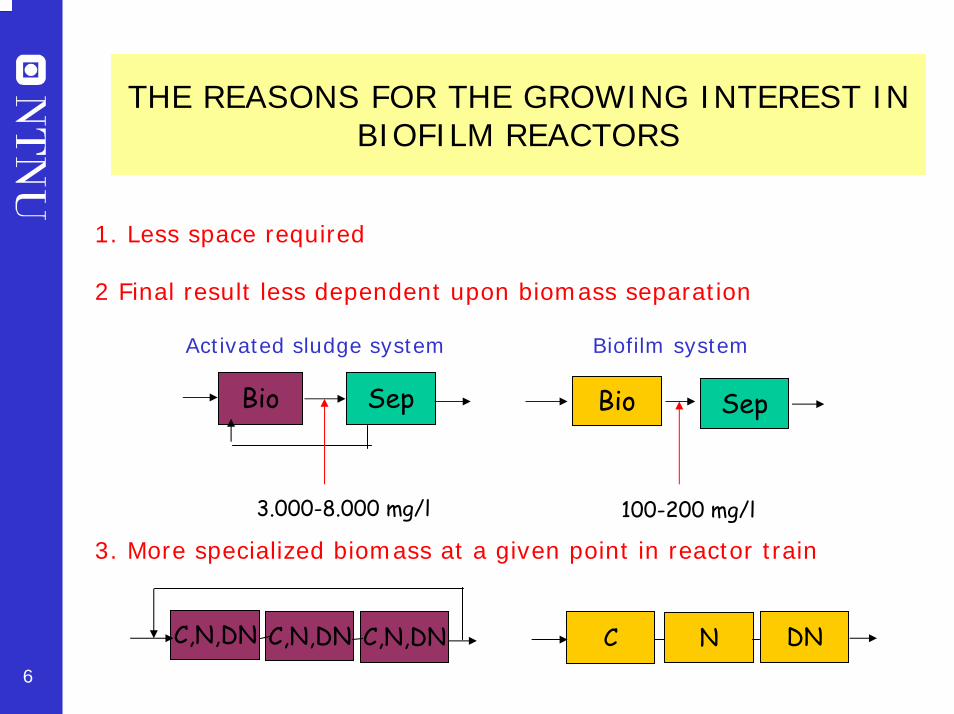
THE MOVING BED BIOFILM PROCESS(The Kaldnes-process)

9
Design
(m2/m3)
(1200)-
(m2/m3)
500335
(m2/m3)
350235
(m2/m3)
500335
Specific biofilm area– Effective in bulk– Effective at 67 %
filling fraction
48/2,225/1215/159/7Diam/Length (mm)
BiochipK3K2K1Carrier
K1
K2
CHARACTERISTICS OF THE ANOX KALDNES BIOFILM CARRIERS
Material : Polyethylene PEHD (density 0,95 g/cm3)

10
MBBR’s UNDER CONSTRUCTION
Aerobic reactor with aeration system Anoxic reactor with horizontally and vertically mounted cylindrical mounted shaft mixers and bar sieves rectangular mesh sieves
11
������������
������������
������������
��
������
��
�� ����
��
��
��
� ���
������� ���
������ �������
TYPICAL MOVING BEDPROCESSES FOR
DIFFERENT APPLICATIONS

12
PROCESSES FOR BOD/COD REMOVAL
Coag.
High rate MBBR followed by coagulation/flocculation/separationbiomass
(Coag.)
MBBR followed by biomass separationCoagulant only if P-removal isrequired
MBBR pre-treatment to activated sludgeFor upgrading of AS plants

13
THE INFLUENCE OF COD LOADING RATE ON COD REMOVAL RATE
)
05
101520253035404550
0 20 40 60 80 100Filtered COD loading rate [g SCOD/m2*d]
Filte
red
CO
D re
mov
al ra
te
[g S
CO
D/m
2 *d]
K1 K2 100%0
20
40
60
80
100
120
140
0 50 100 150 200Total COD loading rate [g COD/m2*d]
Obt
aina
ble
rem
oval
rate
(C
OD
in-S
CO
Dou
t) [g
/m2 *d
]
K1 K2 100%
a b
Soluble COD removal rate versus soluble
COD loading rate
Soluble COD removal rate versus “obtainable”COD removal rate
14
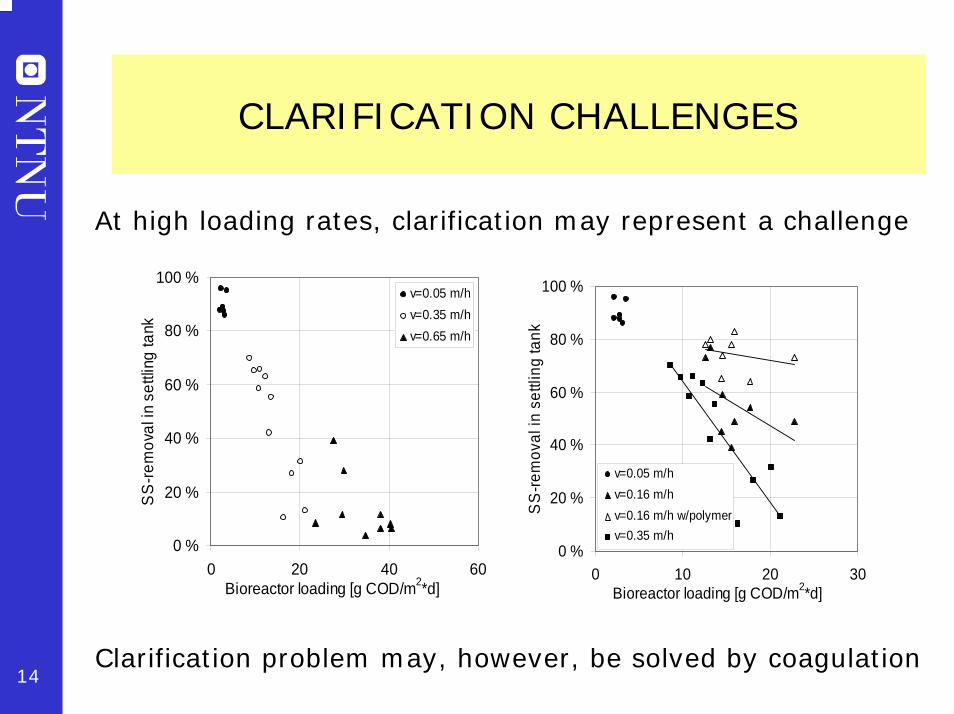
CLARIFICATION CHALLENGES
At high loading rates, clarification may represent a challenge
0 %
20 %
40 %
60 %
80 %
100 %
0 10 20 30Bioreactor loading [g COD/m2*d]
SS
-rem
oval
in s
ettli
ng ta
nk
v=0.05 m/hv=0.16 m/hv=0.16 m/h w/polymerv=0.35 m/h
0 %
20 %
40 %
60 %
80 %
100 %
0 20 40 60Bioreactor loading [g COD/m2*d]
SS
-rem
oval
in s
ettli
ng ta
nk
v=0.05 m/hv=0.35 m/hv=0.65 m/h
0 %
20 %
40 %
60 %
80 %
100 %
0 10 20 30Bioreactor loading [g COD/m2*d]
SS
-rem
oval
in s
ettli
ng ta
nk
v=0.05 m/hv=0.16 m/hv=0.16 m/h w/polymerv=0.35 m/h
0 %
20 %
40 %
60 %
80 %
100 %
0 20 40 60Bioreactor loading [g COD/m2*d]
SS
-rem
oval
in s
ettli
ng ta
nk
v=0.05 m/hv=0.35 m/hv=0.65 m/h
Clarification problem may, however, be solved by coagulation

15
• Let particulate organic matter be removed by coagulation• Let soluble organic matter be removed by biodegradation (MBBR)• Minimize sludge production – use polymer coagulation• Minimize cost by use of compact unit processes (i.e. flotation)
THE BASIS FOR A HIGH RATE SECONDARY TREATMENT PROCESS
Total COD in wastewater - 100%
1 µm
SCOD PCOD
“True solution” “Particulate fraction” (colloids & SS)
Degradable in MBBR
Coagulation Flocculation
ChemicalsMBBRWe want:
ChemicalsMBBR
We don’t want:
0.1 µm

16
Fine sive MBBR Coagul/Floccul. Flotation
* HRT: 5-10 min * 5 mg polym/g SS+ 35 mg Fe/g SS
(~1 mg pol./l+7 mg Fe/l at 200 mg SS/l)
* HRT: 20-25 min* vf = 5-15 m/h
Sludge production in separation step:1.0 g DS/g SSremoved
* HRT:10 min* 0.8 mm
* HRT: 15 – 45 min* 20-25 g CODfiltered/m2d
(15-20 g BOD5 filtered/m2d)* 65-85 g CODtot/m2d
(45-60 g BOD5 tot/m2d)* Sludge production:
0.5 g DS/g CODf, removed
THE HIGH RATE MBBR PROCESS
CoagulantFe+polymer
Air
CoagulantFe+polymer
Air
Secondary treatment standard + 90 % P-removal) could be reached at thefollowing process conditions (total residence time ~ 1 hr):
17
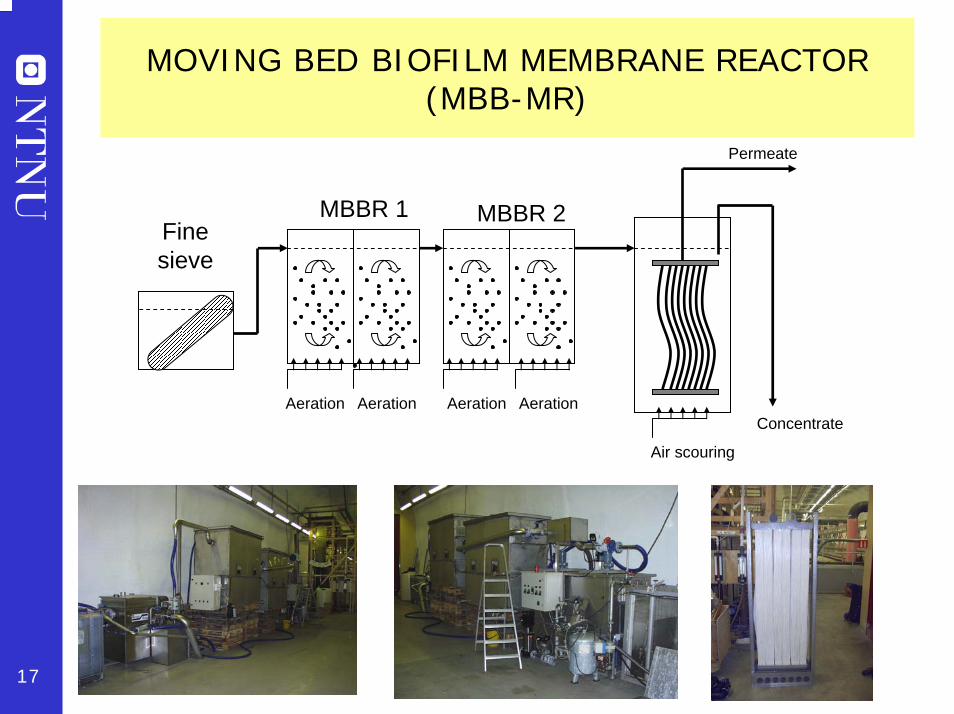
Aeration Aeration Aeration Aeration
Air scouring
Permeate
Concentrate
MBBR 1 MBBR 2Finesieve
MOVING BED BIOFILM MEMBRANE REACTOR (MBB-MR)
18
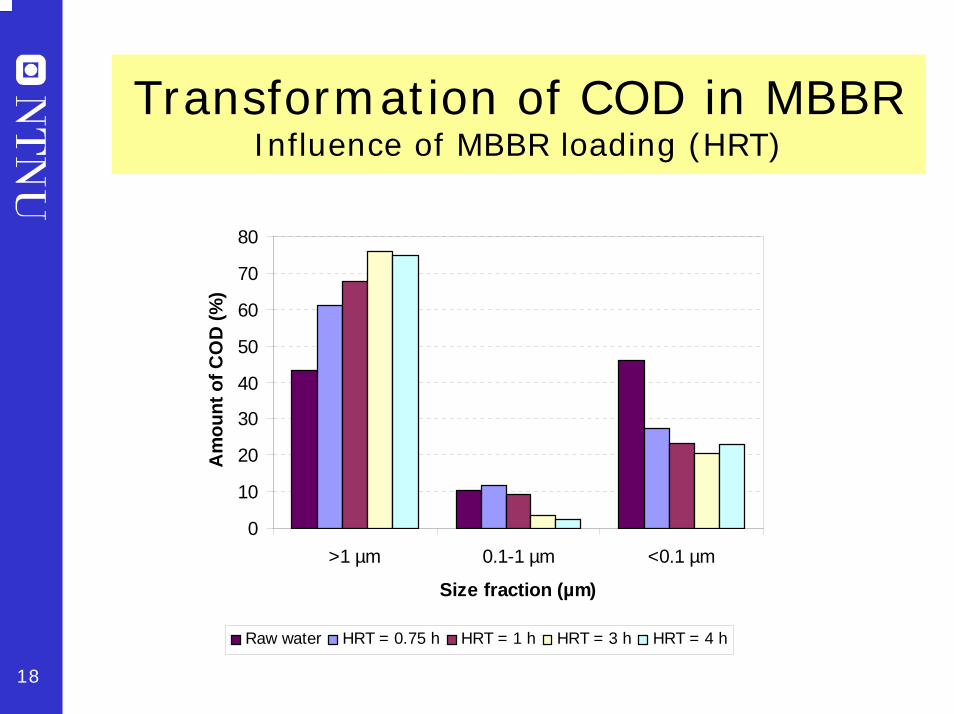
Transformation of COD in MBBRInfluence of MBBR loading (HRT)
0
10
20
30
40
50
60
70
80
>1 µm 0.1-1 µm <0.1 µm
Size fraction (µm)
Am
ount
of C
OD
(%)
Raw water HRT = 0.75 h HRT = 1 h HRT = 3 h HRT = 4 h

19
Performance - example
Parameter Average inletconcentration
(mg/l)
Averageremoval
(%)
CODFCODBODFBODSSNH4-NTot P
39221332217219910,84,6
92-
99-
1009569
0
100
200
300
400
500
600
700
0 5 10 15 20 25 30 35 40
Time (days)
Con
cent
ratio
n (m
g/l)
Raw water COD Raw water FCOD MBBR FCOD Permeate COD
a)
0
1
2
3
4
5
6
0 10 20 30 40
Time (days)
Mem
bran
e ta
nk S
S (g
/l)
0
100
200
300
400
500
600
MB
BR
SS
(mg/
l)
Membrane tank Raw water MBBR
b)
MBBR• Four compartments HRT ~3 hrs• 50% filling fraction (Kaldnes K1)
Membrane reactor:• Zenon Zeeweed 500• Flux: 25 LMH• Recovery: 95%

20
Trans membrane pressure after backwash for different hydraulic retention times in the bioreactors feeding the membrane reactor with biological treated water.
-0.6
-0.5
-0.4
-0.3
-0.2
-0.1
00 1 2 3 4 5 6 7 8 9 10 11 12 13 14 15 16 17 18
operation time (days)
trans
mem
bran
e pr
essu
re
HRT = 0h
HRT = 1h HRT = 3h
HRT = 4h
Challenge : Membrane fouling
• Membrane fouling increases with increasing loading (decreasing HRT)
• On-going research will reveal the role of particles and PSD in this?
Trans membrane pressure development versus membrane operationtime as a function of the MBBR loading (HRT) - Small pilot
21
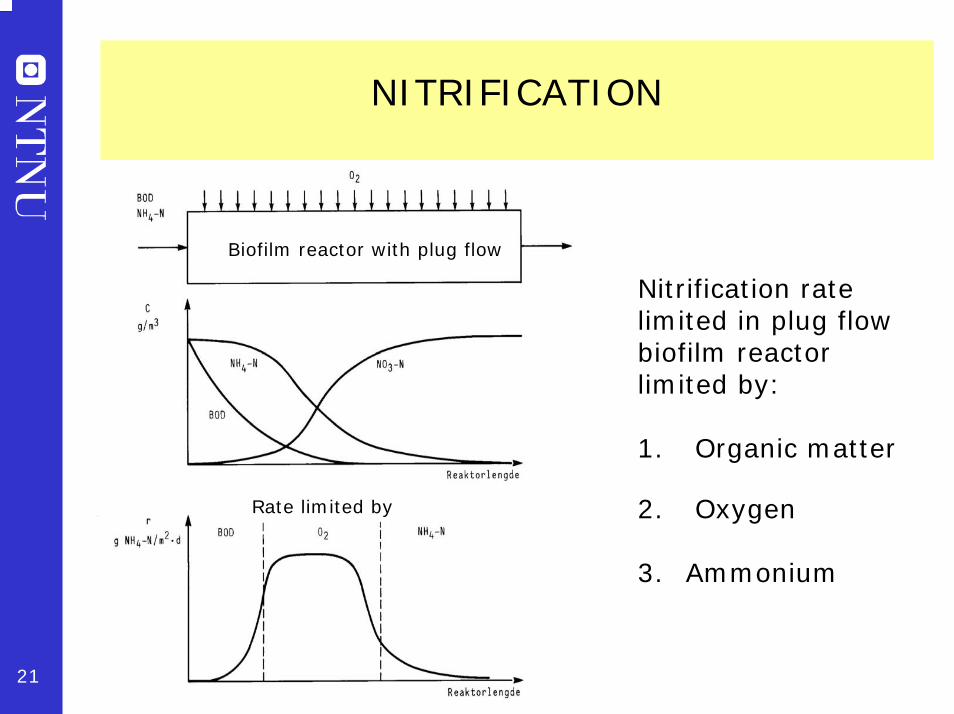
Biofilm reactor with plug flow
Rate limited by
NITRIFICATION
Nitrification rate limited in plug flowbiofilm reactorlimited by:
1. Organic matter
2. Oxygen
3. Ammonium

22
1. The load of organic matter2. The ammonium concentration (< 3 mg NH4-N/l)3. The oxygen concentration
FACTORS DETERMINING THE NITRIFICATION RATE
2.5
2.0
1.5
1.0
0.5
0.00 2 4 6 8 10
a)
Amm
onia
rem
oval
rate
g N
H4-N
/m2 d
Oxygen concentration, mg O2/l
2.5
2.0
1.5
1.0
0.5
0.00
b)
Ammonium concentration, mg NH4-N/l
Nitr
ifica
tion
rate
, g
NH
4-N
/m2 d
DO=9mg/l
DO=6mg/l
DO=3mg/l
0.4g BOD/m2d
Organic load=0.0g BOD 7
/m2 d
1.0
2.0
3.0
4.0
5.0
6.0
7.0
1 2 3 4
2.5
2.0
1.5
1.0
0.5
0.00 2 4 6 8 10
a)
Amm
onia
rem
oval
rate
g N
H4-N
/m2 d
Oxygen concentration, mg O2/l
2.5
2.0
1.5
1.0
0.5
0.00
b)
Ammonium concentration, mg NH4-N/l
Nitr
ifica
tion
rate
, g
NH
4-N
/m2 d
DO=9mg/l
DO=6mg/l
DO=3mg/l
0.4g BOD/m2d
Organic load=0.0g BOD 7
/m2 d
1.0
2.0
3.0
4.0
5.0
6.0
7.0
1 2 3 4
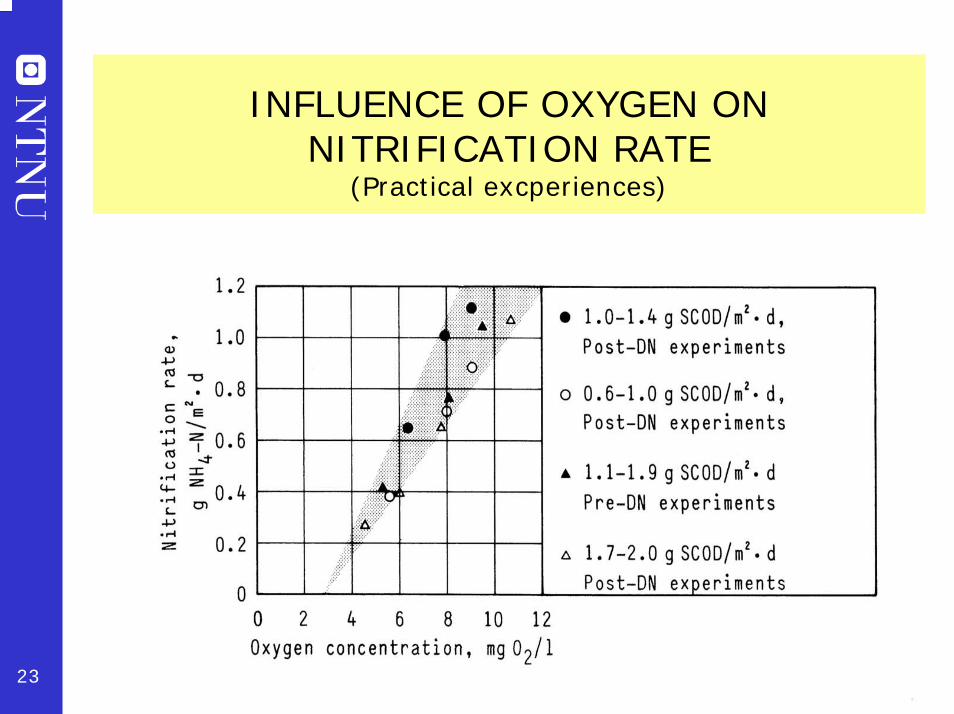
23
INFLUENCE OF OXYGEN ON NITRIFICATION RATE
(Practical excperiences)
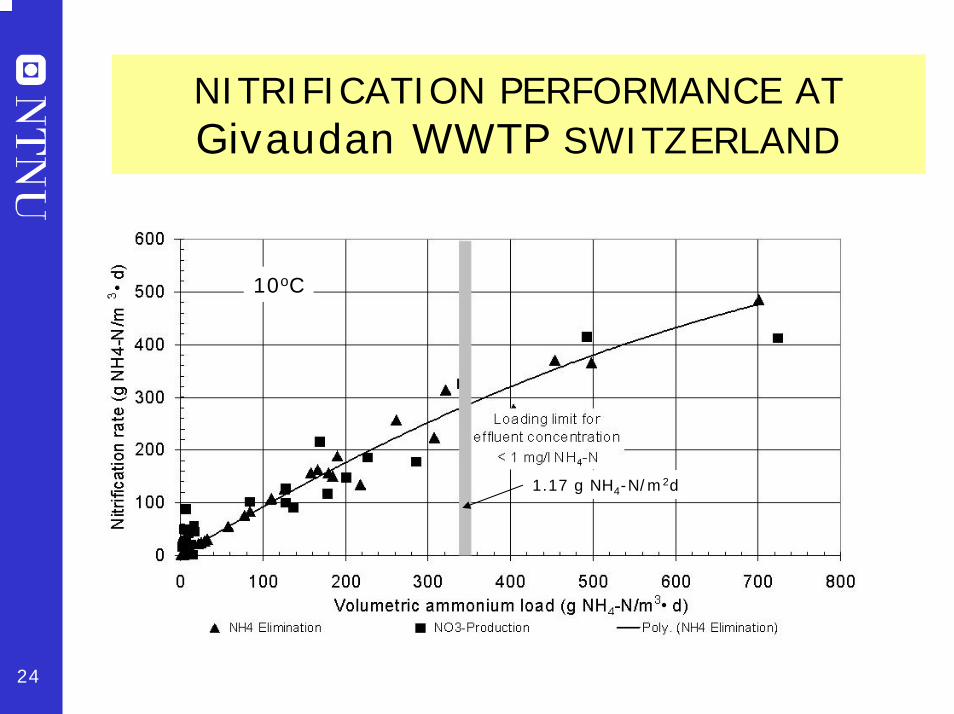
24
NITRIFICATION PERFORMANCE AT Givaudan WWTP SWITZERLAND
10oC
1.17 g NH4-N/m2d

25
Coag.
MBBR pre-denitrificationCoagulation if P-removal required
C Coag.(Coag.)
MBBR post-denitrificationCarbon source addition requiredCoagulation if P-removal requiredMay be operated with CEPT
(Coag.) C Coag.MBBR combination-denitrificationCarbon source requiredCoagulation if P-removal requiredMay be operated with CEPT
C (Coag.)
Activated sludge for nitrificationMBBR post-denitrificationCarbon source requiredCoagulation if P-removal required
Hybrid process – pre-denitrificationin activated sludge. MBBR carriersin last part of reactor to enhancenitrification
N-removal
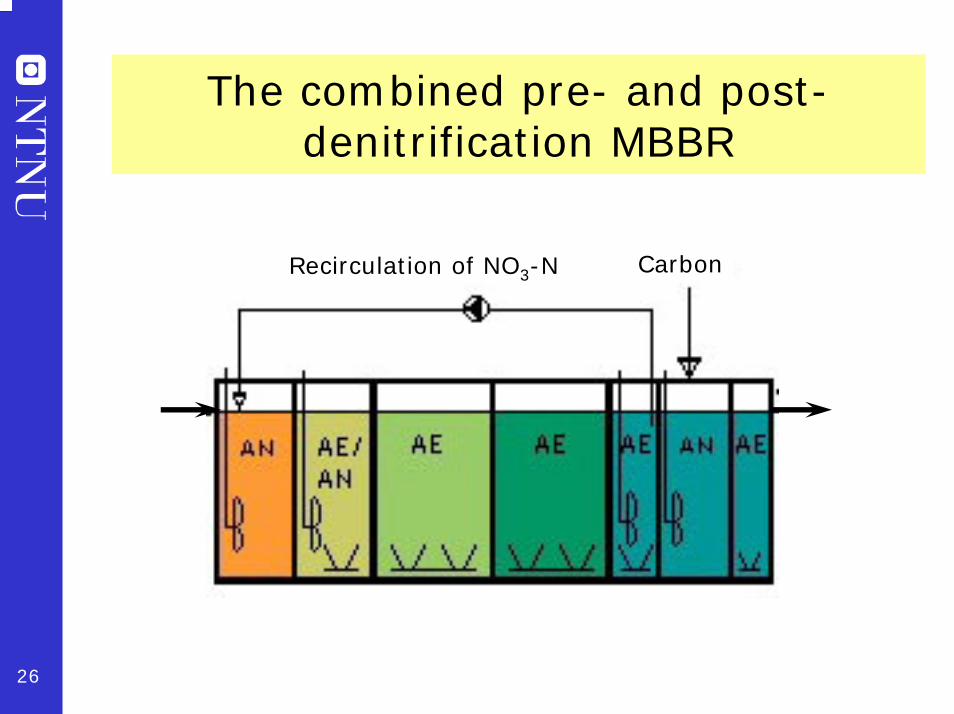
26
The combined pre- and post-denitrification MBBR
Recirculation of NO3-N Carbon

27
The Lillehammer plant
Pumpingstation
Gritrem-oval
Pre-settling
Moving bed reactors Flocculationtanks
Post-settlingtanks
CoagulantCarbon

28
The Nordre Follo plant
Flocculationtanks
Pumpingstation
Gritrem-oval
Pre-settling
Moving bed reactors Flotationtanks
Carbon Coagulant

29
Flocculationtanks
Pumpingstation
Gritrem-oval
Pre-settling
Moving bed reactors Flotationtanks
Carbon Coagulant
The Gardermoen plant

30

31
Design values and performances
Parameter Lillehammer Nordre Follo Gardermoen
Design HRT (hrs)Normal flowMax flow
3,22,0
5,03,3
6,34,4
Chemicals consumpt.Coagulantkg PAX/kg Premoved
Carbon sourceg CODadded/g NOx-Nequiv
26,8
4.25 (ethanol)
17,0
5.5 (methanol)
17,5
4.9 (glycol)
Efficiency, 2002Average in-out conc.and treatment efficiency COD (mg/l)Tot N (mg/l)Tot P (mg/l)
In Out %
386 32 9134.6 4.5 854.38 0.10 97
In Out %
452 30 9430 8.0 73
4.86 0.27 94
In Out %
583 32 9451 10 817.01 0.17 98
32
%
20
40
60
80
100
%
20
40
60
80
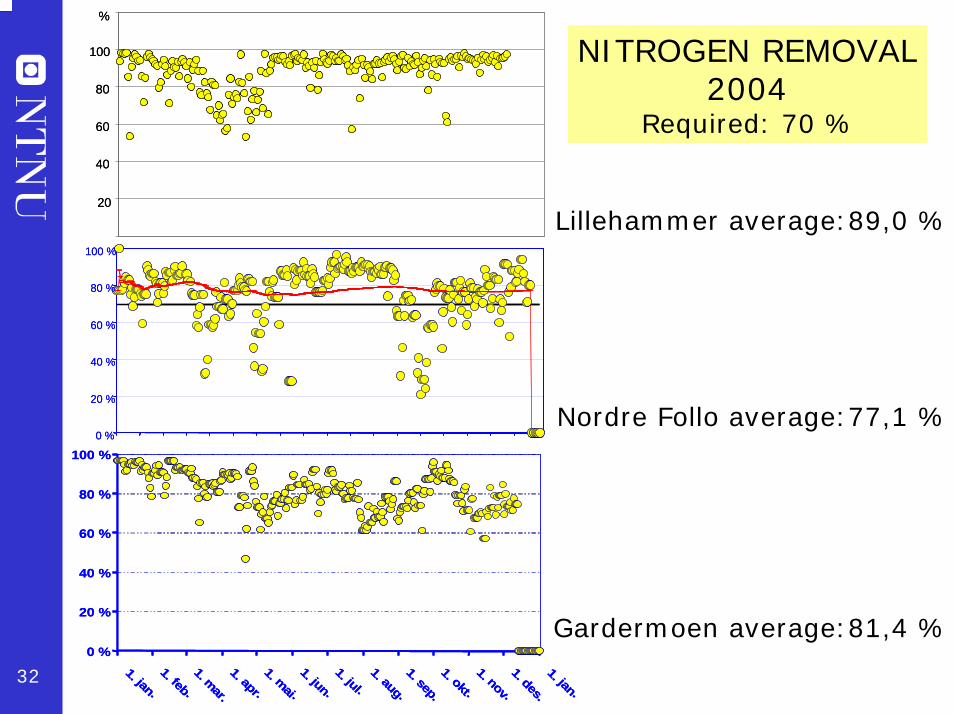
100 NITROGEN REMOVAL2004
Required: 70 %
Lillehammer average:89,0 %
0 %
20 %
40 %
60 %
80 %
100 %
0 %
20 %
40 %
60 %
80 %
100 %
Nordre Follo average:77,1 %
0 %
20 %
40 %
60 %
80 %
100 %
1. jan.1. feb.1. mar.1. apr.1. mai .1. jun.1. jul.1. aug.1. sep.1. okt.1. nov.1. des.1. jan.
0 %
20 %
40 %
60 %
80 %
100 %
1. jan.1. feb.1. mar.1. apr.1. mai .1. jun.1. jul.1. aug.1. sep.1. okt.1. nov.1. des.1. jan.
Gardermoen average:81,4 %
33
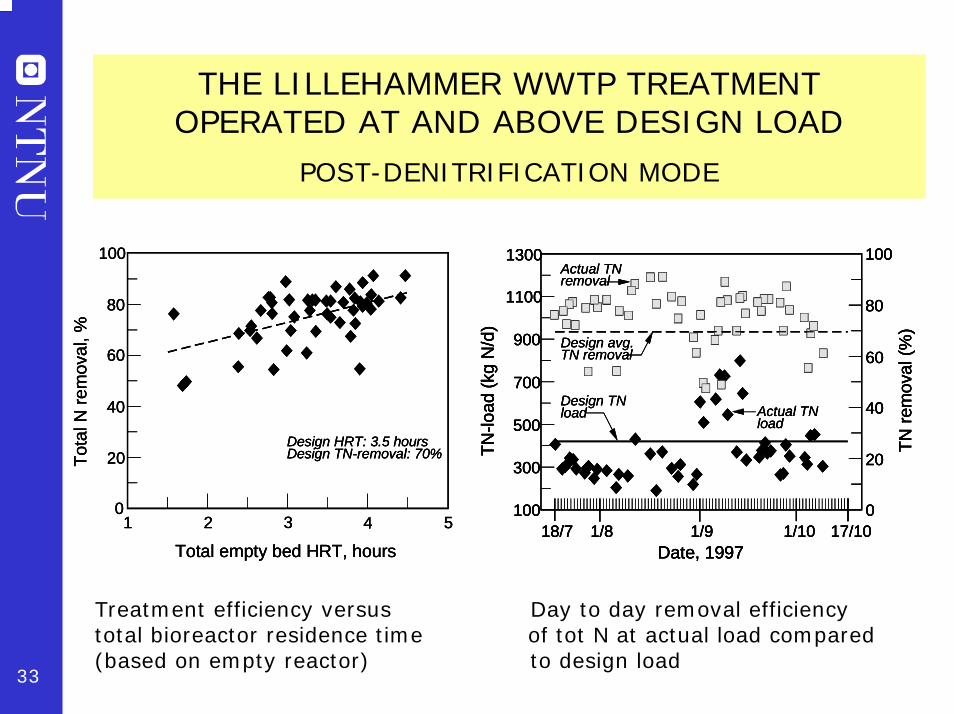
THE LILLEHAMMER WWTP TREATMENT OPERATED AT AND ABOVE DESIGN LOAD
POST-DENITRIFICATION MODE
100
80
60
40
20
01 2 3 4 5
Total empty bed HRT, hours
Tota
l N re
mov
al, %
Design HRT: 3.5 hoursDesign TN-removal: 70%
18/7 1/8 1/9 1/10 17/10
1300
1100
900
700
500
300
100
Date, 1997
100
80
60
40
20
0
TN re
mov
al(%
)
TN-lo
ad(k
g N
/d)
Actual TNremoval
Design avg.TN removal
Actual TNload
Design TNload
100
80
60
40
20
01 2 3 4 5
Total empty bed HRT, hours
Tota
l N re
mov
al, %
Design HRT: 3.5 hoursDesign TN-removal: 70%
100
80
60
40
20
01 2 3 4 5
Total empty bed HRT, hours
Tota
l N re
mov
al, %
Design HRT: 3.5 hoursDesign TN-removal: 70%
18/7 1/8 1/9 1/10 17/10
1300
1100
900
700
500
300
100
Date, 1997
100
80
60
40
20
0
TN re
mov
al(%
)
TN-lo
ad(k
g N
/d)
Actual TNremoval
Design avg.TN removal
Actual TNload
Design TNload
18/7 1/8 1/9 1/10 17/10
1300
1100
900
700
500
300
100
Date, 1997
100
80
60
40
20
0
TN re
mov
al(%
)
TN-lo
ad(k
g N
/d)
18/7 1/8 1/9 1/10 17/10
1300
1100
900
700
500
300
100
Date, 1997
100
80
60
40
20
0
TN re
mov
al(%
)
TN-lo
ad(k
g N
/d)
Actual TNremoval
Design avg.TN removal
Actual TNload
Design TNload
Treatment efficiency versus Day to day removal efficiencytotal bioreactor residence time of tot N at actual load compared(based on empty reactor) to design load

34
Operating data at Lillehammer WWTP
Temp-erature
oC
Average influent inorg. N conc., mg N/l
Average effluent inorg.
N conc., mg N/l
Removal inorg. N
%
Fraction of denitrification in pre-DN, %
Average Minimum Maximum
6,3 6,0 6,5
17,2 16,1 17,7
3,1 2,2 4,1
92,0 74,5 87,6
16 15 17
Operated at 60 % of design load in combination-DN mode at low temperatures
Bioreactor residence time (hrs)
Influent tot N conc.
mg N/l
Effluent tot N conc.
mg N/l
Removal%
Ethanol consumpt.
kg /kg Nrem.
Temp-erature
oC
Average Minimum Maximun
3.3 1.6 4.5
27 16 48
6.0 2.9
12.7
76 48 91
1.48 (3.1)1
0.55 (1.2)1
2.58 (5.4)1
13.7 11.6 15.7
Operated at design load in post-DN mode (without pre-coagulation)

35
OPERATING DATA AT LILLEHAMMER WWTP
Lillehammer, train 1, Nov. 1999
0,0
0,2
0,4
0,6
0,8
1,0
1,2
1,4
1,6
1,8
2,0
0,0 0,5 1,0 1,5 2,0 2,5 3,0
Ammonium load, g NH4-N/m2/d
Rem
oval
rate
, g N
H4-
N/m
2 /d
R4
R4 + R5
Temp. 11 deg C
Very high nitrification rates even at temperatures as low as 11 oC
When calculated on reactor 4 alone, maximum rate was ~1.5 g NH4-N/m2.d
When calculated on both reactor 4 and 5 it was ~1.2 g NH4-N/m2.d up to which nitrification was close to complete.
0
1
2
3
4
0 1 2 3 4 5
Load, g NO3-Neq/m2/d
Rem
oval
rate
, g N
O3-
Neq
/m2/d
Added C/N, g BSCOD/g NO3-Neq
Effl. FCOD, mg/LTemp., deg C
Daytime averagesR7+R8
5.149
11.1
3.458
11.2
3.132
10.2
1. point: DN close to complete because BSCODadded in excess (C/N=6,4)
2. point: Insufficient amount of available BSCOD leading to BSCOD limitation and low DN (60 %)
3. point: C/N-ratio is only slightly higher than 2.but high DN (3.5 g NO3-Nequiv./m2d) becauseno BSCOD limitation prevailed
36
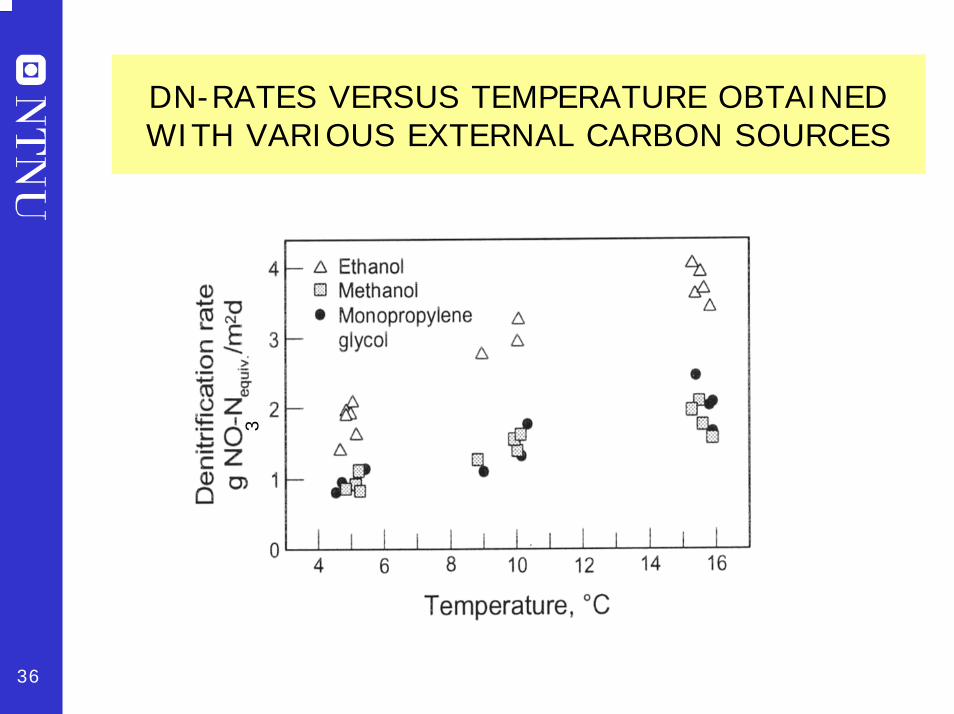
DN-RATES VERSUS TEMPERATURE OBTAINED WITH VARIOUS EXTERNAL CARBON SOURCES
3
37
CONCLUSIONS
1. The MBBR has established itself as a well-proven, robust and compact reactor in all applications of wastewater treatment where a biological process is needed (presently > 300 plants in 22 countries).
2. The primary advantage over activated sludge processes is its compactness and no need for sludge recirculation. The advantage of the process over other biofilm processes is its flexibility. The process is favorably used for activated sludge plant upgrade
3. In Europe the MBBR processes are normally combined with chemical P-removal and flotation is favorably used for biomass separation in several cases
4. When using MBBR for N-removal, a combined pre- and post-denitrification is normally recommended because this process combination is superior with respect to process control and performance