MBA VTU Project on VOLVO Group in India
166
worlD ToGeTher we MoVe The The VolVo Group annual reporT 2011
-
Upload
lakshmish-gopal -
Category
Documents
-
view
222 -
download
0
Transcript of MBA VTU Project on VOLVO Group in India

7/29/2019 MBA VTU Project on VOLVO Group in India
http://slidepdf.com/reader/full/mba-vtu-project-on-volvo-group-in-india 1/166
worlD
ToGeTher we MoVe The
The VolVo Group
annual reporT 2011
7/29/2019 MBA VTU Project on VOLVO Group in India
http://slidepdf.com/reader/full/mba-vtu-project-on-volvo-group-in-india 2/166
ToGeTher we
MOVE THE WORLD
This report contains ‘for ward-looking statements’. Such statements reect management’s current expectations with respect to cer tain future events and
potential nancial performance. Although the Company believes that the expectations reected in such forward looking statements are reasonable, noassurance can be given that such expectations will prove correc t. Such statements are subject to risk and uncer tainties and such future events and nancialperformance could differ materially from those set out in the forward looking statements as a result of, among other factors, (i) changes in economic, marketand competitive conditions, (ii) success of business and operating initiatives , (iii) changes in the regulatory environment and other government actions, (iv)uctuations in exchange rates and (v) business risk management.
This report does not imply that the company has undertaken to revise these forward looking statements beyond what is required under the company’s
Without the products and services of the Volvo Group the societies
where many of us live would not function. Like lifeblood, our trucks,
buses, engines, construction equipment and aircraft components are
involved in many of the functions that most of us rely on every day.
For instance, one in seven meals eaten in Europe reaches the con-
sumers thanks to trucks from the Volvo Group rolling on the roads of the
continent. Buses are the most common type of public transportation in
the world, helping many people to reach work, school, vacations, friends
and family. And if all the Volvo buses in the world were to start at the
same time, they would transport more than 10 million people.
Every year, the population on earth produces billions of tons of gar-
bage. In the US alone, the garbage removed by refuse trucks from the
Volvo Group every week could form a line of full garbage cans that
would reach the moon.
These are just a few examples. In this Annual Report, you can learn
more about the Volvo Group – Together we move the world.
A global group
2 CEO comment
4 Vision, values and wanted position
6 Financial targets8 Volvo Group new organization
10 Global strength
12 Development by continent – Europe
16 Development by continent – North America
20 Development by continent – South America
24 Development by continent – Asia
28 Overall challenges
30 Challenge – Bus Rapid Transit
34 Challenges – Intelligent Transport Solutions
38 Brands
40 The Volvo Group’s product offering
42 World-class services
44 Industrial structure
Board of Directors’ report
46 Sustainable development
52 The share
54 Signicant events
56 Trucks
58 Construction Equipment
60 Buses
62 Volvo Penta
64 Volvo Aero
66 Volvo Financial Services
68 Financial strategy
69 Risks and uncertainties Financial information
71 Financial information 2011
72 Financial performance
72 Consolidated income statement andOther comprehensive income
76 Financial position
76 Consolidated balance sheet
78 Consolidated cash-ow statements
80 Changes in consolidatedShareholders’ equity
81 Notes to the consolidated nancialstatements
126 Parent Company AB Volvo
138 Proposed remuneration policy
139 Proposed disposition of unappropriated
earnings140 Audit Report for AB Volvo
141 Eleven-year summary
Corporate Governance Report
150 Group Management
152 Board of Directors and Auditors
154 Corporate Governance Report
Fold-out Denitions
Annual General Meeting
7/29/2019 MBA VTU Project on VOLVO Group in India
http://slidepdf.com/reader/full/mba-vtu-project-on-volvo-group-in-india 3/166
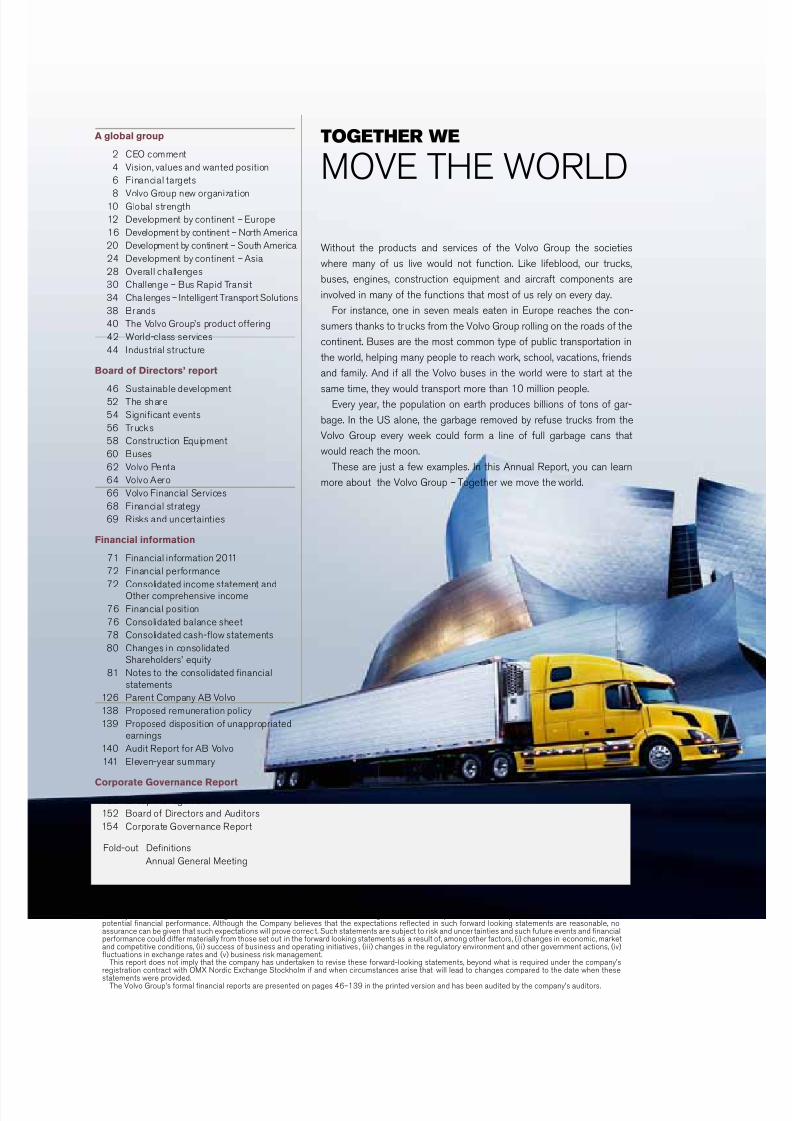
VolVo Group
The Volvo Group is one of the world’s leading manufacturers of trucks, buses,construction equipment, drive systems for marine and industrial applications and
aerospace components. The Volvo Group also provides complete solutions for
nancing and service. The Group has about 100,000 employees, production
facilities in 20 countries and sales in more than 190 markets.
Global strengthSince the streamlining towards commercial vehicles was initiated more than ten
years ago, the Volvo Group has grown into one of the world’s largest manufac-
turers of heavy-duty trucks, buses and construction equipment and is today also
a leading manufacturer of heavy-duty diesel engines, marine and industrial
engines as well as engine components for the aerospace industry.More information. 10
Europe, 39%
North America, 19%
South America, 11%
Asia, 24%
Rest of the world, 7%
Share of Group’s net sales by geographyShare of Group’s net sales
Trucks 64%
Construction Equipment 21%
Buses 7%
Volvo Penta 3%
Volvo Aero 2%Customer Finance 3%
Strong brands
By selling products under different brands , the Group can address many different customer andmarket segments in mature as well as growth markets.
More information. 38
North America
+
20112000
60.640.7
+49%
7/29/2019 MBA VTU Project on VOLVO Group in India
http://slidepdf.com/reader/full/mba-vtu-project-on-volvo-group-in-india 4/166
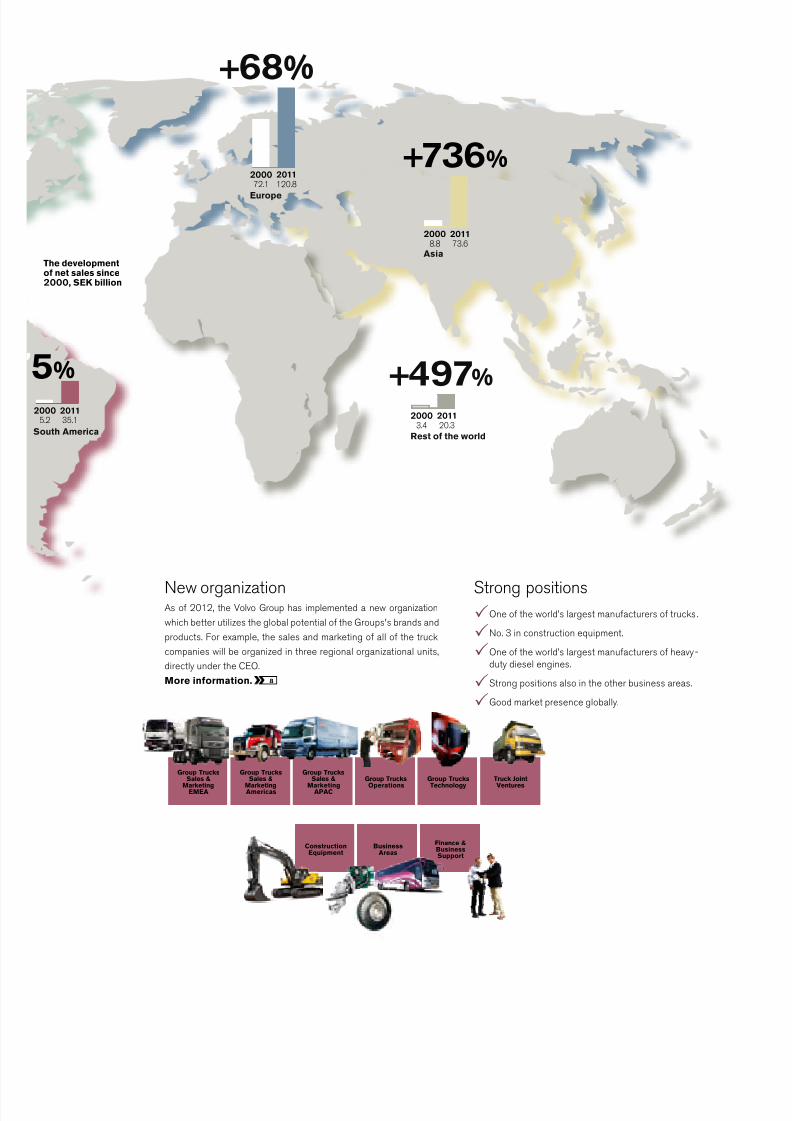
New organizationAs of 2012, the Volvo Group has implemented a new organization
which better utilizes the global potential of the Groups's brands and
products. For example, the sales and marketing of all of the truck
companies will be organized in three regional organizational units,
directly under the CEO.
More information. 8
Strong positions
One of the world’s largest manufacturers of trucks .
No. 3 in construction equipment.
One of the world’s largest manufacturers of heavy-
duty diesel engines.
Strong positions also in the other business areas.
Good market presence globally.
e developmentnet sales since00, SEK billion
Asia
Rest of the world
Group TrucksSales &
MarketingEMEA
Group TrucksSales &
MarketingAmericas
Group TrucksSales &
MarketingAPAC
Group TrucksOperations
Group TrucksTechnology
Truck JointVentures
ConstructionEquipment
BusinessAreas
Finance &BusinessSupport
20112000
73.68.8
+736%
%
20112000
20.33.4
+497%
20112000
120.872.1
+68%
20110
35.1
h America
Europe
7/29/2019 MBA VTU Project on VOLVO Group in India
http://slidepdf.com/reader/full/mba-vtu-project-on-volvo-group-in-india 5/166
The VolVo group 2011
Sg gS
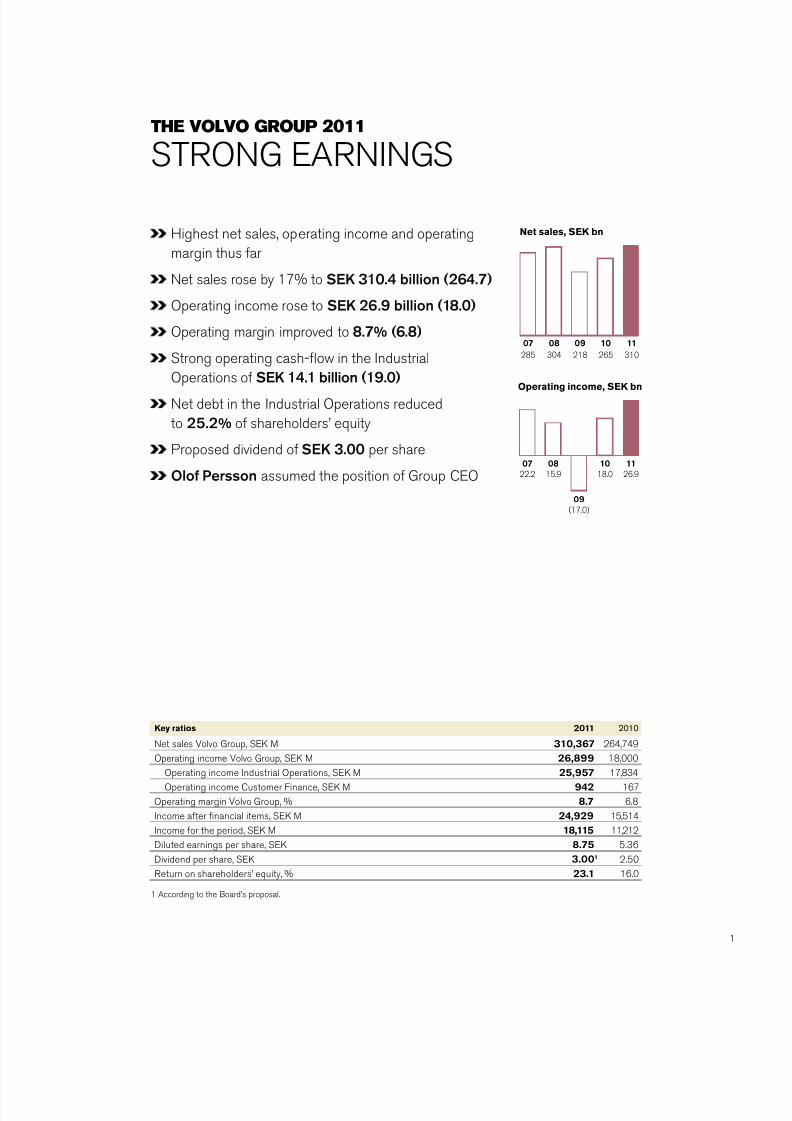
Key ratios 2011 2010
et sales Volvo group, SK M 310,367 264,749
peratin income Volvo group, SK M 26,899 18,000
peratin income ndustrial perations, SK M 25,957 17,834
peratin income Customer Finance, SK M 942 167
peratin marin Volvo group, % 8.7 6.8
ncome after nancial items, SK M 24,929 15,514
ncome for the period, SK M 18,115 11,212
Diluted earnins per share, SK 8.75 5.36
Dividend per share, SK 3.001 2.50
eturn on shareholders’ equity, % 23.1 16.0
1 ccordin to the Board’s proposal.
Hihest net sales, operatin income and operatin
marin thus far
et sales rose by 17% to SEK 310.4 billion (264.7)
peratin income rose to SEK 26.9 billion (18.0)
peratin marin improved to 8.7% (6.8)
Stron operatin cash-ow in the ndustrial
perations of SEK 14.1 billion (19.0)
et debt in the ndustrial perations reduced
to 25.2% of shareholders’ equity
Proposed dividend of SEK 3.00 per share
Olof Persson assumed the position of group C
Net sales, SEK bn
1110090807
310265218304285
Operating income, SEK bn
080807
09
(17.0)
15,915.922.2
11
26.9
10
18.0

7/29/2019 MBA VTU Project on VOLVO Group in India
http://slidepdf.com/reader/full/mba-vtu-project-on-volvo-group-in-india 6/166
gB gP 2011
A record year. That is one way of summing up 2011. We put the best
year ever under our belt and I can proudly state that all the hard work of
the Volvo Group’s employees to deliver the best products, services and
after-sales serv ice generated results.
Ceo CommenT
BS V
For the full-year 2011, the Volvo group enerated the
hihest net sales, the best operatin income and the
hihest operatin marin to date. et sa les rose to SK
310 billion (265), operatin income improved to SK 26.9
billion (18.0) and the operatin marin was 8.7% (6.8). t
the same time, return on operatin capital in the ndus-
trial perations rose to 28.8% and
return on shareholders’ equity in the
group to 23.1%.
Success in many ways
Success can be measured in
numerous ways; sales, orders
received or market shares. n par-
ticular, believe market shares pro-
vide a rapid and key indication of our
customers’ true opinions of our prod-
“We have now taken the rst steps on a journey which will
be full of challenges, but I am convinced that there is poten-
tial to increase sales and improve protability over time.”
ucts and how we compare to the competition. Market
shares comprise a clear acknowledement that we are
doin the riht thins.
et me provide a couple of examples from the past
year. t is wor th notin that enault rucks maintained its
market share in urope despite weak demand in its his-
toric stron markets in Southern urope. he Volvo brand
reaped reat success and in the heavy-duty sement in
urope increased its market share to a record 16.0%.
he uropean market weakened somewhat towards
the end of the year but after that stabilized on the new,
slihtly lower level.
Market shares in orth merica also increased. n
the .S., Volvo and Mack had a combined 19.8% of the
market for heavy-duty trucks. fter a number of slow years,
the situation is startin to appear very positive in orth
merica where we have made breakthrouhs with our
own enines and transmissions, an unbeatable
combination with a fuel-consumption that is
praised by our customers.
n Brazil, our market share rose to
17.1% for heavy-duty trucks and, for
the rst time, Volvo is the leader at the
top of the heavy-duty truck sement.
n the short-term, the Brazilian market
will be impacted by the transition to
new emission standards that took
place at the turn of the year, but we
have a positive view on the lon-term
development in Brazil and the other
markers in South merica.
2

7/29/2019 MBA VTU Project on VOLVO Group in India
http://slidepdf.com/reader/full/mba-vtu-project-on-volvo-group-in-india 7/166
world’s larest manufacturers of commercial vehicles
with stron positions in mature markets and with an
increasinly important presence in rowth markets. s a
step in further streamlinin the Volvo group towards
commercial vehicles, durin the year we initiated a pro-cess aimed at divestin Volvo ero.
Financially strong Group
Driven by improved protability and the ood cash ow,
the net nancial debt in the industrial operation was
down to 25% of shareholders’ equity at year-end, which
means that the group is nancially stron in an environ-
ment that in the beinnin of 2012 is characterized by
turmoil in the nancial markets and uncertain macro-
economic trends.
he Board of Directors proposes a dividend of SK
3.00 per share for 2011, up SK 0.50 per share com-
pared with the precedin year.
Reorganization to increase sales and proftability
We have a new vision – to become the world leader in
sustainable transport solutions. We shall fulll this by
creatin value for our customers and by pioneerin the
development in our industries. We have new nancial tar-
ets, a new oranization and a number of new manae-
ment teams in place. n January 1, 2012, we introduced
the new oranization which was put in place to better
capitalize on the lobal potential in our products and
brands and to improve the group’s efciency.
With the recent very positive trends in the group’s
development, we are in a favorable position. However,
this does not mean that everythin will run on rails.
reat deal of work remains. We have now taken the rst
steps on a journey which will be full of challenes, but
am convinced that there is potential to increase sales and
improve protability over time. his is a journey that am
very much lookin forward to.
lof PerssonPresident and C
Volvo Construction quipment (Volvo C) has also
strenthened its positions in several rowth markets
worldwide. n China our brands Volvo and SDg ained
the position as market leader within wheel loaders and
excavators. SDg recently launched new models of exca-vators, so we have hopes that the success in this iant
market will continue.
would also like to mention our hybrid buses that are
attractin an increasin amount of interest around the
world.
Increased proftability
good market conditions in the main and increasin market
shares driven by competitive products translated into us
deliverin some 238,000 trucks durin 2011 – an increase
of 32% compared to the precedin year. et sales in the
truck operations surpassed SK 200 billion and prot-
ability improved to an operatin marin of 9.1%.Volvo C increased its deliveries by almost 30% to the
new record level of 84,000 machines. he year was
intense with the launch of many new products and a con-
tinued expansion in rowth markets. Despite a stron
headwind from the weak dollar, Volvo C delivered an
operatin income of SK 6.7 billion and an operatin
marin of 10.2%.
From a historic perspective, Volvo Buses had a ood
year, both in terms of volumes and protability. his was
achieved by successful efforts to row in emerin mar-
kets, which offset the continued weak markets in urope
and the .S. peratin income increased to SK 1 billion
and operatin marin improved to 4.6%, which is below the
group averae but ood when compared to competitors.
Volvo Penta was impacted by a continued weak market
for marine enines and towards the end of the year also
for industrial enines, but despite this, achieved an oper-
atin income of almost SK 800 M with an operatin
marin of 8.8%.
For our Customer Finance perations, the trend pointed
in the riht direction, with portfolio rowth and lower
credit losses.
Volvo ero also had to strule with a sinicant
headwind from currency. Despite this, Volvo ero’s oper-
atin marin amounted to 5.2%.Durin my predecessor eif Johansson’s 14 years as
C, the Volvo group established itself as one of the
7/29/2019 MBA VTU Project on VOLVO Group in India
http://slidepdf.com/reader/full/mba-vtu-project-on-volvo-group-in-india 8/166
gB gP 2011
Vision
wanTedposiTion
Values
gB gP 2011
4

7/29/2019 MBA VTU Project on VOLVO Group in India
http://slidepdf.com/reader/full/mba-vtu-project-on-volvo-group-in-india 9/166
Our vision
he Volvo group’s vision is to become the world leader in sustainable transport solutions by:
• creatin value for customers in selected sements
• pioneerin products and services for the transport and infrastructure industries
• drivin quality, safety and environmental care
• workin with enery, passion and respect for the individual.
Volvo Group wanted position 2020
We are amon the most protable in our industry
We are our customers’ closest business par tners
We have captured protable rowth opportunities
We are proven innovators of enery-efcient transport solutions
We are a lobal team of hih performin people
Our values
he Volvo group views its corporate culture as a unique asset, since it is difcult for competitors to copy. By applyin and
strenthenin the expertise and culture we have built up over the years, we can achieve our vision.
Quality, safety and environmental care are the values that form the Volvo group’s common base and are important
components of our corporate culture. he values have a lon tradition and permeate our oranization, our products and
our way of workin. ur oal is to maintain a leadin position in these areas.
Environmental care
We believe that it is self-evident that our
products and our operations shall have
the lowest possible adverse impact on
the environment. We are workin to fur-
ther improve enery efciency and to
reduce emissions in all aspects of our
business, with particular focus on the
use of our products. ur oal is for the
Volvo group to be ranked as a leader in
environmental care within our industry.
o achieve this oal, we strive for a holistic
view, continuous improvement, technical
development and efcient resource utili-
zation.
Saety
Safety pertains to how our products are
used in society. We have had a leadin
position in issues reardin safety for a
lon time; our oal is to maintain this
position. focus on safety is an interal
part of our product development work.
ur employees are hihly aware of
safety issues, and the knowlede ained
from our internal crash investiations is
applied in product development. ur
oal is to reduce the risk of accidents
and mitiate the consequences of any
accidents that may occur as well as to
improve the personal safety and thework environment of the drivers of our
vehicles and equipment. ur lon-term
vision is zero accidents.
Quality
Quality is an expression of our oal to
offer reliable products and services. n
all aspects of our operations, from product
development and production to delivery
and customer support, the focus shall
be on customers’ needs and expecta-
tions. ur oal is to meet or exceed their
expectations. With a customer focus
based on everyone’s commitment and
participation, our aim is to be number
one in customer satisfaction. his is
based on a culture in which all employees
are responsive and aware of what must
be accomplished to be the best busi-ness partner.
new
new

7/29/2019 MBA VTU Project on VOLVO Group in India
http://slidepdf.com/reader/full/mba-vtu-project-on-volvo-group-in-india 10/166
gB gP 2011 gB gP 2011
The Volvo Group’s previous nancial goals were established by the Board in September 2006.
The Board focused on three goals comprising growth, operating margin and capital structure
for the Group’s Industrial Operations.
Growth
he rowth taret was that net sales should increase by a
minimum of 10% annually. Durin 2007–2011, the averae
rowth rate was 2.1% annually.
Operating margin
he Volvo group’s protability taret was that operatin marin
for the ndustrial operations was to exceed an averae of 7%
annually over a business cycle. he averae annual operatin
marin for the Volvo group’s ndus trial perations was 4.1%
from 2007 to 2011.
Capital structure
he capital structure taret is set to a net debt includin
provisions for post-employment benets for the ndustrial
operations of a maximum of 40% of shareholders’ equity
under normal conditions. s of December 31, 2011, the
Volvo group’s ndustrial operations had a net nancial debt
position correspondin to 25.2% of shareholders’ equity.
he taret for Customer Finance is a return on shareholders’
equity of 12–15% and an equit y ratio above 8%. he averae
annual return on shareholders’ equity for 2007–2011
amounted to 6%. t year end 2011 the equit y ratio was 9.1%.
1
2
34
FinanCial TargeTs
21
10
18
11
10
07
(30)
0
6
08
(28)
09
10
Target: above 10%
Net sales growth, %
6.9
10
8.6
11
7.8
07
0
5.2
08
(7.8)
09
10
(10)
Target: above 7%
Operating margin, %
37.4
10
25.2
11
5.7
07
0
(20)
(40)
39.7
08
70.9
09
40
20
80
60
N
e t c a s h
N e t d e b t
Target: below 40%
Net fnancial debt as percentageo shareholders’ equity, %
0.4
10
7.3
11
15.9
07(10)
0
12.6
08
(6.2)
09
15
10
5
(5)
Target: 12–15
Return on shareholders’ equity, %
Financial goals or Industrial Operations
Financial goals or Customer Finance Operations
2011
6

7/29/2019 MBA VTU Project on VOLVO Group in India
http://slidepdf.com/reader/full/mba-vtu-project-on-volvo-group-in-india 11/166
In September 2011 the Board of Directors of AB Volvo decided to implement new nancial
targets for the Volvo Group starting in 2012. The new targets have been set in order to enable
the growth and protability of the various operations to be measured and benchmarked annually
against competitors.
Transparent comparison with competitors
Volvo’s nancial tarets have included a focus on rowth
since the end of the 1990s and the Board of Directors
expects rowth to remain important in the future, but is
now addin a continuous benchmarkin of the rowth
and protability of the various operations aainst a
number of selected competitors.
o facilitate comparisons, the truck operations will be
measured jointly with the bus operations and the con-
struction equipment operations will be measured jointly
with Volvo Penta. n 2012, the comparisons will be made
in accordance with the table below:
Trucks and buses Volvo CE and Volvo Penta
Daimler Brunswick
veco C
M CH
avistar Cummins
Paccar Deere
Scania Hitachi
Sinotruk Komatsu
erex
The targets are ollowed up annually
• he annual oranic sales rowth for the truck, bus and
construction equipment operations, as well as Volvo
Penta, shall be equal to or exceed a weihted-averae
for comparable competitors.
• ach year, the operatin marin for the truck, bus and
construction equipment operations, as well as Volvo
Penta, shall be ranked amon the top two companies
when benchmarked aainst relevant competitors.
• For Customer Finance perations, the existin tarets
of 12–15% return of equity () and an equity ratio
exceedin 8% stand rm.
• Volvo ero has an taret of 15–25%. When calcu-
latin the , Volvo ero will be assined the
same equity ratio as that for the group’s ndustrial
perations.
• he capital structure taret is set to a net debt, includin
provisions for post-employment benets, for the ndus-
trial perations of a maximum of 40% of shareholders’
equity under normal conditions.
W gS FM2012
“Following the Group’s successfulgeographic and volume expansion, we have the prerequisites in place to compete successfully in our various product segments and it is with this in mind that the Boardhas now decided to introduce newnancial targets.”
7/29/2019 MBA VTU Project on VOLVO Group in India
http://slidepdf.com/reader/full/mba-vtu-project-on-volvo-group-in-india 12/166
gB gP 2011
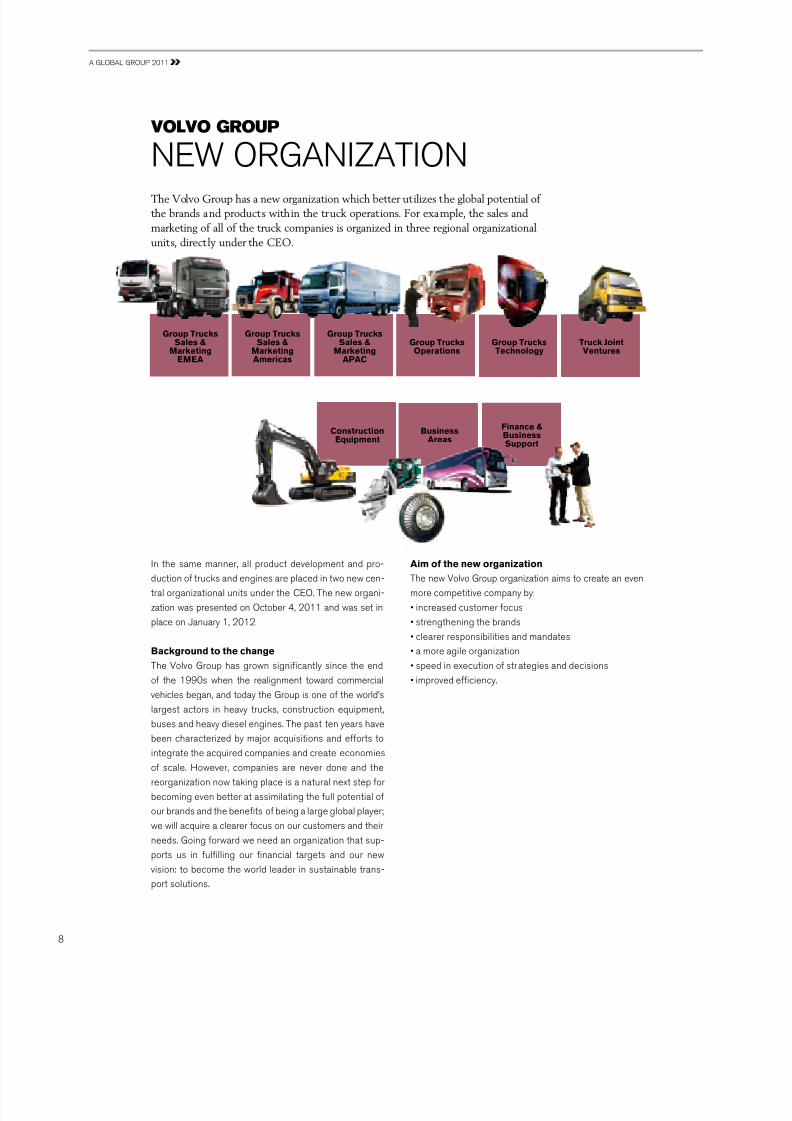
n the same manner, all product development and pro-
duction of trucks and enines are placed in two new cen-
tral oranizational units under the C. he new orani-
zation was presented on ctober 4, 2011 and was set in
place on January 1, 2012.
Background to the change
he Volvo group has rown sinicantly since the end
of the 1990s when the realinment toward commercial
vehicles bean, and today the group is one of the world’s
larest actors in heavy trucks, construction equipment,
buses and heavy diesel enines. he past ten years have
been characterized by major acquisitions and efforts tointerate the acquired companies and create economies
of scale. However, companies are never done and the
reoranization now takin place is a natural next step for
becomin even better at assimilatin the full potential of
our brands and the benets of bein a lare lobal player;
we will acquire a clearer focus on our customers and their
needs. goin forward we need an oranization that sup-
ports us in fulllin our nancial tarets and our new
vision: to become the world leader in sustainable trans-
port solutions.
The Volvo Group has a new organization which better utilizes the global potential of
the brands and products within the truck operations. For example, the sales and
marketing of all of the truck companies is organized in three regional organizational
units, direct ly under the CEO.
VolVo group
W g
Group TrucksSales &
MarketingEMEA
Group TrucksSales &
MarketingAmericas
Group TrucksSales &
MarketingAPAC
Group TrucksOperations
Group TrucksTechnology
Truck JointVentures
ConstructionEquipment
BusinessAreas
Finance &BusinessSupport
Aim o the new organization
he new Volvo group oranization aims to create an even
more competitive company by:
• increased customer focus
• strenthenin the brands
• clearer responsibilities and mandates
• a more aile oranization
• speed in execution of strateies and decisions
• improved efciency.
8

7/29/2019 MBA VTU Project on VOLVO Group in India
http://slidepdf.com/reader/full/mba-vtu-project-on-volvo-group-in-india 13/166
ew oranization FQ
1. What will the new organization bring that is
so much better?
governance will become clearer and more efcient with
a clearer focus on brands and customers. Branded com-
panies in the truck business previously operated as both
independent units and part of a wider group structure.
he branded companies’ operations, product plannin,
product development and manufacturin are now coordi-
nated centrally, directly under the C, with a clear divi-
sion of responsibilities and minimum overlaps.
2. What happens to Volvo Trucks, Renault
Trucks, Mack and UD Trucks?
Sales and marketin of all of the truck companies is
oranized in three reional oranizational units. group
rucks Sales and Marketin mericas (comprisin all of
orth and South merica) with lobal responsibility for
the Mack brand, under the leadership of Dennis Slale.
group rucks Sales and Marketin M (comprisin
urope, the Middle ast and frica) with lobal responsi-
bility for the Volvo and enault brands, under the leader-
ship of Peter Karlsten. group rucks Sales & Marketin
PC (comprisin sia and Pacic) with lobal responsi-
bility for the D rucks brand, D, under the leadership of
Joachim osenber. ll product development and pro-
duction of trucks and enines is oranized in two new
central units: group rucks echnoloy and group rucksperations. here are no chanes to the nancial external
reportin – truck companies report their earnins com-
bined as previously.
3. What happens with Volvo CE?
he oranization remains intact. he Head of Volvo C,
Pat lney, continues to report directly to the C, lof
Persson. With respect to nancial external reportin, there
is no chane – the business areas report their results as in
the past.
4. What happens with Volvo Buses, Volvo Penta
and Volvo Aero?
he companies are oranized under Business reas,
headed by Håkan Karlsson. Per Carlsson has assumed
the position as new Head of Volvo Buses. göran gummeson
remains Head of Volvo Penta until pril 1, 2012 when he
is succeeded by Björn nemansson, but he no loner
reports directly to the C. Staffan achrisson remains
Head of Volvo ero but does not any loner report
directly to the C. With respect to nancial external
reportin, there is no chane – the business areas report
their results as in the past.
5. What happens with Volvo Financial Services?
he company is oranized under Finance and Business
Support headed by the new CF nders sber. Mar tin
Weissbur continues to head Volvo Financial Services
but does not any loner report directly to the C. With
respect to nancial external reportin, there is no chane
– the business areas report their results as in the past.
6. What happens with the dierent
business units?
Production is oranized under group rucks perations
headed by Mikael Bratt, while product development is
under group rucks echnoloy headed by orbjörn Holm-
ström. Volvo Parts has been divided into various units
based on their specic operations. he loistics portion
of Parts, as well as emanufacturin, falls under group
rucks perations. Purchasin is oranized under group
rucks echnoloy, where all other purchasin acti vities
are collected.
Volvo oistics falls under group perations, where all
loistics are handled.
Volvo Business Services, Volvo and Volvo group
eal state are oranized under Finance and Business
Support.
Volvo echnoloy and on-automotive Purchasin (P)
are oranized under group rucks echnoloy.

7/29/2019 MBA VTU Project on VOLVO Group in India
http://slidepdf.com/reader/full/mba-vtu-project-on-volvo-group-in-india 14/166
gB gP 2011
The Volvo Group’sacquisitions and
divestments
Durin this time, a number of acquisitions have been
made, which have brouht economies of scale and
increased eoraphical reach.
Volvo group has durin this time also successfully
established itself outside its historical markets of urope
and orth merica and ained a stron foothold in the
rowin markets of astern urope, South merica and
sia. Dur in 2011, the markets outside of Western urope
and orth merica accounted for for 49% of the ndustrial
perations’ total sales, compared to 17% in 2000.
n the followin paes there is more information
about the development on important markets and on
some of the Volvo group’s investments and successes on
them.
Long-term growth
he recovery that started in the group’s mature markets
in 2010 continued in Western urope and orth merica
durin 2011, with some tendencies towards a weakenin
in urope towards the end of the year. verall, demand in
the group’s rowth markets continued its stron devel-
opment, but also here demand weakened somewhat
towards the end of the year.
n the lon-term, demand for freiht capacit y, and thus
many of the group’s products, is closely linked to the
gDP trend. he extent of investment in infrastructure,
which drives demand for buildin and construction equip-
ment, is also closely linked to the gDP trend. n the
somewhat shorter-term, demand is affected by a number
of factors includin fuel prices, the implementation of
new emission reulations, interest rates, etc.
Since the streamlining towards commercial vehicles was initiated more than
ten years ago, the Volvo Group has grown into one of the world’s largest
manufacturers of heavy-duty trucks, buses and construction equipment and
is today also a leading manufacturer of heavy-duty diesel engines, marine and
industrial engines as well as eng ine components for the aerospace industry.
1998AcquisitionoftheexcavatoroperationsofSamsungHeavyIndustries.
1999SaleofVolvoCarstoFord.
2001Acquisitionofthetruckmanu-facturersMackandRenaultVI.
2003AcquisitionofBilia’sEuro-peantruckandconstructionequipmentdealers.
2004Saleofaxle-manufacturingoperationstoArvinMeritor.
2004Acquisitionofremaining50%oftheCanadianbusmanufacturerPrévost.
global sTrengTh
CHgg WD
gB gP 2011
10
7/29/2019 MBA VTU Project on VOLVO Group in India
http://slidepdf.com/reader/full/mba-vtu-project-on-volvo-group-in-india 15/166
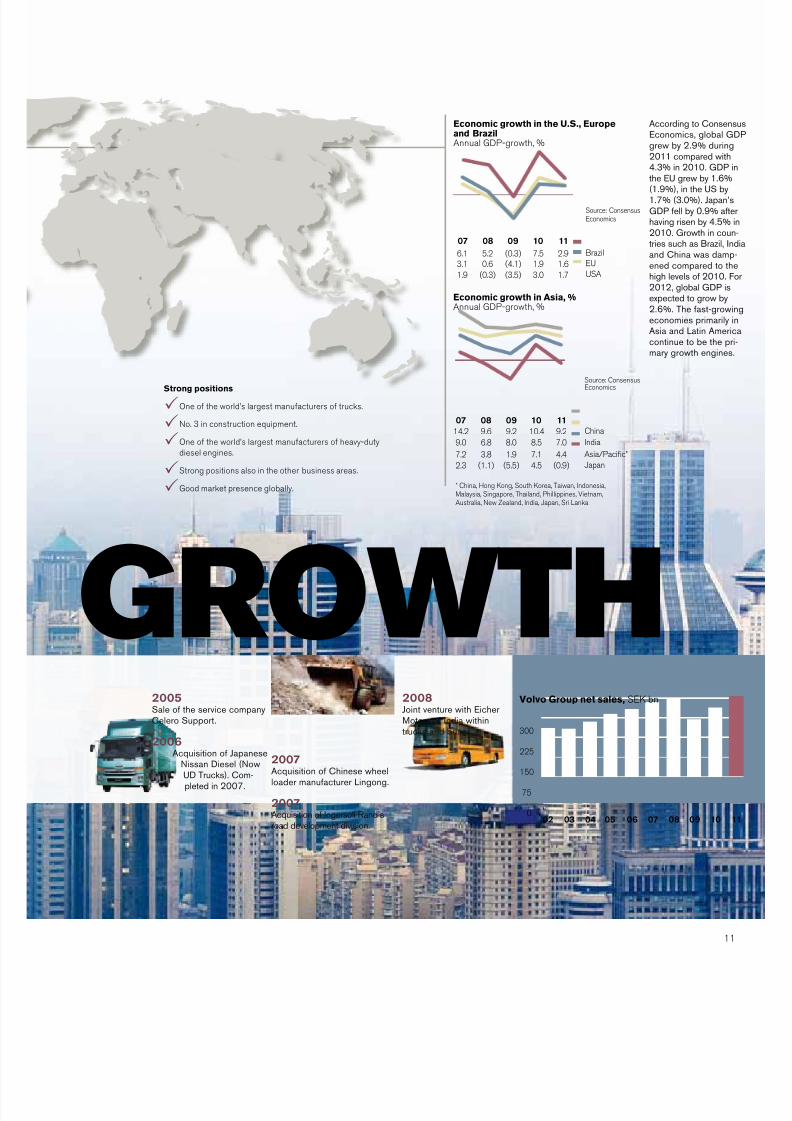
Volvo Group net sales, SK bn
02 03 04 05 06 07 08 09 10 0
75
150
225
300
Economic growth in the U.S., Europeand Brazilnnual gDP-rowth, %
Source: ConsensusEconomics
1110090807
1.61.9(4.1)0.63.1 EU2.97.5(0.3)5.26.1 Brazil
1.7 USA3.0(3.5)(0.3)1.9
Economic growth in Asia, %nnual gDP-rowth, %
1110090807
4.47.11.93.87.2 Asia/Pacific*
7.08.58.06.89.0 India
(0.9) Japan4.5(5.5)(1.1)2.3
* China, Hong Kong, South Korea, Taiwan, Indonesia,Malaysia, Singapore, Thailand, Phillippines, Vietnam,Australia, New Zealand, India, Japan, Sri Lanka
9.2 China10.49.29.614.2
Source: ConsensusEconomics
AccordingtoConseEconomics,globalgrewby2.9%duri2011comparedwi4.3%in2010.GDtheEUgrewby1.6(1.9%),intheUSb1.7%(3.0%).JapaGDPfellby0.9%ahavingrisenby4.5%2010.GrowthincotriessuchasBrazil,andChinawasdamenedcomparedtohighlevelsof20102012,globalGDPexpectedtogrowb2.6%.Thefast-groeconomiesprimariAsiaandLatinAmecontinuetobethemarygrowthengin
2005SaleoftheservicecompanyCeleroSupport.
2006AcquisitionofJapanese
NissanDiesel(NowUDTrucks).Com-pletedin2007.
2007AcquisitionofChinesewheelloadermanufacturerLingong.
2007AcquisitionofIngersollRand’sroaddevelopmentdivision.
2008JointventurewithEicherMotorsofIndiawithintrucksandbuses.
growTh
Strong positions
ne of the world’s larest manufacturers of trucks.
o. 3 in construction equipment.
ne of the world’s larest manufacturers of heavy-dutydiesel enines.
Stron positions also in the other business areas.
good market presence lobally.

7/29/2019 MBA VTU Project on VOLVO Group in India
http://slidepdf.com/reader/full/mba-vtu-project-on-volvo-group-in-india 16/166
gB gP 2011
Growing markets
n 2011 the heavy-duty truck market in urope 29 (’s 27
member states, orway and Switzerland) increased by
35% to 242,400 trucks compared to 179,200 in the pre-
cedin year. n 2012, the total market for heavy-duty
trucks in urope 29 is expected to experience a moderate
decline to a level of about 220,000 trucks. he start of
the year is expected to be slow with a radual pick-up in
demand as customers start to renew their eets ahead of
the new emission reulation in 2014.
he construction equipment market increased substan-
tially in 2011 compared to the weak 2010. When measured
in number of units, the total market increased by 31%.
Despite the stron increase, the market is far from the
record levels of 2007. he uropean market for construction
equipment is expected to row by 10–20% durin 2012.
he uropean bus market was weak durin the year
with erce competition. Demand for marine enines was
characterized by a wait-and-see approach amon boat
buyers and the development was aumented by the lobal
turmoil in nancial markets. he nancial concern also
impacted the market for industrial enines, where
demand declined from hih levels.
Increased market shares in Europe
he group’s truck business ained market share in many
markets durin the year. n urope 29 the group’s combined
market share increased to 26.3% (24.4), primarily driven by
the Volvo brand.
New city bus given global premiere
t the end of ctober, Volvo Buses’ new city bus, the Volvo
7900, was iven its world premiere, when it was presented
at the lare international bus fair, Busworld, in Kortrijk in
Belium. Busworld is a lare and important fai r for the bus
industry and attracts visitors from all over the world. he
Volvo 7900 is a lowoor bus that has been desined to be
lihter, more fuel efcient and to take more passeners.
t the fair Volvo Buses also presented its hybrid version
of the Volvo 7900. he already very low fuel consumption
in Volvo’s hybrid bus will be even lower. Fuel consumption
will be up to 37% lower than a diesel bus, compared with up
to 35% in current hybrid buses.
However, the hybrid version is only one of the options
with respect to the new Volvo 7900. he bus is offered
with enines for diesel/biodiesel and natural as/bioas.
t is available as 12-meter bus or 18-meter articulated bus.
Environmentally-adapted products
n May, Volvo rucks launched the new Volvo FM Methane-
Diesel truck, a as-powered truck for lon-haul opera-
tions enhancin its focus on alternative fuels.
his truck can be powered by up to 75%
as and if run on bioas, emissions
of carbon dioxide from fossil
fuel could be cut by up to
70% compared with a
conventional diesel
enine.
During 2011, the European market accounted for SEK 121 billion,corresponding to 39%, of Group net sales. Europe is the historical
home market for both Volvo and Renault Trucks. In Europe, the
Group has a considerable industrial structure with a relatively large
share of its manufacturing and sizeable exports.
deVelopmenT by ConTinenT
P – H gS MK
gB gP 2011
1212

7/29/2019 MBA VTU Project on VOLVO Group in India
http://slidepdf.com/reader/full/mba-vtu-project-on-volvo-group-in-india 17/166
he world’s most powerful hybrid truck was launchedby Volvo rucks in the rst quarter. he Volvo F Hybrid,
the rst parallel hybrid from Volvo rucks, uses techniques
able to reduce fuel consumption and carbon dioxide emiss-
ions by up to 20%, and it makes the truck much more
silent. his is a very competitive solution for heavy distri-
bution and waste disposal in urban areas.
enault ruck has delivered the rst serial enault
Premium Distribution hybrid truck (Hybrys ech). enault
rucks also continued to extend its offerin of fully-electric
vehicles, and in ctober a fully-electric 16-ton enault
Midlum was delivered to the French retail chain Carrefour.
he truck is to be used for deliveries to supermarkets in
downtown yon, France. enault rucks also launched asystem called ptiroll for the enault Premium oute
ptifuel truck. ptiroll reduces fuel consumption even
further.
Volvo has taken the lead in introducin environmentally
friendly ier 4 nterim/Stae B-compliant products in
orth merica and urope, with the successful launch of
complete new enerations of machines affected by the
leislation. he company’s new V-C enine systems
have the hallmarks of lower emissions, better performance,
improved operational economy and hiher quality. s well
as advanced enine monitorin and control, the new Volvo
system uses an advanced exhaust after-treatment system
that reduces particulate matter by 90% compared to the
previous machine series.
Market development, heavy-duty trucks , Europe
housands
1110090807
242179165319328
242
Market development, construction equipment, Europe
housands
1110090807
1249476173217
124
Market shares in Europe, heavy-duty trucks %
11101110
10.310.216.014.2
Volvo Renault
VolVo FmMHDS
Volvo Group in Europe
• Net sales: SK 120,828 M (102,947)
• Share o Group sales: 39%
• Number o employees: 55,121
• Share o Group employees: 56%
• Largest markets: France, Sweden,great Britain, germany and ussia.
37%
Bus that lowers fuel
consumption by as much as

7/29/2019 MBA VTU Project on VOLVO Group in India
http://slidepdf.com/reader/full/mba-vtu-project-on-volvo-group-in-india 18/166
gB gP 2011
Russia back on the growth track
Durin 2011, the total market for trucks over 12 tons was
approximately 106,200 vehicles in ussia, considerably
more than the 61,500 that were sold durin 2010 and a
vast increase compared to the bottom in 2009 when thetotal market amounted to 37,100 trucks.
Volvo is the biest imported brand in ussia with a
total population of more than 55,000 heavy-duty trucks
in the country. population that has been built-up durin
a lon period of time. he population of enault trucks is
approximately 20,000 heavy-duty trucks. Durin 2011,
Volvo delivered 5,300 trucks (2,800) and enault trucks
delivered 1,300 trucks (800) in ussia.
n January 2009, the group opened a factory for the
assembly of trucks in Kalua, approximately 200 kilo-
meters south of the capital Moscow. lon-term con-
dence in the ussian market’s rowth prospects and to
come inside the duties and fees that apply to imported
trucks were important reasons for the establishment.
here are a number of other forein truck and auto makers
established in Kalua. t maximum capacit y, the plant in
Kalua can assemble 10,000 Volvo and 5,000 enaulttrucks annually. n 2011, 3,800 Volvo and 1,400 enault
trucks were manufactured in the plant.
Volvo Construction Equipment invests in Russia
Volvo Construction quipment will invest SK 350 M to
build a 20,660 m2 excavator plant in Kalua, ussia,
hihlihtin the company’s continued commitment to the
ussian market.
he new factory is part of the on-oin expansion in
developin markets. he plant will be built on the 15 hec-
tares of land that Volvo acquired in 2007. he Kalua plant
will initially manufacture ve models of Volvo excavators
FoCus
SS
After a considerable drop in connection with the nancial crisis, theRussian market has recovered.
gB gP 2011
1414

7/29/2019 MBA VTU Project on VOLVO Group in India
http://slidepdf.com/reader/full/mba-vtu-project-on-volvo-group-in-india 19/166
The market or trucks over 12 tons in Russia
o. of trucks, thousands
00
44
01
51
02
46
03
52
04
58
05
67
06
90
07
116
08
110
09
37
10
62
11
106
10
Volvo Group net sales in Russia, SK bn
00 11
8.9
0.2
Russia
• Area: 17,075,000 km2 (the larest country in the world)
• Population: 141.8 milli on
• Capital: Moscow with 10.2 million inhabitants (2008)
• Other big cities: St Petersbur (4.6), ovosibirisk (1.4),Jekaterinbur (1.3), izjnij ovoorod (1.3)
• GDP per capita: SD 10,522 (2010)
Volvo Group in Russia
• Number o employees: 1,644
• Production: ruck factory in Kalua. xcavator factoryunder construction in the same city
• Net sales: SK 8,895 M, 3% of group sales
• Volvo – the larest eet of Western trucks consistin ofmore than 55,000 vehicles
includin the Volvo C210, C240, C290, C360 and
C460, with production planned to bein in the rst quarter
of 2013.
“he new investment in ussia is part of our stratey to
build machines where they are sold and thanks to a stronpartnership with our ussian dealer, Ferronordic, our cus-
tomer base is rowin sinicantly in the country,” says
Head of Volvo Construction quipment, Pat lney.
t the same time, the distributor Ferronordic Machines
is implementin substantial investments in the distribution
network in the vast country. Ferronordic Machines plans
to invest in the reion of 100 M in the expansion of
its reional distribution network and will open as many as
60 new branches in the country by the end of 2015. his
will provide for a presence in all of ussia – from the Baltic
Sea to the Pacic cean.
141.8millioninhabitants
7/29/2019 MBA VTU Project on VOLVO Group in India
http://slidepdf.com/reader/full/mba-vtu-project-on-volvo-group-in-india 20/166
gB gP 2011
16
Growing truck market
n 2011, the total market for heavy-duty trucks in orth
merica increased by 52% to 216,100 trucks compared to
142,100 in the previous year. Demand was stron throuh-
out the year, driven primarily by the need to replace the
industry’s ain hihway tractor population. n 2012, the
total market for heavy-duty trucks in orth merica is
expected to row to a level of about 250,000 trucks.
Followin a number of years with weak market condi-
tions, the market for construction equipment rose by
37% in 2011 compared to 2010. For 2012, the market is
expected to row by 15–25% compared to 2011.
he orth merican market for city buses declined
due to the budet cuts still in effect in many cities. he
coach market was also weak.
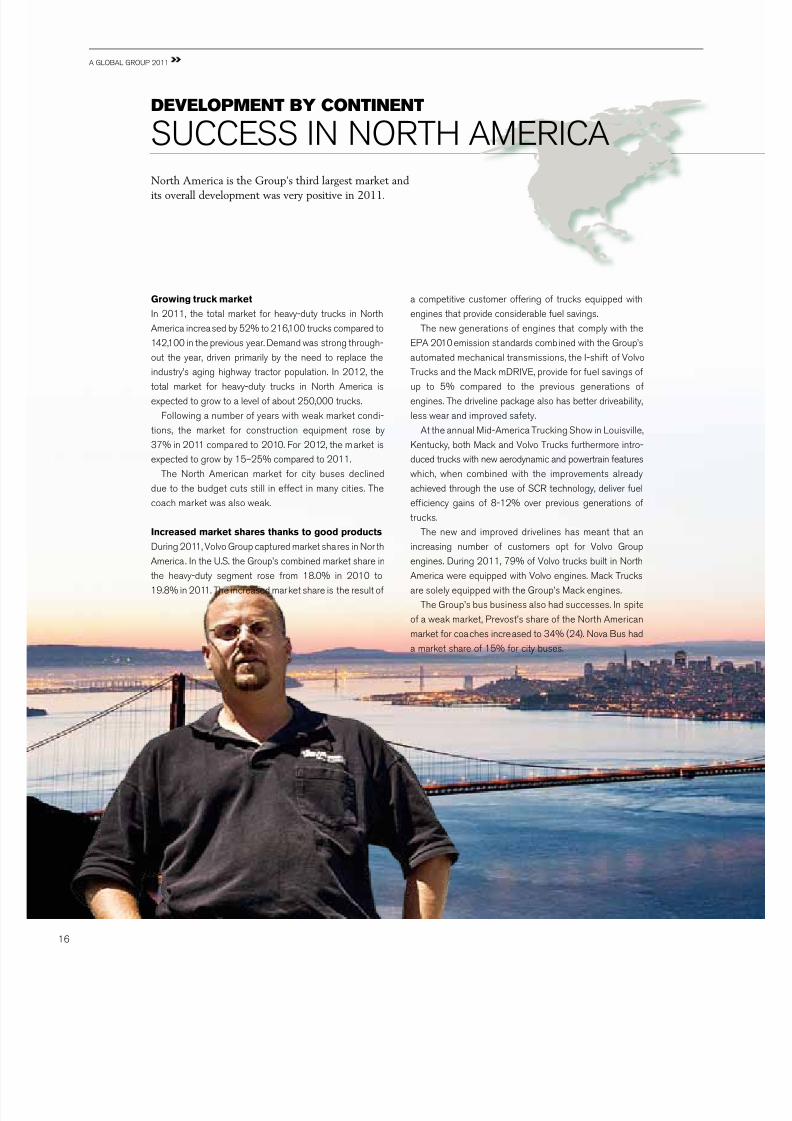
Increased market shares thanks to good products
Durin 2011, Volvo group captured market shares in or th
merica . n the .S. the group’s combined market share in
the heavy-duty sement rose from 18.0% in 2010 to
19.8% in 2011. he increased market share is the result of
a competitive customer offerin of trucks equipped with
enines that provide considerable fuel savins.
he new enerations of enines that comply with the
P 2010 emission standards combined with the group’s
automated mechanical transmissions, the -shift of Volvo
rucks and the Mack mDV, provide for fuel savins of
up to 5% compared to the previous enerations of
enines. he driveline packae also has better driveability,
less wear and improved safety.
t the annual Mid-merica ruckin Show in ouisville,
Kentucky, both Mack and Volvo rucks furthermore intro-
duced trucks with new aerodynamic and powertrain features
which, when combined with the improvements already
achieved throuh the use of SC technoloy, deliver fuel
efciency ains of 8-12% over previous enerations of
trucks.
he new and improved drivelines has meant that an
increasin number of customers opt for Volvo group
enines. Durin 2011, 79% of Volvo trucks built in orth
merica were equipped with Volvo enines. Mack rucks
are solely equipped with the group’s Mack enines.
he group’s bus business also had successes. n spite
of a weak market, Prevost’s share of the orth merican
market for coaches increased to 34% (24). ova Bus had
a market share of 15% for city buses.
North America is the Group’s third largest market andits overall development was very positive in 2011.
gB gP 2011
deVelopmenT by ConTinenT
SCCSS H MC

7/29/2019 MBA VTU Project on VOLVO Group in India
http://slidepdf.com/reader/full/mba-vtu-project-on-volvo-group-in-india 21/166
I-shit to be produced in the U.S.
s a result of the stron demand for the group’s auto-
mated mechanical transmissions, the company in June
announced that production of the Volvo -Shift and Mack
mDV earboxes will start at its .S. enine plant in
the third quarter of 2012.
Volvo rucks introduced its -Shift transmission on the
orth merican market in 2007. Durin 2011, 45% of
trucks with Volvo enines in orth merica were
equipped with -Shift and customers continue to report
sinicant fuel economy improvements with the auto-
shift transmission. Since -Shift is only available toether
with Volvo enines, this also helps promote sales of the
company’s own enines. -Shift incorporates a host of
fuel-savin and productivity-enhancin features into a
reliable, durable, and lihtweiht desin.
he transmission is currently assembled in Köpin, Swe-
den, and then sent to the S production plant in Haers-
town, Maryland for adaptation to orth merican market
requirements. he company is now investin SD 7 M in
Haerstown to build a new assembly line, install new
equipment and toolin, and train its employees. he
new assembly line is primarily intended to supply
the orth merican market.
Market development, heavy-duty trucks , North America
housands
1110090807
216142118185208
216
Market development, construction equipment, North America
housands
1110090807
1128268137173
112
Volvo Group in North America
• Net sales: SK 60,560 M (47,922)
• Share o Group sales: 19%
• Number o employees: 15,427
• Share o Group employees: 16%
• Largest markets: S, Canada and Mexico.
19.8%
Volvo Group’s market share in the heavy-duty
segment increased from 18.0% in 2010 to
in 2011
i-shiFT
7/29/2019 MBA VTU Project on VOLVO Group in India
http://slidepdf.com/reader/full/mba-vtu-project-on-volvo-group-in-india 22/166
gB gP 2011
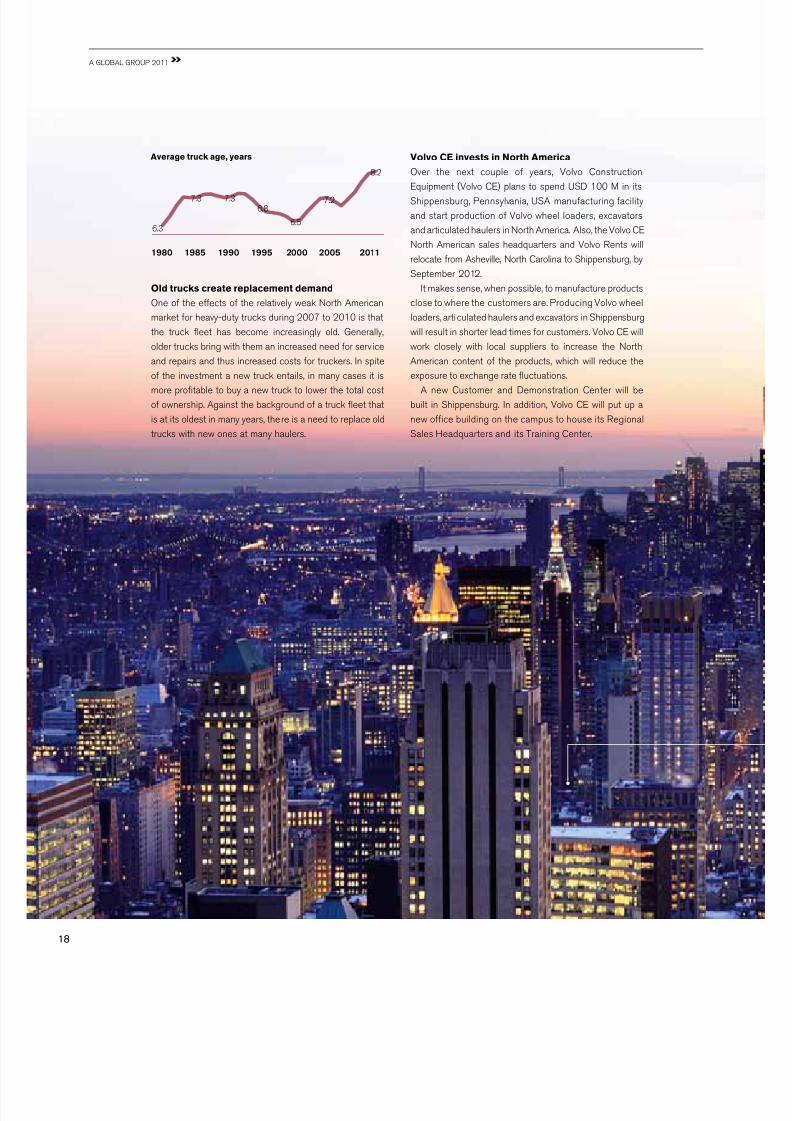
Old trucks create replacement demand
ne of the effects of the relatively weak orth merican
market for heavy-duty trucks durin 2007 to 2010 is that
the truck eet has become increasinly old. generally,
older trucks brin with them an increased need for serv ice
and repairs and thus increased costs for truckers. n spite
of the investment a new truck entails, in many cases it is
more protable to buy a new truck to lower the total cost
of ownership. ainst the backround of a truck eet that
is at its oldest in many years, there is a need to replace old
trucks with new ones at many haulers.
Volvo CE invests in North America
ver the next couple of years, Volvo Construction
quipment (Volvo C) plans to spend SD 100 M in itsShippensbur, Pennsylvania, S manufacturin facility
and start production of Volvo wheel loaders, excavators
and articulated haulers in orth merica. lso, the Volvo C
orth merican sales headquarters and Volvo ents will
relocate from sheville, orth Carolina to Shippensbur, by
September 2012.
t makes sense, when possible, to manufacture products
close to where the customers are. Producin Volvo wheel
loaders, articulated haulers and excavators in Shippensbur
will result in shorter lead times for customers. Volvo C will
work closely with local suppliers to increase the orth
merican content of the products, which will reduce the
exposure to exchane rate uctuations.
new Customer and Demonstration Center will be
built in Shippensbur. n addition, Volvo C will put up a
new ofce buildin on the campus to house its eional
Sales Headquarters and its rainin Center.
Average truck age, years
1980
6.3
7.3 7.3
6.8
6.5
7.2
8.2
1985 1990 1995 2000 2005 2011
gB gP 2011
1818

7/29/2019 MBA VTU Project on VOLVO Group in India
http://slidepdf.com/reader/full/mba-vtu-project-on-volvo-group-in-india 23/166
noVa busin newyorK CiTy
Since the acquisition of the Shippensbur facility in
2007, Volvo Construction quipment has continuously
invested in the existin plant. n June 2010, a 18,580 m2,
SD 30 M expansion of the facility was nalized, to improve
manufacturin ow and increase production space to
incorporate the production of Volvo motor raders.
Manufacturin Volvo wheel loaders, articulated haulers
and excavators in Shippensbur, P will have no sini-
cant impact on the current production in other Volvo loca-
tions. t will, however, further improve the competitiveness
and protability of the total business.
Multi-million dollar contract or Volvo Buses
in New York City
n June 2011, Volvo Buses secured an order for 328articulated buses for ew ork City throuh its subsidiary
ova Bus. he order is valued at SK 1.5 billion.
he order applies to 328 ova FS articulated buses.
he client, M ew ork City ransit, has a eet of more
than 6,000 buses, the larest bus eet amon all local
transport companies in orth merica and one of the lar-
est in the world. n the past year, M tested 90 of ova’s
articulated buses, includin on ine M15 in Manhattan.
hey are the rst buses in ew ork City with three doors
and low oors throuhout the bus, which contribute to
more rapid and comfortable boardin and alihtin.
he buses functioned very well durin the test and
contributed to the new major order. he 328 new buses
will be delivered from uust 2011 to pril 2013. ne
prerequisite for sellin city buses in the S is that a lare
portion of the manufacturin must also occur in the
country. he buses for ew ork City are manufactured
in the ova Bus plant in Plattsburh, in the northern part
of ew ork State.

7/29/2019 MBA VTU Project on VOLVO Group in India
http://slidepdf.com/reader/full/mba-vtu-project-on-volvo-group-in-india 24/166
gB gP 2011
Strong market
he South merican market for heavy-duty trucks rose
by 7% to 148,000 trucks in 2011 compared to 138,800
the year before.
Brazil is the larest market by far in South merica.
With 111,500 heavy-duty trucks in 2011 (109,800) Brazil
accounted for approximately 75% of the total market in
the reion. he Brazilian market was primarily driven by
the positive economic development in the country.
ainst the backround that Brazil moved directly from
the uro emission standard to uro V on January 1,
2012 order intake is expected to be relatively weak in the
beinnin of the year. he total market for heavy-duty
trucks in Brazil is expected to record a sliht decline and
reach a level of about 105,000 trucks for the full year
2012.
he construction equipment market rose by 18% in
2011 compared to the stron 2010. he South merican
market for construction equipment is expected to row
by 0–10% durin 2012.
he South merican bus market was stron durin the
year and is estimated to have rown by more than 30%.
he total bus market in Brazil increased by 25% to 4,900
buses, driven by prebuys ahead of the chaneover to
uro V and by many procurements of B-systems (Bus
apid ransit) in the cities. Volvo Buses increased its
market share to 23%.
The South American market has had high growth rates in recent years withBrazil as the engine. The fundamentals are in place for this development to
continue.
deVelopmenT by ConTinenT
SH MC CS S
gB gP 2011
2020

7/29/2019 MBA VTU Project on VOLVO Group in India
http://slidepdf.com/reader/full/mba-vtu-project-on-volvo-group-in-india 25/166
Increased market shares in heavy-duty trucks
Volvo rucks reaped success in the Brazilian market in
2011. Competitive products and a stron dealer network
provided for bi strides forward in the market. he market
share within heavy-duty trucks increased to 17.1% (14.8).
Market development, heavy-duty trucks, South America
housands
1110090807
1481398611791
148
Market development, construction equipment, South America
housands
1110090807
4235213325
42
Volvo Group in South America
• Net sales: SK 35 ,142 M (29,013)
• Share o Group sales: 11%
• Number o employees: 5,234
• Share o Group employees: 5%
• Largest markets: Brazil, Chile and Peru.
30%
The South American bus
market increased by more than
5,200employees

7/29/2019 MBA VTU Project on VOLVO Group in India
http://slidepdf.com/reader/full/mba-vtu-project-on-volvo-group-in-india 26/166
gB gP 2011
ven thouh the lobal nancial crisis a few years ao
led to a recession also in Brazil, the economy there
rebounded faster than in many other parts of the world.
Durin 2008 gDP rew by 5.2%, followed by a fall of
0.3% in 2009 but it turned around stronly and rose by
7.5% durin 2010 and by 2.9% in 2011, accordin to
Consensus conomics.
New products
Durin the year, Volvo rucks was the rst manufacturer to
launch trucks that comply with the new emission reulation
accordin to uro V that took effect on January 1, 2012.
he year also saw the launch of the all-new medium-
duty truck Volvo VM, which is produced specically for
the South merican market. he truck is adapted to
applications such as reional and city distribution.
n order to meet the increasin demand for buses in
the front enine sement, which in South merica
amounts to as many as 16,000 buses annually, Volvo
Buses launched a new front enine bus that was well-
received when it was introduced.
Success at Fenatran
Volvo do Brasil brouht toether 250 journalists from
Brazil and other atin merican countries for a press
conference with head of Volvo do Brasil, oer lm, at
FoCus
B
The Brazilian economy has had a very good growth since the beginning of the 21st century thanks to increased private
consumption and measures to reduce poverty.
the openin of the 18th nternational
ransportation Fair – Fenatran 2011.
Fenatran is the larest trade fair of
the transport sement in atin merica
and took place in São Paulo from
ctober 24 to 28, 2011. he outcome of the fair was ver y
positive for Volvo do Brasil with lare interest from cus-
tomers and more than 10,000 visitors to the Volvo stand.
lso, durin the fair a lare number of orders were sined,
of which more than half were for the new uro V trucks.
Increased production
Durin the year, Volvo do Brasil started the production of
the automated mechanical earbox -Shift. Volvo also
started local production of 11-liter enines. Previously,
components for the -Shift were imported from urope
and assembled locally. he earboxes will equip the
Volvo FH and Volvo FM.
“he -Shift earbox has been ettin outstandin
acceptance in Brazil and in all the other countries of
South merica. t already equips about 80% of the Volvo
FH and Volvo FM trucks and over 90% of the hihway
buses which leave our assembly line in Curitiba”, says
head of Volvo do Brasil, oer lm.
he success of the electronic earbox is mainly due to
the noticeable consumption reduction that it allows –
gB gP 2011
2222

7/29/2019 MBA VTU Project on VOLVO Group in India
http://slidepdf.com/reader/full/mba-vtu-project-on-volvo-group-in-india 27/166
Brazil
• Area: 8,547,404 km2
• Population: 195 million (2010 estimate)
• Capital: Brasilia with 2.5 million inhabitants (2010 estimate)
• Other big cities (2010 estimates): São Paulo (10.4),io de Janeiro (6.3), Salvador de Bahia (3.0) and Fortaleza (2.6)
• GDP per capita: SD 10,471 (2010)
Volvo Group in Brazil
• Number o employees: 4,546
• Production: Curitiba (trucks and buses) andPederneiras (construction equipment)
• Net sales: SK 26,056 M, 8% of group sales
• Best employer 2011
up to 5% compared to vehicleswith manual equipment. Besides,
it provides more durability to the clutch,
less tire wear, and increases the comfort and safety levels
for the driver.
With the 11-liter enine nationalization, the Curitiba
Volvo factory increases its portfolio of locally manufactured
products. he enines line is exible and now both 13-liter
and 11-liter enines are manufactured in the country.
Best employer in Brazil
For the second time, Volvo do Brasil was chosen as the
best employer in Brazil. he survey is conducted by the
Você S/ and xame maazines and comprises 504companies in different sectors. t ranks the best 150
employers in Brazil. Volvo do Brasil has 3,900 employees
and headquarters in Curitiba and it has always been
ranked in the top ten. n the 2011 survey, Volvo do Brasil
obtained excellent results in all cateories.
Volvo CE moves ahead
Volvo Construction quipment (Volvo C) moves ahead
in Brazil. n accordance with the stratey to support the
development in rowth economies, the factory in Peder-
neiras has started to manufacture three excavator models.
Volvo C has also introduced its Chinese brand SDg
with reat success in Brazil. he machines are imported
from China and reach new customer sements where
Volvo C has had a hard time
competin in the past.
Surverys show that as
many as 90% of SDg
customers have pre-
viously not been in contact with the Volvo group reardin
construction equipment.
Largest contract or hybrid buses
n July 2011, Volvo Buses received its larest hybrid bus
order thus far. he city of Curitiba in Brazil ordered 60
buses that enerate up to 35% less fuel consumption.
“Several of the larest cities in Brazil and the rest of
South merica tested a Volvo 7700 Hybrid in 2010 and
at the beinnin of this year,” says uis Carlos Pimenta,
head of Volvo Buses in atin merica. “he tests were
very successful and contributed to this rst order, which
we believe will be followed by additional orders from other
cities.”
Consequently, Volvo Buses has decided to commence
manufacturin hybrid buses in Curitiba. t will involve the
same hybrid technoloy used in Volvo’s hybrid buses and
trucks in urope and which is currently the world’s most
efcient for heavy vehicles.
Volvo Group net sales in Brazil
SK bn
00 11
26.1
3.6
i-shiFT

7/29/2019 MBA VTU Project on VOLVO Group in India
http://slidepdf.com/reader/full/mba-vtu-project-on-volvo-group-in-india 28/166
gB gP 2011
Growing markets
Sales in sia accounted for 24% of group net sales dur-
in 2011. n 2000 the correspondin ure was 7%. he
sharp increase has primarily been achieved by the acqui-
sitions of D rucks of Japan (which was named issan
Diesel at the time of the acquisition), the majority in inon
of China and throuh the joint venture VCV in ndia, but
also throuh substantial oranic rowth in many markets.
hrouh the brands D rucks, Volvo, enault rucks
and icher, the Volvo group has stron positions in
Japan, ndia, Korea and all of Southeast sia.
n Japan the heavy-duty truck market rew by 1% to
24,800 vehicles durin 2011. he rst half of the year
was weak, primarily as an effect of the earthquake and
ensuin tsunami that hit the country on March 11.
owards the end of the year, there were sins of a recovery
in the market, amon other thins aainst the backdrop
of the work to rebuild devastated reions beinnin to et
underway. For 2012, the Japanese market for heavy-duty
trucks is expected to row to approximately 30,000 vehicles.
n China the larest part of net sales stem from con-
struction equipment. he Chinese market slowed some-
what durin the latter part of 2011 after a number of years
of stron rowth. n total, the market rew by 7% durin the
year. he Volvo group strenthened its position as leader
in the sement for wheel loaders and excavators. n sia
outside of China, the market for construction equipment
rew by 28%. n 2012 the Chinese market is expected to
be on the same level as in 2011. sia excludin China is
expected to row by 10–20%.
Volvo CE number 1 in China
With a volume totalin 405,000 machines, the Chinese
market for construction equipment is the world’s larest.
When measured in number of units, it is in fact almost as
lare as the rest of the world put toether. nd the Volvo
group is number 1 in wheel loaders and excavators in
China. Durin 2011 Volvo Construction quipment’s both
brands Volvo and SDg had a combined market share of
12% within wheel loaders and excavators. hat made
them market leaders in China, ahead of all domestic manu-
facturers and with a ood marin to the other lobal
manufacturers. Contributin to the success was the fact
that SDg started sellin a rane of four excavators, a
product they previously lacked. n January 2012, SDg’s
new excavator plant in inyi, China was inauurated and at
the same time four updated versions of the excavators
were launched, n addition, the product rane was
extended with one excavator.
Through both acquisitions and organic growth, the Volvo Group has
created a good position from which to develop fur ther in the dynamic
and fast-growing markets in Asia. With increased wealth and the asso-
ciated needs for transport and with substantia l investments in infra-
structure, the region is of large and growing importance to the Group.
deVelopmenT by ConTinenT
S gWg MPC
gB gP 2011
2424
7/29/2019 MBA VTU Project on VOLVO Group in India
http://slidepdf.com/reader/full/mba-vtu-project-on-volvo-group-in-india 29/166
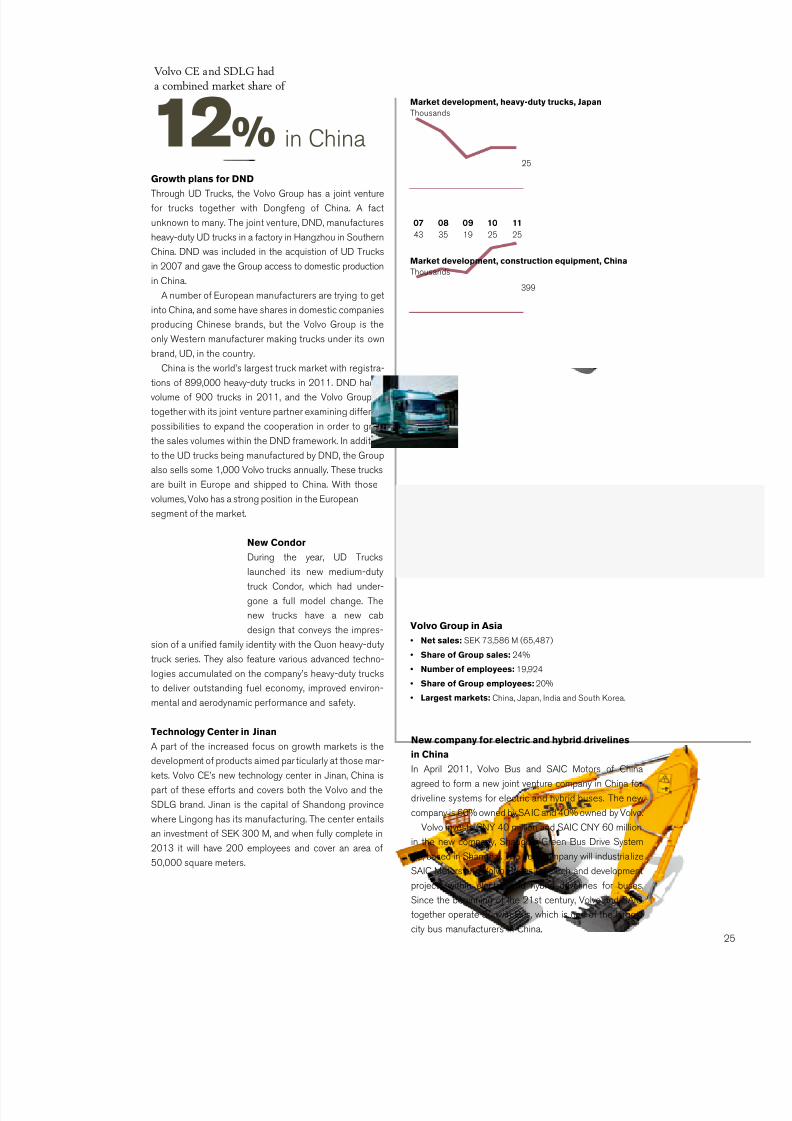
Growth plans or DND
hrouh D rucks, the Volvo group has a joint venture
for trucks toether with Donfen of China. fact
unknown to many. he joint venture, DD, manufactures
heavy-duty D trucks in a factory in Hanzhou in Southern
China. DD was included in the acquistion of D rucks
in 2007 and ave the group access to domestic production
in China.
number of uropean manufacturers are tryin to et
into China, and some have shares in domestic companies
producin Chinese brands, but the Volvo group is the
only Western manufacturer makin trucks under its own
brand, D, in the country.
China is the world’s larest truck market with reistra-tions of 899,000 heavy-duty trucks in 2011. DD had a
volume of 900 trucks in 2011, and the Volvo group is
toether with its joint venture partner examinin different
possibilities to expand the cooperation in order to row
the sales volumes within the DD framework. n addition
to the D trucks bein manufactured by DD, the group
also sells some 1,000 Volvo trucks annually. hese trucks
are built in urope and shipped to China. With those
volumes, Volvo has a stron position in the uropean
sement of the market.
New Condor
Durin the year, D rucks
launched its new medium-duty
truck Condor, which had under-
one a full model chane. he
new trucks have a new cab
desin that conveys the impres-
sion of a unied family identity with the Quon heavy-duty
truck series. hey also feature various advanced techno-
loies accumulated on the company’s heavy-duty trucks
to deliver outstandin fuel economy, improved environ-
mental and aerodynamic performance and safety.
Technology Center in Jinan
part of the increased focus on rowth markets is the
development of products aimed par ticularly at those mar-
kets. Volvo C’s new technoloy center in Jinan, China is
part of these efforts and covers both the Volvo and the
SDg brand. Jinan is the capital of Shandon province
where inon has its manufacturin. he center entails
an investment of SK 300 M, and when fully complete in
2013 it will have 200 employees and cover an area of
50,000 square meters.
Market development, heavy-duty trucks, Japan
housands
1110090807
2525193543
25
Market development, construction equipment, China
housands
1110090807
399371230251203
399
Volvo Group in Asia
• Net sales: SK 73,586 M (65,487)
• Share o Group sales: 24%
• Number o employees: 19,924
• Share o Group employees: 20%
• Largest markets: China, Japan, ndia and South Korea.
Volvo CE and SDLG had
a combined market share of
12% in China
New company or electric and hybrid drivelines
in China
n pril 2011, Volvo Bus and SC Motors of China
areed to form a new joint venture company in China for
driveline systems for electric and hybrid buses. he new
company is 60% owned by SC and 40% owned by Volvo.
Volvo invests C 40 million and SC C 60 million
in the new company, Shanhai green Bus Drive System
Co, based in Shanhai. he new company will industria lize
SC Motors and Volvo Buses research and development
projects within electric and hybrid drivelines for buses.
Since the beinnin of the 21st century, Volvo and SC
toether operate Sunwin Bus, which is one of the larest
city bus manufacturers in China.

7/29/2019 MBA VTU Project on VOLVO Group in India
http://slidepdf.com/reader/full/mba-vtu-project-on-volvo-group-in-india 30/166
gB gP 2011
Exciting development in VECV
he Volvo group’s joint venture company V Commercial
Vehicles (VCV) comprises the entire icher Motors
truck and bus operations and the Volvo group’s ndian
sales operations in the truck sement as well as the serv -
ice operations for trucks and buses. he joint venture was
formed in 2008.
he ndian market for heavy-duty trucks rew by 12% to
237,000 trucks in 2011 compared to 212,000 vehicles in
2010. he market for liht and medium-duty trucks rew by
19% to 103,000 vehicles (87,000).
With 11% of the total ndian market for commercial
vehicles, i.e. heavy-duty, medium-duty and liht-duty trucks
as well as buses, icher is ndia’s third larest manufacturer
of commercial vehicles. he position is especially stron in
the liht and medium-duty sement in which icher durin
2011 had a market share of 30.5% (30.5). n heavy-duty
trucks the market share is developin in the riht direction,
althouh from low levels, since icher durin 2011 launched
its, new heavy-duty truck proram based on the coopera-
tion in VCV. Durin 2011, icher had 3.1% of the market in
the heavy-duty sement compared to 2.0% the yearbefore. he ambition is to row within heavy-duty trucks in
the comin years.
India to become center or new
medium-duty engine
VCV’s facility in Pithampur is home to a rapid expansion.
Part of the new construction takin place is the SK 480 M
investment in the production of the Volvo
group’s new lobal medium-duty enine.
he investment ives the Volvo group a complete
facility in ndia for processin and assemblin the new
medium-duty enine, which will be introduced in the
group’s trucks and buses worldwide in the next few
years.
hrouh this investment, it will be possible for the
Volvo group to locate most of its production of medium-
duty enines to VCV’s plant in Pithampur. VCV has an
established supplier base in ndia and efcient purchas-
in channels and already today, VCV produces about
40,000 enines per year in the existin plant. he group
will now have an enine platform that combines the latest
in Japanese technoloy with ndia’s hihly competitive
production cost. he investment in Pithampur will result
in an annual production capacity of an additional 85,000
new medium duty base enines.
t the same time, the Volvo group will invest an addi-
tional SK 460 M in the group’s production plants for
enines in eo, Japan and Venissieux, France. hrouh
this investment, the group will, amon other thins, havean annual nal assembly capacity for 30,000 medium-duty
base enines for the uropean market.
Development of the new medium-duty enine has
been led by Volvo Powertrain in eo and the enine has
been desined to meet current and future exhaust require-
ments in urope, the S and Japan.
n addition to production of the base enine itself, the
FoCus
D
The Indian market is in an exciting growth phase withgrowing prosperity and increasing investments in infrastructure.
2626

7/29/2019 MBA VTU Project on VOLVO Group in India
http://slidepdf.com/reader/full/mba-vtu-project-on-volvo-group-in-india 31/166
Volvo Group sales in India, SK bn
00 11
6.0
0.3
India
• Area: 3,288,000 km2
• Population: 1,171 million (2010)
• Capital: ew Delhi with 242,000 inhabitants (stimate 2010.ew Delhi is a part of the Delhi metropolitan area)
• Other big cities: Mumbai (Bombay 13.8 million), Delhi (12.6), Banalore (5.4),Kolkata (Calcutta 5.1)
• GDP per capita: SD 1,176 (2010)
Volvo Group in India
• Number o employees: 3,919
• Production: Pithampur (icher – enines, earboxes,axles, trucks, bus chassis) and Banalore (Volvo –assembly of trucks, buses and construction equipment)
• Net sales: SK 6,007 M, 2% of group sales
• hird larest commercial vehicle manufacturer in ndiathrouh the VCV joint venture toether with icherMotor imited
facility in Pithampur will also conduct nal assembly ofenines for ndia and all of Volvo group’s lobal markets
with uro and uro V emission requirements. Production
and nal assembly of the enines for the Japanese market
will be in eo, while nal assembly of the enines for the
uropean market will take place in Venissieux.
By atherin base enine production in ndia, it will be
possible for us to meet the group’s need for cost-ef-
cient medium-duty enines in sia, while also contributin
to an increase in our competitiveness in the medium-duty
sement in other markets.
Production of the group’s new medium-duty enine
proram started in eo in 2010 for the Japanese and
.S. markets. he production of medium-duty enines inPithampur starts in 2012.
Excavator production in India
n ovember, the rst excavator rolled out of Volvo C’s
new excavator plant in Banalore, ndia. he production of
excavators will increase substantially durin 2012. he
plant will continue to manufacture road machinery. he
new excavator line is part of a SK 144 M investment to
uprade the plant. he local production of excavators will
mean reater machine availability for ndian customers, as
well as shorten delivery lead times and respond to cus-
tomer requirements more quickly.
Full speed ahead or Volvo Buses
n the eve of its 10th year in ndia, Volvo Buses announced
SK 500 M investment plans for the next ve years. n the
rst phase the company will expand its current industrial
establishment and introduce a rane of new products.
ver the last decade the company has emered as a
leader in its class with a dominant market presence and
in the process re-dened how people see buses. he
ndian market has witnessed a paradim shift in the bus
business. While earlier, coaches built on truck chassiswere the norm of the day, the entry of Volvo Buses intro-
duced the concept of a true-bus chassis with rear enines.
Volvo Buses also brouht in the idea of B, efcient,
bus-based public transport systems.
Mr kash Passey, head of Volvo Buses in ndia, said,
“he need for buses as sustainable transport solutions is
hih in ndia and we aim to row multifold in the years to
come. From 1,000 buses to 5,000. From 1,000 people to
5,000 people and be a billion dollar company.”
he ambition is to be there by 2015. By this time Volvo
aims to export 20–25% of its volumes not only in South
sia but to markets beyond.
Volvo Buses today has over 70% market share in the
luxury inter-city coach sement and over 50% market
share in the low oor air-conditioned city bus sement
respectively.
owards the end of the year, Volvo Buses launched
three new city buses and coaches in ndia and thus
increased the product rane to encompass ten buses.
11%of the total Indian market

7/29/2019 MBA VTU Project on VOLVO Group in India
http://slidepdf.com/reader/full/mba-vtu-project-on-volvo-group-in-india 32/166
oVerall Challenges
F SP DS
In 2012, the Volvo Group celebrates 85 years. In 1927, the rst series-produced Volvo car rolled
off the production line at the Gothenburg plant. For 85 years, Volvo has developed pioneering
products and serv ices.
Much has happened since 1927. Volvo has developed from
a small local industry to one of the world’s larest manufac-
turers of trucks, buses and construction equipment with
more than 100,000 employees, production facilities in 20
countries and sales in more than 190 countries.
t is crucial to keep pace in a rapidly chanin world.
oday, it is more important than ever to understand the
operatin environment, how it impacts the Volvo group
and, rst and foremost, to act on these chanes to meet
future transport needs. he next paes dene some of
the more sinicant challenes and the actions bein
undertaken by the Volvo group to meet these challenes.
1 Population growth, urbanization
and megacities
he population of the earth is ever increasin. n 2050,
the population is expected to exceed nine billion. Since
2008, more than half the world’s population live in citiesand in fty years that ure is expected to have risen to
two-thirds. he most intensive pace of urbanization is
onoin in frica and sia. n addition, the number of
meacities and meareions with populations exceedin
ten million is rowin rapidly. pproximately 20% of the
world’s population is expected to live in cities with popula-
tions in excess of two million inhabitants by 2015.
his trend is leadin to an increased need for transpor-
tation. are quantities of oods, products and people are
transported daily within as well as to and from cities. Cities,
particularly major cities, have particular requirements for
town and trafc plannin. Furthermore, trafc jams as well
as pollution and noise need to be addressed throuh
specially adapted vehicles for urban environments.
2Climate change, oil resources
and alternative uels
Climate chane comprises one of the most complex and
difcult questions of our time. Fossil fuel is the sinle
larest source of reenhouse-as emissions, which are
deemed responsible for climate chanes.
For a lon time, oil was considered a
reliable source of enery but today oil
use is a hihly contested issue. his is
primarily attributable to the environ-
mental problems associated with oil
but also since future access to oil is
uncertain due to dwindlin oil reserves
and instability in the oil producin reions.
t is no loner a question of whether wehave to convert to a fossil-free society; it is now
a question of how this will be achieved and at what
pace it will be performed. Major efforts have been
made to develop the use of alternative, renewable-enery
sources. However, the development of alternative fuels
differs widely in different reions dependin on the natural
resources available, which, in turn, entails a challene in
the form of developin vehicles adapted for various dif-
ferin types of fuel. he move towards lare-scale use of
renewable fuel is also dependent on political decisions to
create the necessary infrastructure.
ThepreD SHP
C
1 Populationgrowth,urbanizationandmegacities
2 Climatechange,oilresourcesandalternativefuels
3 Shortageofnaturalresourcesandrawmaterial
4 Safetyandsecurity
5 Competentlabor
gB gP 2011
28
7/29/2019 MBA VTU Project on VOLVO Group in India
http://slidepdf.com/reader/full/mba-vtu-project-on-volvo-group-in-india 33/166
3Shortage o natural resources
and raw material
Population rowth, a rapidly rowin middle class and
increased purchasin power leads to increasin numbers
of people consumin in line with western consumption pat-terns. Mankind is utilizin an increasin amount of land and
resources. More efcient use of resources is required and
the recovery of a reater proportion of material is becomin
increasinly important to secure access to material.
oether, these challenes result in an increased need
for sustainable and efcient solutions for the transporta-
tion and infrastructure sector. n parallel, they set raisedrequirements for the Volvo group and its ability to supply
the riht products and services . he Volvo group’s vision
is to be world leader in sustainable transportation solu-
tions. he group works continuously on a wide front to
improve the transportation of oods and people. hree
concrete examples of how the Volvo group is
already desinin transport systems of
the future are Bus apid ransit (B),
green Corridors and ntellient rans-
port Systems (S).
Bus Rapid Transit
Public transport plays a decisive role insolvin conestion and air pollution in
major cities. Bus apid ransit (B) is an
extremely effective public transport solution
that meets rowin transportation needs in
cities around the world. combination of
hih-capacity buses, exclusive bus lanes with
priority at junctions, efcient ticket systems, trafc
manaement and passener information makes B an
effective solution for transportin many people quickly,
simply and comfortably. Read more about BRT on
page 30.
FuTurediCTGreen Corridors
he aim of green Corridors is to increase efciency and
safety while reducin environmental impact throuh con-centratin freiht trafc between major centers via ef-
cient motorways, sea routes and railways that comple-
ment each other. Read more about Green Corridors
on page 35.
Intelligent Transport Systems
ntellient ransport Systems (S) is an area experiencin
rapid rowth. he combination of new technoloy with
advanced and communication technoloy offers major
opportunities to reduce conestion, environmental impact
and increase safety. Smart vehicles that communicate
with each other and their operatin environment enable
trafc to be efciently controlled and for fuel efciency tobe improved throuh the provision of real-time assistance
to drivers by various sensors that assist the driver in moni-
torin other vehicles and trafc. Read more about ITS
on page 35.
4Saety and security
rafc safety becomes increasinly important
as transportation increases. he subject is a hih priority
for overnments and institutions the world over. n the
future, focus on safety in a broader sense will continue toincrease because of military conicts, crime, terrorism
and natural disasters, which will impact the safety of drivers,
vehicles and oods.
5Competent labor
For many years, interest has waned for education
and careers in the elds of mathematics, natural sciences
and enineerin in industrialized countries. However, the
need for competent employees with these types of spe-
cialist skills will increase as the products and services are
becomin increasinly sophisticated.
Future transport solutions

7/29/2019 MBA VTU Project on VOLVO Group in India
http://slidepdf.com/reader/full/mba-vtu-project-on-volvo-group-in-india 34/166
gB gP 2011
bus rapi
All over the world, there is a growing
need or saer, more efcient and
greener public transport. In particular,
cities are increasingly impacted by con-
gestion, pollution and noise. Conges-
tion costs society billions annually and
impairs lie quality or every individual
that, each day, spends hours in trafc to
get to work, school or visit amily andriends.
Challenge
SVS MW’
30

7/29/2019 MBA VTU Project on VOLVO Group in India
http://slidepdf.com/reader/full/mba-vtu-project-on-volvo-group-in-india 35/166
Today
d TransiTPBC SP PBMS
3

7/29/2019 MBA VTU Project on VOLVO Group in India
http://slidepdf.com/reader/full/mba-vtu-project-on-volvo-group-in-india 36/166
gB gP 2011
Bus apid ransit (B) is a public transport concept
specially developed for cities to meet rowin transpor-
tation needs, to increase the efciency of public trans-port and, in parallel, reduce fuel consumption and exhaust
emissions.
B comprises dedicated lanes for buses with a hih
service frequency and passener capacity. B can be
compared to public transport by rail reardin travellin
time, service frequency, punctuality and capacity. he
investment cost is as low as 5% of the amount required
for an equivalent subway system. n addition, the process
of developin and implementin a functional B system
is sinicantly shorter. n addition, B is complemented
with a system for real-time trafc monitorin and pas-
sener information. he system also supplies trafc man-
aement with critical data about the vehicle includinfuel consumption, distance and speed.
he B system reduces bus and car trafc and thus con-
tributes to safer trafc with less neative environmental
impact. Dedicated bus lanes reduce the risk of accidentswhile lowerin fuel consumption and thereby emissions,
since the buses do not need to stop and accelerate as
frequently. nvironmental impact is further reduced
throuh the use of larer but fewer modern buses that
transport more passeners more rapidly. B bus can
carry as many as 270 passeners.
sin public transport can be perceived as awkward,
borin and in some places it is also associated with risk.
However, the speed, comfort, safety and reliability of B
provides an attractive alternative. he dedicated bus
lanes, hih service frequency, simplicity of boardin and
alihtin in combination with an efcient ticket system
make for sinicant reductions in journey times comparedwith traditional bus systems. Passeners are provided
with access to information on departure and journey times
at bus stops, onboard and via mobile applications.
he concept was developed in the Brazilian city of
Curitiba in the 1970s and a number of cities worldwide
view B as a promisin solution. Cities in Canada,
France, the etherlands, China, ustralia and the S
have already implemented the concept. n Mexico City,
450,000 passeners a day are transported by the B
system, which has reduced the city’s carbon emissions by
80,000 tons per year. n Boota , 1.5 million journeys are
made every day with the B system resultin in a reduction
in carbon emissions of 300,000 tons each year.
resulT
With easy boarding and debarking, togetherwithefcientticketsystems,thetraveltimecanbeshortenedsignicantly.
VolVo’s soluTion – brT
rc f c x
32

7/29/2019 MBA VTU Project on VOLVO Group in India
http://slidepdf.com/reader/full/mba-vtu-project-on-volvo-group-in-india 37/166
10 kilometerso subway
50 kilometerso tramway
250 kilometerso Bus Rapid Transit
How much public transport does USD 1 billion buy?

7/29/2019 MBA VTU Project on VOLVO Group in India
http://slidepdf.com/reader/full/mba-vtu-project-on-volvo-group-in-india 38/166
gB gP 2011
soTranspg
34

7/29/2019 MBA VTU Project on VOLVO Group in India
http://slidepdf.com/reader/full/mba-vtu-project-on-volvo-group-in-india 39/166
luTionsorT
Population growth, urbanization and a rapidly
growing middle class are leading to an increas-
ing need or transportation. According to the
European Commission’s estimates, reight
volumes in Europe will rise by 50% between
2000 and 2020. However, inrastructure will
not be expanded at the same rate. I transpor-
tation is to continue to provide a driving orce
or socio-economic development, the trans-
port system must be improved and made
more efcient. When trafc increases there
is a correlated risk that accidents will increase.
Another challenge is presented by the pro-
tection o drivers and cargos. Threats androbbery are a ew o the risks aced by the
Group’s customers and society.
The issues are complex and require col-
laboration between several parties. There-
ore, the Volvo Group collaborates with the
public sector, private sector, academic insti-
tutions and our customers to develop serv-
ices and solutions that make the transport
system smarter, saer and more efcient.
Read more about how the Volvo Group is
working to solve tomorrow’s transportation
challenges.
Challenges
3
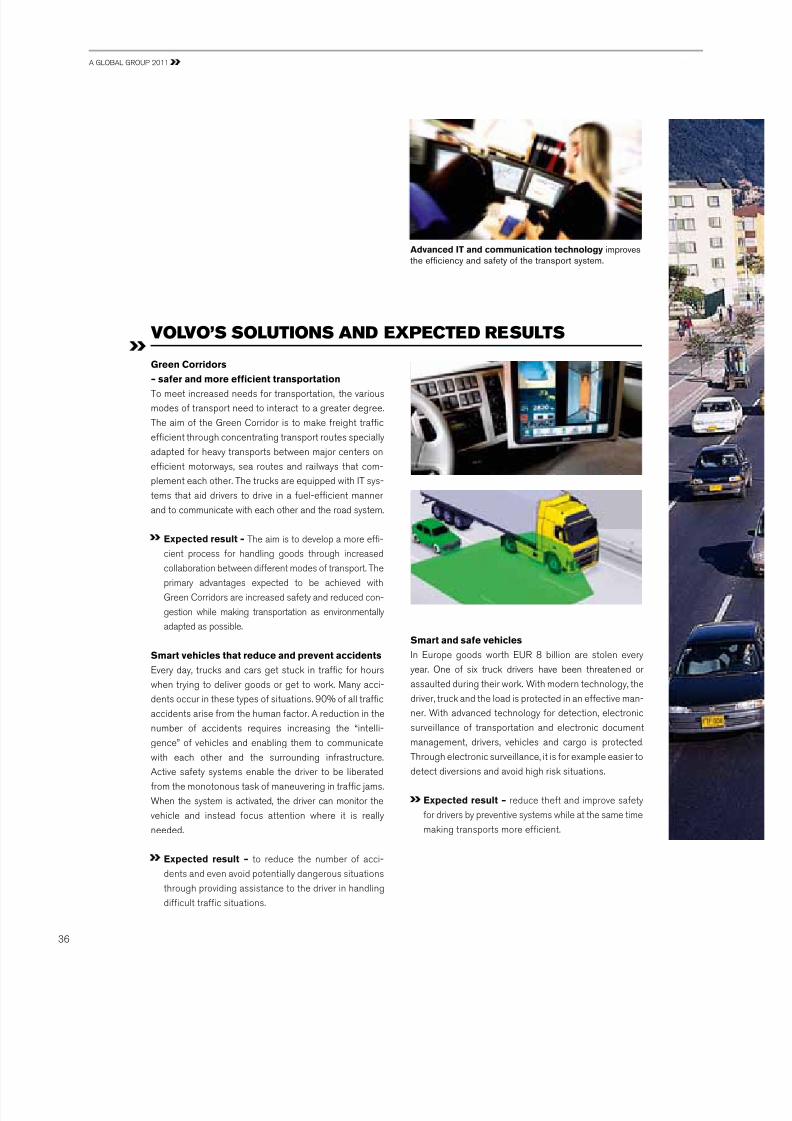
7/29/2019 MBA VTU Project on VOLVO Group in India
http://slidepdf.com/reader/full/mba-vtu-project-on-volvo-group-in-india 40/166
Advanced IT and communicationtechnologyimprovestheefciencyandsafetyofthetransportsystem.
VolVo’s soluTions and epeCTed resulTs
Green Corridors– saer and more efcient transportation
o meet increased needs for transportation, the various
modes of transport need to interact to a reater deree.
he aim of the green Corridor is to make freiht trafc
efcient throuh concentratin transport routes specially
adapted for heavy transports between major centers on
efcient motorways, sea routes and railways that com-
plement each other. he trucks are equipped with sys-
tems that aid drivers to drive in a fuel-efcient manner
and to communicate with each other and the road system.
Expected result – he aim is to develop a more ef-
cient process for handlin oods throuh increasedcollaboration between different modes of transport. he
primary advantaes expected to be achieved with
green Corridors are increased safety and reduced con-
estion while makin transportation as environmentally
adapted as possible.
Smart vehicles that reduce and prevent accidents
very day, trucks and cars et stuck in trafc for hours
when tryin to deliver oods or et to work. Many acci-
dents occur in these types of situations. 90% of all trafc
accidents arise from the human factor. reduction in the
number of accidents requires increasin the “intelli-
ence” of vehicles and enablin them to communicate
with each other and the surroundin infrastructure.
ctive safety systems enable the driver to be liberated
from the monotonous task of maneuverin in trafc jams.
When the system is activated, the driver can monitor the
vehicle and instead focus attention where it is really
needed.
Expected result – to reduce the number of acci-
dents and even avoid potentially danerous situations
throuh providin assistance to the driver in handlin
difcult trafc situations.
Smart and sae vehicles
n urope oods worth 8 billion are stolen every
year. ne of six truck drivers have been threatened or
assaulted durin their work. With modern technoloy, the
driver, truck and the load is protected in an effective man-
ner. With advanced technoloy for detection, electronic
surveillance of transportation and electronic document
manaement, drivers, vehicles and caro is protected.
hrouh electronic surveillance, it is for example easier to
detect diversions and avoid hih risk situations.
Expected result – reduce theft and improve safety
for drivers by preventive systems while at the same time
makin transports more efcient.
gB gP 2011
36

7/29/2019 MBA VTU Project on VOLVO Group in India
http://slidepdf.com/reader/full/mba-vtu-project-on-volvo-group-in-india 41/166
ThegoalwithGrcorridorsistoredtheimpactontheronmentwhilesimneouslyincreasingciencyandsafetyhighwaysthroughciallyadaptedtrastretchesforheav
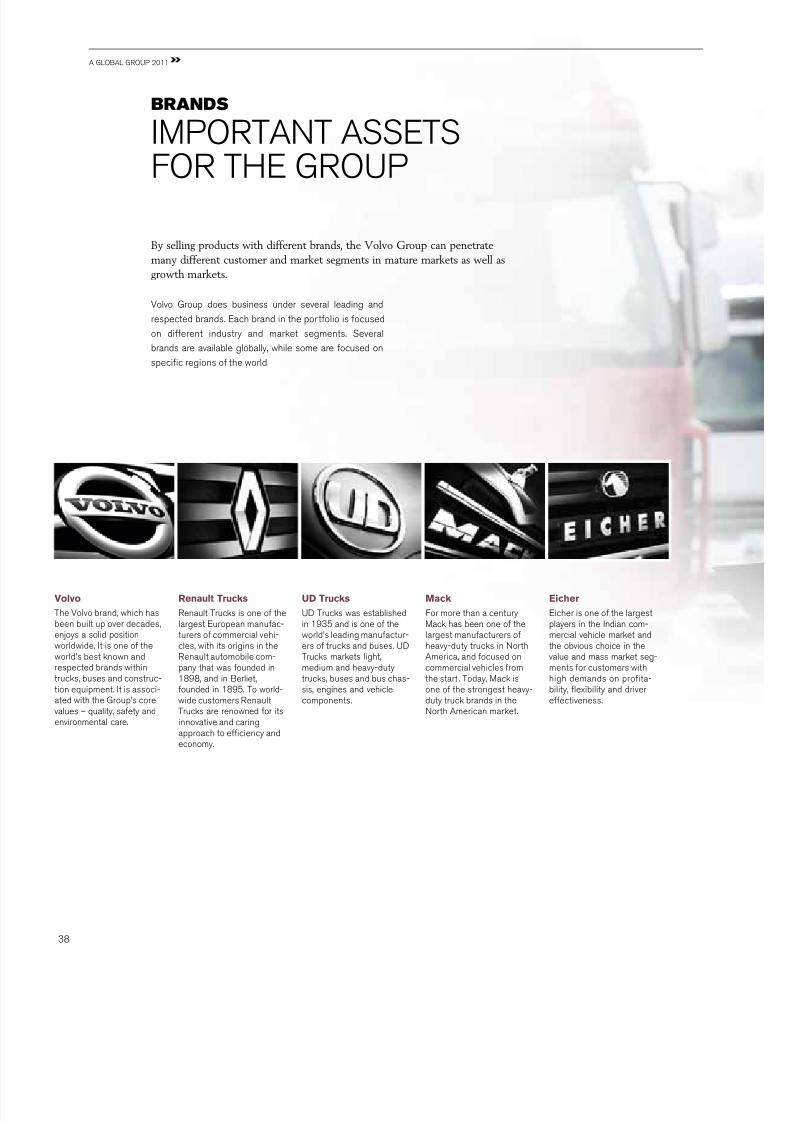
7/29/2019 MBA VTU Project on VOLVO Group in India
http://slidepdf.com/reader/full/mba-vtu-project-on-volvo-group-in-india 42/166
gB gP 2011
By selling products with different brands, the Volvo Group can penetrate
many different customer and market segments in mature markets as well as
growth markets.
brands
MP SSS
F H gP
Volvo
he Volvo brand, which hasbeen built up over decades,enjoys a solid positionworldwide. t is one of theworld’s best known andrespected brands withintrucks, buses and construc-tion equipment. t is associ-ated with the group’s corevalues – quality, safety andenvironmental care.
Renault Trucks
enault rucks is one of thelarest uropean manufac-turers of commercial vehi-cles, with its oriins in theenault automobile com-pany that was founded in1898, and in Berliet,founded in 1895. o world-wide customers enaultrucks are renowned for itsinnovative and carin
approach to efciency andeconomy.
UD Trucks
D rucks was establishedin 1935 and is one of theworld’s leadin manufactur-ers of trucks and buses. Drucks markets liht,medium and heavy-dutytrucks, buses and bus chas-sis, enines and vehiclecomponents.
Mack
For more than a centuryMack has been one of thelarest manufacturers ofheavy-duty trucks in orthmerica, and focused oncommercial vehicles fromthe start . oday, Mack isone of the stronest heavy-duty truck brands in theorth merican market.
Eicher
icher is one of the larestplayers in the ndian com-mercial vehicle market andthe obvious choice in thevalue and mass market se-ments for customers withhih demands on profita-bility, exibility and drivereffectiveness.
Volvo group does business under several leadin and
respected brands. ach brand in the por tfolio is focused
on different industry and market sements. Several
brands are available lobally, while some are focused on
specic reions of the world.
gB gP 2011
38

7/29/2019 MBA VTU Project on VOLVO Group in India
http://slidepdf.com/reader/full/mba-vtu-project-on-volvo-group-in-india 43/166
Volvo Penta
Volvo Penta is one of thestronest and most lobalbrand names in the enineindustry. n addition to quality,safety and environment, VolvoPenta is associated withinnovative and performance-oriented products. Penta hasbeen a reistered brandname for more than 100 years.
Volvo Aero
Volvo ero is a world-leadinbrand and develops, manu-factures and services com-ponents for aircraft eninesand as turbines. Volvo erohas been committed tolon-term relationshipssince 1930.
SDLG
SDg is a leadin brand inthe Chinese constructionmachinery industry, especiallyfor wheel loaders. he SDgbrand is sold primarily inChina and other emerinmarkets.
Prevost
With more than 10,000 vehi-cles on orth mericanroads, Prevost is a leadinorth merican manufac-turer of premium tourincoaches and bus shells forhih-end motorhomes andspeciality conversions.
Nova Bus
ova Bus is a leadin ortmerican provider of sustable transit solutions, includinenvironmentally-friendly bushih-capacity vehicles and irated intellient transportasystems.
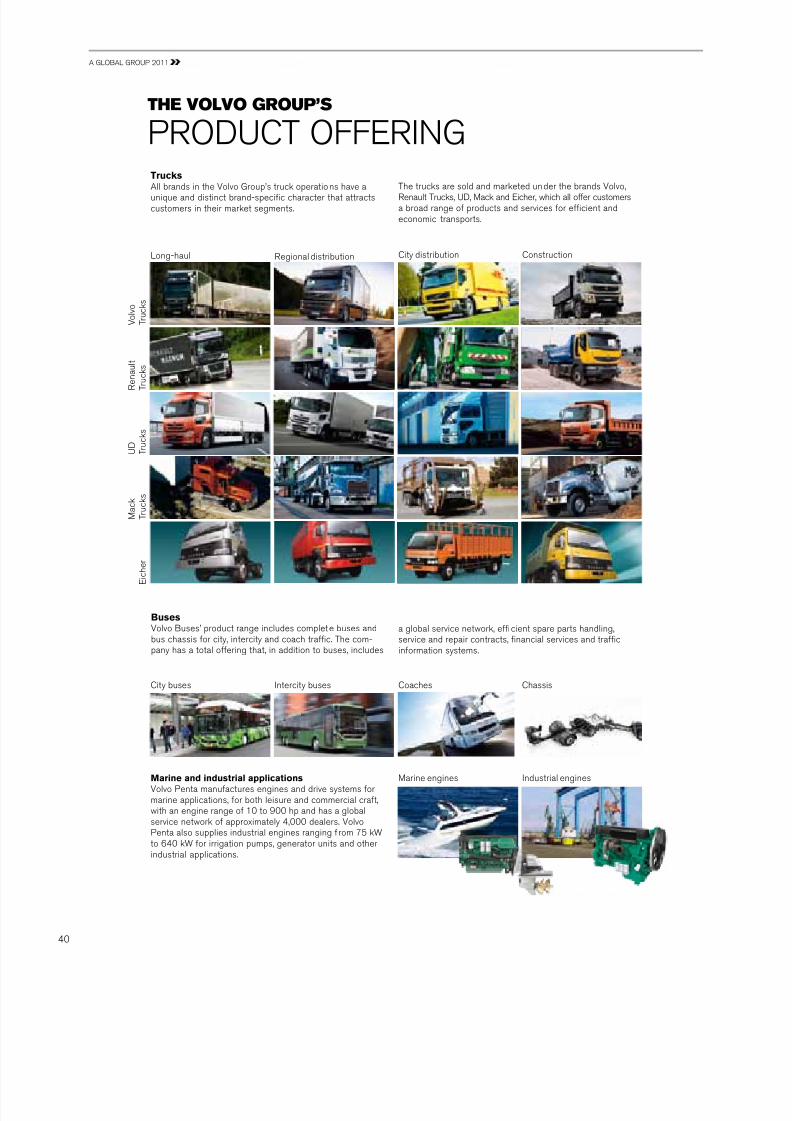
7/29/2019 MBA VTU Project on VOLVO Group in India
http://slidepdf.com/reader/full/mba-vtu-project-on-volvo-group-in-india 44/166
gB gP 2011
The VolVo group’s
PDC FFg
City distributioneional distribution Construction
M a c k
r u c k s
i c h e r
e n a u
l t
r u c k s
V o l v o
r u c k s
D
r u c k s
on-haul
Trucks
ll brands in the Volvo group’s truck operations have aunique and distinct brand-specic character that attractscustomers in their market sements.
he trucks are sold and marketed under the brands Volvo,enault rucks, D, Mack and icher, which all offer customersa broad rane of products and services for efcient andeconomic transports.
City buses ntercity buses Coaches Chassis
ndustrial eninesMarine eninesMarine and industrial applications
Volvo Penta manufactures enines and drive systems formarine applications, for both leisure and commercial craft,with an enine rane of 10 to 900 hp and has a lobalservice network of approximately 4,000 dealers. VolvoPenta also supplies industrial enines ranin f rom 75 kWto 640 kW for irriation pumps, enerator units and otherindustrial applications.
BusesVolvo Buses’ product rane includes complete buses andbus chassis for city, intercity and coach trafc. he com-pany has a total offerin that, in addition to buses, includes
a lobal service network, efcient spare parts handlin,service and repair contracts, nancial services and trafcinformation systems.
40

7/29/2019 MBA VTU Project on VOLVO Group in India
http://slidepdf.com/reader/full/mba-vtu-project-on-volvo-group-in-india 45/166
nine components nine overhaul Space
Financial servicesFinancial services such as customer and dealer nancin,and other services such as insurance, contribute to theVolvo group total solution offerin by creatin customervalue such as convenience, speed and peace of mind. Pro-vidin attractive nancial solutions and other support ser-vices is essential to meet today’s hih customer demands,and to attract and retain Volvo group customers.
Customer and dealer nancin
Compactconstruction equipment
Skidsteer loaders
oad machinery
sphalt millin machines
Heavyconstruction equipment
Backhoe loaders Compaction equipmentWheeled excavators Wheel loaders
Wheel loaders Motor radersCrawler excavators rticulated haulers
Crawler excavators PaversCrawler excavators from inon inon wheel loaders
Construction equipment
Volvo Construction quipment develops, manufactures andmarkets equipment for construction and related industriesunder the brands Volvo and SDg. ts products are leadersin many world markets, and include a comprehensive rane
of wheel loaders, hydraulic wheeled and crawler excavators,articulated haulers, road machinery and a wide rane of compactequipment.
Aerospace industryVolvo ero develops and manufactures advanced compon-ents for aircraft enines and space rockets with liht weihtin focus. More than 90% of all new lare commercial aircraftare equipped with enine components from Volvo ero.
he company is also responsible for the enines of theSwedish ir Force’s gripen hters . Volvo ero also has anaftermarket business that comprises repair and maintenanceof select aircraft enines as well as stationary as turbines.

7/29/2019 MBA VTU Project on VOLVO Group in India
http://slidepdf.com/reader/full/mba-vtu-project-on-volvo-group-in-india 46/166
gB gP 2011
world-Class serViCes
SgHS CSM
SHPS
and spare parts. he Volvo group’s increasinly broad
rane of these services and aftermarket products, so
called soft products, is of ever-increasin importance to
the group’s competitiveness.
When customers choose supplier of vehicles or machinery,
the offerin of supplementary services combined with
excellent products is a crucial factor. ccordinly, the
Volvo group offers such services as nancin and insur-
ance, various forms of service areements, accessories
Many customers want long-term cooperation around total solutions to
execute their work as efciently as possible with maximum protability
and reliability.
Theservicesandaftermarketproductsbusiness(socalledsoftproducts)
Spare parts
Atermarket Product AreasService Oering
ew parts
sed andremanu-
factured parts
xtendedparts
UptimeServices
Serviceplannin
Maintenanceand repair
pdates anduprades
Servicecontracts
Sotware
Vehiclesoftware
Fleet/Trans-port Services
ransportmanaement
Driver timemanaement
Vehiclemanaement
Security,safety &
environment
Driver info& support
Accessories
ccessories
on-Volvoaccessories
Merchandiseproducts
SupportServices
Competencedevelopment
Fleetmanaement
Call centerservices
ConsultancyServices
nformationservices
ServiceProducts
Serviceliterature
Service /dealer tools
PartsServices
FinancialServices
Dealernancin
Customernancin
ental
nsurance
Card and pay-ment solutions
Sales of hardproducts 77% (73)
Sales of services andaftermarket products(soft products) 23% (27)
Sot product share o IndustrialOperations’ net sales 2011
42

7/29/2019 MBA VTU Project on VOLVO Group in India
http://slidepdf.com/reader/full/mba-vtu-project-on-volvo-group-in-india 47/166
Growing atermarket business
n addition to vehicles and machines, the Volvo group’s
offerin includes various types of nancin solutions,
insurance, rental services, spare parts, preventive main-
tenance, service areements, assistance services and services. he rane and exibility of the offerin means
that the solutions can be customized for each customer.
Since a lare part of the offerin within the aftermarket
business is requested as lon as products are bein
used, they contribute to balancin the uctuations in the
business cycle for the group. By strenthenin the af ter-
market offerin, protability and revenue sustainability
can improve for the group throuhout the business cycle.
he stratey to increase sales of services and after-
market products is an important element in the Volvo
group’s effort to achieve tarets for protability and
rowth, both in mature markets and in the group’s new
markets. Durin 2011, the services and aftermarket prod-ucts business (soft products) represented approximately
23% of net sales in the ndustrial perations compared
to 27% in 2010. he extended product offerin such as
used vehicles and machines, trailers and superstructures
and special vehicles were previously dened as soft products.
Startin January 1, 2012 these are instead dened as
hard products. he numbers above and in the pie chart
on pae 42 reect the new denition and the comparison
numbers have been restated.
Develop and increase interace with customers
he majority of Volvo group’s customers are companies
within the transportation or construction industries. he
reliability and productivity of the products are important
and in many cases crucial to the customers’ success and
protability.
he oal is that Volvo group companies shall be rearded
as number one in customer satisfaction, in terms of both
products and services. he Volvo group shall also be
number one when the dealers’ customers assess customer
satisfaction. competent and professional dealer and service
network is of vital impor tance to the Volvo group and con-
tributes to strenthenin the group’s various brands.
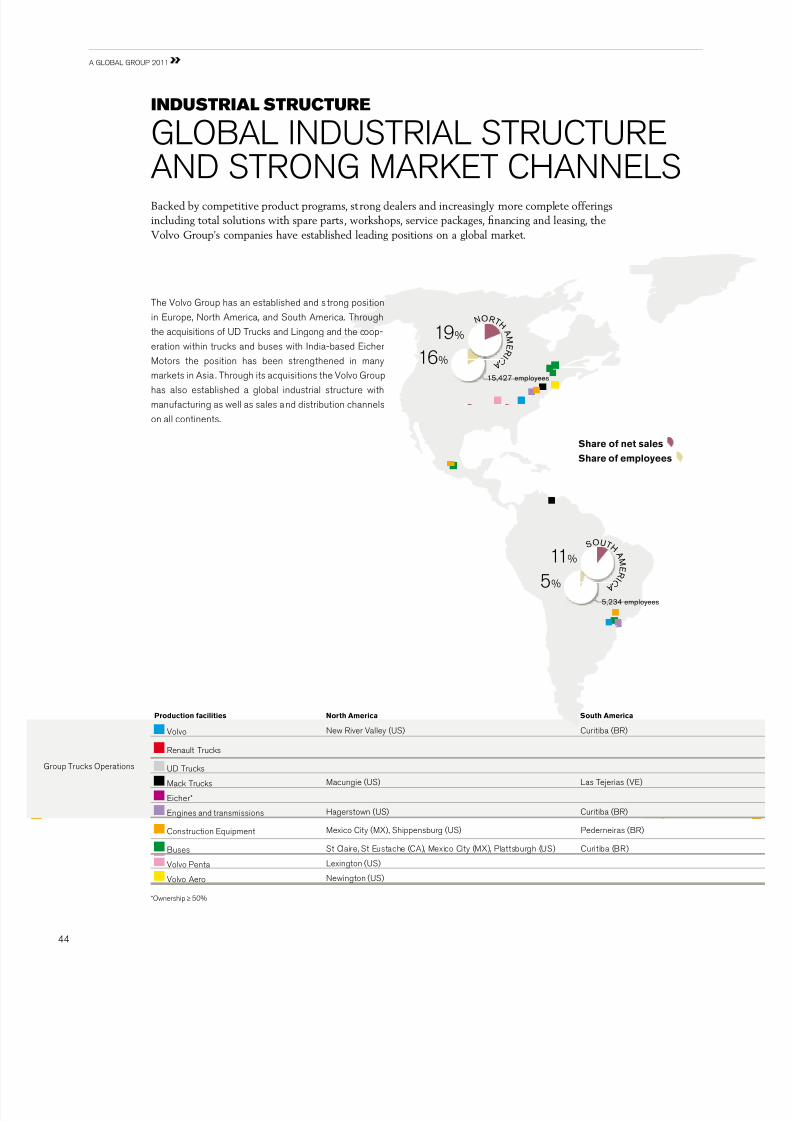
7/29/2019 MBA VTU Project on VOLVO Group in India
http://slidepdf.com/reader/full/mba-vtu-project-on-volvo-group-in-india 48/166
gB gP 2011
Production acilities North America South America
Volvo ew iver Valley (S) Curitiba (B)
enault rucks
D rucks
Mack rucks Macunie (S) as ejerias (V)
icher*
nines and transmissions Haerstown (S) Curitiba (B)
Construction quipment Mexico City (MX), Shippensbur (S) Pederneiras (B)
Buses St Claire, St ustache (C), Mexico City (MX), Plattsburh (S) Curitiba (B)
Volvo Penta exinton (S)
Volvo ero ewinton (S)
*wnership ≥ 50%
oup rucks perations
he Volvo group has an established and s tron position
in urope, orth merica, and South merica. hrouh
the acquisitions of D rucks and inon and the coop-
eration within trucks and buses with ndia-based icher
Motors the position has been strenthened in many
markets in sia . hrouh its acquisitions the Volvo group
has also established a lobal industrial structure with
manufacturin as well as sales and distribution channels
on all continents.
Backed by competitive product programs, st rong dealers and increasingly more complete offerings
including total solutions with spare parts , workshops, service packages, nancing and leasing, the
Volvo Group’s companies have established leading positions on a global market.
indusTrial sTruCTure
gB DS SC
D Sg MK CHS
15,427employees
NoR T H A
M E R I C
A
5,234employees
SoU T H A M E R I C
A
Share o net sales
Share o employees
16%
19%
5%
11%
44

7/29/2019 MBA VTU Project on VOLVO Group in India
http://slidepdf.com/reader/full/mba-vtu-project-on-volvo-group-in-india 49/166
Europe Asia Rest o world
götebor, meå (S), gent (B), Kalua () Banalore (), Bankok ( H) Durban ( ), Brisbane ()
Blainville, Bour-en-Bresse, imoes, Vénissieux (F),Kalua ()
eo (JP), Hanzhou* (C) Johannesbur* ()
Brisbane ()
Pithampur* ()
Köpin, Skövde (S), eanès (S), Vénissieux (F) eo, Kounosu, Hanyu (JP)
rvika, Braås, skilstuna, Hallsber (S), Konz-Könen,Hameln (D), Belley (F), Wroclaw (P)
Chanwon (K), Shanhai, inyi* (C),Banalore ()
Borås, Säfe , ddevalla (S), Wroclaw (P) Banalore () Shanhai* (C)
götebor, Vara (S) Shanhai (C)
rollhättan, inköpin (S), Konsber ()
Trucks,64% Buses,7%ConstructionEquipment,21%
VolvoPenta,3% VolvoAero,2% CustomerFinance,3%
Share o Group’s net sales
19,924employees
AS I A
2,456employees
oT H E R M A R k
E T S
55,121emplo yees
E U R o
P E
3%
7%
20%
24%
56%
39%

7/29/2019 MBA VTU Project on VOLVO Group in India
http://slidepdf.com/reader/full/mba-vtu-project-on-volvo-group-in-india 50/166
BD F DCS’ P 2011
susTainable deVelopmenT
P F H PBM
– D H SThe Volvo Group’s vision is to become world leader in sustainable transport solutions. Efcient transport is
crucial for societal and economic development. While the Group’s products and services are closely linked to
growth and development, they also contribute to climate change, emissions, congestion and trafc accidents.
Transports are essential for a society, but need to be made sustainable. As one of the world leading manufacturers
of transport and infrastructure solutions the Volvo Group has both a responsibility and opportunity to address
the issues and reduce the negative impact.
Contributing to a more sustainable worldhe Volvo roup has a lon history of developin
pioneerin products and services for the trans-
port and infrastructure industries. he group is
convinced that its products and services will
play an important part also in the sustainable
society. he Volvo group has the skills, resources
and lobal reach to shape the future of transport .
BD F DCS’ P 2011
CreaTingshared
In the ollowing section you can read more aboutesponsible business is ood business
nvironmentally enhanced products
he Volvo group – a hih performin oranization
esponsible sourcin
46

7/29/2019 MBA VTU Project on VOLVO Group in India
http://slidepdf.com/reader/full/mba-vtu-project-on-volvo-group-in-india 51/166
Value
he Volvo group believes there is no contradic-
tion in runnin a nancially viable business while
contributin to sustainable development. stra-teic CS (Corporate Social esponsibility)
approach is increasinly important for the Volvo
group’s competitiveness by e.. improvin brand
imae, reducin cost, creatin new business
opportunities and buildin stakeholder relation-
ships.
he Volvo group is convinced that responsible
business contributes to lon-term success.
esponsibility is deeply rooted within the Volvo
group and is based on the values and principles
in the group’s Code of Conduct. he Volvo group
strives to assume economic, environmental and
social responsibility for its operations, products
and services within its sphere of inuence in the
value chain. he Volvo group believes this
approach is essential to build lastin relations
with customers, employees, suppliers and other
stakeholders.
he Volvo group’s lobal foot print has
chaned dramatically in the past decade. he
Volvo group has rown sinicantly and has
welcomed new employees and new entities. s
a consequence, the group is operatin in approx-
imately 190 markets. ocal conditions differ – as
do the expectations on business in different partsof the world.
From risk to value
For a lon time, CS has primarily been seen as
an effective risk manaement tool and for opti-mizin the use of resources. isk manaement
and buildin relationships with stakeholders are
important components of the overall CS strat-
ey. However, the Volvo group believes that this
approach fails to fully explain the business
potential of CS or how a proactive approach
creates value for the Volvo group. he Volvo
group is convinced that CS is much more than
a risk manaement tool.
Creating shared value
he world faces urent lobal challenes, such
as climate chane, depletion of natural resources
and uneven distribution of wealth. he complex-
ity, size and scale of these challenes require
cooperation amon states, reions and different
sectors of society. he expectations on business
to provide solutions to the challenes are rowin.
oday, a company is larely juded by the valueit brins to society
he Volvo group develops products and ser v-
ices based on customer needs and the group
intends to ive its shareholders a ood return on
their investment. But the group also strives to
serve society by providin solutions that meet
the challenes of sustainable transport. his is
what the Volvo group means with Creatin
shared value.
Sustainability is part of our business– Responsibility is part of our culture
esponsible business is ood business
The Global Compact
TheVolvoGroupisasignatoryoftheUNGlobalCompact.
Sustainable Transport Solutions
SustainabletransportsolutionstotheVolvoGrouparesolutionsthat“improvetheshortandlongtermeconomicandenvironmentalper-
formancemeanwhilesocialimpactisconsidered”,byproviding:
The right product
or service in order to
contribute to high pro-
ductivity in the transport
system
Energy efcienttransport solutions
with very low emiss-ions of CO
2, PM,
NOx
and noise
Safe and securetransport solutions

7/29/2019 MBA VTU Project on VOLVO Group in India
http://slidepdf.com/reader/full/mba-vtu-project-on-volvo-group-in-india 52/166
BD F DCS’ P 2011
Climate chane is one of the reatest chal-
lenes faced by mankind. esearch shows that
transport is responsible for approximately 13%of the total reenhouse as emissions caused
by humans. s one of the world’s larest manu-
facturer of commercial vehicles the Volvo group
has a responsibility to work to reduce C2
emis-
sions from its products.
he group’s vision is to become world leader in
sustainable transport solutions.
t is critical for the Volvo group’s future success
to continue to develop breakthrouh innovations
and technoloies and convertin them into nan-
cially viable products and services. he Volvo
group’s products and services are important
components of the transport system. However,
the transport system sets the boundaries for our
products. he group therefore has to cooperate
and partner with other actors in order to develop
sustainable transport solutions.
Three areas o ocus
he group’s product development is affected by
the cost of, access to and availability of fuel, as
well as leislation in the environmental area.
herefore, the Volvo group focuses its research
and development on the development of:
• nery-efcient drivelines• Hybrid drivelines
• Vehicles that can be operated on renewable
fuels.
he Volvo group also participates in public and
private partnerships to develop sustainable and
efcient transport systems such as Bus apid
ransport System (B) and ntellient rans-
port Solutions (S).
Energy efcient drivelines
pproximately 90% of the environmental impact
results from the use of the products. he group’smain focus is therefore on reducin the environ-
mental impact of products in use.
he Volvo group estimates the fuel-savin
potential for a standard truck will be 15% in
2020 compared with fuel consumption in 2005.
ew technoloy can lead to even more sinicant
savins. For instance, the use of a hybrid drive-
line may improve fuel savins by up to 37% in
certain bus operations.he Volvo group is workin on research and
development to meet the future uro V leislation,
which will come into effect in the in 2014.
missions of x
(itroen xides), and PM
(Particulate Matter) will be reduced by 97%
compared to a truck from the early 1990s. Vehi-
cles compliant with the uro V will thereby emitt
very low levels of xand PM.
Hybrid technology
Hybrid technoloy is one of the most promisin
and competitive technoloies for commercial
vehicles. Because of its potential for savin fuel,
hybrid technoloy means lower operatin costs
for customers while at the same time sini-
cantly reducin environmental impact.
Hybrid technoloy is best suited to urban
operations since the most appropriate vehicles
for hybrid drivelines are those operatin in con-
tinuous stop-o conditions, such as city buses
and refuse or distribution trucks.
he Volvo group’s -SM concept consists of
an electric motor and a diesel enine workin in
parallel, whereby each of them can be used
where they are most effective. Production of theVolvo Hybrid city bus and the Volvo Hybrid double-
decker started in 2010. Sinicant fuel savins
of up to 37% makes this bus a commercially
viable option.
n 2011 Volvo rucks commenced sales of
hybrid trucks, under the name Volvo F Hybrid,
to customers in selected uropean markets.
ests show that the fuel savin potential for this
truck is up to 20%.
Renewable and alternative uels
Carbon dioxide neutral vehicles are powered by
fuel produced from renewable raw materials suchas biomass. educin dependency on fossil fuels
such as oil, coal and natural as by increasin the
use of renewable fuels makes business and envi-
ronmental sense. he Volvo group’s research on
renewable fuels is mainly focused on Methane
Diesel and DM (dimethyl ether).
Joint DME project
DM is a potential alternative to fossil fuel; it is
enery-efcient and has a proven lower environ-mental impact. stimates show that by replacin
conventional diesel with Bio-DM carbon dioxide
emissions will be cut by 95%.
he BioDM project is a joint venture with,
amon others, the and the Swedish nery
ency. he aim is to involve the entire chain;
from production of DM from biomass, distribu-
tion to DM used as vehicle fuel.
he Volvo group is coordinatin the project
and develops demonstration vehicles for eld
tests between 2010 and 2012. wo vehicles
were handed over to customers for eld tests in
early 2011.
Combining methane and diesel
he benet of methane diesel technoloy is that
methane fuel is already available as a fuel for
vehicles.
n 2011, Volvo rucks launched the new Volvo
FM Methane Diesel truck. he truck is powered by
up to 75% as and therefore the C2-emissions
will be considerably reduced. Volvo rucks is the
rst manufacturer in urope to start sellin as-
powered trucks for lon-haul operations.
Partnership with WWF
n 2010, the Volvo group became the world’srst manufacturer in the automotive industryto join the World Wildlife Fund for ature(WWF) Climate Savers Proram. he Volvogroup has thereby committed to even moreambitious emission tarets for reenhouseases than previously. he Volvo group’s truck companies have undertaken to reduce carbondioxide emissions from vehicles manufacturedbetween 2009 and 2014 by 13 million tons.n 2011 it was areed that Volvo Constructionquipment and Volvo Bus should join the WWF
Climate Savers proram. he partnership waslaunched durin a ceremony in Februar y 2012in China.
nvironmentally enhanced products
48

7/29/2019 MBA VTU Project on VOLVO Group in India
http://slidepdf.com/reader/full/mba-vtu-project-on-volvo-group-in-india 53/166
2002
Euro IV2002
Euro III1996
Euro II2009
Euro V2007
EPA 20072002
EPA 20022014
Euro VI2010
EPA 2010
0,16
0,12
0,08
0,04
0
8
6
4
2
0
Particles, g/kWh NOx, g/kWh
Europe USA
Particles, g/kWh NOx, g/kWh
Emissions regulations or trucks and buses
n September 2009, uro V was implemented in urope and in January 2010,P 2010 was implemented in orth merica. uro V entails a 50% reduc-tion of
xemissions compared to uro V. With the implementation of P
2010, emission levels for particulates and xare close to zero. uro V will
come into effect in January 2014 in the .
2000
0
20
60
40
80
120
100
Within the EU all road transpor t emissions except for CO2
are expectedto decrease in the future. T his is the result of stringent emission regulations.
1995 2005
Particulate matter (PM) from diesel
Sulphur dioxide (SO2)
Solvents (VOCs)
Carbon dioxide (CO2)
Carbon monoxide (CO)
Nitrogen oxides (NOX)
Benzene
2010 2015 2020
Source: ACEA - European AutomobileManufacturers' Association.
Signifcantly reduced emissions
-5% Recycling
12% Producingthe truck
30% Exhaust emissionsincluding CO
2from fuel use
58% FuelResource use of crude oil and fuel production
9 3 %
D r i
v i n g
t h
e t
r u c k
5% Maintenance
Lie Cycle Assessment
EachnewproductfromtheVolvoGroupshouldhavelessenvironmentalimpactthantheproductitreplaces.TheGroupusesLifeCycleAnalysis(LCA)tomapaproduct’senviron-mentalimpactinordertomakebetterinformeddecisionsinthedevelopmentprocess.
Findingsfromanalysesindicateapproximately90%oftheenvironmentalimpact
resultsfromtheuseoftheproducts.TheGroup’smainfocusisthereforeonreducingtheenvironmentalimpactofproductsinuse.

7/29/2019 MBA VTU Project on VOLVO Group in India
http://slidepdf.com/reader/full/mba-vtu-project-on-volvo-group-in-india 54/166
BD F DCS’ P 2011
Key fgures 2011 2010
umber of employees at year-end 98,162 90,409
Share of women, % 17 16
Share of women, Board Members, % 13 12
Share of women, Presidents and other senior executives, % 17 15
ncreased lobal presence, new products, new
technoloy, demoraphic chanes and more
rapid uctuations in the lobal economy will leadto challenes in the supply of expertise and
resources.
Attracting and retaining competence
he Volvo group’s ambition is to of fer interest-
in opportunities and a unique company culture
that help us attract and retain the best people,
whoever they are and wherever we do business.
Without enaed employees, who are willin
to take an active part in the group’s development
and future, the Volvo group will not succeed in
pursuin its strateies. t is therefore important
we attract the riht expertise and competent
enineers to continue the development of envi-
ronmentally enhanced products. he Volvo group
reularly maps the strateic competence needs,
and annually areate ndins on a group
level to identify the most important future needs.
Academic Partner Program
he number of people in urope raduatin with
derees in mathematics, science and technol-
oy (MS) is declinin, and this trend may have
an effect on the future competitiveness of
urope. he Volvo group is involved in a com-
prehensive series of cooperative ventures withresearch bodies and academic institutions to
advance the technoloies needed for future
product development. ne example is the
cademic Partner Proram.
Competence development
nvestin in the group’s employees is a funda-
mental part of stayin competitive, sustainable
and protable. he Volvo group’s trainin prorams
are offered at all levels for employees, and the
activities rane from traditional and e-based
trainin to individual coachin and mentorin.
ndividual competence development is based
on a personal business plan, which provides
support for translatin corporate strateic
objectives into individual objectives and contri-
bution. he purpose is to ensure that employees
clearly understand their role in the team and
what is expected of them.
Developing talents
very manaer is responsible for assessin and
developin talent in the oranization. he eader-
ship Pipeline provides the group with a structured
approach to developin and preparin presentleaders as well as potential leaders for future
roles.
he eadership Pipeline has been set up
jointly with research institutes and is based on
lobal research. t is also desined to support
the Volvo group’s culture and values as well as
the strateic objectives.
Geographic distribution o employees
Sweden 25%
Europe, excl. Sweden 31%
North America 16%
South America 5%
Asia 20%
Other countries 3%
Diversi ty enhances innovation
o create the dynamics required to succeed at a
lobal level the Volvo group needs to recruit andretain a broad spectrum of employees with dif-
ferent backrounds, experience and perspectives.
n the Volvo group diversity is considered to be
a catalyst for innovation and a source of com-
petitiveness and protability. By expandin the
knowlede base, skills and understandin, the
group becomes more responsive to customer
needs and it strenthens the group’s market
position.
Diversity and inclusion have lon been priori-
tized within the Volvo group.
Employee engagement
n 2011, an mployee naement ndex was
added to the Volvo group ttitude Survey
(VgS). By includin enaement there is a
clearer connection to the group’s wanted position,
culture and business success.
he results from VgS is benchmarked
aainst an international database with data
athered from over 14 million employees, repre-
sentin over 80 countries. n the 2011 VgS,
the Volvo roup reached an mployee nae-
ment ndex of 76%. his can be compared with
the lobal norm of 68%. he survey reveals thatthe Volvo group’s eneral strenths are the
employees’ pride at manufacturin products of
hih quality and that they clearly understand
their role and the business objectives.
hih-performin oranization
Academic Partner Programhe Volvo group cademic Partner Proram(PP) is a systematic approach for lon-termcooperation with selected universities andresearch institutes in areas of special interest.he proram aims to provide the group with aholistic picture of important collaborative part-ners and to increase the group’s visibility tostudents and researchers.
ur involvement with universities is alsoimportant for creatin relationships withstudents and potential employees to secureaccess to future competence.
50
7/29/2019 MBA VTU Project on VOLVO Group in India
http://slidepdf.com/reader/full/mba-vtu-project-on-volvo-group-in-india 55/166
esponsible supply chain manaement is about
manain risk, promotin responsible behaviour
and buildin lon-term relationships with suppli-ers to improve social, environmental and busi-
ness ethics in the supply chain. nsurin ood
standards in the supply chain is important to the
Volvo group and its stakeholders. he group
wants to ensure that unethical values are not
built into the group’s products and services.
Since 1996 the Volvo group has radually
increased requirements for suppliers reardin
environmental, business ethics and social respon-
sibility aspects.
he requirements placed on suppliers are
based on the principles contained in the Volvo
group’s Code of Conduct and international norms
of behaviour.
Sourcing and risk assessments
n 2011, more than 39,000 suppliers delivered
products and services to the Volvo group. pprox-
imately 6,000 are suppliers of direct material
used in automotive products. 8% of these suppli-
ers are located in countries assessed as ‘hih risk’
identied in the Volvo group’s CS country risk
model. he risk assessments are based on analy-
ses conducted by internationally reconized insti-
tutions and include factors such as human rihts,labour standards and incidence of corruption. he
Volvo group has chosen to apply the same require-
ments and the same process on all suppliers.
Results rom the assessments in 2011
n 2011, 63% of Volvo group purchasin spend
derived from suppliers of direct materials that
had completed the CS assessment durin 2010
and 2011. 73% of the suppliers that completed
the assessment passed. lmost exclusively, the
main reason for failin to comply with the
assessment is a lack of adequate systems to
pass on the requirements to their suppliers.Suppliers that do not pass are asked to draw up
an action plan.
he assessment was completed by 83% of
suppliers from countries considered to be hih
risk from a CS-perspective.
n 2012, the group will continue to focus on
assessin suppliers in identied hih- and medium
risk countries from a CS perspective and to work
with the non-approved suppliers to ensure that
the group’s requirements are met.
esponsible sourcin
he environmental effort is and has lon beenone of the cornerstones in the group’s work. he joint environmenta l policy i s one of the mostimportant documents for control. he policy is thefoundation of the group’s environmental manae-ment system, strateies and tarets, audits andmeasures.
lready in 1995, the rst environmental man-aement system was certied. t the end of 2011,99% of the employees in production units wereworkin in accordance with the certied environ-mental manaement system, primarily S14001:2008. t each production unit, there is anenvironmental coordinator.
he group’s environmental oals are used tocontrol, develop and monitor the environmental
effort. Strateies to achieve the oals are includedin the business plan. Since 2004, the Volvo grouphas put an extra stron focus on enery reductionin its own production process. nery consumptionhas since decreased by 46% per produced unit.
he enery-savin oal for 2010–2012 isdivided into two parts:
• Continue the work with investiatin the pos-sibility of makin the group’s facilities carbonneutral.
• Standby loss, i.e. enery consumption durinnon-production hours, must decrease by 50%and an additional 15% enery-savin perproduced unit by 2012, compared with 2008.
Production
Focusin on enery-savins measures is ood forboth the environment and the group’s nancialresults. couple of years ao, when the Volvogroup launched the world’s rst carbon-neutralplant, the primary reason was to reduce the envi-ronmental load, but it soon became quite clearthat it was also a solid nancial investment, whichwill enerate sinicant cost savins in the lonterm.
ll production plants must comply with thecommon minimum requirements pertainin tochemicals, enery consumption, emissions to airand water, waste manaement, environmentaloranization and improvement work. Since 1989,environmental audits have been conducted toensure compliance with the environmental policy
and in the event of acquisitions; a review is con-ducted of the company and properties to observeenvironmental factors and risks.
n 2011, 17 facilities in Sweden required permits.ll have the necessary environmental permits andno permits needs to be renewed in 2012. heexistence of contaminated land in our propertiesis documented annually. Durin 2011, no after-treatment of contaminated land was in proresson Volvo group property in Sweden. Durin 2011,no spills were reported, no major environmentalincidents occurred and no environmental disputesare onoin.
Environmental data reportEveryyear,theVolvoGrouppublishesadetailedEnvironmentaldatareport.ReadmoreunderResponsibilityatwww.volvogroup.com
Volvo Group Sustainability Reportwillbeavailableonwww.volvogroup.combytheendofMarch.
Volvo Group’s environmental performanceForinformationontheVolvoGroup’senviron-mentalperformanceseetheEleven-yearsum-mary.

7/29/2019 MBA VTU Project on VOLVO Group in India
http://slidepdf.com/reader/full/mba-vtu-project-on-volvo-group-in-india 56/166
BD F DCS’ P 2011
Many of the world’s leading stock markets had a weak development in 2011 in the
wake of the debt crisis in Europe and concern for the global economy. The Volvoshare also had a negative development.
THE SHARE
H MS DD SH SCKHM
he Volvo share is listed on the asdaq MX
ordic xchane in Sweden. ne share enti-
tles the holder to one vote at nnual general
Meetins and one B share entitles the holder to
one tenth of a vote. Dividends are the same for
both classes of shares.
he Volvo share is included in a lare number
of indexes that are compiled by Dow Jones,
FS, S&P and asdaq MX ordic.
Negative development on the
stock market
n eneral, the development on the world’s lead-
in stock exchanes was neative followin two
years of positive trends. n asdaq MX ordic,
the MXSP index fell by 18% durin the year.
radin in Volvo shares on asdaq MX
ordic decreased by 35% compared to 2010.
he share price decreased by 34%, and at year-
end the price for the Volvo share was SK
75.95. he hihest price paid was SK 119.50
on January 3, 2011.radin in Volvo B shares on asdaq MX
ordic increased by 30% compared to 2010.
he share price decreased by 36% and was
SK 75.30 per share at year-end. he hihest
price paid was SK 121.70 on January 3, 2011.
n 2011, a total of 3.1 billion (2.5) Volvo shares
at a value of SK 282 billion were traded as-
daq MX Stockholm, correspondin to a daily
averae of 12.0 million shares (9.8).
he Volvo share was the most traded share
on asdaq MX Stockholm in 2011. t year-end
2011, Volvo’s market capitalization totalled SK
153 billion (238).
n increasin portion of the tradin in Volvo
shares is carried out on alternative exchanes
such as Bats urope, Burundy, Chi-X and
urquoise. ccordin to Fidessa the direct trad-
in on asdaq MX Stockholm accounted for
56% of the turnover in the Volvo B share while
the tradin at Chi-X accounted for 11%, Bur-
undy for 5%, Bats urope for 3% and ur-
quoise for 2%. he remainder of the tradin
took place outside these exchanes.
Share conversion option
n accordance with a resolution on the gM on
pril 6, 2011, the rticles of ssociation have
been amended to include a conversion clause,
stipulatin that series shares may be con-
verted into series B shares, after a request sent
to the Board.Durin the year a total of 14.1 million shares
was converted to B shares, representin 2.1%
of the initially outstandin shares. total of
50 requests from 33 persons or entities were
handled.
Further information on the procedure is avail-
able on the Volvo group’s web site:
www.volvoroup.com
Dividend
he Board proposes a dividend of SK 3.00 per
share for the nancial year of 2011, which would
mean that a total of SK 6,082 M would be
transferred to B Volvo’s shareholders. For the
precedin year a dividend of SK 2.50 per share
was paid out, in total SK 5,069 M.
Communication with shareholders
Dialo with the shareholders is important for
Volvo. n addition to the nnual general Meetin
and a number of larer activities aimed at pro-
fessional investors, private shareholders and
stock market analysts, the relationship between
Volvo and the stock market is maintained throuh
such events as press and telephone confer-
ences in conjunction with the publication of
interim reports, meetins with retail sharehold-
ers’ associations, investor meetins and visits,
as well as road shows in urope, orth merica
and sia.
n the website www.volvoroup.com it is pos-sible to access nancial reports, search for infor-
mation concernin the share, insider tradin in
Volvo and statistics for truck deliveries. t is also
possible to access information concernin the
group’s overnance, includin information about
the nnual general Meetin, the Board of Direc-
tors, group Manaement and other areas that
are reulated in the “Swedish Code of Corporate
governance.” he website also offers the possi-
bility to subscribe to information from Volvo.
Total return, Volvo B
B Share(incl. re-investeddividends)
SIX Return index
Source: NASDAQ OMX07 08 09 10 1120
40
60
100
120
140
160
80
Earnings per share, SEK
Dividend per share, SEK
(7.26)
0.00
1 Proposed by the Board of Directors
08
4.90
2.00
10
5.36
2.50
07
7.37
5.50
09
11
8.75
3.001
Earnings and dividend per share
52
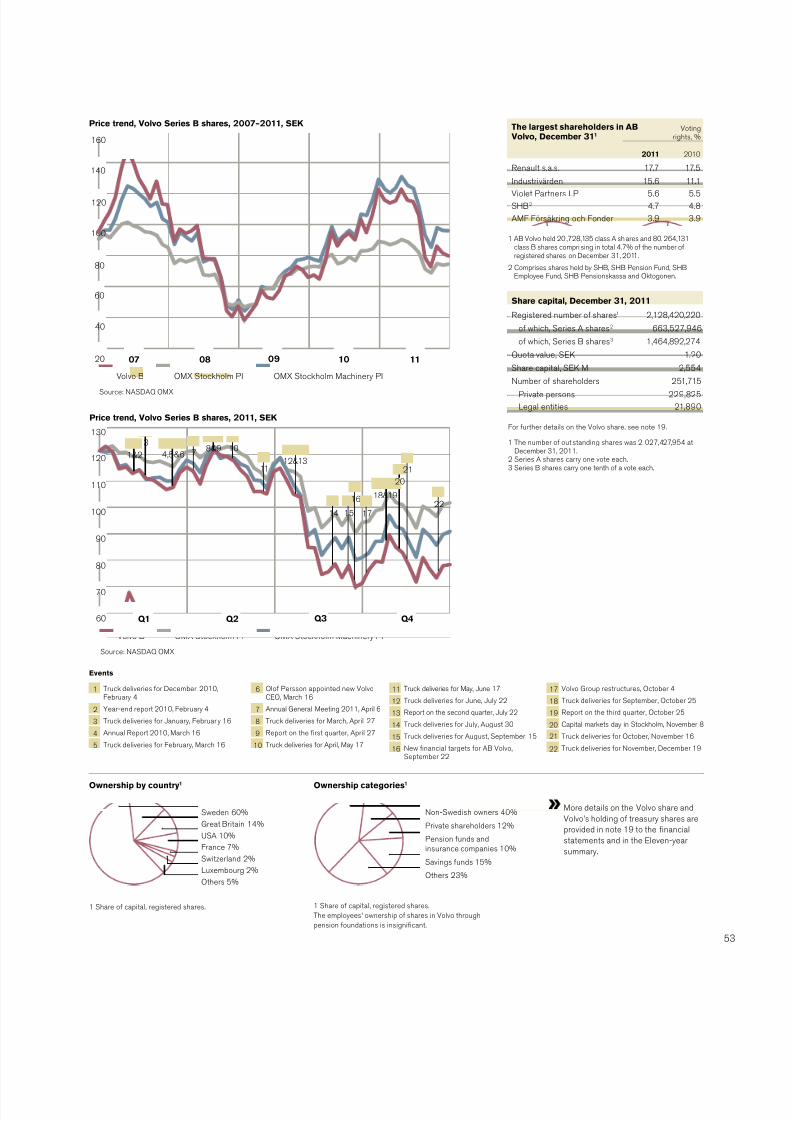
7/29/2019 MBA VTU Project on VOLVO Group in India
http://slidepdf.com/reader/full/mba-vtu-project-on-volvo-group-in-india 57/166
Ownership by country1
Sweden 60%
Great Britain 14%
USA 10%
France 7%
Switzerland 2%
Luxembourg 2%
Others 5%
1 Share of capital, registered shares.
Ownership categories1
Non-Swedish owners 40%
Private shareholders 12%
Pension funds andinsurance companies 10%
Savings funds 15%
Others 23%
1 Share of capital, registered shares.
The employees' ownership of shares in Volvo through
pension foundations is insignificant.
OMX Stockholm PI
Source: NASDAQ OMX
Volvo B OMX Stockholm Machinery PI
07 08 09 10 1120
40
60
80
100
120
140
160
Price trend, Volvo Series B shares, 2007–2011, SEK
OMX Stockholm PI
Source: NASDAQ OMX
Volvo B OMX Stockholm Machinery PI
Q2 Q3 Q460
70
80
100
120
130
Q1
110
90
3
1&2 4,5&6 7 8&9 10
1112&13
14 15
16
17
20
18&19
21
22
Price trend, Volvo Series B shares, 2011, SEK
More details on the Volvo share andVolvo’s holdin of treasury shares areprovided in note 19 to the nancialstatements and in the leven-yearsummary.
The largest shareholders in ABVolvo, December 311
Votinrihts, %
2011 2010
enault s.a.s. 17.7 17.5
ndustrivärden 15.6 11.1Violet Partners P 5.6 5.5
SHB2 4.7 4.8
MF Försäkrin och Fonder 3.9 3.9
1 B Volvo held 20 ,728,135 class shares and 80,264,131class B shares compri sin in total 4.7% of the number ofreistered shares on December 31, 2011.
2 Comprises shares held by SHB, SHB Pension Fund, SHBmployee Fund, SHB Pensionskassa and ktoonen.
Share capital, December 31, 2011
eistered number of shares1 2,128,420,220
of which, Series shares2 663,527,946
of which, Series B shares3 1,464,892,274
Quota value, SK 1.20
Share capital, SK M 2,554umber of shareholders 251,715
Private persons 229,825
eal entities 21,890
For further details on the Volvo share, see note 19.
1 he number of out standin shares was 2, 027,427,954 atDecember 31, 2011.
2 Series shares carry one vote each.3 Series B shares carry one tenth of a vote each.
Events
1 ruck deliveries for December 2010,February 4
2 ear-end report 2010, February 4
3 ruck deliveries for January, Februar y 16
4nnual eport 2010, March 16
5 ruck deliveries for February, March 16
6 lof Persson appointed new VolvoC, March 16
7 nnual general Meetin 2011, pril 6
8 ruck deliveries for March, pril 27
9eport on the rst quarter, pril 27
10 ruck deliveries for pril, May 17
11 ruck deliveries for May, June 17
12 ruck deliveries for June, July 22
13 eport on the second quarter, July 22
14 ruck deliveries for July, uust 30
15 ruck deliveries for uust, September 1516 ew nancial tarets for B Volvo,
September 22
17 Volvo group restructures, ctober 4
18 ruck deliveries for September, ctober 25
19 eport on the third quarter, ctober 25
20 Capital markets day in Stockholm, ovember 8
21 ruck deliveries for ctober, ovember 1622 ruck deliveries for ovember, December 19

7/29/2019 MBA VTU Project on VOLVO Group in India
http://slidepdf.com/reader/full/mba-vtu-project-on-volvo-group-in-india 58/166
BD F DCS’ P 2011
signiFiCanT eVenTs
Dg 2011Some of the important events during 2011 was that Olof Persson assumed position as
new CEO, the Group received new nancial targets and a new organization was adopted.
The frst quarter
Olo Persson appointed new Volvo CEO
he Board of Directors of B Volvo decided to
appoint lof Persson, 46, then President of Volvo
Construction quipment, as the new President
and Chief xecutive fcer of Volvo. lof Pers-
son assumed the position as President of B
Volvo and C of the Volvo group on Septem-
ber 1, 2011 when eif Johansson retired.
Pat Olney new CEO o Volvo CE
ffective May 1, Pat lney, 42, was appointed
new President and C of Volvo Construction
quipment. Pat lney has an extensive experi-
ence spannin 17 years in the construction
equipment industry, with 10 of these in senior
manaement roles within Volvo C. He assumed
his new position on May 7, 2011.
Annual General Meeting o AB Volvo
he nnual general Meetin of B Volvo held
on pril 6, 2011 approved the Board of Direc-
tors’ motion that a dividend of SK 2.50 per
share be paid to the company’s shareholders.
Peter Bijur, Jean-Baptiste Duzan, eif
Johansson, Hanne de Mora, nders yrén,
ouis Schweitzer, avi Venkatesan, ars West-
erber and in eh were reelected as mem-
bers of the B Volvo Board. eif Johansson was
reelected for the period extendin to uust 31,
2011, when he stepped down from his assin-
ment as President and Chief xecutive fcerof Volvo. n addition, lof Persson was elected
to the Board for the period startin on September
1, 2011, when he took ofce as President and
Chief xecutive fcer of Volvo. ouis Schweitzer
was reelected Chairman of the Board.
Jean-Baptiste Duzan, representin enault
s.a.s, Carl-lof By, representin B ndustrivärden,
Håkan Sandber, representin Svenska Han-
delsbanken, SHB Pension Fund, SHB mployee
Fund, SHB Pensionskassa and ktoonen, and
ars Förber, representin Violet Partners P,
and the Chairman of the Board were elected
members of the lection Committee. he Meet-
in resolved that no fees would be payable to
the members of the lection Committee.
he nnual general Meetin adopted a pro-
posal from enault S.. and ndustrivärden con-
cernin an addendum to B Volvo’s rticles of
ssociation that will permit voluntary conversion
of Series shares to Series B shares. he
amendment of the rticles of ssociation was
subject to approval by shareholders represent-
in at least two thirds of the votes cast and the
votin rihts represented at the Meetin.
Volvo CE invests in its North American
operations
ver the next couple of years, Volvo Construc-tion quipment plans to invest SD 100 M in its
Shippensbur, P, S manufacturin facility
and start production of wheel loaders, excava-
tors and articulated haulers in orth merica.
lso, Volvo C’s orth merican sales head-
quarters and Volvo ents will relocate from
sheville, C to Shippensbur, P by September
2012.
The second quarter
UD Trucks launches new Condor
n July, D rucks launched its new Condor
medium-duty trucks, which have underone afull model chane. he new models adopt a new
cab desin that conveys the impression of a uni-
ed family identity with the Quon heavy-duty
truck series. hey also feature various advanced
technoloies accumulated on the company’s
heavy-duty trucks to deliver outstandin fuel
economy, improved environmental and aero-
dynamic performance and safety. he new
Condor models are powered by enines tted
with a newly developed common rail system that
increases the maximum fuel injection pressure
for achievin hih levels of power and torque in
a small displacement volume.
The third quarter
New fnancial targets
n September it was announced that the Board
of Directors of B Volvo had decided to imple-
ment new nancial tarets for the Volvo group
startin in 2012. he new tarets have been
set in order to enable the rowth and protabil-
ity of the various operations to be measured
and benchmarked annually aainst relevant
competitors.
he nancial tarets for the group are as
follows:
• he annual oranic sales rowth for the truck,
bus and construction equipment operations,as well as Volvo Penta, shall be equal to or
exceed a weihted-averae for comparable
competitors.
• ach year, the operatin marin for the truck,
bus and construction equipment operations,
as well as Volvo Penta, shall be ranked amon
the top two companies when benchmarked
aainst relevant competitors.
• For Customer Finance perations, the exist-
in tarets of 12-15% return of equity ()
and an equity ratio exceedin 8% stand rm.
Volvo ero has an taret of 15–25%.
When calculatin the , Volvo ero will be
assined the same equity ratio as that for the
group’s ndustrial perations.
• he capital structure taret is set to a net
debt, includin provisions for post-employ-
ment benets, for the ndustrial perations of
a maximum of 40% of shareholders’ equity
under normal conditions.
54

7/29/2019 MBA VTU Project on VOLVO Group in India
http://slidepdf.com/reader/full/mba-vtu-project-on-volvo-group-in-india 59/166
Volvo Group restructures its truck busi-
ness and launches new organization
n ctober it was announced that the Volvo
group is to have a new oranization which better
utilizes the lobal potential of the brands and
products within the truck operations. For exam-
ple, the sales and marketin of all of the truck
companies will be oranized in three reional
oranizational units, directly under the C. n
the same manner, all product development and
production of trucks and enines will be placed
in two new central oranizational units under the
C. Production, product plannin and product
development for the non-truck business areas
will remain with their respective business area.
he new oranization was in place as of January 1,
2012.
The ourth quarterVolvo Group’s 2011 Capital Market Day
t Volvo’s Capital Market Day in Stockholm on
ovember 8, 2011 President and C lof
Persson presented the group’s new nancial
tarets that were announced on September 22,
2011, and the new oranization that applies
from the beinnin of 2012. He also emphasized
the major rowth potential he sees in the existin
businesses which, combined with hiher cost
efciency, over time ives the group the potential
to increase its operatin marin by at least 3
percentae points, thus facilitatin achievement
of the new nancial tarets.
AB Volvo evaluates the possibility o
divesting Volvo Aero
n ovember 21, 2011 it was announced that
B Volvo, as a step in further streamlinin the
Volvo group towards commercial vehicles, had
initiated a process aimed at divestin Volvo
ero.
Carl-Henric Svanberg proposed as new
Chairman o AB Volvo
n December 12, 2011 the lection Committee
of B Volvo proposed the election of Carl-Henric
Svanber as new Chairman of the Board at the
nnual general Meetin on pril 4, 2012. B
Volvo’s current Chairman ouis Schweitzer has
declined reelection.
he lection Committee also proposed the
reelection of Board members Peter Bijur,
Jean-Baptiste Duzan, Hanne de Mora, nders
yrén, avi Venkatesan, ars Westerber, in
eh and lof Persson.
Detailed information about the events is availa-
ble at www.volvoroup.com
Corporate Governance Report Volvohas issued a corporate governancereport which is separate from theannual report. The corporate governancereport is included in this document,after the annual report as such, onpages 150–159.
UDTrucksnewCo
Salesincreaseinthebusiness
VolvoAerolofPersson
VolvoCEatConExpo
Patlney
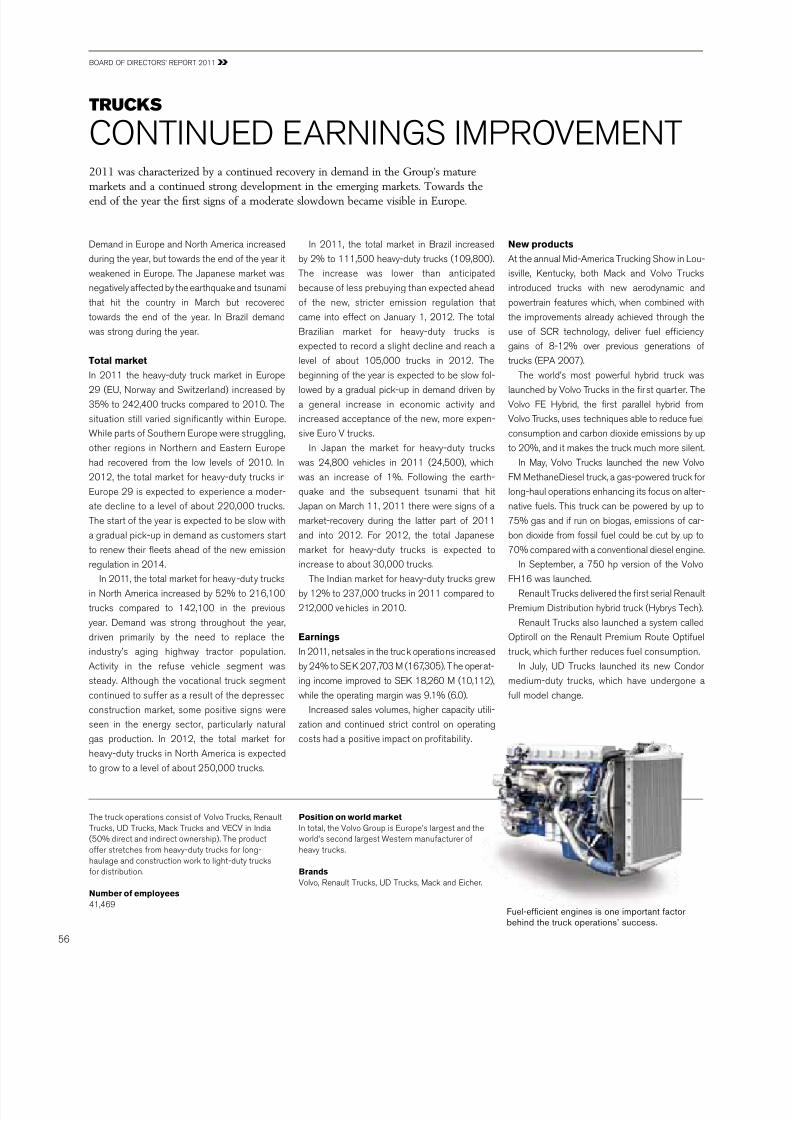
7/29/2019 MBA VTU Project on VOLVO Group in India
http://slidepdf.com/reader/full/mba-vtu-project-on-volvo-group-in-india 60/166
he truck operations consist of Volvo rucks, enaultrucks, D rucks, Mack rucks and VCV in ndia(50% direct and indirect ownership). he productoffer stretches from heavy-duty trucks for lon-haulae and construction work to liht-duty trucksfor distribution.
Number o employees
41,469
Demand in urope and orth merica increased
durin the year, but towards the end of the year it
weakened in urope. he Japanese market was
neatively affected by the earthquake and tsunami
that hit the country in March but recovered
towards the end of the year. n Brazil demand
was stron durin the year.
Total market
n 2011 the heavy-duty truck market in urope
29 (, orway and Switzerland) increased by
35% to 242,400 trucks compared to 2010. he
situation still varied sinicantly within urope.
While parts of Southern urope were strulin,
other reions in orthern and astern urope
had recovered from the low levels of 2010. n
2012, the total market for heavy-duty trucks in
urope 29 is expected to experience a moder-
ate decline to a level of about 220,000 trucks.
he start of the year is expected to be slow with
a radual pick-up in demand as customers start
to renew their eets ahead of the new emissionreulation in 2014.
n 2011, the total market for heavy-duty trucks
in orth merica increased by 52% to 216,100
trucks compared to 142,100 in the previous
year. Demand was stron throuhout the year,
driven primarily by the need to replace the
industry’s ain hihway tractor population.
ctivity in the refuse vehicle sement was
steady. lthouh the vocational truck sement
continued to suffer as a result of the depressed
construction market, some positive sins were
seen in the enery sector, particularly natural
as production. n 2012, the total market forheavy-duty trucks in orth merica is expected
to row to a level of about 250,000 trucks.
n 2011, the total market in Brazil increased
by 2% to 111,500 heavy-duty trucks (109,800).
he increase was lower than anticipated
because of less prebuyin than expected ahead
of the new, stricter emission reulation that
came into effect on January 1, 2012. he total
Brazilian market for heavy-duty trucks is
expected to record a sliht decline and reach a
level of about 105,000 trucks in 2012. he
beinnin of the year is expected to be slow fol-
lowed by a radual pick-up in demand driven by
a eneral increase in economic activity and
increased acceptance of the new, more expen-
sive uro V trucks.
n Japan the market for heavy-duty trucks
was 24,800 vehicles in 2011 (24,500), which
was an increase of 1%. Followin the earth-
quake and the subsequent tsunami that hit
Japan on March 11, 2011 there were sins of a
market-recovery durin the latter part of 2011
and into 2012. For 2012, the total Japanese
market for heavy-duty trucks is expected toincrease to about 30,000 trucks.
he ndian market for heavy-duty trucks rew
by 12% to 237,000 trucks in 2011 compared to
212,000 vehicles in 2010.
Earnings
n 2011, net sales in the truck operations increased
by 24% to SK 207,703 M (167,305). he operat-
in income improved to SK 18,260 M (10,112),
while the operatin marin was 9.1% (6.0).
ncreased sales volumes, hiher capacity utili-
zation and continued strict control on operatin
costs had a positive impact on protability.
TruCKs
CD gS MPVM2011 was characterized by a continued recovery in demand in the Group’s mature
markets and a continued strong development in the emerging markets. Towards theend of the year the rst signs of a moderate slowdown became visible in Europe.
Position on world market
n total, the Volvo group is urope’s larest and theworld’s second larest Western manufacturer ofheavy trucks.
Brands
Volvo, enault rucks, D rucks, Mack and icher.
New products
t the annual Mid-merica ruckin Show in ou-
isville, Kentucky, both Mack and Volvo rucks
introduced trucks with new aerodynamic and
powertrain features which, when combined with
the improvements already achieved throuh the
use of SC technoloy, deliver fuel efciency
ains of 8-12% over previous enerations of
trucks (P 2007).
he world’s most powerful hybrid truck was
launched by Volvo rucks in the rst quarter. he
Volvo F Hybrid, the rst parallel hybrid from
Volvo rucks, uses techniques able to reduce fuel
consumption and carbon dioxide emissions by up
to 20%, and it makes the truck much more silent.
n May, Volvo rucks launched the new Volvo
FM MethaneDiesel truck, a as-powered truck for
lon-haul operations enhancin its focus on alter-
native fuels. his truck can be powered by up to
75% as and if run on bioas, emissions of car-
bon dioxide from fossil fuel could be cut by up to
70% compared with a conventional diesel enine.n September, a 750 hp version of the Volvo
FH16 was launched.
enault rucks delivered the rst serial enault
Premium Distribution hybrid truck (Hybrys ech).
enault rucks also launched a system called
ptiroll on the enault Premium oute ptifuel
truck, which further reduces fuel consumption.
n July, D rucks launched its new Condor
medium-duty trucks, which have underone a
full model chane.
BD F DCS’ P 2011
Fuel-efcientenginesisoneimportantfactor
behindthetruckoperations’success.
56

7/29/2019 MBA VTU Project on VOLVO Group in India
http://slidepdf.com/reader/full/mba-vtu-project-on-volvo-group-in-india 61/166
inCreased
11101110
10.310.216.014.2
Volvo Renault
Market shares in Europe,heavy-duty trucks
11101110
6.87.411.48.8
Mack Volvo
Market shares in North America,heavy-duty trucks
20.122.2
UD
1110
Market shares in Japan,heavy-duty trucks
11101110
10.810.94.85.2
Volvo Renault
Market shares in Europe,medium-duty trucks
Operating income (loss)and operating margin
SEK M
%
11
18,260
9.1
10
10,112
6.0
09
(10,805)
(7.8)
08
12,167
6.0
07
15,193
8.1
64% (63)
Net sales as percentageo Volvo Group’s sales
Net sales SK bn
11
200.7
10
167.3
09
138.9
08
203.6
07
187.9
Net sales by market
SK M 2011 20
urope 85,173 69,60
orth merica 37,120 26,90
South merica 26,822 21,68sia 37,551 35,23
ther markets 14,037 13,88
Total 200,703 167,30
Deliveries by market
umber of trucks 2011 201
urope 95,113 65,50
orth merica 42,613 24,28
South merica 29,274 21,48
sia 56,165 53,83
ther markets 15,226 14,88
Total 238,391 179,98
200.7
18,260
SS MKS
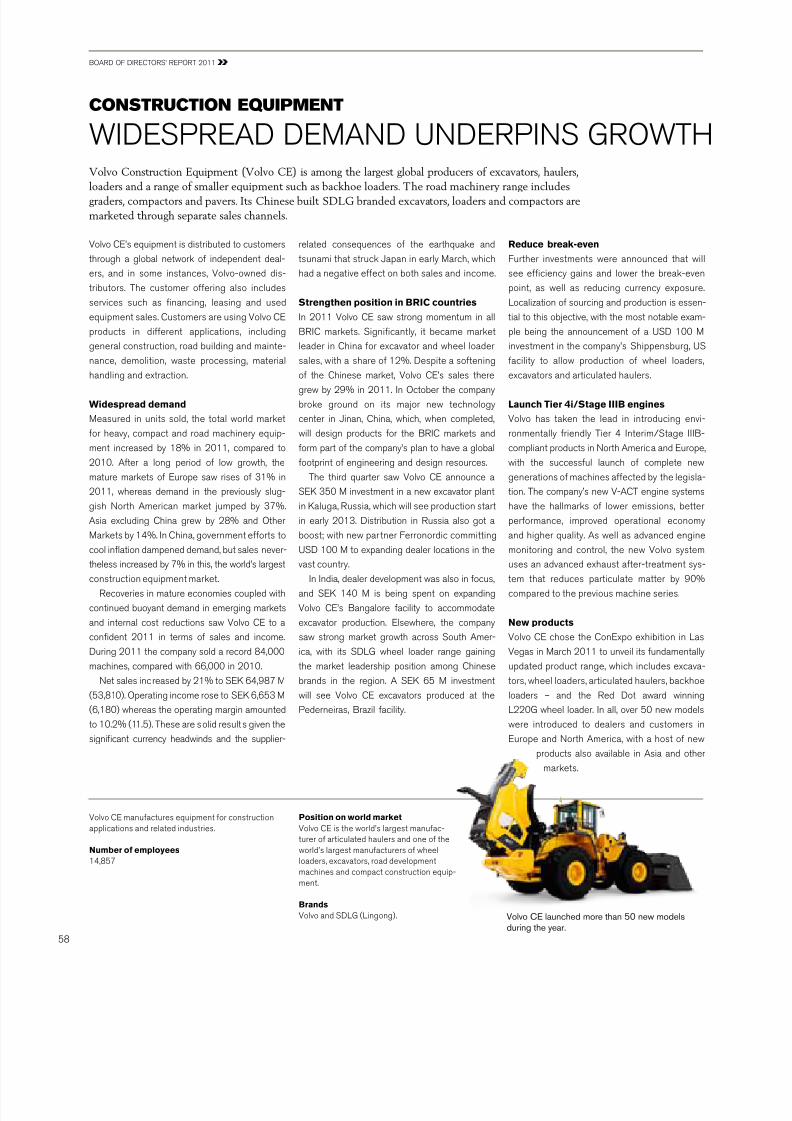
7/29/2019 MBA VTU Project on VOLVO Group in India
http://slidepdf.com/reader/full/mba-vtu-project-on-volvo-group-in-india 62/166
Volvo C’s equipment is distributed to customers
throuh a lobal network of independent deal-
ers, and in some instances, Volvo-owned dis-
tributors. he customer offerin also includes
services such as nancin, leasin and used
equipment sales. Customers are usin Volvo C
products in different applications, includin
eneral construction, road buildin and mainte-
nance, demolition, waste processin, material
handlin and extraction.
Widespread demand
Measured in units sold, the total world market
for heavy, compact and road machinery equip-
ment increased by 18% in 2011, compared to
2010. fter a lon period of low rowth, the
mature markets of urope saw rises of 31% in
2011, whereas demand in the previously slu-
ish orth merican market jumped by 37%.
sia excludin China rew by 28% and ther
Markets by 14%. n China, overnment efforts to
cool ination dampened demand, but sales never-theless increased by 7% in this, the world’s larest
construction equipment market.
ecoveries in mature economies coupled with
continued buoyant demand in emerin markets
and internal cost reductions saw Volvo C to a
condent 2011 in terms of sales and income.
Durin 2011 the company sold a record 84,000
machines, compared with 66,000 in 2010.
et sales increased by 21% to SK 64,987 M
(53,810). peratin income rose to SK 6,653 M
(6,180) whereas the operatin marin amounted
to 10.2% (11.5). hese are solid results iven the
sinicant currency headwinds and the supplier-
related consequences of the earthquake and
tsunami that struck Japan in early March, which
had a neative effect on both sales and income.
Strengthen position in BRIC countries
n 2011 Volvo C saw stron momentum in all
BC markets. Sinicantly, it became market
leader in China for excavator and wheel loader
sales, with a share of 12%. Despite a softenin
of the Chinese market, Volvo C’s sales there
rew by 29% in 2011. n ctober the company
broke round on its major new technoloy
center in Jinan, China, which, when completed,
will desin products for the BC markets and
form part of the company’s plan to have a lobal
footprint of enineerin and desin resources.
he third quarter saw Volvo C announce a
SK 350 M investment in a new excavator plant
in Kalua, ussia, which will see production start
in early 2013. Distribution in ussia also ot a
boost; with new par tner Ferronordic committin
SD 100 M to expandin dealer locations in thevast country.
n ndia, dealer development was also in focus,
and SK 140 M is bein spent on expandin
Volvo C’s Banalore facility to accommodate
excavator production. lsewhere, the company
saw stron market rowth across South mer-
ica, with its SDg wheel loader rane ainin
the market leadership position amon Chinese
brands in the reion. SK 65 M investment
will see Volvo C excavators produced at the
Pederneiras, Brazil facility.
Reduce break-even
Further investments were announced that will
see efciency ains and lower the break-even
point, as well as reducin currency exposure.
ocalization of sourcin and production is essen-
tial to this objective, with the most notable exam-
ple bein the announcement of a SD 100 M
investment in the company’s Shippensbur, S
facility to allow production of wheel loaders,
excavators and articulated haulers.
Launch Tier 4i/Stage IIIB engines
Volvo has taken the lead in introducin envi-
ronmentally friendly ier 4 nterim/Stae B-
compliant products in orth merica and urope,
with the successful launch of complete new
enerations of machines affected by the leisla-
tion. he company’s new V-C enine systems
have the hallmarks of lower emissions, better
performance, improved operational economy
and hiher quality. s well as advanced enine
monitorin and control, the new Volvo systemuses an advanced exhaust after-treatment sys-
tem that reduces particulate matter by 90%
compared to the previous machine series.
New products
Volvo C chose the Conxpo exhibition in as
Veas in March 2011 to unveil its fundamentally
updated product rane, which includes excava-
tors, wheel loaders, articulated haulers, backhoe
loaders – and the ed Dot award winnin
220g wheel loader. n all, over 50 new models
were introduced to dealers and customers in
urope and orth merica, with a host of newproducts also available in sia and other
markets.
Volvo C manufactures equipment for constructionapplications and related industries.
Number o employees
14,857
Volvo Construction Equipment (Volvo CE) is among the largest global producers of excavators, haulers,
loaders and a range of smaller equipment such as backhoe loaders. The road machinery range includesgraders, compactors and pavers. Its Chinese built SDLG branded excavators, loaders and compactors are
marketed through separate sales channels.
ConsTruCTion equipmenT
WDSPD DMD DPS gWH
VolvoCElaunchedmorethan50newmodelsduringtheyear.
Position on world market
Volvo C is the world’s larest manufac-turer of articulated haulers and one of theworld’s larest manufacturers of wheelloaders, excavators, road developmentmachines and compact construction equip-ment.
Brands
Volvo and SDg (inon).
BD F DCS’ P 2011
58

7/29/2019 MBA VTU Project on VOLVO Group in India
http://slidepdf.com/reader/full/mba-vtu-project-on-volvo-group-in-india 63/166
DVS D SBS WreCord
Net sales by market
SK M 2011 20
urope 19,052 16,13
orth merica 7,862 6,26
South merica 4,177 4,13sia 30,151 24,35
ther markets 3,745 2,92
Total 64,987 53,81
Net sales , SK bn
11
65.0
10
53.8
09
35.7
08
56.3
07
53.6
Operating income (loss)and operating margin
SEK M
%
11
6,653
10.2
10
6,180
11.5
09
(4,005)
(11.2)
08
1,808
3.2
07
4,218
7.9
21% (20)
Net sales as percentageo Volvo Group sales
6,653
65.0
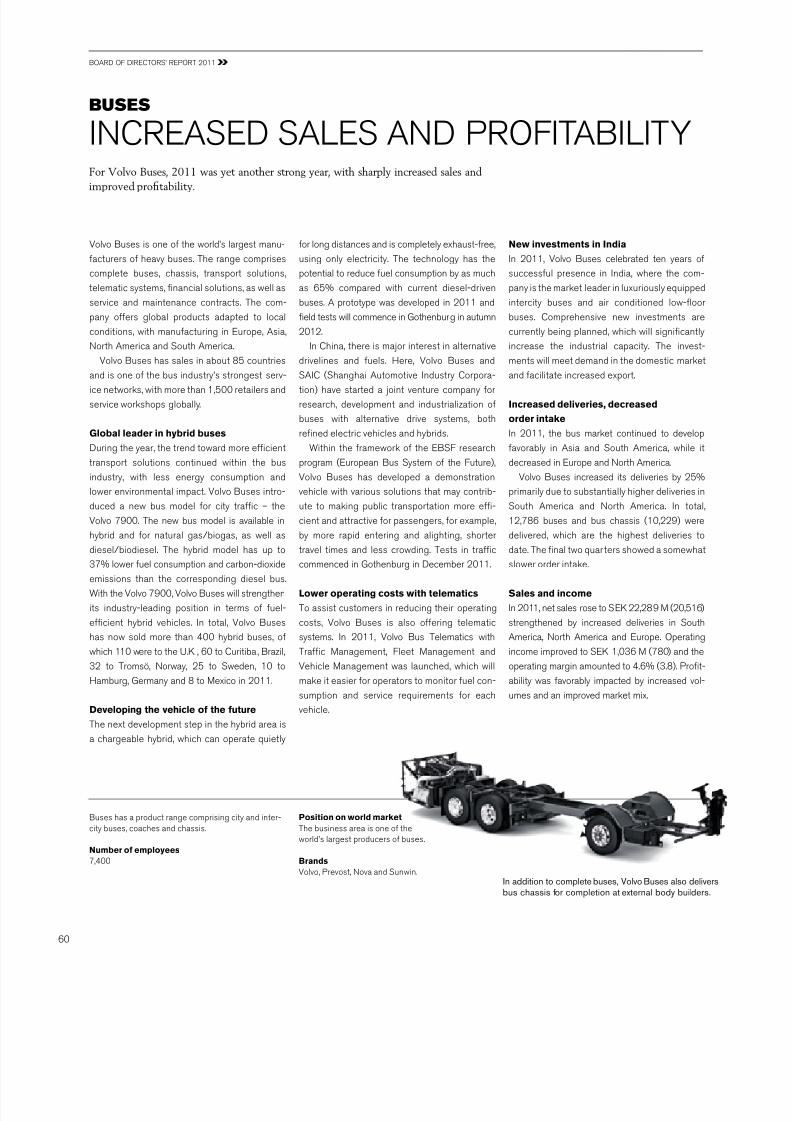
7/29/2019 MBA VTU Project on VOLVO Group in India
http://slidepdf.com/reader/full/mba-vtu-project-on-volvo-group-in-india 64/166
Volvo Buses is one of the world’s larest manu-
facturers of heavy buses. he rane comprises
complete buses, chassis, transport solutions,
telematic systems, nancial solutions, as well as
service and maintenance contracts. he com-
pany offers lobal products adapted to local
conditions, with manufacturin in urope, sia,
orth merica and South merica.
Volvo Buses has sales in about 85 countries
and is one of the bus industry’s stronest serv-
ice networks, with more than 1,500 retailers and
service workshops lobally.
Global leader in hybrid buses
Durin the year, the trend toward more efcient
transport solutions continued within the bus
industry, with less enery consumption and
lower environmental impact. Volvo Buses intro-
duced a new bus model for city trafc – the
Volvo 7900. he new bus model is available in
hybrid and for natural as/bioas, as well as
diesel/biodiesel. he hybrid model has up to37% lower fuel consumption and carbon-dioxide
emissions than the correspondin diesel bus.
With the Volvo 7900, Volvo Buses will strenthen
its industry-leadin position in terms of fuel-
efcient hybrid vehicles. n total, Volvo Buses
has now sold more than 400 hybrid buses, of
which 110 were to the .K. , 60 to Curitiba , Brazil,
32 to romsö, orway, 25 to Sweden, 10 to
Hambur, germany and 8 to Mexico in 2011.
Developing the vehicle o the uture
he next development step in the hybrid area is
a chareable hybrid, which can operate quietly
for lon distances and is completely exhaust-free,
usin only electricity. he technoloy has the
potential to reduce fuel consumption by as much
as 65% compared with current diesel-driven
buses. prototype was developed in 2011 and
eld tests will commence in gothenbur in autumn
2012.
n China, there is major interest in alternative
drivelines and fuels. Here, Volvo Buses and
SC (Shanhai utomotive ndustry Corpora-
tion) have started a joint venture company for
research, development and industrialization of
buses with alternative drive systems, both
rened electric vehicles and hybrids.
Within the framework of the BSF research
proram (uropean Bus System of the Future),
Volvo Buses has developed a demonstration
vehicle with various solutions that may contrib-
ute to makin public transportation more ef-
cient and attractive for passeners, for example,
by more rapid enterin and alihtin, shorter
travel times and less crowdin. ests in trafccommenced in gothenbur in December 2011.
Lower operating costs with telematics
o assist customers in reducin their operatin
costs, Volvo Buses is also offerin telematic
systems. n 2011, Volvo Bus elematics with
rafc Manaement, Fleet Manaement and
Vehicle Manaement was launched, which will
make it easier for operators to monitor fuel con-
sumption and service requirements for each
vehicle.
New investments in India
n 2011, Volvo Buses celebrated ten years of
successful presence in ndia, where the com-
pany is the market leader in luxuriously equipped
intercity buses and air conditioned low-oor
buses. Comprehensive new investments are
currently bein planned, which will sinicantly
increase the industrial capacity. he invest-
ments will meet demand in the domestic market
and facilitate increased export.
Increased deliveries, decreased
order intake
n 2011, the bus market continued to develop
favorably in sia and South merica, while it
decreased in urope and orth merica.
Volvo Buses increased its deliveries by 25%
primarily due to substantially hiher deliveries in
South merica and orth merica. n total,
12,786 buses and bus chassis (10,229) were
delivered, which are the hihest deliveries to
date. he nal two quar ters showed a somewhatslower order intake.
Sales and income
n 2011, net sales rose to SK 22,289 M (20,516)
strenthened by increased deliveries in South
merica, orth merica and urope. peratin
income improved to SK 1,036 M (780) and the
operatin marin amounted to 4.6% (3.8). Prot-
ability was favorably impacted by increased vol-
umes and an improved market mix.
For Volvo Buses, 2011 was yet another strong year, with sharply increased sales and
improved protability.
buses
CSD SS D PFB
Buses has a product rane comprisin city and inter-city buses, coaches and chassis.
Number o employees
7,400
Inadditiontocompletebuses,VolvoBusesalsodeliversbuschassisforcompletionatexternalbodybuilders.
Position on world market
he business area is one of theworld’s larest producers of buses.
Brands
Volvo, Prevost, ova and Sunwin.
BD F DCS’ P 2011
60

7/29/2019 MBA VTU Project on VOLVO Group in India
http://slidepdf.com/reader/full/mba-vtu-project-on-volvo-group-in-india 65/166
hybridsD
Operating income (loss)and operating margin
SEK M
%
11
1,036
4.6
10
780
3.8
09
(350)
(1.9)
08
(76)
(0.4)
07
231
1.4
7% (8)
Net sales as percentageo Volvo Group sales
Net salesSK bn
11
22.3
10
20.5
09
18.5
08
17.3
07
16.6
22.3
1,036
Deliveries by market
umber of buses 2011 20
urope 2,695 2,39
orth merica 3,014 2,09
South merica 2,620 1,1
sia 3,417 3,47
ther markets 1,040 1,09
Total 12,786 10,22
Net sales by market
SK M 2011 20
urope 7,009 6,24
orth merica 7,541 7,20
South merica 2,721 1,73sia 3,027 3,29
ther markets 1,991 2,03
Total 22,289 20,51

7/29/2019 MBA VTU Project on VOLVO Group in India
http://slidepdf.com/reader/full/mba-vtu-project-on-volvo-group-in-india 66/166
n the commercial shippin area, Volvo Penta
delivers diesel enines for the touhest-possible
operatin conditions. Coast uards, ferry com-
panies, port authorities and shipyards all over
the world use Volvo Penta’s reliable enines for
towin, passener transports, patrollin and sea
rescue.
n the leisure boat industry, Volvo Penta
develops and delivers complete drive systems to
world-leadin boat builders such as Fairline,
Sunseeker and Princess in the K, Jeanneau/
Beneteau in France, Chaparral in the S and
Schaefer achts in Brazil.
Volvo Penta’s innovative technoloical solu-
tions for boats create competitiveness and cus-
tomer benets in the form of lower fuel con-
sumption, easier manoeuverin and shorter
installation times. hrouh partnerships in the
communication and naviation area, and by fully
interated drive systems, Volvo Penta offers
boat drivin environments with a stron focus on
comfort and user-friendliness.Volvo Penta’s customers have access to the
marine industry’s most lobal service and dealer
network with about 4,000 dealers worldwide.
n the industrial enine area, Volvo Penta
delivers diesel enines to world-leadin customers
such as Carotech in Finland, Sany in China,
Kohler in the S and Sandvik in Sweden. With
their unique performance, operational and environ-
mental features, Volvo Penta’s industrial enines
create stron competitiveness for this type of
lobal customers, and by utilizin the breadth
and strenth of the Volvo group’s combined
service offerin, Volvo Penta can also offer ef-cient support in the form of lobal service and
aftermarket services.
Volvo Penta contributes substantial syneries
and economies of scale to the group’s total die-
sel enine manufacturin. bout one-fth of
volumes in the diesel enine plant in Skövde
comprise enines delivered by Volvo Penta.
More than half of the group’s total volumes of
16-liter enines are delivered to Volvo Penta’s
customers.
Total market
he total market for industrial enines was
stron durin the rst half of the year, but
demand in urope and orth merica weak-
ened toward year-end due to the debt crisis and
lobal nancial turmoil. Stable demand was
noted in China and many other countries in sia
and South merica.
he total market for marine enines remained
larely unchaned compared with the weak
trend durin recent years. uropean boat sales
were adversely impacted by bailout packaes
and austerity measures in Southern urope,particularly in taly and Spain. Domestic boat
sales in taly, which is traditionally Volvo Penta’s
larest marine market in urope, are estimated
to have decreased about 70% over ve years .
n orth merica, boat sales were consistently
at historically low levels and as a result, total
demand for both marine asoline and diesel
enines remained very low in the S.
Product renewal
With an aressive focus on product develop-
ment and product renewal, Volvo Penta has cre-
ated a modern and hihly competitive productrane for industrial enines in recent years. he
Volvo group’s proven SC technoloy enables
the industrial enine rane to meet future emis-
sions reulations, while Volvo Penta can also
offer its customers sinicant installation ben-
ets and favorable operatin economy.
n the marine side, Volvo Penta launched
D6-400 in 2011 – the world’s most powerful
diesel sterndrive. his 400-hp power packae
conrms Volvo Penta’s world-leadin position in
the diesel sterndrive sement.
Earnings trend
Sales amounted to SK 8,859 M compared with
SK 8,716 M in the precedin year. peratin
income was SK 781 M compared with SK
578 M in the precedin year. he operatin mar-
in was 8.8% (6.6). arnins were positively
impacted by increased sales, effective cost con-
trol and a favorable product mix.
Production and investments
n 2011, Volvo Penta completed the launch of a
new loistics system that enables efciencyenhancements across the entire chain – from
order to delivery.
n recent years, Volvo Penta’s enine plant in
Vara, Sweden has worked systematically to reduce
its environmental impact and enery costs. he
plant has accepted B Volvo’s challene to all
plants within the group to become enery-
efcient and phase out fossil fuels. Due to these
efforts, all manufacturin in the Vara plant was
carbon neutral from 2011.
Volvo Penta offers complete drive systems for leisure boats and professional boats,
and for industrial applications such as power generation, cranes, pumps and container trucks.
VolVo penTa
MPVD PFB
Volvo Penta provides enines and power systems forleisure and commercial craft, as well as for industrialapplications such as power eneration and containertrucks.
Number o employees
1,338
VolvoPentaoffersboatdrivingenvironmentswithfocusoncomfortanduser-friendliness.
Position on world market
Volvo Penta is the world’s larest producer of dieselenines for leisure boats and a leadin, independentproducer of industrial enines.
BD F DCS’ P 2011
62

7/29/2019 MBA VTU Project on VOLVO Group in India
http://slidepdf.com/reader/full/mba-vtu-project-on-volvo-group-in-india 67/166
Operating income (loss)and operating margin
SEK M
%
11
781
8.8
10
578
6.6
09
(230)
(2.8)
08
928
8.1
07
1,173
10.0
3% (3)
Net sales as percentageo Volvo Group sales
Net sales, SK bn
11
8.9
10
8.7
09
8.2
08
11.5
07
11.7
Net sales by market
SK M 2011 20
urope 4,546 4,50
orth merica 1,386 1,50
South merica 342 33sia 2,245 2,00
ther markets 340 36
Total 8,859 8,71
Engine volumes
o. of units 2011 20
Marine enines1 20,074 22,18
ndustrial enines 21,137 20,29
Total 41,211 42,48
1 xcludin outboard enines.
8.9
781
earningsgoodDSP WK MK

7/29/2019 MBA VTU Project on VOLVO Group in India
http://slidepdf.com/reader/full/mba-vtu-project-on-volvo-group-in-india 68/166
Since the 1980s, Volvo ero’s civil operations
have rown steadily in terms of sales and si-
nicance, while the company’s military opera-
tions have decreased in a correspondin fash-
ion to the present ure of about 5% of sales.
Since Volvo ero has an independent role,
the company can sin areements with all major
manufacturers in the aircraft enine industry. s
a result, Volvo ero’s enine components are
now found in more than 90% of all new lare
civil aircraft.
Volvo ero can now also claim the role as a
desiner of new enine components. he com-
pany has assumed a leadin role in the eld of
liht-weiht structures, which is now ainin
sinicance in the industry since less weiht
leads to lower fuel consumption and, in turn,
lower emissions from aircraft – two vital issues
for the airline industry.
key component in the liht-weiht venture
is the composite company CB, which Volvo
ero acquired in 2007. Durin the year, CBsecured a strateic contract with Korean ir
concernin future collaboration in the areas of
radomes, win structures and other composite
components.
he continued success of Volvo ero’s focus
on hih quality is conrmed by the fact that, in
2011, the sinle-enine military aircraft gripen,
with a Volvo M12 enine, exceeded 160,000
hours of operation with no enine-related
breakdowns or serious incidents. his is unique
for all air forces worldwide.
Total market
ccordin to the airline industry’s international
trade oranization, , passener trafc
increased 5.9% in 2011 while air-freiht declined
0.7%, compared with the precedin year.
irbus and Boein reported 2,529 new orders
durin the year, nearly a two-fold increase com-
pared with the precedin year (1,269). he order
book for lare civilian aircraft rose from 6,995
aircraft at the end of 2010 to 8,208 at the end
of 2011. he aircraft manufacturers delivered
1,011 aircraft in 2011, a 4% increase compared
with the precedin year.
Product renewal
n areement sined with aeroenine manu-
facturer Pratt & Whitney in June makes Volvo
ero a proram par tner in the PW1100g enine,
which is built with eared turbofan technoloy.
he enine will power the 320neo aircraft
and has been listed by M Maazine as one of
the 50 best inventions of 2011. he PW1100genine was the most sinicant development in
the aerospace industry durin the year.
Boein’s new 787 aircraft, Dreamliner, com-
menced operation in 2011, as well as Boein’s
modernized version of the 747 (747-8). Both a ir-
craft are offered with a gnx enine, in which
Volvo ero is a proram par tner.
Development of the olls-oyce enine,
rent XWB, for the 350 XWB irbus aircraft
continues as planned and several major milestones
were passed durin the year. Volvo ero is
a proram partner in the enine.
Earnings trend
Sales totaled SK 6,509 M compared with SK
7,708 M in the precedin year. perat in income
was SK 336 M compared with SK 286 M in
the precedin year. he operatin marin was
5.2% (3.7).
n March 31, Volvo ero acquired all of Pratt
& Whitney’s shares in Volvo ero orway and
thus became the company’s sole shareholder.
n ovember 21, B Volvo announced – as
part of its efforts to further rene the group’s
focus on heavy commercial vehicles – that it had
initiated a process to divest Volvo ero.
Production and investments
n just a few short years, Volvo ero’s orth
merican subsidiary, VC, outside Hartford in
Connecticut in the S, has established itself as
one of the market’s leadin players in the eld of
fan cases for lare aircraft enines. he most
recent example is a fan case for the gP7000
enine in the irbus 380. he company alreadymanufactures fan cases for the rent 900 for
the same aircraft. Similarly, VC has sined a
contract for manufacturin both of the enine
options offered with the new Boein 787: the
olls-oyce rent 1000, and gnx 1B. Volvo
ero has also sined a contract concernin the
manufacture of gnx 2B fan cases for the new
Boein 747-8. ther assinments include the
g90 for the Boein 777 and V2500 for the
irbus 320.
Volvo Aero develops and manufactures advanced components for rocket engines, and civil and military
aircraft engines. The company also carries out maintenance and repair on aircraft engines and stationarygas turbines.
VolVo aero
MPVD PFB
Volvo ero offers advanced components for aircraftenines and space applications, with a focus on liht-weiht technoloy for reduced fuel consumption.Services for the aerospace industry and for stationaryas turbines are also offered.
Number o employees
2,904
Position on world market
Volvo ero holds a leadin posi-tion as an independent producer,with enine components in over90% of all new, lare commercial air-craft delivered in 2011.
BD F DCS’ P 2011
64
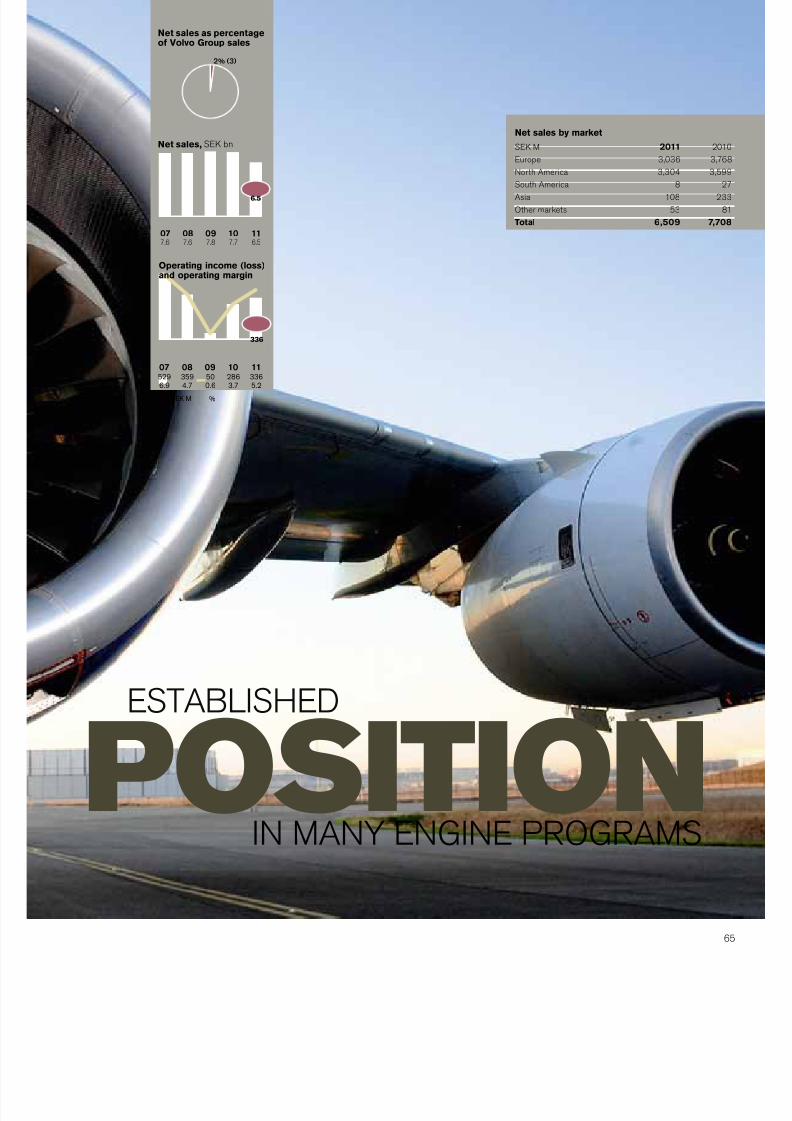
7/29/2019 MBA VTU Project on VOLVO Group in India
http://slidepdf.com/reader/full/mba-vtu-project-on-volvo-group-in-india 69/166
posiTionSBSHD
Net sales, SK bn
11
6.5
10
7.7
09
7.8
08
7.6
07
7.6
Operating income (loss)and operating margin
11336
5.2
10286
3.7
0950
0.6
08359
4.7
07529
6.9
SEK M %
2% (3)
Net sales as percentageo Volvo Group sales
Net sales by market
SK M 2011 20
urope 3,036 3,76
orth merica 3,304 3,59
South merica 8 2sia 108 23
ther markets 53 8
Total 6,509 7,70
M g PgMS
6.5
336

7/29/2019 MBA VTU Project on VOLVO Group in India
http://slidepdf.com/reader/full/mba-vtu-project-on-volvo-group-in-india 70/166
By developin lon-term relationships with cus-
tomers and dealers, VFS seeks to establish a
number one market position for the nancin of
Volvo group products where we operate.
When customers choose a vehicle or equipment
supplier, the offer of supplementary services is
an important factor. Customers desire solutions
that can enable them to work more efciently
while maximizin protability and reliability. VFS
creates value for Volvo group customers by pro-
vidin solutions includin nancin, leasin and
insurance. hese services are of increasin impor-
tance to the Volvo group’s total offer.
Portolio improvements
lthouh lobal economies and nancial markets
continued to be characterized by uncertainty and
volatility durin 2011, the VFS portfolio showed
stron improvements in customer repayment
patterns as evidenced by continued reductions
in customer delinquencies, defaults and repos-
sessions. Durin this period, VFS also success-fully reduced inventories of repossessed units
as used truck and equipment demand increased.
educed credit losses have primarily contributed
to VFS’ increased protability durin the year.
Volvo group unit deliveries strenthened and
nancin market shares remained stable durin
2011. s a result, VFS returned to rowth with a
disciplined approach to balancin new business
development with risk and cost control.
Market development
VFS continues to strenthen and standardize its
operations in ways that increase efciency,
execution and speed to market. his approach
has prepared VFS to capitalize on protable
rowth opportunities with stable, efcient and
scalable business platforms.
n the mature markets of orth merica and
urope, VFS continues to improve operational
leverae and optimize results with standard
technoloies, solutions and shared services. n
developin markets such as China, ussia and
Brazil, VFS continues to make investments in
prudent rowth with a focus on strenthenin
local operations and maintainin a disciplined
risk manaement structure. Downturn prepara-
tion and readiness are always in focus for such
markets reardless of the current business envi-
ronment. n ndia, VFS serves the market with a
branded private label alliance in support of Volvo
group unit sales.
Customer fnance operations
otal new nancin volume in 2011 amounted to
SK 44.8 billion (35.1). djusted for chanes inexchane rates, new business volume increased
by 35% compared to 2010 as a result of increased
sales volumes of the Volvo group products and
stable penetration levels. n total, 49,757 new
Volvo vehicles and machines (34,522) were
nanced durin the year. n the markets where
nancin is offered, the averae penetration
rate was 25% (25).
s of December 31, 2011, the credit portfolio
was SK 95,544 M (84,550). Durin 2011 the
credit portfolio increased by 13.8% (decrease:
4.4), adjusted for exchane-rate movements.
he fundin of the credit portfolio is matched in
terms of maturity, interest rates and currencies
in accordance with Volvo group policy. For fur-
ther information see note 4.
he operatin income for the year amounted
to SK 942 M compared to SK 167 M in the
previous year. eturn on shareholders’ equity
was 7.3% (0.4). he equity ratio at the end of the
year was 9.1% (9.0). he improvement in prot-
ability is driven mainly by lower credit provisions
and hiher earnin assets. Durin the year,
credit provision expenses amounted to SK
682 M (1,438) while write-offs of SK 804 M
(1,460) were recorded. he write-off ratio for
2011 was 0.93% (1.65). t the end of December
31, 2011, credit reserves were 1.33% (1.69%) of
the credit portfolio.
s a consequence of the stron volume
rowth in Brazil, VFS executed on its second
lare portfolio syndication in the second quarter
of 2011. his transaction of approximately SK
4 billion of the Brazilian credit portfolio served
as an important risk mitiation measure andsuccessfully freed up capital for reinvestment in
the country. he transaction enerated a posi-
tive impact on operatin income of SK 45 M.
Volvo Financial Services (VFS) supports the Volvo Group product range with nancial services by delivering
integrated, competitive nancial solutions that meet customer and dealer needs.
VolVo FinanCial serViCes
CSD PFB D gWH
Conducts operations in customer and dealer nancin.
Number o employees
1,323
Position on world market
Volvo Financial Services operates exclusively to sup-port the sales and leasin of vehicles and machineswhich are produced by the other business areas,enhancin their competitiveness.
BD F DCS’ P 2011
66

7/29/2019 MBA VTU Project on VOLVO Group in India
http://slidepdf.com/reader/full/mba-vtu-project-on-volvo-group-in-india 71/166
imporTanT
Operating income (loss)SEM
11
94210
16709
(680)08
1,39707
1,649
3% (3)
Net sales as percentageo Volvo Group sales
Penetration rate1, %
2729
Volvo
Trucks
Renault
Trucks
Mack
Trucks
Buses Volvo
CE
U
Truc
1917 2020 1511 3535 12
10 11
1 Share of unit sales nanced by Volvo Financial Ser vices in relationtotal number units sold by the Volvo group in markets where nanservices are offered.
Distribution o creditportolio
Volvo Trucks 44%
Volvo CE 27%
Renault Trucks 12%
Mack Trucks 8%
Buses 5%
UD Trucks 3%
Other 1%
942
P F H S
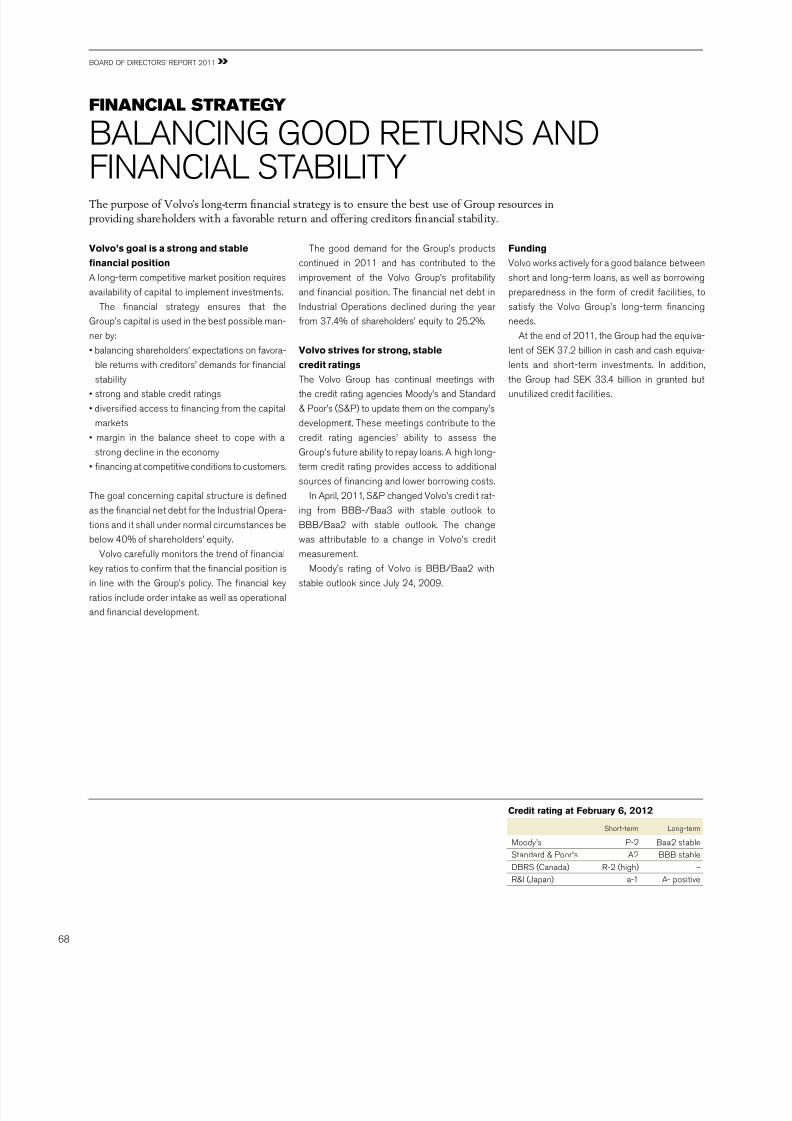
7/29/2019 MBA VTU Project on VOLVO Group in India
http://slidepdf.com/reader/full/mba-vtu-project-on-volvo-group-in-india 72/166
Volvo’s goal is a strong and stable
fnancial position
lon-term competitive market position requires
availability of capital to implement investments.
he nancial stratey ensures that the
group’s capital is used in the best possible man-
ner by:
• balancin shareholders’ expectations on favora-
ble returns with creditors’ demands for nancialstability
• stron and stable credit ratins
• diversied access to nancin from the capital
markets
• marin in the balance sheet to cope with a
stron decline in the economy
• nancin at competitive conditions to customers.
he oal concernin capital structure is dened
as the nancial net debt for the ndustrial pera-
tions and it shall under normal circumstances be
below 40% of shareholders’ equity.
Volvo carefully monitors the trend of nancialkey ratios to conrm that the nancial position is
in line with the group’s policy. he nancial key
ratios include order intake as well as operational
and nancial development.
he ood demand for the group’s products
continued in 2011 and has contributed to the
improvement of the Volvo group’s protability
and nancial position. he nancial net debt in
ndustrial perations declined durin the year
from 37.4% of shareholders’ equity to 25.2%.
Volvo strives or strong, stable
credit ratingshe Volvo group has continual meetins with
the credit ratin aencies Moody’s and Standard
& Poor’s (S&P) to update them on the company’s
development. hese meetins contribute to the
credit ratin aencies’ ability to assess the
group’s future ability to repay loans. hih lon-
term credit ratin provides access to additional
sources of nancin and lower borrowin costs.
n pril, 2011, S&P chaned Volvo’s credi t rat-
in from BBB-/Baa3 with stable outlook to
BBB/Baa2 with stable outlook. he chane
was attributable to a chane in Volvo’s credit
measurement.Moody’s ratin of Volvo is BBB/Baa2 with
stable outlook since July 24, 2009.
Funding
Volvo works actively for a ood balance between
short and lon-term loans, as well as borrowin
preparedness in the form of credit facilities, to
satisfy the Volvo group’s lon-term nancin
needs.
t the end of 2011, the group had the equiva-
lent of SK 37.2 billion in cash and cash equiva-
lents and short-term investments. n addition,the group had SK 33.4 billion in ranted but
unutilized credit facilities.
The purpose of Volvo’s long-term nancial strategy is to ensure the best use of Group resources in
providing shareholders with a favorable return and offer ing creditors nancial stabil ity.
Credit rating at February 6, 2012
Short-term on-term
Moody’s P-2 Baa2 stable
Standard & Poor's 2 BBB stable
DBS (Canada) -2 (hih) –
& (Japan) a-1 - positive
FinanCial sTraTegy
BCg gD S D
FC SB
BD F DCS’ P 2011
68
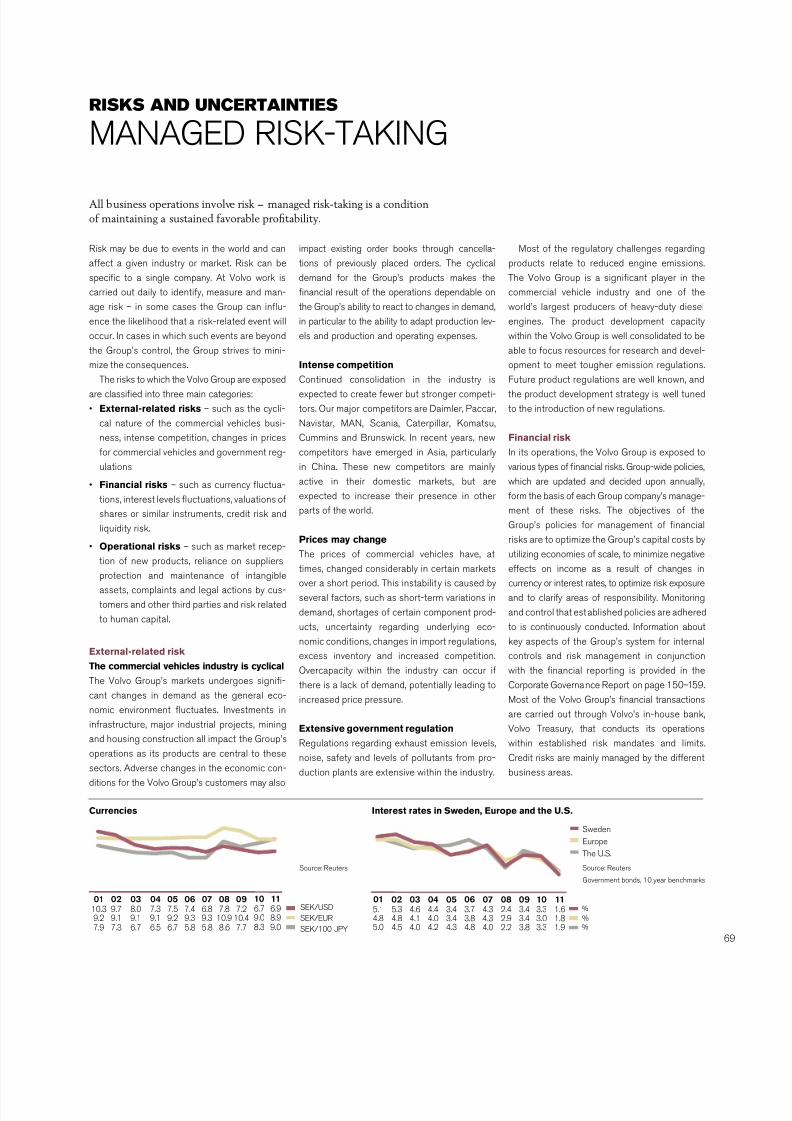
7/29/2019 MBA VTU Project on VOLVO Group in India
http://slidepdf.com/reader/full/mba-vtu-project-on-volvo-group-in-india 73/166
isk may be due to events in the world and can
affect a iven industry or market. isk can be
specic to a sinle company. t Volvo work is
carried out daily to identify, measure and man-
ae risk – in some cases the group can inu-
ence the likelihood that a risk-related event will
occur. n cases in which such events are beyond
the group’s control, the group strives to mini-
mize the consequences.he risks to which the Volvo group are exposed
are classied into three main cateories:
• External-related risks – such as the cycli-
cal nature of the commercial vehicles busi-
ness, intense competition, chanes in prices
for commercial vehicles and overnment re-
ulations
• Financial risks – such as currency uctua-
tions, interest levels uctuations, valuations of
shares or similar instruments, credit risk and
liquidity risk.
• Operational risks – such as market recep-
tion of new products, reliance on suppliers,
protection and maintenance of intanible
assets, complaints and leal actions by cus-
tomers and other third parties and risk related
to human capital.
External-related risk
The commercial vehicles industry is cyclical
he Volvo group’s markets underoes sini-
cant chanes in demand as the eneral eco-
nomic environment uctuates. nvestments in
infrastructure, major industrial projects, minin
and housin construction all impact the group’soperations as its products are central to these
sectors. dverse chanes in the economic con-
ditions for the Volvo group’s customers may also
impact existin order books throuh cancella-
tions of previously placed orders. he cyclical
demand for the group’s products makes the
nancial result of the operations dependable on
the group’s ability to react to chanes in demand,
in particular to the ability to adapt production lev-
els and production and operatin expenses.
Intense competitionContinued consolidation in the industry is
expected to create fewer but stroner competi-
tors. ur major competitors are Daimler, Paccar,
avistar, M, Scania, Caterpillar, Komatsu,
Cummins and Brunswick. n recent years, new
competitors have emered in sia, particularly
in China. hese new competitors are mainly
active in their domestic markets, but are
expected to increase their presence in other
parts of the world.
Prices may change
he prices of commercial vehicles have, attimes, chaned considerably in certain markets
over a short period. his instabilit y is caused by
several factors, such as short-term variations in
demand, shortaes of certain component prod-
ucts, uncertainty reardin underlyin eco-
nomic conditions, chanes in import reulations,
excess inventory and increased competition.
vercapacity within the industry can occur if
there is a lack of demand, potentially leadin to
increased price pressure.
Extensive government regulation
eulations reardin exhaust emission levels,
noise, safety and levels of pollutants from pro-
duction plants are extensive within the industry.
Most of the reulatory challenes reardin
products relate to reduced enine emissions.
he Volvo group is a sinicant player in the
commercial vehicle industry and one of the
world’s larest producers of heavy-duty diesel
enines. he product development capacity
within the Volvo group is well consolidated to be
able to focus resources for research and devel-
opment to meet touher emission reulations.Future product reulations are well known, and
the product development stratey is well tuned
to the introduction of new reulations.
Financial risk
n its operations, the Volvo group is exposed to
various types of nancial risks. group-wide policies,
which are updated and decided upon annually,
form the basis of each group company’s manae-
ment of these risks. he objectives of the
group’s policies for manaement of nancial
risks are to optimize the group’s capital costs by
utilizin economies of scale, to minimize neativeeffects on income as a result of chanes in
currency or interest rates, to optimize risk exposure
and to clarify areas of responsibility. Monitorin
and control that established policies are adhered
to is continuously conducted. nformation about
key aspects of the group’s system for internal
controls and risk manaement in conjunction
with the nancial reportin is provided in the
Corporate governance eport on pae 150–159.
Most of the Volvo group’s nancial transactions
are carried out throuh Volvo’s in-house bank,
Volvo reasury, that conducts its operations
within established risk mandates and limits.
Credit risks are mainly manaed by the different
business areas.
All business operations involve risk – managed risk-taking is a condition
of maintaining a sustained favorable protability.
risKs and unCerTainTies
MgD SK-Kg
Currencies Interest rates in Sweden, Europe and the U.S.
09
7.2
10.4
04
7.3
9.1
05
7.5
9.2
06
7.4
9.3
07
6.8
9.3
08
7.8
10.9
03
8.0
9.1
02
9.7
9.1
01
10.3
9.2
SEK/USD
SEK/EUR
SEK/100 JPY7.76 .5 6 .7 5 .8 5 .8 8 .66.77.37.9
Source: Reuters
10
6.7
9.0
8.3
11
6.9
8.9
9.0
Sweden
Europe
The U.S.
07
4.3
4.3
4.0
08
2.4
2.9
2.2
09
3.4
3.4
3.8
02
5.3
4.8
4.5
03
4.6
4.1
4.0
04
4.4
4.0
4.2
05
3.4
3.4
4.3
06
3.7
3.8
4.8
01
5.1
4.8
5.0
Source: Reuters
Government bonds, 10 year benchmarks
10
3.3
3.0
3.3
%
%%
11
1.6
1.8
1.9

7/29/2019 MBA VTU Project on VOLVO Group in India
http://slidepdf.com/reader/full/mba-vtu-project-on-volvo-group-in-india 74/166
BD F DCS’ P 2011
he nature of the various nancial risks and
objectives and the policies for the manaement
of these risks are described in detail in notes 4
and 30. Various aspects of nancial risk are
described briey in the followin pararaphs.Volvo’s accountin policies for nancial instru-
ments are described in note 30. he overall impact
on a company’s competitiveness is also affected
however by how various macro-economic factors
interact.
Interest-related risk
nterest-related risk includes risks that chanes
in interest rates will impact the group’s income
and cash ow (cash-ow risks) or the fair value
of nancial assets and liabilities (price risks).
Currency-related risk
More than 90% of the net sales of the Volvo
group are enerated in countries other than
Sweden. Chanes in exchane rates have a
direct impact on the Volvo group’s operatin
income, balance sheet and cash ow, as well as
an indirect impact on Volvo’s competitiveness,
which over time affects the group’s earnins.
Credit-related risk
n important part of the group’s credit risk is
related to how the nancial assets of the group
have been placed. he majority are placed in
interest-bearin bonds issued by Swedish real
estate nancin institutions.
Liquidity risk
Volvo ensures its nancial preparedness by
always maintainin a certain por tion of revenues
in liquid assets.
Market risk rom investments in shares or
similar instruments
he Volvo group is indirectly exposed to market
risks from shares and other similar instruments,
as a result of manaed capital transferred toindependent pension plans bein partly invested
in instruments of these types.
Operational risk
The proftability depends on successul
new products
he Volvo group’s lon-term protability depends
on the Company’s ability to successfully launch
and market its new products. Product life cycles
continue to shorten, puttin increased focus on
the success of the group’s product development.
Reliance on suppliers
Volvo purchases raw materials, parts and com-
ponents from numerous external suppliers.
sinicant part of the group’s requirements
for raw materials and supplies is lled by sinle-source suppliers. he effects of delivery inter-
ruptions vary dependin on the item or compo-
nent. Certain items and components are standard
throuhout the industry, whereas others are
internally developed and require unique tools
that are time-consumin to replace.
he Volvo group’s costs for raw materials and
components can vary sinicantly over a busi-
ness cycle. Cost variations may be caused by
chanes in world market prices for raw materials
or by an inability of our suppliers to deliver.
Intangible assets
B Volvo owns or otherwise has rihts to pat-
ents and brands that refer to the products the
Company manufactures and markets. hese have
been acquired over a number of years and are
valuable to the operations of the Volvo group.
Volvo does not consider that any of the group’s
operations are heavily dependent on any sinle
patent or roup of patents.
hrouh Volvo rademark Holdin B, B
Volvo and Volvo Car Corporation jointly own the
Volvo brand. B Volvo has the exclusive riht to
use the Volvo name and trademark for its prod-
ucts and services. Similarly, Volvo Car Corpora-
tion has the exclusive riht to use the Volvo name
and trademark for its products and services.
he Volvo group’s rihts to use the enault
brand are restricted to the truck operations only
and are reulated by a license from enault
s.a.s. , which owns the enault brand.
Complaints and legal actions
he Volvo group could be the taret of com-
plaints and leal actions initiated by customers,
employees and other third parties allein
health, environmental, safety or business relatedissues, or failure to comply with applicable leis-
lation and reulations. nformation about leal
proceedins involvin entities within the Volvo
group are found in note 24 Continent iabilities .
ven if such disputes are resolved successfully,
without havin adverse nancial consequences,
they could neatively impact the group’s reputa-
tion and take up resources that could be used
for other purposes.
Risk related to human capital
decisive factor for the realization of the Volvo
group’s vision is our employees and their
knowlede and competence. Future development
depends on the company’s ability to maintain its
position as an attractive employer. o this end,
the Volvo group strives for a work environment in
which enery, passion and respect for the indi-vidual are uidin principles. very year a group-
wide survey is conducted, and accordin to the
survey the share of satised employees has
been on a hih level in recent years.
Short-term risk actors
n increase in demand could potentially result in
delivery disturbances due to suppliers’ nancial
instability or shortae of resources.
ncertainty reardin customers’ access to
the nancin of products in emerin markets
miht have a neative impact on demand.
Volvo veries annually, or more frequently ifnecessary, the oodwill value of its business
areas and other intanible assets for possible
impairment. he size of the overvalue differs
between the business areas and they are, to a
varyin deree, sensitive to chanes in the busi-
ness environment. nstability in the business
recovery and volatility in interest and currency
rates may lead to indications of impairment.
he reported amounts for continent liabili-
ties reect a part of Volvo’s risk exposure, see
note 24 for continent liabilities.
Contractual conditions related to take
over bids
Some of B Volvo’s lon term loan areements
contain conditions stipulatin the riht for a bond-
holder to request repayment in advance under
certain conditions followin a chane of the con-
trol of the company. n Volvo’s opinion it has been
necessary to accept those conditions in order to
receive nancin on otherwise acceptable terms.
Provisions stipulatin that an areement can be
chaned or terminated if the control of the com-
pany is chaned are also included in some of the
areements whereby enault rucks’ has beeniven the riht to sell enault s.a.s.’ and issan
Motor Co. td’s liht-duty trucks as well as in
some of the group’s purchasin areements.
Further information
ote 27 Personnel contains information concern-in rules on severance payments applicable forthe group xecutive eam and certain other sen-ior executives.
ote 4 and 30 contain information reardinnancial risks as well as oals and policies innancial risk manaement.
Further risk information is provided in note 24.
70

7/29/2019 MBA VTU Project on VOLVO Group in India
http://slidepdf.com/reader/full/mba-vtu-project-on-volvo-group-in-india 75/166
C
Faa Fa 2011
page
Financial perormance 72
Financial position 76
Cash-fow statement 78
Changes in consolidatedShareholders’ equity
80
otes to consolidatednancial statements
81
Parent Company AB Volvo 126
Proposed remunerationpolicy
138
Proposed disposition ounappropriated earnings
139
Audit report or AB Volvo 140
leven-year summary 141
ote he Volvo Group page
1 accounting principles 81
2 Key sources of estimtion uncertinty 83
3 acquisitions nd divestments of shresin susidiries
84
4 Gols nd policies in nncil risk mngement
86
5 Shres nd prticiptions 91
6 Segment reporting 94
7 ncome 96
8 ther operting income nd expenses 97
9 ther nncil income nd expenses 97
10 ncome txes 98
11 inority interests 99
12 ntngile ssets 100
13 ngile ssets 102
14 esing 104
15 ustomer-nncing receivles 105
16 eceivles 106
17 nventories 107
18 rketle securities nd liquid funds 108
19 Shreholders’ equity 108
20 Provisions for post-employmentenets
109
21 ther provisions 113
22 iilities 115
23 assets pledged 116
24 ontingent liilities 116
25 rnsctions with relted prties 117
26 Government grnts 118
27 Personnel 118
28 Fees to the uditors 121
29 sh-ow 12130 Finncil instruments 122
ote Parent Company page
1 accounting principles 130
2 ntr-Group trnsctions 130
3 administrtive expenses 130
4 ther operting income ndexpenses
131
5 ncome from investments in Groupcompnies
131
6 ncome from investments inssocited compnies
131
7 ncome from other investments 131
8 nterest income nd expenses 131
9 ther nncil income ndexpenses
131
10 alloctions 131
11 ncome txes 132
12 ntngile nd tngile ssets 132
13 nvestments in shres ndprticiptions
133
14 ther current receivles 133
15 Untxed reserves 133
16 Provisions for pensions 134
17 ther provisions 134
18 on-current liilities 134
19 ther current liilities 134
20 ontingent liilities 134
21 sh-ow 134
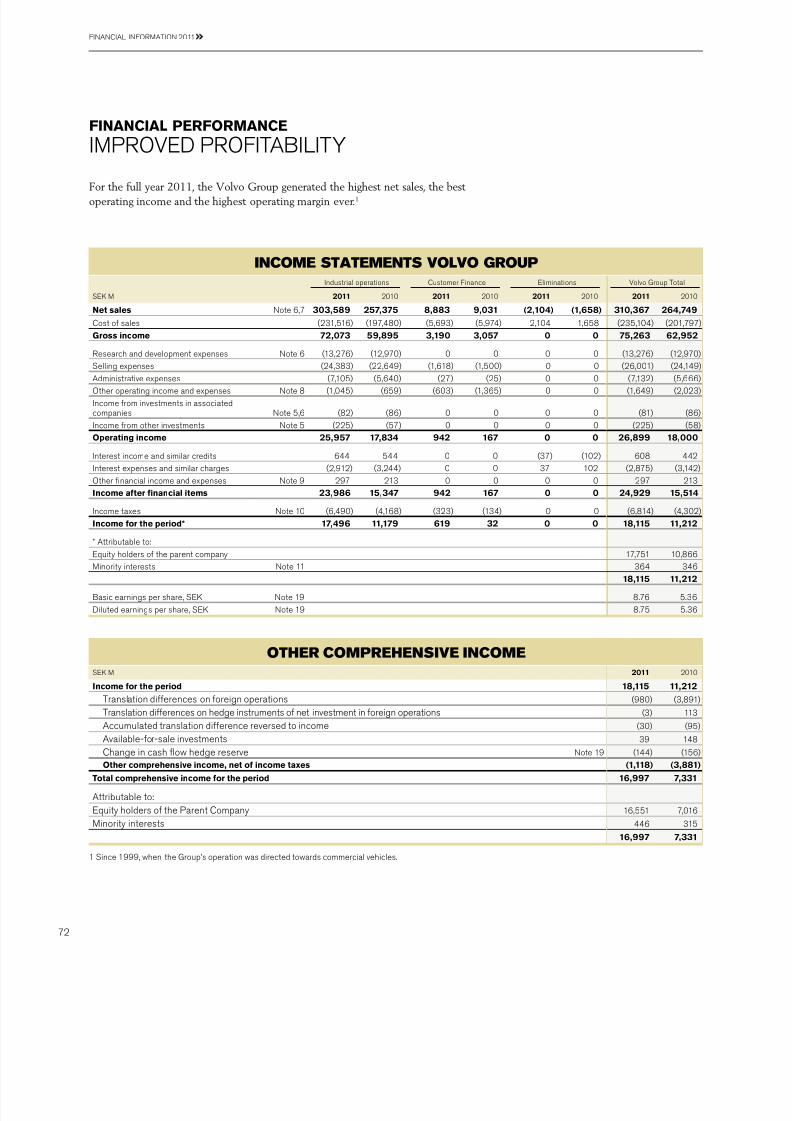
7/29/2019 MBA VTU Project on VOLVO Group in India
http://slidepdf.com/reader/full/mba-vtu-project-on-volvo-group-in-india 76/166
For the full year 2011, the Volvo Group generated the highest net sales, the best operating income and the highest operating margin ever.1
FACA PFAC
P PFab
Income statements VolVo Group
ndustril opertions ustomer Finnce limintions olvo Group otl
SK 2011 2010 2011 2010 2011 2010 2011 2010
et sales ote 6,7 303,589 257,375 8,883 9,031 (2,104) (1,658) 310,367 264,749
ost of sles (231,516) (197,480) (5,693) (5,974) 2,104 1,658 (235,104) (201,797)
Gross income 72,073 59,895 3,190 3,057 0 0 75,263 62,952
eserch nd development expenses ote 6 (13,276) (12,970) 0 0 0 0 (13,276) (12,970)
Selling expenses (24,383) (22,649) (1,618) (1,500) 0 0 (26,001) (24,149)administrtive expenses (7,105) (5,640) (27) (25) 0 0 (7,132) (5,666)
ther operting income nd expenses ote 8 (1,045) (659) (603) (1,365) 0 0 (1,649) (2,023)
ncome from investments in ssocitedcompnies ote 5,6 (82) (86) 0 0 0 0 (81) (86)
ncome from other investments ote 5 (225) (57) 0 0 0 0 (225) (58)
perating income 25,957 17,834 942 167 0 0 26,899 18,000
nterest income nd similr credits 644 544 0 0 (37) (102) 608 442
nterest expenses nd similr chrges (2,912) (3,244) 0 0 37 102 (2,875) (3,142)
ther nncil income nd expenses ote 9 297 213 0 0 0 0 297 213
ncome ater nancial items 23,986 15,347 942 167 0 0 24,929 15,514
ncome txes ote 10 (6,490) (4,168) (323) (134) 0 0 (6,814) (4,302)
ncome or the period* 17,496 11,179 619 32 0 0 18,115 11,212
* attriutle to:
quity holders of the prent compny 17,751 10,866inority interests ote 11 364 346
18,115 11,212
bsic ernings per shre, SK ote 19 8.76 5.36
iluted ernings per shre, SK ote 19 8.75 5.36
other comprehensIVe Income
SK 2011 2010
ncome or the period 18,115 11,212
rnsltion differences on foreign opertions (980) (3,891)
rnsltion differences on hedge instruments of net investment in foreign opertions (3) 113
accumulted trnsltion difference reversed to income (30) (95)
aville-for-sle investments 39 148hnge in csh ow hedge reserve ote 19 (144) (156)
ther comprehensive income, net o income taxes (1,118) (3,881)
otal comprehensive income or the period 16,997 7,331
attriutle to:
quity holders of the Prent ompny 16,551 7,016
inority interests 446 315
16,997 7,331
1 Since 1999, when the Group’s opertion ws directed towrds commercil vehicles.
72
Faa Fa 2011

7/29/2019 MBA VTU Project on VOLVO Group in India
http://slidepdf.com/reader/full/mba-vtu-project-on-volvo-group-in-india 77/166
et sales
et sles for the olvo Group incresed y 17%
to SK 310,367 in 2011, compred with SK 264,749 in the preceding yer.
perating income
olvo Group operting income improved to SK
26,899 (18,000).
perting income for the ndustril per-
tions incresed to SK 25,957 compred
with SK 17,834 in the preceding yer. he
ustomer Finnce opertions’ operting income
rose to SK 942 (167).
et nancial items
et interest expense ws SK 2,267 , com-
pred with SK 2,700 in the preceding yer.uring the yer, mrket vlution of derivtives,
minly used for eliminting interest exposure in
the customer nncing portfolio, hd positive
effect on ther nncil income nd expenses
in n mount of SK 544 . uring 2010 the
impct ws positive nd mounted to SK 871 .
he currency in enezuel ws devlued
twice during 2010, which negtively impcted
ther nncil income nd expenses y SK
274 in 2010.
ncome taxes
he tx expense for the yer mounted to SK
6,814 (4,302) corresponding to tx rte of27% (28).
ncome or the period and earnings per
share
he income for the period mounted to SK
18,115 (11,212), corresponding to diluted
ernings per shre of SK 8.75 (5.36). he
return on shreholders’ equit y ws 23.1% (16.0).
et sales by business area , SK 2011 2010 %
rucks 200,703 167,305 20
onstruction quipment 64,987 53,810 21
buses 22,289 20,516 9
olvo Pent 8,859 8,716 2
olvo aero 6,509 7,708 (16)
limintions nd other 242 (680)
ndustrial perations1 303,589 257,375 18
ustomer Finnce 8,883 9,031 (2)
eclssictions nd elimintions (2,104) (1,658)
Volvo Group 310,367 264,749 17
1 adjusted for cquired nd divested units nd chnges in currency rtes, net slesincresed y 20%.
Change in operating income, SK n
perating income 2010 18.0
Gross income 19.4ecogni ti on of a credi ts in brz il relt ing to p rev ious yers 0 .6
isturnces in opertions in Jpn s n ef fect of theerthquke nd tsunmi (0.7)
esult from divestments of compnies in 2010 0.2
hnge s in cur rency exchnge rtes, ndustril opertions (5. 2)
Write-down of shres listed in Jpn (0.2)
Higher cpitliztion of development costs 1.0
Higher reserch nd development expenditures (2.0)
x credit for reserch nd development ctivities 0.3
Higher selling nd dministrtive expenses (4.7)
ower credit losses 0.6
ther (0.4)
perating income 2011 26.9
perating income (loss) by business area, SK 2011 2010
rucks 18 ,260 10 ,112
onst ruct ion qu ipment 6 ,653 6 ,180
buses 1,036 780
olvo Pent 781 578
olvo aero 336 286
limintions nd other (1,109) (102)
ndustrial perations 25,957 17,834
ustomer Finnce 942 167
Volvo Group 26,899 18,000
perating margin, % 2011 2010
rucks 9.1 6.0
onstruction quipment 10.2 11.5
buses 4.6 3.8
olvo Pent 8.8 6.6
olvo aero 5.2 3.7
ndustrial perations 8.6 6.9
Volvo Group 8.7 6.8
et sales, SK n
11100908
265218304285
07
310
he olvo Group
perating income, SK
2010 2011
Q4
6,955Q3
5,774Q2
7,648Q1
6,522Q4
5,518Q3
4,913Q2
4,770Q1
2,799

7/29/2019 MBA VTU Project on VOLVO Group in India
http://slidepdf.com/reader/full/mba-vtu-project-on-volvo-group-in-india 78/166
n 2011, net sles for the olvo Group’s ndus-
tril pertions incresed y 18% to SK
303,589 (257,375).ompred with 2010, sles incresed in ll
of the Group’s mrket res. Sles incresed
strongly in stern urope nd hd very pos-
itive development in orth americ, South
americ nd asi. n Western urope demnd
wekened towrds the end of the yer.
Considerable earnings improvement
n 2011, the operting income for the olvo
Group’s ndustril pertions mounted to SK
25,957 compred to SK 17,834 in the
preceding yer. he operting mrgin for the
ndustril pertions mounted to 8.6% (6.9).
he ernings improvement is the result ofincresed sles nd improved cost coverge in
the industril system, s n effect of incresed
production levels.
n 2011, reserch nd development expenses
mounted to SK 13,276 (12,970). he con-
tinued high cost level is primrily conse-
quence of projects relting to new emission
regultions in urope nd South americ nd
the development of products for the growth
mrkets.
Selling expenses incresed y 8% nd
dministrtion expenses y 26%.
Since return on equit y ws 23,1%, SK 550 ws provisioned for prot-shring to employees.
mpact o exchange rates on
operating income
he comined effect of chnged exchnge
rtes hd negtive effect on operting income
of pproximtely SK 5.2 illion in 2011, com-
pred with 2010. his is minly ttriutle to
tht the US ws wek during most of 2011.
ncome Statement ndustrial perations, SK 2011 2010
et sles 303,589 257,375
ost of sles (231,516) (197,480)
Gross income 72,073 59,895
Gross mrgin, % 23.7 23.3
eserch nd development expenses (13,276) (12,970)
Selling expenses (24,383) (22,649)
administrtive expenses (7,105) (5,640)
ther operting income nd expenses (1,045) (659)
ncome from investments in ssocited compnies (82) (86)
ncome from other investments (225) (57)
perating income ( loss) ndustrial perations 25,957 17,834perting mrgin, % 8.6 6.9
mpact o exchange rates on operating incomeompred with preceding yer, SK
et sles1 (20,286)
ost of sles 13.280
eserch nd development expenses 397
Selling nd dministrtive expenses 1.408
otal eect o changes in exchange rateson operating income (5.201)
1 Group sles re reported t monthly spot rtes nd the effects of currency hedgesre reported mong ost of sles.
perating net fow per currencyocl currency, million 2011 2010
US 3,970 2,410
U 57 373
GbP 555 405
a 397 241
JP (x100) (218) (103)
et sales by market area, SK 2011 2010 %
Western urope 97,925 87,241 12
stern urope 20,298 12,570 61
orth americ 58,253 45,409 28
South americ 34,013 27,876 22
asi 73,017 65,072 12
ther mrkets 20,083 19,207 5
otal ndustrial perations 303,589 257,375 18
esearch and development costs
1110090807
13.313.013.214.311.1
4.45.06.34.93.9
Research anddevelopment costs,SEK bn
Research anddevelopment costs,% of net sales
ndustril pertions
74
Faa Fa 2011

7/29/2019 MBA VTU Project on VOLVO Group in India
http://slidepdf.com/reader/full/mba-vtu-project-on-volvo-group-in-india 79/166
otl new nncing volume in 2011 mounted
to SK 44.8 illion (35.1). adjusted for chnges
in exchnge rtes, new usiness volumeincresed y 35% compred to 2010 s
result of incresed sles volumes of the olvo
Group products nd stle penetrtion levels.
n totl, 49,757 new olvo vehicles nd
mchines (34,522) were nnced during the
yer. n the mrkets where nncing is offered ,
the verge penetrtion rte ws 25% (25).
as of ecemer 31, 2011, the credit por tfolio
ws SK 95,544 (84,550). uring 2011 the
credit portfolio incresed y 13.8% (decrese: 4.4),
djusted for exchnge-rte movements. he
funding of the credit portfolio is mtched in
terms of mturity, interest rtes nd currenciesin ccordnce with olvo Group policy. For fur-
ther informtion see note 15.
he operting income for the yer mounted
to SK 942 compred to SK 167 in the
previous yer. eturn on shreholders’ equity
ws 7.3% (0.4). he equity rtio t the end of
the yer ws 9.1% (9.0). he improvement in
protility is driven minly y lower credit pro-
visions nd higher erning ssets. uring the
yer, credit provision expenses mounted to
SK 682 (1,438) while write-offs of SK 804
(1,460) were recorded. he write-off rtio for
2011 ws 0.93% (1.65). at the end of ecemer31, 2011, credit reserves were 1.33% (1.69%)
of the credit portfolio.
ncome Statement Customer Finance, SK 2011 2010
Finnce nd lese income 8,883 9,031
Finnce nd lese expenses (5,693) (5,974)
Gross income 3,190 3,057
Selling nd dministrtive expenses (1,645) (1,526)
redit provision expenses (682) (1,438)
ther operting income nd expenses 78 73
perating income (loss) 942 167
ncome txes (323) (134)
ncome (oss) or the period 619 32
eturn on quity 7.3 0.4
Key ratios, Customer Finance1 2011 2010
redit portfolio net, SK n 94.3 83.1
perting income, SK 942 167
eturn on shreholders' equity, % 7.3 0.4
otl penetrtion rte, % 24.8 24.5
Penetration by business area1, %
olvo 35 35
olvo rucks 27 29
enult rucks 19 17
ck rucks 20 20
buses 15 11
U rucks 14 12
1 Shre of unit sles nnced y olvo Finncil Services in reltion to the totlnumer units sold y the olvo Group in mrkets where nncil ser vices reoffered.
ustomer Finnce pertions

7/29/2019 MBA VTU Project on VOLVO Group in India
http://slidepdf.com/reader/full/mba-vtu-project-on-volvo-group-in-india 80/166
Net debt in the Volvo Group’s Industr ial Operations amounted to SEK 19.3 bil lion at December 31, 2011,
equal to 25.2% of shareholders’ equity. Excluding provisions for post-employment benets the Industr ial
Operation’s net debt amounted to SEK 15.0 billion, which was equal to 19.5% of shareholders’ equity.
FACA PS
P UG H a
Balance sheets VolVo Group
ndustril pertions ustomer Finnce limintions olvo Group
SK Dec 31
2011ec 31
2010Dec 31
2011ec 31
2010Dec 31
2011ec 31
2010Dec 31
2011ec 31
2010
Assets
on-current assets ntngile ssets ote 12 39,385 40,613 122 101 – – 39,507 40,714
Tangible assets ote 13
Property, plnt nd equipment 53,563 53,221 94 72 – – 53,657 53,294
nvestment property 883 948 – – – – 883 948assets under operting leses 16,749 13,217 11,525 10,055 (4,352) (3,625) 23,922 19,647
Financ ial asset s Shres nd prticiption ote 5 1,871 2,080 3 18 – – 1,874 2,098on-current customer-nncing receivles ote 15 579 598 44,651 36,270 (4,612) (843) 40,618 36,025eferred tx ssets ote 10 12,480 12,019 358 291 – – 12,838 12,310Prepid pensions ote 20 2,263 1,636 14 12 – – 2,277 1,648on-current interest-ering receivles ote 16 757 941 – 204 (63) (379) 694 766ther non-current receivles ote 16 4,500 3,401 50 41 (235) (24) 4,315 3,418
otal non-current assets 133,030 128,674 56,817 47,064 (9,262) (4,871) 180,585 170,868
Current assets
nventories ote 17 43,828 38,956 771 882 – – 44,599 39,837
Current receivables ustomer-nncing receivles ote 15 1,123 830 38,050 36,897 (1,092) (1,064) 38,081 36,663x ssets 1,152 1,045 48 90 – – 1,200 1,135nterest-ering receivles ote 16 1,461 1,071 226 1,283 (1,020) (2,012) 667 342
nternl funding1 2,253 7,505 – – (2,253) (7,505) – –accounts receivle ote 16 27,492 24,332 207 101 – – 27,699 24,433ther receivles ote 16 13,438 11,561 1,411 1,352 (1,024) (1,056) 13,825 11,857
on interest-ering ssets held for sle ote 3 9,344 136 – – – – 9,344 136nterest-ering ssets held for sle ote 3 4 – – – – – 4 –rketle securities ote 18 6,838 9,735 24 32 – – 6,862 9,767sh nd csh equivlents ote 18 29,113 21,756 1,593 1,545 (327) (335) 30,379 22,966otal current assets 136,046 116,928 42,330 42,182 (5,717) (11,970) 172,659 147,139otal assets 269,076 245,602 99,147 89,246 (14,979) (16,841) 353,244 318,007
Shareholders’ equity and liabilities ote 19
quity ttriutle to the equity holder of thePrent ompny 75,582 65,090 8,999 8,020 – – 84,581 73,110inority interests 1,100 1,011 – – – – 1,100 1,011
otal shareholders’ equity 76,682 66,101 8,999 8,020 – – 85,681 74,121
Non-curren t provisions
Provisions for post-employment enets ote 20 6,635 7,478 30 32 – – 6,665 7,510Provisions for deferred txes ote 10 4,171 3,026 1,465 1,496 – – 5,636 4,522ther provisions ote 21 5,492 5,785 154 150 2 1 5,648 5,936
Non-current liabili ties ote 22bond lons 38,192 38,767 – – – – 38,192 38,767ther lons 38,848 37,180 8,974 8,225 (57) (78) 47,765 45,327nternl funding1 (35,453) (26,971) 33,459 25,927 1,994 1,044 – –
ther liilities 12,902 11,172 740 389 (3,195) (2,330) 10,447 9,231urrent provisions ote 21 9,438 8,429 92 105 1 1 9,531 8,534
Current liabilities ote 22ons 38,644 32,101 6,741 8,299 (863) (799) 44,522 39,601
nternl funding1 (24,837) (21,220) 35,373 33,643 (10,536) (12,423) – –on interest-ering liilities held for sle ote 3 4,710 135 – – – – 4,710 135nterest-ering liilities held for sle ote 3 6 – – – – – 6 –rde pyles 56,546 47,111 242 139 – – 56,788 47,250x liilities 2,220 1,571 171 161 – – 2,391 1,732
ther liilities 34,880 34,937 2,707 2,660 (2,325) (2,257) 35,262 35,341
otal shareholders’ equity and liabilities 269,076 245,602 99,147 89,246 (14,979) (16,841) 353,244 318,007
1 nternl funding is internl lending from ndustril pertions to ustomer Finnce.76
Faa Fa 2011

7/29/2019 MBA VTU Project on VOLVO Group in India
http://slidepdf.com/reader/full/mba-vtu-project-on-volvo-group-in-india 81/166
he olvo Group’s csh, csh equivlents nd
mrketle securities comined, mounted to
SK 37.2 illion t ecemer 31, 2011. f this ,
SK 9.3 illion re restricted for immedite use
y the olvo Group compred to SK 7.4 illion
yer erlier. n ddition to this, grnted ut notutilized credit fcilities mounted to SK 33.4
illion.
otl ssets in the Group mounted to SK
353.2 illion on ecemer 31, 2011, n
increse of SK 35.2 illion compred to yer-
end 2010. he increse is minly result of
increse in inventories nd ccounts receiv-
les, incresed customer nncing receivles
due to portfolio growth in the ustomer Finnce
pertions nd increse in ssets under oper-
ting lese minly relted to the construction
equipment rentl opertion.
he Group’s intngile ssets mounted to
SK 39.5 illion on ecemer 31, 2011. nvest-
ments in reserch nd development mounted
to SK 4.2 illion in 2011, resulting in net
vlue of cpitlized development costs of SK
11.5 illion t the end of the yer. he Group’s
totl goodwill mounted to SK 23.9 illion on
ecemer 31, 2011, n increse y SK 1.0 il-
lion compred to yer-end 2010 s result of
quisitions in the construction equipment rentl
opertion.
he tngile ssets incresed y SK 4.6 il-
lion during 2011, minly relted to the expnsionin the construction equipment rentl opertion.
he vlue of the inventories incresed y
SK 4.8 illion during 2011. he increse is
minly relted to nished products within the
truck opertions nd construction equipment.
he net vlue of ssets nd liilities relted
to pensions nd similr oligtions mounted to
SK 4.4 illion on ecemer 31, 2011,
decrese of SK 1.5 illion compred to yer-
end 2010. Post-employment enets vlued t
SK 12.2 illion were reported outside the
olvo Group’s lnce sheet. For further infor-
mtion see ote 20.at yer-end, the equity rtio in the ndustril
pertions ws 28.5% nd in the olvo Group
24.3%. Shreholder’s equity in the olvo Group
mounted to SK 85.7 illion t ecemer 31,
2011.
et nancial position, SK ndustril pertions olvo Group
Dec 312011
ec 312010
Dec 312011
ec 312010
on-current interest-ering ssets
on-current customer-nncing receivles – – 40,618 36,025
on-current interest-ering receivles 757 941 694 766
urrent interest-ering ssets
ustomer-nncing receivles – – 38,081 36,663nterest-ering receivles 1,461 1,071 667 342
nternl funding 2,253 7,505 – –
nterest-ering ssets held for sle 4 – 4 –
rketle securities 6,838 9,735 6,862 9,767
sh nd nk 29,113 21,756 30,379 22,966
otal nancial assets 40,426 41,008 117,305 106,529
on-current interest-ering liilities
bond lons (38,192) (38,767) (38,192) (38 ,767)
ther lons (38,848) (37,180) (47,765) (45,327)
nternl funding 35,453 26,971 – –
urrent interest-ering liilities
ons (38,644) (32,101) (44, 522) (39 ,601)
nternl funding 24,837 21,220 – –
nterest-ering liilities held for sle (6) – (6) –
otal nancial liabilities (55,400) (59,857) (130,485) (123,695)et nancial position excl. post employmentbenets (14,974) (18,849) (13,180) (17,166)
Provision for post employment enets, net (4,372) (5,842) (4,388) (5,862)
et nancial position incl. post employmentbenets (19,346) (24,691) (17,568) (23,028)
Change in net nancial position, ndustrial perations, SK n 2011 2010
Beginning o period (24.7) (41.5)
sh ow from operting ctivities 26.9 28.8
nvestments in xed ssets (to)/from (14.0) (10.6)
isposls 1.2 0.8
perating cash-fow 14.1 19.0nvestments nd divestments of shres (0.1) (0.1)
acquired nd divested opertions, net (3.0) 0.2
pitl injections (to)/from ustomer Finnce pertions (0.1) (0.5)
urrency effect (1.9) (1.6)
Pyment to ab olvo shreholders (5.1) –
ividend pid to minority shreholders 0.0 (0.1)
ther 1.5 (0.1)
otal change 5.4 16.8
et nancial position at end o period (19.3) (24.7)
et debt, ndustrial perations, SK n
2010 2011
Q4
(19.3)Q3
(29.6)Q2
(28.3)Q1
(27.3)Q4
(24.7)Q3
(38.4)Q2
(39.9)Q1
(45.0)
ed more out cpitl structure on pge 6–7

7/29/2019 MBA VTU Project on VOLVO Group in India
http://slidepdf.com/reader/full/mba-vtu-project-on-volvo-group-in-india 82/166
During 2011, operating cash ow in the Industrial Operations amounted to SEK 14.1 billion (19.0).
CAS-F SA
SG PaG aSH-FW
consolIdated cash-flow statements
ndustril opertions ustomer Finnce limintions olvo Group otl
SK Dec 31
2011ec 31
2010Dec 31
2011ec 31
2010Dec 31
2011ec 31
2010Dec 31
2011ec 31
2010
perating activities
perting income (loss) 25,957 17,834 942 167 0 (1) 26,899 18,000eprecition tngile ssets ote 13 6,109 6,060 15 15 0 2 6,124 6,077amortiztion intngile ssets ote 12 3,227 3,282 20 23 0 0 3,247 3,305eprecition lesing vehicles ote 13 2,083 1,996 2,537 2,415 1 (1) 4,621 4,410
ther non-csh items ote 29 622 170 614 1,330 26 61 1,262 1,561
otl chnge in working cpitl whereof (4,180) 4,576 (13,831) 148 2,926 77 (15,085) 4,801
Change in accounts receivable (3,094) (4,049) (101) 316 0 0 (3,195) (3,733)Change in customer fnancing receivables (240) (174) (14,202) (1,271) 3,007 98 (11,435) (1,347)
Change in inventories (7,099) (4,769) (155) 847 0 1 (7,254) (3,921)
Change in trade payables 9,871 13,057 107 (46) 0 0 9,978 13,011
Other changes in working capital (3,618) 511 520 302 (81) (22) (3,179) 791
nterest nd similr items received 720 532 – – (42) (103) 678 429nterest nd similr items pid (3,391) (2,768) – – 12 36 (3,379) (2,732)ther nncil items (184) (604) – – 0 0 (184) (604)
ncome txes pid (4,129) (2,255) (384) (336) 0 1 (4,513) (2,590)Cash fow rom operating activities 26,834 28,823 (10,087) 3,762 2,923 72 19,670 32,657
nvesting activities
nvestments in tngile ssets (8,267) (6,729) (50) (97) 27 67 (8,290) (6,759)nvestments in intngile ssets (4,293) (3,557) (20) (18) 0 0 (4,313) (3,575)nvestment in lesing vehicles (1,422) (295) (6,044) (4,554) 53 38 (7,413) (4,811)isposls of xed ssets nd lesing vehicles 1,233 776 2,099 2,293 0 (2) 3,332 3,067
perating cash fow 14,085 19,018 (14,102) 1,386 3,003 175 2,986 20,579
nvestments nd divestments of shres, net ote 5,29 (119) (106)acquired nd divested opertions, net ote 3,29 (1,590) 617nterest-ering receivles incl mrketle securities 2,665 6,813Cash-fow ater net investments 3,942 27,903
Financing activities
hnge in lons, net ote 29 8,734 (25,711)ividend to ab olvo shreholders (5,069) –ividend to minority shreholders (2) (75)ther (30) (25)Change in cash and cash equivalents excl.translation dierences 7,575 2,092
rnsltion difference on csh nd csh equivlents (162) (360)Change in cash and cash equivalents 7,413 1,732
Cash and cash equivalents, Beginning o year ote 18 22,966 21,234Cash and cash equivalents, nd o year ote 18 30,379 22,966
78
Faa Fa 2011

7/29/2019 MBA VTU Project on VOLVO Group in India
http://slidepdf.com/reader/full/mba-vtu-project-on-volvo-group-in-india 83/166
he csh ow within ndustril pertions ws
positively ffected y the operting income nd
negtively ffected y the incresed working
cpitl. accounts receivles nd inventories
incresed with SK 3.1 nd 7.1 illion respec-tively, prtly offset y the increse of trde py-
les of SK 9.9 illion.
Finncil items nd pid income txes hd
SK 6.9 billion negtive effect on csh ow
within ndustril pertions, minly through
pyments of interests nd income tx.
perting csh ow within ustomer Finnce
ws negtive SK 14.1 billion (pos: SK 1.4
billion), minly due to incresed customer
nncing-receivbles.
nvestments
he ndustril pertions’ investments in xedssets nd cpitlized & during 2011
mounted to SK 12.6 illion (10.3).
pitl expenditures in rucks mounted to
SK 8.4 illion (7.2). he cpitl expenditures
within rucks consist to lrge extent of invest-
ments relted to product renewls in our product
progrm, with product development ctivities
nd required dpttions in the plnts. n the
plnts there re lso ongoing investments im-
ing for incresed cpcity nd exiility, minly
in the c plnt in Umeå, Sweden, nd in the
engine plnts with mchining nd ssemly
processes in Skövde, Sweden, nd ageo,
Jpn. uring 2011 we hve lso invested in
the deler network nd workshops, minly in
urope nd asi, s well s in our joint venture
ommercil ehicles ().
pitl investments for onstruction quip-
ment mounted to SK 1.9 illion (1.4). as for
Capital expenditures, ndustrial perations
11100908
3.22.62.12.1
4.05.04.33.6
7.17.710.58.0
Capitalized developmentcosts, SEK bn
Capital expenditures,% of net sales
Property, plant andequipment, SEK bn
07
4.1
4.1
8.5
Sel-nancing ratio,ndustrial perations %
Cash-flow from operating activitiesdivided by net investments in fixedassets and leasing assets.
1110090807
210294(16)78265
perating cash fow,ndustrial perations, SK n
2010 2011
Q4
10.7
Q3
2.2
Q2
5.2
Q1
(4.0)
Q4
15.1
Q3
(1.9)
Q2
8.5
Q1
(2.7)
previous yer, the mjority of the investments
refer to expnsion of the excvtor usiness for
oth olvo rnd nd SG rnd. ur ing 2011
minly hin nd Kore hve een impcted, in
cpcity investments in mchining nd ssem-ly re. Product relted investments during
the yer refer to the emission regultions in
urope nd orth americ, nd ier 2 nd ier
3 requirements for new models in the b
countries.
he investments within olvo aero ws during
2011 SK 0.5 illion (0.8). he mjority of the
investments refer to the involvement in the new
engine progrms, PW1100G nd PW1000G
with Prtt & Whitney, nd rent XWb with olls-
oyce. he investments lso refer to nliztion
of numer of investments in olvo aero’s pro-
duction fcilities in order to secure the cpcityrequired for the XWb nd GP7000 progrm
(P&W), nd rtionliztions in the spool shop.
he investments in buses were SK 0.3 illion
(0.2), nd in olvo Pent SK 0.2 illion (0.2).
nvestments in lesing ssets mounted to
SK 1.4 illion (0.3), the increse versus previ-
ous yer refers minly to expnsion of the rentl
eet s well s replcement of existing eet.
For 2012, the olvo Group estimtes tht
investments in property, plnt nd equipment
will e round SK 10 illion. he investment
level is however pending the mrket develop-
ment, nd in order to e le to dpt the level,
the ongoing nd future investments re contin-
uously reviewed nd prioritized. he invest-
ments in coming product progrms continue
during 2012, s well s the expnsion of the
usiness in the b countries.
Acquisitions and divestments
acquired nd divested opertions 2011 hd
negtive impct on csh ow of SK 1.6 illion
(positive 0.6).
acquired opertions refer minly to severlminor cquisitions of ssets nd libilities in
construction equipment rentl opertions. he
remining minority interest in olvo aero orge
nd U rucks South afric hs lso been
cquired during the yer.
Financing and dividend
et orrowings incresed csh nd csh equiv-
lents y SK 8.7 illion during 2011.
uring the yer dividend of SK 5.1 illion,
corresponding to SK 2.50 per shre, ws pid
to the shreholders of ab olvo.
Change in cash and cash equivalents
he Group’s csh nd csh equivlents
incresed y SK 7.4 illion during the yer nd
mounted to SK 30.4 illion t ecemer 31,
2011.
eer to ote 29 for principles for prepringthe csh ow nlysis.
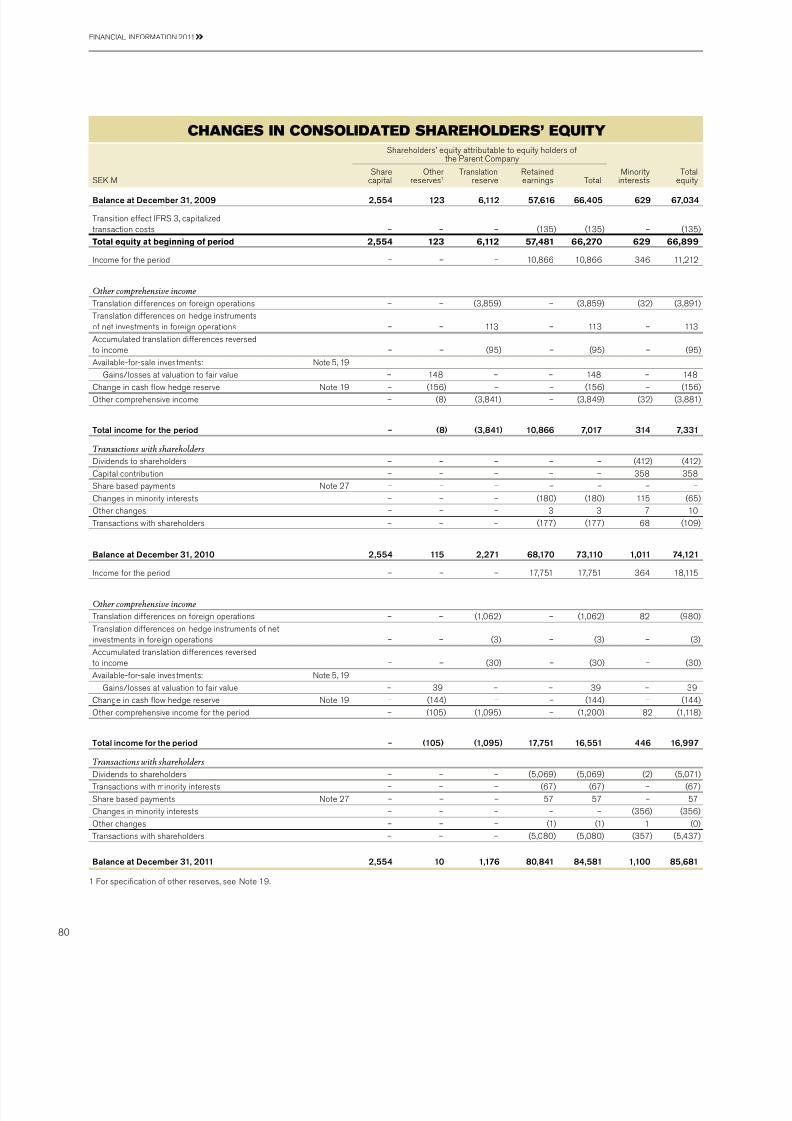
7/29/2019 MBA VTU Project on VOLVO Group in India
http://slidepdf.com/reader/full/mba-vtu-project-on-volvo-group-in-india 84/166
chanGes In consolIdated shareholders’ equIty
Shreholders’ equity ttriutle to equity holders ofthe Prent ompny
SK
Shre
cpitl
ther
reserves1
rnsltion
reserve
etined
ernings otl
inority
interests
otl
equityBalance at December 31, 2009 2,554 123 6,112 57,616 66,405 629 67,034
rnsition effect FS 3, cpitlizedtrnsction costs – – – (135) (135) – (135)
otal equity at beginning o period 2,554 123 6,112 57,481 66,270 629 66,899
ncome for the period – – – 10,866 10,866 346 11,212
Other comprehensive income
rnsltion differences on foreign opertions – – (3,859) – (3,859) (32) (3,891)
rnsltion differences on hedge instrumentsof net investments in foreign opertions – – 113 – 113 – 113
accumulted trnsltion differences reversedto income – – (95) – (95) – (95)
aville-for-sle investments: ote 5, 19
Gins/losses t vlution to fir vlue – 148 – – 148 – 148
hnge in csh ow hedge reserve ote 19 – (156) – – (156) – (156)
ther comprehensive income – (8) (3,841) – (3,849) (32) (3,881)
Total income for the period – (8) (3,841) 10,866 7,017 314 7,331
Transactions with shareholders
ividends to shreholders – – – – – (412) (412)
pitl contriution – – – – – 358 358
Shre sed pyments ote 27 – – – – – – –
hnges in minority interests – – – (180) (180) 115 (65)
ther chnges – – – 3 3 7 10
rnsctions with shreholders – – – (177) (177) 68 (109)
Balance at December 31, 2010 2,554 115 2,271 68,170 73,110 1,011 74,121
ncome for the period – – – 17,751 17,751 364 18,115
Other comprehensive income
rnsltion differences on foreign opertions – – (1,062) – (1,062) 82 (980)
rnsltion differences on hedge instruments of netinvestments in foreign opertions – – (3) – (3) – (3)
accumulted trnsltion differences reversedto income – – (30) – (30) – (30)
aville-for-sle investments: ote 5, 19
Gins/losses t vlution to fir vlue – 39 – – 39 – 39
hnge in csh ow hedge reserve ote 19 – (144) – – (144) – (144)
ther comprehensive income for the period – (105) (1,095) – (1,200) 82 (1,118)
Total income for the period – (105) (1,095) 17,751 16,551 446 16,997
Transactions with shareholders
ividends to shreholders – – – (5,069) (5,069) (2) (5,071)
rnsctions with minority interests – – – (67) (67) – (67)
Shre sed pyments ote 27 – – – 57 57 – 57
hnges in minority interests – – – – – (356) (356)
ther chnges – – – (1) (1) 1 (0)
rnsctions with shreholders – – – (5,080) (5,080) (357) (5,437)
Balance at December 31, 2011 2,554 10 1,176 80,841 84,581 1,100 85,681
1 For speciction of other reserves, see ote 19.
Faa Fa 2011
80

7/29/2019 MBA VTU Project on VOLVO Group in India
http://slidepdf.com/reader/full/mba-vtu-project-on-volvo-group-in-india 85/166
S Faa SaS
amounts in SK unless otherwise specied. he mounts within prentheses refer to the preceding yer, 2010.
he consolidted nncil sttements for ab olvo nd its susidiries hveeen prepred in ccordnce with nterntionl Finncil eporting Stnd-rds (FS) issued y the nterntionl accounting Stndrds bord (aSb),s dopted y the U. he por tions of FS not dopted y the U hve nomteril impct on this report. his annul eport is prepred in ccordncewith aS 1 Presenttion of Finncil Sttements nd with the Swedish om-pnies act. n ddition, F 1 Supplementry ules for Groups, hs eenpplied, which is issued y the Swedish Finncil eporting bord. as of2005, olvo hs pplied nterntionl Finncil eporting Stndrds (FS)
in its nncil sttements. n ccordnce with the FS trnsitions rules inFS 1, olvo pplies retrospective ppliction from the FS trnsition dtet Jnury 1, 2004. he detils of the trnsition from Swedish GaaP to FSre set out in ote 3 in the nnul reports of 2005 nd 2006. efer to the
2004 annul eport for description of the previous Swedish ccountingpolicies pplied y olvo.
How should Volvo’s accounting polic ies be read? olvo descries the ccounting policies in conjunction with ech note inthe im of providing enhnced understnding of ech ccounting re.olvo focuses on descriing the ccounting choices tht the Group hsmde within the frmework of the previling FS policy nd voids
repeting the ctul text of the stndrd, unless olvo considers it pr-ticulrly importnt to the understnding of the note’s content. efer to thetle elow to see the note in which ech ccounting policy is listed ndfor the relevnt nd mteril FS stndrd.
aUG PPS
1note
Accounting principle ote FS-standard
on-current ssets held for sle nd discontinuedopertions
3, acquisitions nd divestments of shres in susidiries FS 5
Joint ventures 5, Shres nd prticiptions aS 31nvestments in ssocites 5, Shres nd prticiptions aS 28perting segments 6, Segment reporting FS 8evenue 7, ncome aS 17, aS 18Shres nd prticiptions 5, Shres nd prticiptions aS 28, aS 32, aS 36,
aS 39Finncil income nd expenses 9, ther nncil income nd expenses aS 39ncome txes 10, ncome txes aS 12inority interests 11, inority interests aS 27eserch nd development expenditure 12, ntngile ssets aS 38ntngile ssets 12, ntngile ssets aS 36, aS 38ngile ssets 13, ngile ssets aS 16, aS 40esing 14, esing aS 17ustomer-nncing receivles 15, ustomer-nncing receivles aS 17, aS 18, aS 39, FS 7nventories 17, nventories aS 2rnings per shre 19, Shreholder's equity aS 33Pensions nd similr oligtions 20, Provisions for post-employment enets aS 19
Provisions for residul vlue risks 21, ther provisions aS 17, aS 18, aS 37Wrrnty expenses 21, ther provisions aS 37
estructuring costs 21, ther provisions aS 37iilities 22, iilities aS 37, aS 39, FS 7ontingent liilities 24, ontingent liilities aS 37rnsctions with relted prties 25, rnsctions with relted prties aS 24Government grnts 26, Government grnts aS 20Shre-sed pyments 27, Personnel FS 2sh-ow sttement 29, sh ow aS 7Finncil instruments 4, Gols nd policies in nncil risk mngement aS 32, aS 39, FS 7
16, eceivles18, rketle securities nd liquid funds30, Finncil instruments

7/29/2019 MBA VTU Project on VOLVO Group in India
http://slidepdf.com/reader/full/mba-vtu-project-on-volvo-group-in-india 86/166
Consolidated nancial statements
Principles for consolidtionhe consolidted nncil sttements hve een prepred in ccordncewith the principles set forth in aS 27, onsolidted nd Seprte FinncilSttements. accordingly, intr-Group trnsctions nd gins on trnsc-
tions with ssocited compnies re eliminted. he consolidted nn-cil sttements comprise the Prent ompny, susidiries, joint venturesnd ssocited compnies.– Susidiries re dened s compnies in which olvo holds more thn
50% of the voting rights or in which olvo otherwise hs controllinginterest.
– Joint ventures re compnies over which olvo hs joint control togetherwith one or more externl prties. Joint ventures re recognized usingthe proportionte method of consolidtion.
– associted compnies re compnies in which olvo hs signicntinuence, which is normlly when olvo’s holdings correspond to tlest 20% ut less thn 50% of the voting rights. Holdings in ssocitedcompnies re recognized in ccordnce with the equity method.
rnsltion to Swedish kronor when consolidting compnies using
foreign currenciesab olvo’s functionl currency is the Swedish kron (SK). he functionlcurrency of ech olvo Group compny is determined sed on the pri-mry economic environment in which it opertes. he primry economicenvironment is normlly the one in which the compny primrily genertesnd expends csh. n most cses, the functionl currency is the currencyof the country where the compny is locted. ab olvo’s nd the olvoGroup’s presenttion currency is SK. n prepring the consolidtednncil sttements, ll items in the income sttements of foreign su-sidiries nd joint ventures (except for susidiries in hyperintionryeconomies) re trnslted to SK t monthly exchnge rtes. all lnce-sheet items re trnslted t exchnge rtes t the respective yer-ends(closing rte). he differences in consolidted shreholders’ equity, risingfrom vritions etween closing rtes for the current nd preceding yerre chrged or credited directly to other comprehensive income s seprte
component.he ccumulted trnsltion difference relted to certin susidiry, joint venture or ssocited compny is reversed to prot or loss s prtof the gin/loss rising from the divestment or liquidtion of such compny.
aS 29, Finncil eporting in Hyperintionry conomies, is ppliedto nncil sttements of susidiries operting in hyperintionryeconomies. olvo’s method of recognition is sed on cost. rnsltiondifferences due to intion re chrged ginst ernings for the yer. ur-rently, olvo hs no susidiries with functionl currency tht could econsidered hyperintionry currency.
eceivables and liabilities in oreign currencyeceivles nd liilities in foreign currency re mesured t closingrtes. rnsltion differences on operting ssets nd liilities re rec-ognized in operting income, while trnsltion differences rising in nn-
cil ssets nd liilities re chrged to other nncil income ndexpenses. Finncil ssets nd liilities re dened s items included inthe net nncil position of the olvo Group (see enitions t the end ofthis report). erivtive nncil instruments used for hedging of exchngend interest risks re recognized t fir vlue. Gins on exchnge rtesre recognized s receivles nd losses on exchnge rtes re recog-nized s liilities. epending on the lifetime of the nncil instrument,the item is recognized s current or non-current in the lnce sheet.
xchnge rte differences on lons nd other nncil instruments inforeign currency, which re used to hedge net ssets in foreign susidiriesnd ssocited compnies, re offset ginst trnsltion differences inthe shreholders’ equity of the respective compnies. xchnge-rtegins nd losses on ssets nd liilities in foreign currencies, oth on
pyments during the yer nd on mesurements t yer-end, impct protor loss in the yer in which they re incurred. he more importnt exchngertes pplied re shown in the tle.
xchange rates averge rte losing rte
ountry urrency 2011 2010 2011 2010
brzil b 3.8850 4.0925 3.7109 4.0560nd a 6.5694 6.9973 6.7808 6.8085hin 1.0057 1.0643 1.0998 1.0300enmrk KK 1.2137 1.2823 1.2044 1.2086uro zone U 9.0430 9.5502 8.9540 9.0113Gret britin GbP 10.4179 11.1319 10.6831 10.5538Jpn JP 0.0817 0.0823 0.0892 0.0835orwy K 1.1596 1.1926 1.1515 1.1530South Kore KW 0.0059 0.0062 0.0060 0.0060United Sttes US 6.4982 7.2060 6.9247 6.8038
ew accounting principles or 2011one of the new ccounting principles or interprettions tht cme intoeffect s of Jnury 1, 2011 hs hd ny signicnt impct on the olvoGroup’s nncil sttements.
ew accounting principles or 2012 and laterWhen prepring the consolidted nncil sttements s of ecemer31, 2011, numer of stndrds nd interprettions hs een pulished,ut hs not yet ecome effective. he following is preliminry ssessmentof the effect tht the implementtion of these stndrds nd sttementscould hve on the olvo Group’s nncil sttements.
Amendment to IAS 19 Employee benefts* as from Jnury 1, 2013 the mendment to aS 19, mployee enetswill ecome effective. he revised stndrd is pplied retrospectively, ndhence the closing lnce for 2011 will e djusted in ccordnce withrevised aS 19 nd the reported numers for 2012 will e resttedccordingly for comprison reson.
he mended stndrd removes the option to use the corridor methodcurrently used y the olvo Group. iscount rte will e used when clcu-lting the net interest income or expense on the net dened enet liil-ity (sset), hence the expected return will no longer e used. all chngesin the net dened enet liility or sset will e recognized when theyoccur. Service cost nd net interest will e recognized in prot nd losswhile remesurements such s cturil gins nd losses will e recognizedin other comprehensive income.
n ccordnce with aS 19 revised, the recognized pension liility will
increse y pproximtely SK 12 illion s the unrecognized prt of thepension liility no longer cn e reported off lnce. Shreholders’equity will decrese y pproximtely SK 8 illion net of deferred txesin the opening lnce for 2012 in ccordnce with aS 19 revised. etnncil position including post-employment enets would increse ySK 12 illion while the equity rtio would decrese. Further chnges inthe net dened enet liility will e the modied net interest clcultionnd the removl of the mortistion of cturil gins nd losses.
S Faa SaS
Faa Fa 2011
82

7/29/2019 MBA VTU Project on VOLVO Group in India
http://slidepdf.com/reader/full/mba-vtu-project-on-volvo-group-in-india 87/166
For the Swedish prt of the net pension liility there re still some uncer-tinties regrding the ccounting for Swedish specil pyroll tx ndSwedish yield tx. Swedish specil pyroll tx ’ ssignle to the mountreported s the corridor for the Swedish entities mounts to pproximtelySK 1 illion. n the opening lnce for 2012 in ccordnce with aS 19revised, this will likely e reported s n increse of the recognized pensionliility nd in shreholders’ equity net of deferred txes.
For further informtion of provision for post-employment enet, seenote 20.
IFRS 10 Consolidated Financial Statements*, IFRS 11 Joint Arrangements* and IFRS 12 Disclosures o Interests in Other Entities* applicable rom
January 1, 2013.IFRS 10 replces the consolidtion instructions in aS 27 onsolidtednd Seprte F inncil Sttements nd S-12 onsolidtion – SpecilPurpose ntities nd ims to implement consolidtion policy sed oncontrol, dened s the extent to which the owner (i) hs control of theinvestment oject, (ii) receives, or is entitled to, vrile returns from his/her involvement in the investment oject nd (iii) hs the ility to exercisehis/her control of the investment oject to inuence the size of the return.
IFRS 11 replces aS 31 nterests in Joint entures nd implementsnew ccounting requirements for joint ventures. he ility to pply the
proportionte method used y olvo when recognizing jointly controlledcompnies will e olished, mening tht the equity method will reminfor the type of joint ventures tht olvo hs. Herefter olvo will not con-solidte the ssignle prt item y item, the ssignle prt will eshown s income from investments in ssocited compnies. he equity
interest of the joint ventures result will e ffect the investment in jointventures in the lnce sheet.IFRS 12 isclosure of nterests in ther ntities requires more detiled
disclosure reports on susidiries, ssocited compnies nd non-consolidted structured compnies, in which the compny is involved.
olvo is currently conducting full nlysis of the signicnce of thesestndrds nd how they will ffect olvo. although the stndrds re con-sidered to chnge the recognition of joint ventures, they re not consid-ered to hve ny signicnt impct on the consolidtion of other comp-nies of which olvo hs ownership or is involved. he scope of thedisclosures will proly increse in this re due to FS 12.
IFRS 9 Financial instruments* FS 9 is pulished in three prts: lssiction nd esurement,mpirment nd Hedge accounting, which will replce the current aS 39with ppliction not er lier thn Jnury 1, 2015. Prior ppliction is vol-untry, suject to U pprovl. olvo is currently conducting review ofhow the implementtion of FS 9 will impct the Group. a joint positionwill e tken in conjunction with the nl version of ll three componentsof the project eing pulished.
* hese stndrds/interprettions hd not een dopted y the U whenthis annul eport ws pulished. he dtes listed for ppliction mythus e suject to chnge due to decisions mde during the U pprovlprocess.
olvo’s most signicnt ccounting policies re primrily descriedtogether with the pplicle note. efer to ote 1, accounting Policies for speciction. he preprtion of olvo’s onsolidted Finncil Stte-ments requires the use of estimtes, judgements nd ssumptions thtffect the recognized mounts of ssets, liilities nd provisions t thedte of the nncil sttements nd the recognized mounts of sles ndexpenses during the periods presented. n prepring these nncilsttements, olvo’s mngement hs mde i ts est estimtes nd judge-ments of certin mounts included in the nncil sttements, giving dueconsidertion to mterility. Since future results re n unknown quntity,ctul results could differ from these estimtes due to the ppliction ofthese ssumptions. n ccordnce with aS 1, the compny is required toprovide dditionl disclosure of ccounting policies in which estimtes, judgments nd ssumptions re prticulrly sensitive nd which, if ctulresults differ, my hve mteril impct on the nncil sttements.
!he sources of uncertinty which hs een identied y olvo nd
which full those criteris re presented in connection to the items con-sidered to e ffected. he djcent tle shows where to nd thosepresenttions.
Source o estimation uncetainty ote
evenue recognition 7, ncomeeferred txes 10, ncome txesmpirment of goodwill nd other intn-gile ssets 12, ntngile ssetsassets nd other non-current ssets 13, ngile ssetsredit loss reserves 15, ustomer-nncing
receivles16, eceivles
nventory osolescence 17, nventoriesPensions nd other post-employmentenets
20, Provisions for post-employment enets
Product wrrnty costs 21, ther provisions
egl proceedings 21, ther provisionsesidul vlue risks 21, ther provisions
K SUS F Sa Ua
2note
-balanceUnrecognized cturil
gins nd losses
ffect on operting income ofmortiztion of unrecognized
cturil losses
ec 31, 2009 SK 9 illion –ec 31, 2010 SK 7 illion SK 420
ec 31, 2011 SK 12 illion SK 335
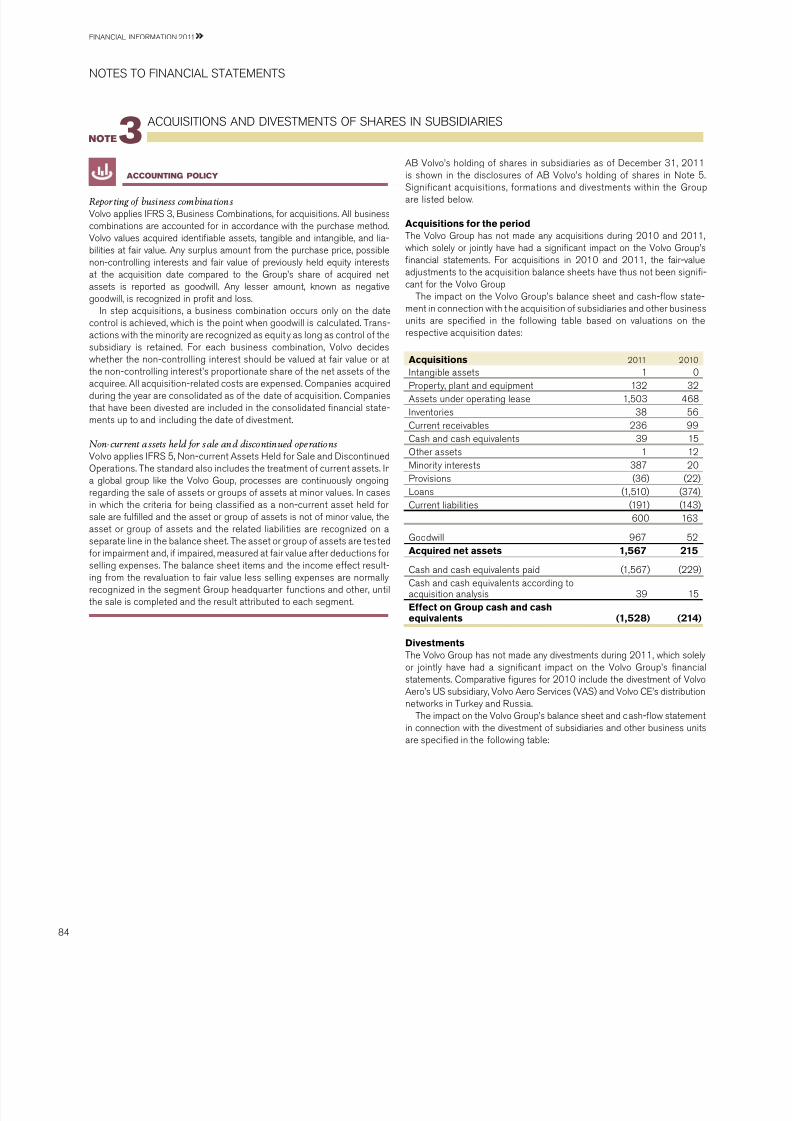
7/29/2019 MBA VTU Project on VOLVO Group in India
http://slidepdf.com/reader/full/mba-vtu-project-on-volvo-group-in-india 88/166
accountInG polIcy
Repor ting o business combinationsolvo pplies FS 3, business omintions, for cquisitions. all usinesscomintions re ccounted for in ccordnce with the purchse method.olvo vlues cquired identile ssets, tngile nd intngile, nd li-ilities t fir vlue. any surplus mount from the purchse price, possilenon-controlling interests nd fir vlue of previously held equity interestst the cquisition dte compred to the Group’s shre of cquired netssets is reported s goodwill. any lesser mount, known s negtivegoodwill, is recognized in prot nd loss.
n step cquisitions, usiness comintion occurs only on the dtecontrol is chieved, which is the point when goodwill is clculted. rns-ctions with the minority re recognized s equit y s long s control of thesusidiry is retined. For ech usiness comintion, olvo decideswhether the non-controlling interest should e vlued t fir vlue or t
the non-controlling interest’s proportionte shre of the net ssets of thecquiree. all cquisition-relted costs re expensed. ompnies cquiredduring the yer re consolidted s of the dte of cquisition. ompniestht hve een divested re included in the consolidted nncil stte-ments up to nd including the dte of divestment.
Non-current assets he ld or sale and discontinued ope rationsolvo pplies FS 5, on-current assets Held for Sle nd iscontinuedpertions. he stndrd lso includes the tretment of current ssets. n glol group like the olvo Goup, processes re continuously ongoingregrding the sle of ssets or groups of ssets t minor vlues. n csesin which the criteri for eing clssied s non-current sset held forsle re fullled nd the sset or group of ssets is not of minor vlue, thesset or group of ssets nd the relted liilities re recognized on seprte line in the lnce sheet. he sset or group of ssets re tes ted
for impirment nd, if impired, mesured t fir vlue fter deductions forselling expenses. he lnce sheet items nd the income effect result-ing from the revlution to fir vlue less selling expenses re normllyrecognized in the segment Group hedqurter functions nd other, untilthe sle is completed nd the result ttriuted to ech segment.
aUSS a SS F SHaS SUbSaS
3note
ab olvo’s holding of shres in susidiries s of ecemer 31, 2011is shown in the disclosures of ab olvo’s holding of shres in ote 5.
Signicnt cquisitions, formtions nd divestments within the Groupre listed elow.
Acquisitions or the periodhe olvo Group hs not mde ny cquisitions during 2010 nd 2011,which solely or jointly hve hd signicnt impct on the olvo Group’snncil sttements. For cquisitions in 2010 nd 2011, the fir-vluedjustments to the cquisition lnce sheets hve thus not een signi-cnt for the olvo Group.
he impct on the olvo Group’s lnce sheet nd csh-ow stte-ment in connection with the cquisition of susidiries nd other usinessunits re specied in the following tle sed on vlutions on therespective cquisition dtes:
Acquisitions 2011 2010
ntngile ssets 1 0Property, plnt nd equipment 132 32assets under operting lese 1,503 468nventories 38 56urrent receivles 236 99sh nd csh equivlents 39 15ther ssets 1 12inority interests 387 20Provisions (36) (22)ons (1,510) (374)urrent liilities (191) (143)
600 163
Goodwill 967 52
Acquired net assets 1,567 215sh nd csh equivlents pid (1,567) (229)sh nd csh equivlents ccording tocquisition nlysis 39 15ect on Group cash and cashequivalents (1,528) (214)
Divestmentshe olvo Group hs not mde ny divestments during 2011, which solelyor jointly hve hd signicnt impct on the olvo Group’s nncilsttements. omprtive gures for 2010 include the divestment of olvoaero’s US susidiry, olvo aero Services (aS) nd olvo ’s distriutionnetworks in urkey nd ussi.
he impct on the olvo Group’s lnce sheet nd csh-ow sttementin connection with the divestment of susidiries nd other usiness units
re specied in the following tle:
S Faa SaS
Faa Fa 2011
84

7/29/2019 MBA VTU Project on VOLVO Group in India
http://slidepdf.com/reader/full/mba-vtu-project-on-volvo-group-in-india 89/166
Divestments 2011 2010
ntngile ssets (5) 0Property, plnt nd equipment (4) (32)assets under operting lese 0 (190)Shres nd prticiptions 0 0
nventories (45) (1,096)ther receivles (130) (334)sh nd csh equivlents (21) (176)ther provisions 17 (10)ther liilities 143 540
(45) (1,298)
Goodwill 0 (122)Divested net assets (45) (1,420)
sh nd csh equivlents received (41) 1,007sh nd csh equivlents, divestedcompnies (21) (176)ect on Group cash and cashequivalents (62) 831
Acquisitions and divestments ater the end o the periodolvo hs not mde ny cquisitions or divestments fter the end of theperiod tht hve hd ny signicnt impct on the olvo Group.
Assets and liabilities held or saleat yer-end 2011, the olvo Group recognized ssets mounting to 9,348nd liilities mounting to 4,716 s ssets nd liilities held for sle.rnsltion differences on foreign opertions of 3 is included in othercomprehensive income. his is referring to the initited process to divestthe usiness re olvo aero. a divestment is in line with the furtherstremlining of the olvo Group towrds commercil vehicles. ependingon the progress with the s les process, chnges in the usiness environ-ment, ccess to liquidity, mrket outlook, etc. the fir vlue of ssets heldfor sle my chnge in the forthcoming periods or when the trnsction is
nlized. For the comprtive yer 2010, the olvo Group recognizedssets mounting to 136 nd liilities to 135 clssied s ssets ndliilities held for sle.
Assets and liabilities held or sale 2011 2010
ntngile ssets 3,316 0ngile ssets 1,984 43nventories 2,216 8accounts receivle 566 56ther current receivles 982 24ther ssets 284 5otal assets 9,348 136
rde pyles 1,025 31ther current liilities 3,691 104
otal liabilities 4,716 135

7/29/2019 MBA VTU Project on VOLVO Group in India
http://slidepdf.com/reader/full/mba-vtu-project-on-volvo-group-in-india 90/166
GaS a PS Faa SK aaG
4olvo’s glol opertions expose the compny to nncil risks in the form
of interest rte risks, currency risks, credit risks nd liquidity risks. Work onnncil risks comprises n integrted element of olvo’s usiness. olvoGroup strives to minimize these risks y optimizing the Group’s cpitlcosts y utilizing economies of scle, minimize negtive effects on incomes result of chnges in currency or interest rtes nd to optimize risk exposure. all risks re mnged pursunt to olvo’s estlished policiesin these res. For further informtion on accounting principles for Finncilnstruments refer to note 30, Finncil nstruments.
olvo’s risk mngement relted to specic lnce sheet items re thuslso descried in other res of the annul eport. efer to the ote’sinstructions.
note
FACA SKS
aSH-FW SKS
P SKSFaa U
XPSU
U XPSUF U
a UXPSU
a SK
Faa SK
FaaUPa SK
Interest-rate rIsks a
nterest-rte risk refers to the risk tht chnged interest-rte levels willffect consolidted ernings nd csh ow (csh-ow risks) or the firvlue of nncil ssets nd liilities (price risks).
polIcy
tching the interest-xing terms of nncil ssets nd liilitiesreduces the exposure. nterest-rte swps re used to chnge/inuencethe interest-xing term for the Group’s nncil ssets nd liilities.urrency interest-rte swps enle orrowing in foreign currencies fromdifferent mrkets without introducing currency risk. olvo lso hs stndrd-ized interest-rte forwrd contrcts (futures) nd Fas (forwrd-rtegreements). ost of these contrcts re used to hedge interest-rte levels
for short-term orrowing or investments.
Cash-fow riskshe effect of chnged interest rte levels on future currency nd interest-rte ows primrily pertins to the Group’s customer nncing opertionsnd net nncil items. ustomer nnce opertions mesure the degree
of mtching interest rte xing on orrowing nd lending. he clcultionof the mtching degree excludes equity, which mounted to etween 8nd 10% in the customer nnce opertions. at yer-end 2011, thedegree of such mtching ws 97% (100), which ws in line with the Group’spolicy. at yer-end 2011, in ddition to the ssets in i ts customer-nncingopertions, olvo’s interest- ering ssets consisted primrily of csh,csh equivlents nd liquid ssets invested in short-term interest-eringsecurities. he ojective is to chieve n interest-xing term of threemonths for the liquid ssets in olvo’s industril opertions through theuse of derivtives. n ecemer 31, 2011, fter tking derivtives intoccount, the verge interest on these ssets ws 1.9% (2.0). after tkingderivtives into ccount, outstnding lons hd interest terms corre-sponding to n interest-rte xing term of three months nd the vergeinterest t yer-end mounted to 4.1% (4.3), including olvo’s credit costs.
Price risks c
xposure to price risks s result of chnged interest-rte levels refers to
nncil ssets nd liilities with longer interest-rte xing term (xedinterest).
he following tle* d shows the effect on income efore txes inndustril pertions nncil net position , including pensions nd similrnet oligtions, if interest rtes were to increse y 1 percentge point,(100 sis points) ssuming n verge interest-rte xed term of threemonths.
* he ote’s sensitivity nlysis on interest rte risks is sed on simpliedssumptions. t is not unresonle for mrket interest rtes to chnge y 1 per-centge point (100 sis points) on n nnul sis. However, in relity, thesertes often rise or decline t different points in time. he sensitivity nlysis lso
ssumes prllel deferment of the return curve, nd tht the interest rtes onssets nd liilities will e eqully impcted y chnges in mrket interest rtes.accordingly, the impct of rel interest-rte chnges my differ from the nlysis
presented ove. d
S-A SKS CC SKS CD SKS D SKS
S-A SKS
SD 7.8
B 6.6
S Faa SaS
Faa Fa 2011
86

7/29/2019 MBA VTU Project on VOLVO Group in India
http://slidepdf.com/reader/full/mba-vtu-project-on-volvo-group-in-india 91/166
urrenciesther
currencie s rket vlue
illions US GbP U JP et SK
ue dte 2012 mount 1,100 75 (22) (5,514) 604ue dte 2013 mount (2) – – (115) 17ue dte 2014 mount (2) – – – -Total local currency 1,096 75 (22) (5,629) 621
averge contrct rte 6.76 10.73 9.21 0.08Market value of outstanding forwardcontracts SEK M (147) (3) (37) 16 (1) (172)
he Volvo Group’s outstanding orward contracts and options contracts or hedging o commercial currency risks
currency rIsks B
he content of the recognized lnce sheet my e ffected y chngesin different exchnge rtes. urrency risks in olvo’s opertions rerelted to chnges in the vlue of contrcted nd expected future py-ment ows (commercil currency exposure), chnges in the vlue of lonsnd investments (nncil currency exposure) nd chnges in the vlue ofssets nd liilities in foreign susidiries (currency exposure of shre-holders’ equity).
polIcy
he im of olvo’s currency risk mngement is to secure csh ow fromrm ows through currency hedges pursunt to the estlished currency
CC SKS
d
Currencyet nncilposition incl.
pensions
mpct on erningsefore tx if interest rte
rises 1%a
(nterest-rte risks)
mpct on et nncilposition if SK rises
10%B
(urrency risks)SK JP (24,272) (182) 2,427US (5,644) (42) 564 811 6 (81) 2,453 18 (245)U 7,286 55 (729)ther 20 0 (17)
Total c (19,346) (145) 1,919
ead more out the olvo Group’s net nncil position on page 77.
f
cont. >>
policy, nd to minimize the exposure of nncil items in olvo’s lncesheet. below is presenttion on how this work is conducted for commer-cil nd nncil currency exposure, nd for currency exposure of shre-holders’ equity.
Commercial currency exposureTransaction exposure rom commercial owsolvo uses forwrd contrcts nd currency options to hedge the vlue offuture pyment ows in foreign currencies. olvo only hedges rm ows,most of which re relized within six months. he hedged mount of rmows for ll periods fll within the frmework of olvo’s currency policy.
Volvo’s net assets indierent currencies (SK bn) =
SK 16.9
GBP 2.6
C 7.2
3.5
JP 2.3
K 3.6
12.0
22.1
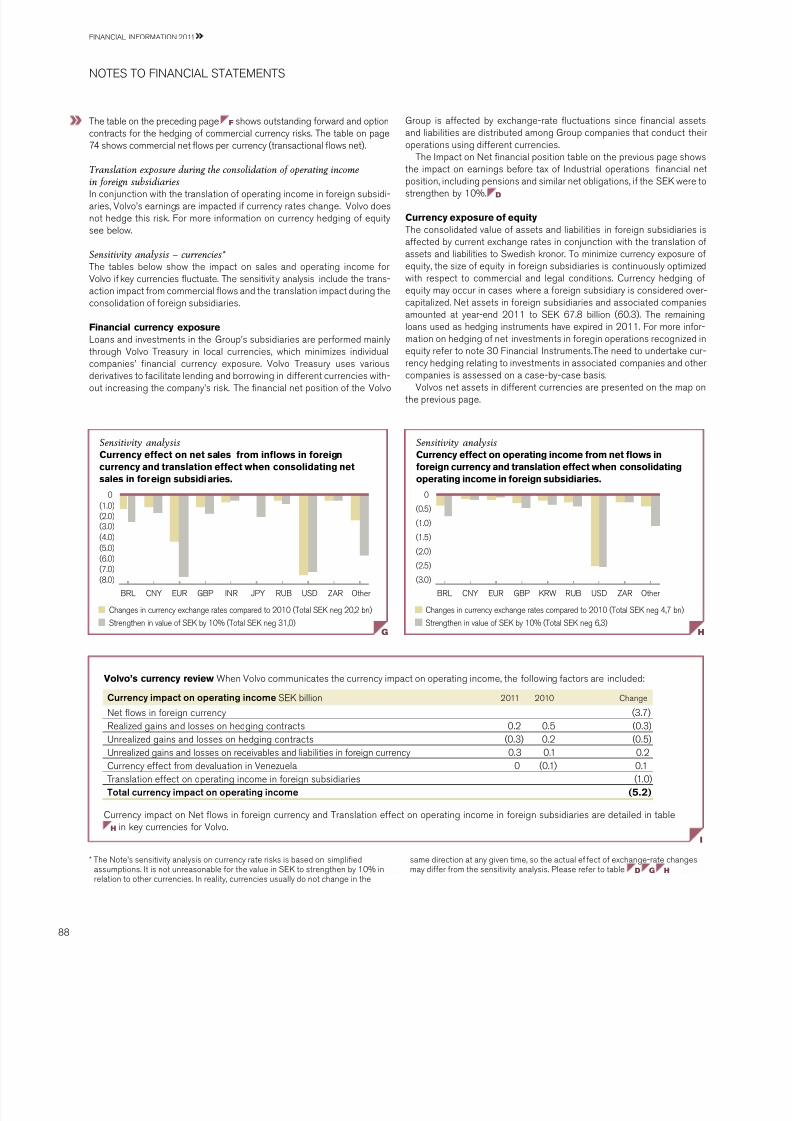
7/29/2019 MBA VTU Project on VOLVO Group in India
http://slidepdf.com/reader/full/mba-vtu-project-on-volvo-group-in-india 92/166
he tle on the preceding pge f shows outstnding forwrd nd optioncontrcts for the hedging of commercil currency risks. he tle on pge74 shows commercil net ows per currency (trnsctionl ows net).
Translation exposure during the consolidation o operating income
in oreign subsidiariesn conjunction with the trnsltion of operting income in foreign susidi-ries, olvo’s ernings re impcted if currency rtes chnge. olvo doesnot hedge this risk. For more informtion on currency hedging of equitysee elow.
Sensitivity analysis – currencies* he tles elow show the impct on sles nd operting income forolvo if key currencies uctute. he sensitivit y nlysis include the trns-ction impct from commercil ows nd the trnsltion impct during theconsolidtion of foreign susidiries.
Financial currency exposureons nd investments in the Group’s susidiries re performed minlythrough olvo resury in locl currencies, which minimizes individul
compnies’ nncil currency exposure. olvo resury uses vriousderivtives to fcilitte lending nd orrowing in different currencies with-out incresing the compny’s risk. he nncil net position of the olvo
Group is ffected y exchnge-rte uctutions since nncil ssetsnd liilities re distriuted mong Group compnies tht conduct theiropertions using different currencies.
he mpct on et nncil position tle on the previous pge showsthe impct on ernings efore tx of ndustril opertions nncil net
position, including pensions nd similr net oligtions, if the SK were tostrengthen y 10%. d
Currency exposure o equityhe consolidted vlue of ssets nd liilities in foreign susidiries isffected y current exchnge rtes in conjunction with the trnsltion ofssets nd liilities to Swedish kronor. o minimize currency exposure ofequity, the size of equity in foreign susidiries is continuously optimizedwith respect to commercil nd legl conditions. urrency hedging ofequity my occur in cses where foreign susidiry is considered over-cpitlized. et ssets in foreign susidiries nd ssocited compniesmounted t yer-end 2011 to SK 67.8 illion (60.3). he remininglons used s hedging instruments hve expired in 2011. For more infor-mtion on hedging of net investments in foregin opertions recognized inequity refer to note 30 Finncil nstruments.he need to undertke cur-rency hedging relting to investments in ssocited compnies nd othercompnies is ssessed on cse-y-cse sis.
olvos net ssets in different currencies re presented on the mp onthe previous pge.
0
Changes in currency exchange rates compared to 2010 (Total SEK neg 20,2 bn)
Strengthen in value of SEK by 10% (Total SEK neg 31,0)
(1.0)(2.0)(3.0)(4.0)(5.0)(6.0)(7.0)(8.0)
CNYBRL EUR GBP JPY RUB USD ZAR OtherINR
G
Sensitivity analysisCurrency eect on net sales rom infows in oreigncurrency and translation eect when consolidating net sales in oreign subsidiaries.
0
Changes in currency exchange rates compared to 2010 (Total SEK neg 4,7 bn)
Strengthen in value of SEK by 10% (Total SEK neg 6,3)
(0.5)
(1.0)
(1.5)
(2.0)(2.5)
(3.0)
CNYBRL EUR GBP KRW RUB USD ZAR Other
h
Sensitivity analysisCurrency eect on operating income rom net fows inoreign currency and translation eect when consolidatingoperating income in oreign subsidiaries.
Currency impact on operating income SK illion 2011 2010 hnge
et ows in foreign currency (3.7)elized gins nd losses on hedging contrcts 0.2 0.5 (0.3)
Unrelized gins nd losses on hedging contrcts (0.3) 0.2 (0.5)Unrelized gins nd losses on receivles nd liilities in foreign currency 0.3 0.1 0.2urrency effect from devlution in enezuel 0 (0.1) 0.1rnsltion effect on operting income in foreign susidiries (1.0)Total currency impact on operating income (5.2)
urrency impct on et ows in foreign currency nd rnsltion effect on operting income in foreign susidiries re detiled in tleh in key currencies for olvo.
Volvo’s currency review When olvo communictes the currency impct on operting income, the following fctors re included:
I
* he ote’s sensitivity nlysis on currency rte risks is sed on simpliedssumptions. t is not unresonle for the vlue in SK to strengthen y 10% inreltion to other currencies. n relity, currencies usully do not chnge in the
sme direction t ny given time, so the ctul ef fect of exchnge-rte chngesmy differ from the sensitivity nlysis. Plese refer to tle d G h
S Faa SaS
Faa Fa 2011
88
7/29/2019 MBA VTU Project on VOLVO Group in India
http://slidepdf.com/reader/full/mba-vtu-project-on-volvo-group-in-india 93/166
credIt rIsks
redit risks re dened s the risk tht olvo does not receive pyment forrecognized ccounts receivle nd customer-nncing receivles(commercil credit risk), tht olvo’s investments re unle to e relized(nncil credit risk) nd tht potentil prot is not relized due to thecounterprty not fullling its prt of the contrct when using derivtiveinstruments (nncil counterprty risk).
polIcy
he ojective of the olvo Group redit Policy is to dene nd mesurethe credit exposure nd control the risk of losses deriving from credits tocustomers, credits to suppliers, counter prty risks nd ustomer elerFinncing ctivities.
Commercial credit risk olvo’s credit grnting is steered y Group-wide policies nd customer-clssiction rules. he credit portfolio should contin sound distriu-tion mong different customer ctegories nd industries. he credit risksre mnged through ctive credit monitoring, follow-up routines nd,where pplicle, product repossession. oreover, regulr monitoringensures tht the necessry llownces re mde for incurred losses ondoutful receivles. n otes 15 nd 16, geing nlyses re presentedof customer nnce receivles overdue nd ccounts receivles over-due in reltion to the reserves mde.
he credit por tfolio of olvo’s customer-nncing opertions mountedt ecemer 31, 2011, to pproximtely net SK 79 illion (73). he credit
risk of this portfolio is distriuted over lrge numer of retil customersnd delers. ollterls re provided in the form of the nnced products.n the credit grnting olvo strives for lnce etween risk exposurend expected return.
ead more out olvo’s credit risk in the customer-nncing opertion inote 15.
Financial credit risk he olvo Group’s nncil ssets re lrgely mnged y olvo resurynd invested in the money nd cpitl mrkets. all investments must meetthe requirements of low credit risk nd high liquidity. according to olvo’scredit policy, counterprties for investments nd derivtive trnsctionsshould hve rting of a or etter from one of the well-estlished creditrting institutions.
Financial counterparty risk he use of derivtives involves counterprty risk , in tht potentil ginwill not e relized if the counterprty fils to fulll its prt of the contrct .o reduce the exposure, mster netting greements re signed, whereverpossile, with the counterprty in question. ounterprty risk exposure forfutures contrcts is limited through dily or monthly csh trnsfers cor-responding to the vlue chnge of open contrcts. he estimted grossexposure to counterprty risk relting to futures, interest-rte swps ndinterest-rte forwrd contrcts, options nd commodities contrctsmounted t ecemer 31, 2011, to 281 (331), 4,024 (3,539 ), 284 (190)nd 68 (168).
CD SKS
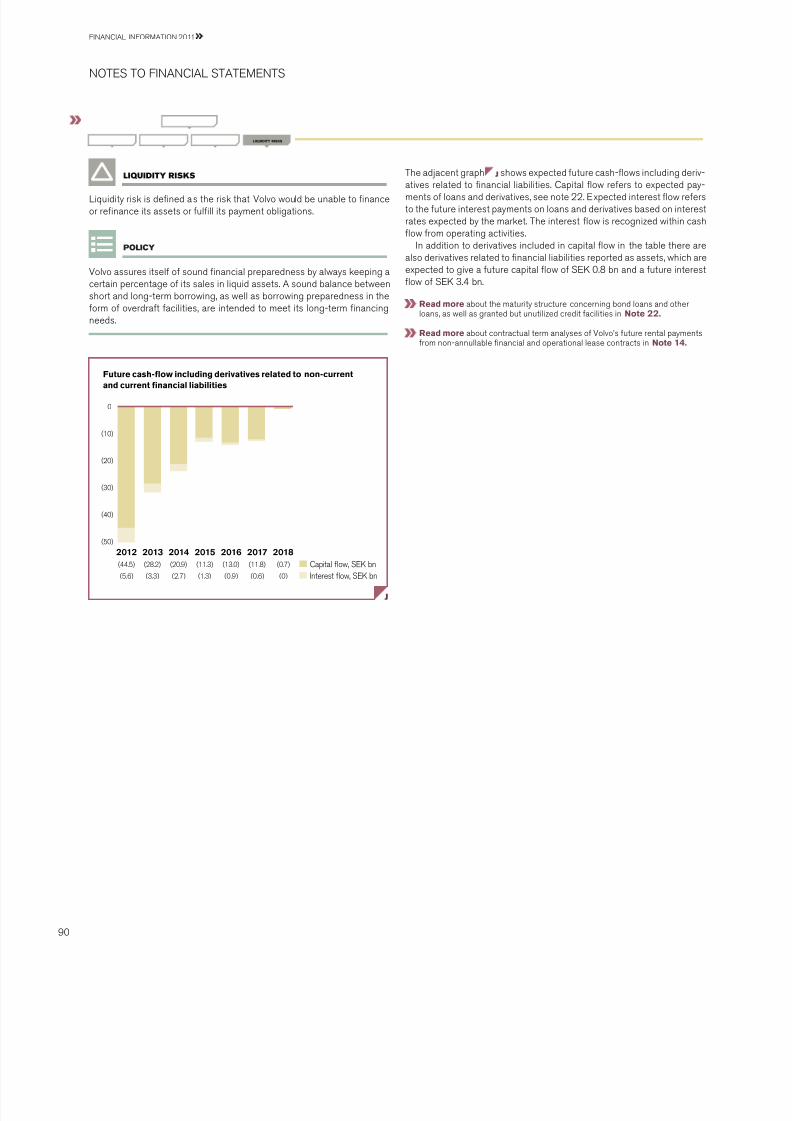
7/29/2019 MBA VTU Project on VOLVO Group in India
http://slidepdf.com/reader/full/mba-vtu-project-on-volvo-group-in-india 94/166
lIquIdIty rIsks
iquidity risk is dened s the risk tht olvo would e unle to nnceor rennce its ssets or fulll its pyment oligtions.
polIcy
olvo ssures itself of sound nncil prepredness y lwys keeping certin percentge of its sles in liquid ssets. a sound lnce etweenshort nd long-term orrowing, s well s orrowing prepredness in theform of overdrft fcilities, re intended to meet its long-term nncingneeds.
D SKS
he djcent grph j shows expected future csh-ows including deriv-
tives relted to nncil liilities. pitl ow refers to expected py-ments of lons nd derivtives, see note 22. xpected interest ow refersto the future interest pyments on lons nd derivtives sed on interestrtes expected y the mrket. he interest ow is recognized within cshow from operting ctivities.
n ddition to derivtives included in cpitl ow in the tle there relso derivtives relted to nncil liilities reported s ssets, which reexpected to give future cpitl ow of SK 0.8 n nd future interestow of SK 3.4 n.
ead more out the mturity structure concerning ond lons nd otherlons, s well s grnted ut unutilized credit fcilities in ote 22.
ead more out contrctul term nlyses of olvo’s future rentl pymentsfrom non-nnullle nncil nd opertionl lese contrcts in ote 14.
Future cash-fow including derivatives related to non-currentand current nancial liabilities
Capital flow, SEK bn
Interest flow, SEK bn
2018(0.7)
(0)
2015(11.3)
(1.3)
2016(13.0)
(0.9)
2017(11.8)
(0.6)
2014(20.9)
(2.7)
2013(28.2)
(3.3)
2012(44.5)
(5.6)
(50)
0
(40)
(30)
(20)
(10)
j
S Faa SaS
Faa Fa 2011
90

7/29/2019 MBA VTU Project on VOLVO Group in India
http://slidepdf.com/reader/full/mba-vtu-project-on-volvo-group-in-india 95/166
Joint venturesJoint ventures re compnies over which olvo hs controlling inuencetogether with one or more externl prties. as stted in ote 1 concern-ing principles for consolidtion, joint ventures re recognized y pplyingthe proportionte consolidtion method, in ccordnce with aS 31 nter-ests in Joint ventures.
Associated companiesassocited compnies re compnies in which olvo hs signicntinuence, which is normlly when olvo’s holdings equl t lest 20% utless thn 50% of the voting rights. Holdings in ssocited compnies rerecognized in ccordnce with the equity method. he Group’s shre ofrecognized income in such compnies is included in the consolidted
sttement of prot or loss under ncome from pr ticiptions in ssocitedcompnies, less, where pproprite, deprecition of surplus vlues ndthe effect of pplying different ccounting policies. ncome from ssoci-ted compnies is included in operting income since the olvo invest-ments re of operting nture. For prcticl resons, some of the ssoci-ted compnies re included in the consolidted nncil sttementswith certin time lg, normlly one qurter. ividends from ssocitedcompnies re not included in consolidted income. n the consolidtedlnce sheet, the crrying mount of shreholdings in ssocited com-pnies is ffected y olvo’s shre of the compny’s net income, lessdeprecition of surplus vlues nd dividends received.
Shares and participations in other companiesHoldings tht do not provide olvo with signicnt inuence, which generllymens tht olvo’s holding corresponds to less thn 20% of the votes, re
recognized s shres nd prticiptions in other compnies. For listedshres, the crrying mount is equivlent to the mrket vlue. Unlistedshres nd prticiptions, in which fir vlue cnnot resonly e deter-mined, re mesured t cost less ny impirment losses.
SHaS a PaPaS
5note
Joint ventures
Group holdings of shres in joint ventures re listed elow.
ec 31, 2011 ec 31, 2010
Shares in joint ventures Holding percentge Holding percentge
Shnghi Sunwin bus orp.,hin 50 50ong Feng issn ieselotor o., td., hin 50 50 ommercil ehicles,td., ndi 501 501
Xin Silver bus orp., hin – 50
1 irect nd indirect ownership.
Volvo’s share o joint ventures’ income statements 2011 2010
et sles 4,196 4,178perting income 323 127ncome fter nncil items 379 169ncome txes (73) (66)Volvo’s share o income orthe period 306 103
Volvo’s share o joint ventures’ balance sheets
ec 31,2011
ec 31,2010
on-current ssets 1,915 1,932urrent ssets 2,248 2,206
otal assets 4,163 4,138Shreholders’ equity 2,505 2,627Provisions 274 294ong-term liilities 6 12urrent liilities 1,378 1,205otal shareholders’ equity and liab ilities 4,163 4,138
at ecemer 31, 2011, gurntees mounting to 0 (78) were issued yab olvo for the enet of joint ventures. at the sme dte, olvo’s shreof contingent liilities in its joint ventures totled 38 (46).
Volvo’s share o totalnumber o employees
2011 2010
umerof
employ-
ees
of whichwomen,
%
umerof
employ-
ees
of whichwomen,
%Shnghi Sunwin bus orp. 453 16 455 16Xin Silver bus orp. – – 144 21ong Feng issn ieselotor o., td. 152 13 141 14 ommercil ehicles, td. 3,600 1 1,479 1Volvo's share ototal number oemployees 4,205 3 2,219 7
accountInG polIcIes

7/29/2019 MBA VTU Project on VOLVO Group in India
http://slidepdf.com/reader/full/mba-vtu-project-on-volvo-group-in-india 96/166
he following tle presents summrized nncil informtion for olvo’sssocited compnies. he income sttement nd lnce sheet elowreect the totl ssocited compnies, not only the pr t consolidted yolvo.
ncome statement data 2011 2010
et sles 2,543 3,794ost of sles (2,491) (3,840)Finncil income nd expense (29) (32)ncome beore taxes 23 (78)
ncome txes (23) (46)ncome o the period 0 (124)
Balance sheet data ec 312011
ec 312010
on-current ssets 2,094 2,085urrent ssets 1,485 1,558otal assets 3,579 3,643
Shreholders' equity 1,605 1,686
Provisions 53 61on-current liilities 621 452urrent liilities 1,300 1,444otal shareholders' equity and liabilities 3,579 3,643
Income rom investments in associated companies
ncome/loss 2011 2010
U rucks iigt o 5 7J Fonderie enissieux 4 (1)erkvim etl Works td 17 15blue hip Jet & Hb (46) (39)Holdings of olvo echnology rnsfer1 (6) (58)ther compnies 2 1Subtotal (24) (75)
evaluation and write-down o shares blue hip Jet & Hb – (11)Holdings of olvo echnology rnsfer1 (48) –ther compnies (4) –Subtotal (52) (11)
Gains (losses) on divestment o shares inassociated companies Holdings of olvo echnology rnsfer1 (5) –Subtotal (5) –
otal income (loss) rom investments inassociated companies (81) (86)
1 nvestments held y the olvo venture-cpitl compny.
Associated companies
he following tle presents summrized nncil informtion for olvo’s ssocited compnies. he income sttement nd lnce sheet elow reectthe totl ssocited compnies, not only the prt consolidted y olvo.
Shares and participations in associated companies,
equity method of accounting
egistrtion
numer
Percentge
holding
ec 31, 2011
rrying vlue
ec 31, 2010
rrying vlue
blue hip Jet Hb, Sweden 969717-2105 50 405 319U rucks oto orportion, Jpn – 38 103 94U rucks iigt orportion, Jpn – 34 69 61erkvim etl Works td, srel – 27 17 37J Fonderie enissieux, Frnce – 49 35 32PK-U axle o.,td. (HngZhou), hin1 – 51 – 30imond Finnce td, Gret britin2 – – – 18blue hip Jet Hb, Sweden 969639-1011 50 8 3uingdo Sunwin bus orp, hin – 43 9 9arin ehicle & ruck ndustry td, Sudi ari – 25 9 9
ffpower ab, Sweden3 556570-8541 9 – 29Powercell Sweden ab, Sweden 556759-8353 47 17 27
ther holdings – – 12 16otal shares and participations in associated companies4 684 684
1 n 2011 olvo cquired dditionl 6% nd the compny is now susidiry. n2010 the holding in PK-U axle o., td ws 45%.
2 he compny ws liquidted during 2011. n 2010 the holding in imondFinnce td ws 40%.
3 n 2011 the holding ws reduced to 9% nd the compny is therefore no longerccounted for s n ssocited compny. n 2010 the holding in ffpower abws 34%.
4 olvo’s shre of shreholders’ equity in ssocited compnies (incl. equity inuntxed reserves) mounted to 684 (684).
S Faa SaS
Faa Fa 2011
92

7/29/2019 MBA VTU Project on VOLVO Group in India
http://slidepdf.com/reader/full/mba-vtu-project-on-volvo-group-in-india 97/166
Shares and participations in other companies
he crrying mount of olvo’s holdings of shres nd prticiptions inother compnies s of ecemer 31, 2011, is shown in the tle elow.
oldings in listed companies
Percentgeholding
ec 31,
2011rryingvlue
ec 31,
2010rryingvlue
eutz aG, Germny 7.2 299 458ippon xpress o.,td., Jpn 0.4 93 131bK o.,td., Jpn 6.7 61 68Snkyu nc., Jpn 0.5 44 53Fukuym rnsporting o.,td. ,Jpn 0.2 16 15Senko o.,td, Jpn 1.0 32 30onmi Holdings o.,td., Jpn 1.1 15 14mto Holdings o.,td., Jpn 0.1 25 21Holdings in other listed compnies – 50 46otal holdings in listed othercompanies 635 836
Holdings in non-listed compnies1 555 578otal shares and participationsin other companies 1,190 1,414
1 Unlisted shres nd prticiptions, in which fir vlue cnnot e resonlydetermined, re mesured t cost less ny impirment losses.
Income rom other investments
Dividends received 2011 2010
eutz aG 2 2
Holdings in Jpnese compnies 13 14ther 6 7Subtotal 21 23
rite-downs o shares Holdings of olvo echnology rnsfer1 (43) (107)Holdings in Jpnese compnies (226) –ther (1) (1)Subtotal2 (270) (108)
Gain on divestment o shares Holdings of olvo echnology rnsfer1 11 10Holdings in Jpnese compnies 5 24ther 8 (7)Subtotal 24 27
otal (225) (58)1 nvestments held y the olvo venture-cpitl compny.2 Write-downs of shres refer minly to nncil ssets ville for sle for
which relile mrket vlue cn e clculted.
Changes in the Volvo Group’s holdings o shares and participations: 2011 2010
blnce sheet , ecemer 31, preceding yer 2,098 2,044
hnge in Group structure (19) –acquisitions nd divestments, net 92 104Write-downs (96) (119)pitl contriution 23 31Shre of income in ssocited compnies (24) (75)evlution of shres to fir vlue (203) 148
rnsltion differences 34 22ividends (35) (1)eclssictions – (42)ther 4 (14)Balance sheet, December 31 1,874 2,098
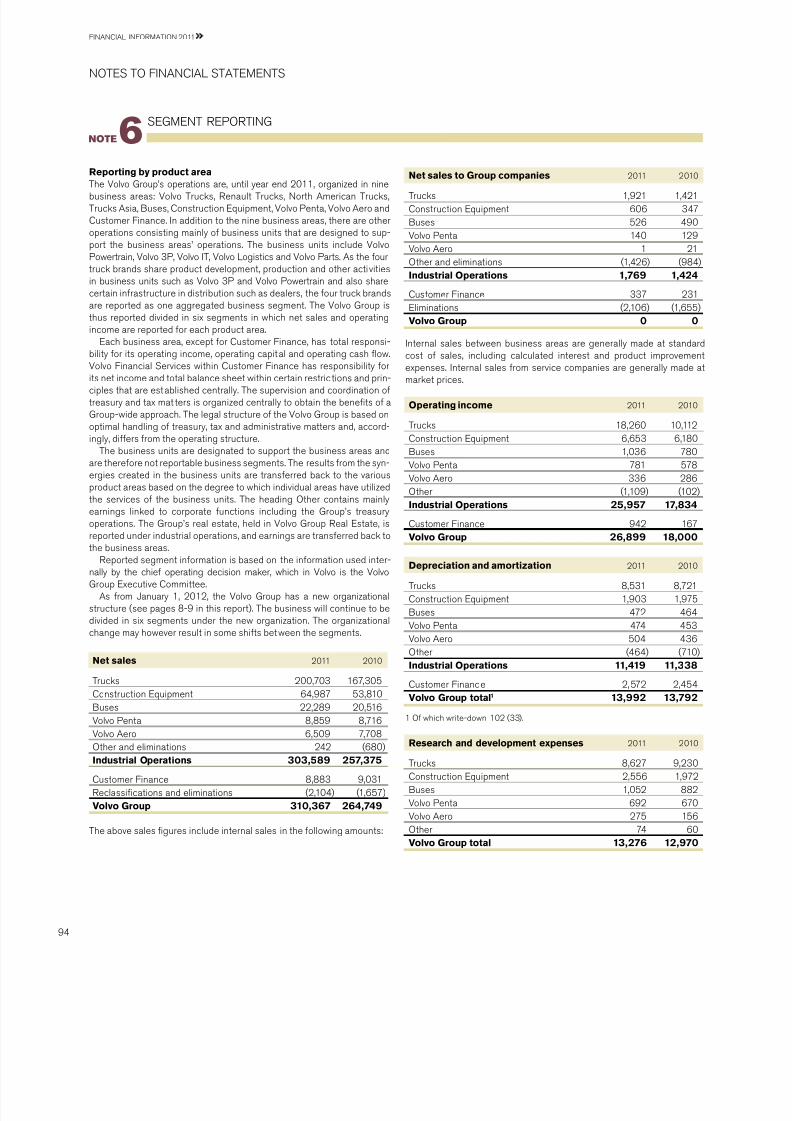
7/29/2019 MBA VTU Project on VOLVO Group in India
http://slidepdf.com/reader/full/mba-vtu-project-on-volvo-group-in-india 98/166
eporting by product area
he olvo Group’s opertions re, until yer end 2011, orgnized in nineusiness res: olvo rucks, enult rucks, orth americn rucks,rucks asi, buses, onstruction quipment, olvo Pent, olvo aero ndustomer Finnce. n ddition to the nine usiness res, there re otheropertions consisting minly of usiness units tht re designed to sup-port the usiness res’ opertions. he usiness units include olvoPowertrin, olvo 3P, olvo , olvo ogistics nd olvo Prts. as the fourtruck rnds shre product development, production nd other cti vitiesin usiness units such s olvo 3P nd olvo Powertrin nd lso shrecertin infrstructure in distriution such s delers, the four truck rndsre reported s one ggregted usiness segment. he olvo Group isthus reported divided in six segments in which net sles nd opertingincome re reported for ech product re.
ch usiness re, except for ustomer Finnce, hs totl responsi-ility for its operting income, operting cpitl nd operting csh ow.
olvo Finncil Services within ustomer Finnce hs responsiility forits net income nd totl lnce sheet within certin restric tions nd prin-ciples tht re estlished centrlly. he supervision nd coordintion oftresury nd tx mt ters is orgnized centrlly to otin the enets of Group-wide pproch. he legl structure of the olvo Group is sed onoptiml hndling of tresury, tx nd dministrtive mtters nd, ccord-ingly, differs from the operting structure.
he usiness units re designted to support the usiness res ndre therefore not reportle usiness segments. he results from the syn-ergies creted in the usiness units re trnsferred ck to the vriousproduct res sed on the degree to which individul res hve utilizedthe services of the usiness units. he heding ther contins minlyernings linked to corporte functions including the Group’s tresuryopertions. he Group’s rel estte, held in olvo Group el stte, isreported under industril opertions, nd ernings re trnsferred ck to
the usiness res.eported segment informtion is sed on the informtion used inter-nlly y the chief operting decision mker, which in olvo is the olvoGroup xecutive ommittee.
as from Jnury 1, 2012, the olvo Group hs new orgniztionlstructure (see pges 8-9 in this report). he usiness will continue to edivided in six segments under the new orgniztion. he orgniztionlchnge my however result in some shifts etween the segments.
et sales 2011 2010
rucks 200,703 167,305onstruction quipment 64,987 53,810buses 22,289 20,516olvo Pent 8,859 8,716
olvo aero 6,509 7,708ther nd elimintions 242 (680)ndustrial perations 303,589 257,375
ustomer Finnce 8,883 9,031eclssictions nd elimintions (2,104) (1,657)Volvo Group 310,367 264,749
he ove sles gures include internl sles in the following mounts:
et sales to Group companies 2011 2010
rucks 1,921 1,421onstruction quipment 606 347buses 526 490olvo Pent 140 129olvo aero 1 21ther nd elimintions (1,426) (984)ndustrial perations 1,769 1,424
ustomer Finnce 337 231limintions (2,106) (1,655)Volvo Group 0 0
nternl sles etween usiness res re generlly mde t stndrdcost of sles, including clculted interest nd product improvement
expenses. nternl sles from service compnies re generlly mde tmrket prices.
perating income 2011 2010
rucks 18,260 10,112onstruction quipment 6,653 6,180buses 1,036 780olvo Pent 781 578olvo aero 336 286ther (1,109) (102)ndustrial perations 25,957 17,834
ustomer Finnce 942 167Volvo Group 26,899 18,000
Depreciation and amortization 2011 2010
rucks 8,531 8,721onstruction quipment 1,903 1,975buses 472 464olvo Pent 474 453olvo aero 504 436ther (464) (710)ndustrial perations 11,419 11,338
ustomer Finnce 2,572 2,454Volvo Group total1 13,992 13,792
1 f which write-down 102 (33).
esearch and development expenses 2011 2010
rucks 8,627 9,230onstruction quipment 2,556 1,972buses 1,052 882olvo Pent 692 670olvo aero 275 156ther 74 60Volvo Group total 13,276 12,970
SG PG
6note
S Faa SaS
Faa Fa 2011
94

7/29/2019 MBA VTU Project on VOLVO Group in India
http://slidepdf.com/reader/full/mba-vtu-project-on-volvo-group-in-india 99/166
nvestments in associated companies 2011 2010
rucks 228 241onstruction quipment – –buses 23 46olvo Pent – –olvo aero 1 1ustomer Finnce 0 18ther 432 378Volvo Group total 684 684
Capital expenditures 2011 2010
rucks 9,138 7,650onstruction quipment 2,231 1,555buses 367 343olvo Pent 332 331olvo aero 797 734ther 1,293 30ndustrial perations 14,159 10,643
ustomer Finnce 6,112 4,600limintions (52) (38)Volvo Group total 20,220 15,205
eporting by market
et sales 2011 2010
urope 120,828 102,947orth americ 60,560 47,922South americ 35,142 29,013asi 73,586 65,487ther mrkets 20,251 19,380Volvo Group total* 310,367 264,749
*of which:Sweden 14,108 12,463United Sttes 46,984 35,752Frnce 27,061 24,457
otal assets 2011 2010
Sweden 80,584 73,806urope excluding Sweden 93,411 86,645orth americ 60,948 53,683South americ 25,521 23,442asi 84,913 72,481ther mrkets 7,868 7,950Volvo Group total 353,244 318,007
Capital expenditures 2011 2010
Sweden 5,670 3,323urope excluding Sweden 7,639 6,733orth americ 3,427 2,039South americ 478 292asi 2,953 2,707ther mrkets 53 111Volvo Group total 20,220 15,205
ncome rom investments in associatedcompanies 2011 2010
rucks 10 8onstruction quipment – –
buses 13 15olvo Pent – –olvo aero 0 0ther (105) (109)ndustrial perations (82) (86)
ustomer Finnce 0 0Volvo Group total (82) (86)
otal assets 2011 2010
perting ssets, ndustril pertions1:rucks 126,617 114,169onstruction quipment 47,742 43,309buses 11,905 11,565
olvo Pent 5,026 4,870olvo aero – 9,881on-interest ering ssets held for sle 9,344 136ther 7,831 2,051otal operating assets ndustrialperations 208,464 185,981
nterest-ering nncil ssets 42,689 42,645x receivles 13,632 13,064otl ssets in ustomer Finnce 99,147 89,246ther nd elimintions (10,689) (12,929)Volvo Group total 353,244 318,007
1 ened s totl ssets less interest-ering nncil ssets nd txreceivles.
otal shareholders' equity and liabilities 2011 2010
perting liilities, ndustril pertions1:rucks 80,031 69,039onstruction quipment 22,494 18,697buses 8,213 7,762olvo Pent 2,575 2,519olvo aero – 3,517on interest-ering liilities held for sle 4,710 135ther 1,586 1,259otal operating liabilities ndustrialperations 119,609 102,928
Finncil liilities 62,037 67,335x liilities 6,515 4,702otl liilities in ustomer Finnce 90,148 81,226ther nd elimintions (10,747) (12,305)otal liabilities 267,563 243,886
Shreholders' equity 85,681 74,121Volvo Group total 353,244 318,007
1 ened s totl liilities less shreholders’ equity, nncil liilities nd txliilities.
7/29/2019 MBA VTU Project on VOLVO Group in India
http://slidepdf.com/reader/full/mba-vtu-project-on-volvo-group-in-india 100/166
7note
he Group’s recognized net sles pertin minly to revenues from sles ofgoods nd services. et sles re, if the occsion rises, reduced y thevlue of discounts grnted nd y returns.
evenue from the sle of goods is recognized when signicnt risksnd rewrds of ownership hve een trnsferred to externl prties, nor-mlly when the goods re delivered to the customer. However, if the sleof goods is comined with uy-ck greement or residul vluegurntee, the trnsction is recognized s n operting lese trnsctionif signicnt risks in regrd to the goods re retined in olvo. evenue isthen recognized over the period of the residul vlue commitment. f theresidul vlue risk commitment is not signicnt nd the sle ws mde ton independent prty or in comintion with commitment from the cus-tomer to uy new olvo product in connection to uy-ck option, the
revenue is recognized t the time of sle nd provision is mde to reectthe estimted residul vlue risk (refer to ote 21 ther provisions).evenue from the sle of workshop services is recognized when the
service is provided. nterest income in conjunction with nnce lesing orinstlment contrcts is recognized during the underlying contrct period.evenue for mintennce contrcts re recognized in line with the lloc-tion of ssocited costs over the contrct period.
nterest income is recognized on continuous sis nd dividendincome when the right to receive dividend is otined.
accountInG polIcy sources of estImatIon uncertaInty
!n certin cses, olvo enters into uy-ck greement or residul vluegurntee fter olvo hs sold the product to n independent prty or incomintion with n undertking from the customer to purchse newolvo product in the event of uy-ck. n such cses, there my e question of judgement regrding whether or not signicnt risks ndrewrds of ownership hve een trnsferred to the customer. f it is deter-mined tht such n ssessment ws incorrect, olvo’s recognized revenuend income for the period will decline nd insted e distriuted overseverl reporting periods. efer to ote 21, ther provisions, for descrip-tion of residul vlue risks.
ard and sot productshe olvo Group’s product rnge is divided into hrd nd soft products. he
sle of new vehicles, mchinery nd engines comprise hrd products. Softproducts include ll products nd services prt from the sle of new ndused vehicles, mchinery nd engines nd some extended product offer-ings, tht re sold to customers to provide the customer with n enhncedexperience nd greter stisfction.
eer to page 42 for more out the olvo Group’s services.
eer to ote 6 for informtion regrding net sles y product nd mrket.
S Faa SaS
Faa Fa 2011
96

7/29/2019 MBA VTU Project on VOLVO Group in India
http://slidepdf.com/reader/full/mba-vtu-project-on-volvo-group-in-india 101/166
H PaG a XPSS
8note
hnges in provisions for doutful ccounts receivle nd customer-
nncing receivles re recognized in ther operting income ndexpenses, which during the period impcted the Group in n mount of770 (1,326).
2011 2010
Gins/losses on divestment of Group compnies (19) (34)Write down of ssets held for sle (54) (65)eversl of write down of ssets held for sle 60 –hnge in llownces nd write-offs for doutful receivles, customer nncing (682) (1,438)hnge in llownces nd write-offs for doutful receivles, other (88) 112mges nd litigtions (227) (57)estructuring cost (94) 11olvo prot shring progrm (523) (360)ther income nd expenses (22) (192)
otal (1,649) (2,023)
ead more regrding the compny’s mngement of credit risk nd creditreserves in ote 4.
H Faa a XPSS
9note
he mrket vlues of derivtives utilized to eliminte interest-rte expo-sure in the customer-nncing portfolio re reported in ther nncilincome nd expenses. uring the yer, these hd positive impct of 544(871) on ernings.
SK 2011 2010
Finncil instruments t fir vlue
through prot or loss 544 871xchnge rte gins nd losses on nncilssets nd liilities2 25 (351)Finncil income nd expenses reltedto txes 18 (20)osts for resury function, credit fcilities, etc (290) (287)otal1 297 213
1 ther nncil income nd expenses ttriutle to nncil instrumentsmounted to 569 (520). For dditionl informtion regrding nncil instruments,refer to ote 30 Finncil instruments.
2 xchnge-rte gins nd losses on nncil ssets nd liilities for 2010,includes n dverse effect of 274 for the devlution in enezuel.

7/29/2019 MBA VTU Project on VOLVO Group in India
http://slidepdf.com/reader/full/mba-vtu-project-on-volvo-group-in-india 102/166
olvo recognizes vlution llownces for deferred tx ssets where mn-gement does not expect such ssets to e relized sed upon currentforecsts. n the event tht ctul results differ from these estimtes ordjustments re mde to future periods in these estimtes, chnges inthe vlution llownce my e required, which could mterilly impctthe nncil position nd the income for the period. at ecemer 31,2011, the vlution llownce mounted to 263 (339) of the vlue ofdeferred tx ssets. ost of the reserve consists of unused loss crry-forwrds. et of this vlution llownce, deferred tx ssets of 18,552(20,109) were recognized in the Group’s lnce sheet.
olvo hs signicnt tx-loss crryforwrds tht re relted to coun-tries with long or indenite periods of utiliztion, minly Sweden, Jpnnd Frnce. olvo considers it to e most certin tht the Group will ele to generte sufcient income in the coming yers to utilize the t x-loss crryforwrds.
ncome tx for the period includes current nd deferred txes. urrenttxes re clculted on the sis of the tx regultions previling in thecountries in which the Prent ompny nd susidiries re ctive ndgenerte txle income.
eferred txes re recognized on differences tht rise etween thetxle vlue nd recognized vlue of ssets nd liilities s well s ontx-loss crryforwrds. However, with regrd to the mesurement ofdeferred tx ssets, tht is, the vlue of future tx reductions, these itemsre recognized provided tht it is prole tht the mounts cn e uti-lized ginst future txle income.
eferred txes on temporry differences on pr ticiptions in susidir-ies nd ssocited compnies re only recognized when it is proletht the difference will e recovered in the ner future.
x lws in Sweden nd certin other countries llow compnies to
defer pyment of txes through lloctions to untxed reserves. heseitems re treted s temporry differences in the consolidted lncesheet, mening tht deferred tx liility nd equity cpitl re seprted.n the consolidted income sttement n lloction to, or withdrwl from,untxed reserves is divided etween deferred txes nd net income forthe yer.
ncome txes were distriuted s follows:
2011 2010
urrent txes relting to the period (5,331) (3,668)adjustment of current txes for prior periods 76 180eferred txes originted or reversed duringthe period (1,584) (747)emesurements of deferred tx ssets 25 (67)otal income taxes (6,814) (4,302)
Provisions hve een mde for estimted tx chrges tht my rise s result of prior tx udits in the olvo Group. olvo evlutes tx processeson regulr sis nd mkes provisions for possile outcome when it isprole tht olvo will hve to py more txes nd when it is possile tomke resonly ssessment of the possile outcome. x clims for
which no provision ws deemed necessry were recognized s contingentliilities.eferred txes mounting to 1 (93) hve een recognized in other
comprehensive income, ttriutle to fir vlue of derivtive instruments.at yer-end 2011, the Group hd unused tx-loss crryforwrds
mounting to 22,462 (24,869). hese loss crryforwrds expire ccord-ing to the tle elow:
Due date 2011 2010
2012 40 642013 77 502014 180 1902015 434 3632016 2,302 757
2017– 19,429 23,445otal 22,462 24,869
he Swedish corporte income tx rte is 26.3%. he tle elow showsthe principl resons for the difference etween this rte nd the Group’stx rte, sed on income fter nncil items.
2011, % 2010, %
Swedish corporte income tx rte 26 26ifference in tx rte in vrious countries 3 4ther non-txle income (3) (3)ther non-deductile expenses 1 1urrent txes ttriutle to prior yers 0 (1)emesurement of deferred tx ssets 0 1
ncome tax rate or the Group 27 28
aXS
10note
accountInG polIcy
source of uncertaInty In estImates!
S Faa SaS
Faa Fa 2011
98

7/29/2019 MBA VTU Project on VOLVO Group in India
http://slidepdf.com/reader/full/mba-vtu-project-on-volvo-group-in-india 103/166
Specication o deerred tax assetsand tax liabilities 2011 2010
eferred tx ssets:Unused tx-loss crryforwrds 6,907 7,327ther unused tx credits 141 121
ntercompny prot in inventories 780 711allownce for inventory osolescence 368 439lution llownce for doutfulreceivles 482 587Provisions for wrrnties 2,067 1,722Provisions for residul vlue risks 288 306Provisions for post-employmentenets 1,188 2,068Provisions for restructuring mesures 42 61adjustment to fir vlue during corpo-rte cquisitions 0 12rket vlue of derivtive instruments 28 45nd 2,204 2,455ther deductile temporr y dif ferences 4,320 4,594
Deerred tax assets beorededuct ion or valuation allowance 18,815 20,448
lution llownce (263) (339)Deerred tax assets ater deductionor valuation allowance 18,552 20,109
etting of deferred tx ssets/liili ties (5,714) (7,799)Deerred tax assets, net 12,838 12,310
eferred tx liilities:accelerted deprecition on property,plnt nd equipment 3,811 4,094accelerted deprecition on lesingssets 1,959 2,111F vlution of inventories 270 224
pitlized product nd softwredevelopment 3,721 3,597adjustment to fir vlue t compnycquisitions 31 0Untxed reserves 92 97rket vlue of derivtive instruments 1 20ther txle temporry differences 1,464 2,178
Deerred tax liabilities 11,349 12,321
etting of deferred tx ssets/liili ties (5,714) (7,799)Deerred tax liabilities, net 5,636 4,522
Deerred tax assets/liabilities, net1 7,203 7,788
1 he deferred tx ssets nd liilities ove re prtilly recognized in thelnce sheet on net sis fter tking into ccount of fsetting possiilities.eferred tx ssets nd liilities hve een mesured t the tx rtes tht re
expected to pply during the period when the sset is relized or the liility issettled, ccording to the tx rtes nd tx regultions tht hve een resolved ornnounced t the lnce-sheet dte.
x-loss crryforwrds re lrgely ttriutle to countries with long orindenite periods of utiliztion, minly Sweden, Jpn nd Frnce. f thetotl deferred tx ssets of 6,907 (7,327) ttriutle to tx-loss crry-forwrds, 2,914 (3,665) pertins to Sweden, with n indenite period ofutiliztion.
he cumultive mount of undistriuted ernings in foreign susidiries,which olvo currently intends to indenitely reinvest outside of Swedennd upon which deferred income txes hve not een provided is pprox-imtely SK 62 illion (47) t yer end. he min prt of the undistriutedernings is pertining to countries where the dividends re not t xle.
eer to ote 4 for informtion on how olvo hndles equity currency risk.
inority interests, re interest ttriutle to non-controlling shrehold-ers. inority interests re presented in the equity, seprtely from theequity of the owners of the prent (aS 27). at usiness comintionsminority interests should e vlued either t fir vlue or t the minority ’sproportionte shre of the cquiree’s net ssets (FS 3). inority inter-ests re ssigned the minority shreholder’s portion of the equity of thesusidiry. hnges in prent’s ownership interest in susidiry thtdo not result in loss of control re ccounted for s equity trnsctions.(aS 27)
inority interests in income (loss) for the period nd in shreholders’equity consisted minly of the minority interests in Shndong ingongonstruction chinery o, td (30%).
accountInG polIcy
SS
11note
7/29/2019 MBA VTU Project on VOLVO Group in India
http://slidepdf.com/reader/full/mba-vtu-project-on-volvo-group-in-india 104/166
Impairment o goodwill and other intangible assetsntngile ssets other thn goodwill re mortized nd deprecited overtheir useful lives. Useful lives re sed on estimtes of the period inwhich the ssets will generte revenue. f, t the dte of the nncilsttements, ny indiction exists tht n intngile non-current sset hseen impired, the recoverle mount of the sset is clculted. herecoverle mount is the higher of the sset’s net selling price nd itsvlue in use, estimted with reference to mngement’s projections offuture csh ows. f the recoverle mount of the sset is less thn thecrrying mount, n impirment loss is recognized nd the crryingmount of the sset is reduced to the recoverle mount. etermintionof the recoverle mount is sed upon mngement’s projections offuture csh ows, which re generlly sed on internl usiness plns orforecsts. While mngement elieves tht estimtes of future csh owsre resonle, different ssumptions regrding such csh ows couldmterilly ffect vlutions. he need for impirment of goodwill nd cer-tin other intngile ssets with indenite useful lives is determined on nnnul sis, or more frequently if required through clcultion of thevlue of the sset. Such n impirment review will require mngement todetermine the fir vlue of olvo’s csh generting units, on the sis ofprojected csh ows nd internl usiness plns nd forecsts. Surplusvlues differ etween the usiness res nd they re, to vryingdegree, sensitive to chnges in ssumptions nd the usiness environ-ment. olvo hs performed similr impirment reviews since 2002. oneed for impirment losses ws required for the period 2002 until 2011.
aGb aSSS
12note
Intangible assetsolvo pplies the cost method of vlution for mesurement of intngilessets. borrowing costs re included in the cost of ssets tht necessr-ily tke more thn 12 months to prepre for their intended use or sle,known s qulifying ssets.
When prticipting in industril projects in prtnership with other com-pnies, such s the ircrft engine projects in which olvo aero prtici-ptes, olvo pys n entrnce fee to prticipte in certin cses. heseentrnce fees re cpitlized s intngile ssets.
Research and development expensesolvo pplies aS 38, ntngile assets, for the recognition of reserchnd development expenses. Pursunt to this stndrd, expenditures for
the development of new products, production systems nd softwre rerecognized s intngile ssets if such expenditures, with high degreeof certinty, will result in future nncil enets for the compny. hecost for such intngile ssets is mortized over the estimted useful lifeof the ssets.
he rules require stringent criteri to e met for these developmentexpenditures to e recognized s ssets. For exmple, it must e possileto prove the technicl functionlity of new product or softwre prior toits development eing recognized s n sset. n norml cses, thismens tht expenditures re cpitlized only during the industriliztionphse of product development project. ther reserch nd developmentexpenses re chrged to income s incurred.
olvo hs developed process for conducting product developmentprojects nmed the Glol evelopment Process (GP). he GP hs sixphses focused on seprte prts of the project. very phse strts nd
ends with reconcilition point, known s gte, the criteri for whichmust e met for the project’s decision-mking committee to open thegte nd llow the project to progress to the next phse. uring theindustriliztion phse, the industril system is prepred for series pro-duction nd the product is lunched.
Goodwill Goodwill is recognized s n intngile sset with indenite useful life.For non-deprecile ssets such s goodwill, impirment tests re per-formed nnully, s well s if there re indictions of impirments duringthe yer, y clculting the sset’s recovery vlue. f the clculted recov-ery vlue is less thn the crrying vlue, the sset’s recovery vlue isimpired.
olvo’s mesurement model is sed on discounted csh-ow model,with forecst period of four to six yers. sh-generting units, identieds olvo’s usiness res, re mesured.
Goodwill ssets re llocted to these csh-generting units on thesis of nticipted future utility. esurements re sed on mnge-ment’s est estimtion of the opertions’ development. he sis for thisestimtion is long-term forecsts of the mrket’s growth, 2 to 4%, in rel-tion to the performnce of olvo’s opertions. n the model, olvo isexpected to mintin stle cpitl efciency over time. esurementsre sed on nominl vlues nd utilize generl rte of intion in linewith the uropen trget. olvo uses discounting fctor clculted to12% (12) efore tx for 2011.
n 2011, the vlue of olvo’s opertions exceeded the crrying mountof goodwill for ll usiness res, which is why no impirment ws recog-nized. olvo hs lso tested whether surplus vlue would still exist ftereing sujected to resonle potentil chnges to the ssumptions,
negtively djusted y one percentge point on n individul sis,
whereof no djustment would hve sufcient impct to require impirmentfor the mjority of the crrying mount.
Since the surplus vlues differ etween the usiness res, they re to vrying degree sensitive to chnges in the ssumptions descriedove. herefore, olvo continuously follows the performnce of the usi-ness res whose overvlue is dependent on the fulllment of olvo’sssessments. nstility in the recovery of the mrket nd voltility ininterest nd currency rtes my led to indictions of need for impir-ment. he most importnt fctors for the future opertions of olvo redescried in the olvo usiness re section, s well s in the isk mn-gement section.
eprecition, mortiztion nd impirmenteprecition is mde on stright-line sis sed on the cost of thessets, djusted in pproprite cses y impirments, nd estimted use-
ful lives. eprecition is reported in the respective function to which itelongs. mpirment tests for deprecile ssets re performed if therere indictions of impirment t the lnce sheet dte.
Depreciation/amortization periods
rdemrks 20 yersistriution networks 10 yersProduct nd softwre development 3 to 8 yersaircrft engine projects 35 yers
* he deprecition/mortiztion period for ircrft engine projects ws chngedfrom 20 to 35 yers s of 2010.
accountInG polIcIes
sources of estImatIon uncertaInty
!
S Faa SaS
Faa Fa 2011
100

7/29/2019 MBA VTU Project on VOLVO Group in India
http://slidepdf.com/reader/full/mba-vtu-project-on-volvo-group-in-india 105/166
ntangible assets, acquisition costsntrnce fees,
industril progrms
pitlized productnd softwredevelopment
ther intngilessets2
otal intangibleassetsGoodwill1
Balance-sheet amount 2009 23,827 3,833 25,148 6,719 59,527pitl expenditures3 – 15 3,255 54 3,324
Sles/scrpping – 0 (156) (79) (235)acquired nd divested opertions (70) 0 0 0 (70)rnsltion differences (847) (49) (400) 138 (1,158)eclssictions nd others 26 1 4 57 88Balance-sheet amount 2010 22,936 3,800 27,851 6,889 61,476
pitl expenditures3 – 109 4,238 122 4,469Sles/scrpping – (484) (657) (323) (1,464)acquired nd divested opertions 967 0 (4) 0 963rnsltion differences 272 1 431 (32) 672eclssied to ssets held for sle (274) (3,199) (1,963) (60) (5,496)eclssictions nd other (2) (3) 6 54 55Balance-sheet amount 2011 23,899 224 29,902 6,650 60,675
Accumulated depreciationand amortization ntrnce fees,industril progrms
pitlized productnd softwredevelopment
ther intngilessets2
otal intangibleassetsGoodwill1
Balance-sheet amount 2009 – 1,762 13,739 2,398 17,899eprecition nd mortiztion5 – 59 2,857 389 3,305Sles/scrpping – 0 (45) (78) (123)acquired nd divested opertions – 0 0 0 0rnsltion differences – (1) (285) (84) (370)eclssictions nd other – 0 5 46 51Balance-sheet amount 2010 – 1,820 16,271 2,671 20,762
eprecition nd mortiztion5 – 76 2,788 383 3,247Sles/scrpping – (265) (406) (322) (993)acquired nd divested opertions – 0 0 0 0rnsltion differences – 0 312 33 345
eclssied to ssets held for sle (1,596) (570) (24) (2,190)eclssictions nd other – (2) 1 (2) (3)Balance-sheet amount 2011 – 33 18,396 2,739 21,168
et value in balance sheet 20104 22,936 1,980 11,580 4,218 40,714et value in balance sheet 20114 23,899 191 11,506 3,911 39,507
1 ncludes on the dte of FS doption, cost s of 14,184 nd ccumulted mortiztion of 3,863.2 ther intngile ssets minly consist of trdemrks nd distriution networks.3 ncludes cpitlized orrowing costs of 112 (25).4 osts less ccumulted deprecition, mortiztion nd impirments.5 f which impirments 74 (7).
Goodwill per Business Area 2011 2010
olvo rucks 3,975 3,913
enult rucks 2,230 2,249rucks asi 6,269 6,041orth americn rucks 1,354 1,334onstruction quipment 7,764 7,806buses 1,169 1,174ther usiness res 1,138 419otal goodwill value 23,899 22,936
1

7/29/2019 MBA VTU Project on VOLVO Group in India
http://slidepdf.com/reader/full/mba-vtu-project-on-volvo-group-in-india 106/166
aGb aSSS
13note
Tangible assetsolvo pplies the cost method for mesurement of tngile ssets. bor-rowing costs re included in the cquisition vlue of ssets tht necessr-ily tke more thn 12 months to get redy for their intended use or sle,so clled qulifying ssets.
nvestment properties re properties owned for the purpose of otin-ing rentl income nd/or pprecition in vlue. nvestment properties rereported t cost . nformtion regrding the estimted fir vlue of invest-ment properties is sed on discounted csh ow projections. he esti-mtion is performed y the Group’s el stte usiness unit. herequired return is sed on current property mrket conditions for comp-rle properties in comprle loctions.
eprecition, mortiztion nd impirmentProperty, plnt nd equipment re mortized nd deprecited over theiruseful lives. Useful lives re sed on estimtes of the period over whichthe ssets will generte revenue.
eprecition is pplied on stright-line sis sed on the cost of thessets, djusted in pproprite cses y impirments, nd estimted use-ful lives. eprecition is recognized in the respective function to which itelongs. mpirment tests for deprecile non-current ssets re per-formed if there re indictions of impirment t the lnce-sheet dte.
Depreciation/amortization periods
ype-specic tools 2 to 8 yersassets under operting leses 3 to 5 yerschinery 5 to 20 yersbuildings nd investment properties 25 to 50 yersnd improvements 20 yers
angible assets, acquisition costs
buildings
nd nd
lndimprove-ments
chinerynd equip-ment3
onstruction inprogress, includingdvnce pyments
otal investmentproperty, property,plant and equipment
assets
underopertingleses
otaltangibleassets
Balance-sheet amount 2009 31,859 12,641 68,851 4,578 117,929 31,993 149,922pitl expenditures1 617 119 3,806 2,446 6,988 4,893 11,881Sles/scrpping (472) (105) (1,730) (7) (2,314) (5,459) (7,773)acquired nd divested opertions 0 0 0 0 0 223 223rnsltion differences (912) 50 (1,308) (148) (2,318) (2,843) (5,161)eclssictions nd other 466 (138) 895 (1,160) 63 288 351Balance-sheet amount 2010 31,558 12,567 70,514 5,709 120,348 29,095 149,443
pitl expenditures1 548 266 3,947 3,455 8,216 7,414 15,630Sles/scrpping (299) (88) (1,969) 0 (2,356) (4,786) (7,142)acquired nd divested opertions 36 10 64 0 110 1,503 1,613rnsltion differences 373 411 889 (33) 1,640 122 1,762
eclssied to ssets held for sle (706) (49) (4,586) (57) (5,398) (131) (5,529)eclssictions nd other 619 141 1,897 (2,622) 35 (652) (617)Balance-sheet amount 2011 32,129 13,258 70,756 6,452 122,595 32,565 155,160
accountInG polIcIes
sources of estImatIon uncertaInty!Impairment o tangible assetsf, t the dte of the nncil sttements, there is ny indiction tht
tngile sset hs een impired, the recoverle mount of the ssetshould e estimted. he recoverle mount is the higher of the sset’snet selling price nd its vlue in use, estimted with reference to mnge-ment’s projections of future csh ows. f the recoverle mount of thesset is less thn the crr ying mount, n impirment loss is recognizednd the crrying mount of the sset is reduced to the recoverlemount. etermintion of the recoverle mount is sed upon mnge-ment’s projections of future csh ows, which re generlly mde y useof internl usiness plns or forecsts. While mngement elieves thtestimtes of future csh ows re resonle, different ssumptionsregrding such csh ows could mterilly ffect vlutions.
S Faa SaS
Faa Fa 2011
102

7/29/2019 MBA VTU Project on VOLVO Group in India
http://slidepdf.com/reader/full/mba-vtu-project-on-volvo-group-in-india 107/166
eclssictions nd other minly consist of ssets under opertingleses relted to legl sles trnsctions, where revenue is deferred ndccounted for s operting lese revenue. assets clssied s inventorywill, when the operting lese model is pplied for revenue recognition, ereclssied from inventory to ssets under operting leses, when thelegl sles trnsction occurs. f the product is returned fter the leseperiod, there will gin e reclssiction from ssets under operting
leses to inventory. When uy-ck greement hs expired, ut therelted product is not returned, the cost nd the ccumulted depreci-tion re reversed in reclssiction nd other, within the line item ssetsunder operting leses. ost reclssictions within tngile ssets
relte to construction in progress, which re reclssied to the respectivectegory within property, plnt nd equipment.
nvestment propertieshe cquisition cost of the investment properties ws 1,625 (1,692) t yer-end. pitl expenditures during 2011 mounted to 39 (11). accu-multed deprecition ws 742 (744) t yer-end, of which 53 (55) during
2011. he estimted fir vlue of investment properties ws SK 2.5 illion(1.8) t yer-end. 91% of the investment proper ties were lesed out duringthe yer (89). et income for the yer ws ffected y 235 (223) in rentlincome from investment properties nd 53 (63) in direct costs.
Accumulated depreciation andamortization
buildings
nd ndlnd
improve-ments
chinerynd
equipment3
onstruction inprogress, includ-
ing dvncepyments
otal investmentproperty, property,
plant and equipment
assetsunder
opertingleses
otaltangible
assets
Balance-sheet amount 2009 14,780 1,042 46,827 – 62,649 11,605 74,254
eprecition nd mortiztion4
1,207 98 4,772 – 6,077 4,410 10,487Sles/scrpping (224) (22) (1,549) – (1,795) (3,082) (4,877)acquired nd divested opertions 0 0 0 – 0 (55) (55)rnsltion differences (192) (20) (691) – (903) (1,142) (2,045)eclssictions nd other (4) (32) 114 – 78 (2,288) (2,210)Balance–sheet amount 2010 15,567 1,066 49,473 – 66,106 9,448 75,554
eprecition nd mortiztion4 1,191 77 4,856 – 6,124 4,621 10,745Sles/scrpping (260) (9) (1,647) – (1,916) (2,407) (4,323)acquired nd divested opertions 0 0 (18) – (18) 0 (18)rnsltion differences 338 20 819 – 1,177 20 1,197eclssied to ssets held for sle (496) (23) (2,980) – (3,499) (94) (3,593)eclssictions nd other (24) 4 101 – 81 (2,945) (2,864)Balance–sheet amount 2011 16,316 1,135 50,604 – 68,055 8,643 76,698
et value in balance sheet 20102, 5
15,991 11,501 21,041 5,709 54,242 19,647 73,889et value in balance sheet 20112, 5 15,813 12,123 20,152 6,452 54,540 23,922 78,462
1 ncludes cpitlized orrowing costs of 83 (67).2 acquisition costs less ccumulted deprecition, mortiztion nd write-downs.3 chinery nd equipment pertins minly to production relted ssets.4 f which write-down 28 (26).5 f which, investment propert y 883 (948) nd propert y, plnt nd equipment 53,657 (153,294).
1

7/29/2019 MBA VTU Project on VOLVO Group in India
http://slidepdf.com/reader/full/mba-vtu-project-on-volvo-group-in-india 108/166
aSG
14note
Volvo as the lessor esing contrcts re dened in two ctegories, opertionl nd nncilleses, depending on the contrct’s nncil implictions. pertionllesing contrcts re recognized s non-current ssets in assets underopertionl leses. ncome from opertionl lesing is recognized equllydistriuted over the lesing period. Stright-line deprecition is pplied tothese ssets in ccordnce with the terms of the undertking nd thedeprection mount is djusted to correspond to the estimted relizlevlue when the undertking expires. assessed impirments re chrgedto the income sttement. he product’s ssessed relizle vlue t expi-rtion of the undertking is reviewed continuously on n individul sis.
Finncil lesing greements re recognized s either non-current orcurrent receivles in the customer nnce opertions. Pyments fromnncil lesing contrcts re distriuted etween interest income ndmortiztion of the receivle in the customer nnce opertions.
Volvo as the lesseeolvo evlutes lesing contrcts in ccordnce with aS 17, eses. nthose cses in which risks nd rewrds tht re relted to ownership resustntilly held y olvo, so-clled nncil leses, olvo recognizesthe sset nd relted oligtion in the lnce sheet t the lower of thelesed sset’s fir vlue or the present vlue of minimum lese pyments.Future lesing fee commitments re recognized s oligtions. he lesesset is deprecited in ccordnce with olvo’s policy for the respectivenon-current sset. he lese pyments when mde re llocted etweenmortiztion nd interest expenses. f the lesing contrct is consideredto e so-clled opertionl lese, lese pyments re chrged to protor loss over the lese contrct period.
Volvo as the lessorat ecemer 31, 2011, future rentl income from non-cncellle nn-cil nd opertionl leses (minimum lesing fees) mounted to 50,704(45,530). Future rentl income is distriuted s follows:
Finnceleses
pertingleses
2012 12,562 4,1112013–2016 24,227 8,4472017 or lter 604 753otal 37,393 13,311allownce for uncollectile future rentlincome (414)
Unerned rentl income (3,100)Present vlue of future rentl income reltedto non-cncellle leses 33,879
Volvo as a lessee
at ecemer 31, 2011, future rentl pyments (minimum lesing fees)relted to non-cncellle leses mounted to 3,799 (3,916).Future rentl pyments re distriuted s follows:
Finnceleses
pertingleses
2012 459 8342013–2016 360 1,6602017 or lter 63 423otal 882 2,917
entl expenses mounted to:
2011 2010
Finnce leses:ontingent rents (12) (8)
perting leses:ontingent rents (20) (20)entl pyments (1,035) (923)Sulese pyments 5 6
otal (1,062) (945)
rrying mount of ssets suject to nncil leses:
2011 2010
osts:buildings 92 124
nd nd lnd improvements 53 69chinery nd equipment 1,901 1,863assets under operting lese1 194 338otal 2,240 2,394
accumulted deprecition:buildings (30) (41)nd nd lnd improvements - –chinery nd equipment (1,231) (1,174)assets under operting lese1 (68) (81)otal (1,329) (1,296)
rrying mount in the lnce sheet:buildings 62 83nd nd lnd improvements 53 69
chinery nd equipment 670 689assets under operting lese1 126 257otal 911 1,098
1 efer to ssets lesed y olvo s nncil lese which re lter lesed tocustomers s operting lese.
accountInG polIcIes
S Faa SaS
Faa Fa 2011
104

7/29/2019 MBA VTU Project on VOLVO Group in India
http://slidepdf.com/reader/full/mba-vtu-project-on-volvo-group-in-india 109/166
US-FaG abS
15note
Credit loss reserveshe estlishment of credit loss reserves on customer-nncing receivlesis dependent on estimtes including ssumptions regrding pst dues, repos-session rtes nd the recovery rte on the underlying collterls. at ecemer31, 2011, the totl credit loss reserves in the ustomer Finnce segmentmounted to 1.33 % (1.69) of the totl credit portfolio in the segment.
eer to ote 4 for description of the credit risk nd ote 30 for furtherinformtion regrding customer-nncing receivles.
Non-current customer-fnancing receivables
Allocation o non-current customer-nancing receivables 2011 2010
nstllment credits 17,457 15,673Finncil lesing 22,454 19,620ther receivles 707 732otal 40,618 36,025
he effective interest rte for non-current customer-nncing receivlesws 6.98 % s per ecemer 31, 2011.
Current customer-fnancing receivables
Allocation o current customer-nancing receivables 2011 2010
nstllment credits 11,079 11,988Finncil lesing 11,425 10,860eler nncing 13,820 12,598ther receivles 1,757 1,217otal 38,081 36,663
he effective interest rte for current customer-nncing receivles ws6.44% s per ecemer 31, 2011.
Credit risk in the customer-fnancing operations
Customer-nancing receivables 2011 2010ustomer-nncing receivles gross 79,849 74,013lution llownce for doutfulcustomer-nncing receivles (1,150) (1,325)
Whereo specifc reserve (374) (530)
Whereo other reserve (776) (795)
Customer-nancing receivables, net 78,699 72,688
Customer nancing receivables(days/ SK) payments due
2011 2010
ot due 1–30 31–90 >90 otal ot due 1–30 31–90 >90 otal
verdue mount – 391 230 648 1,269 – 490 405 805 1,700
lution llownce for doutful customernncing receivles (99) (63) (40) (172) (374) (91) (56) (74) (308) (530)Customer nancing receivables,net book value (99) 328 190 476 895 (91) 434 331 497 1,170
he tle ove presents overdue pyments within the customer nncing opertions in reltion to specic reserves. t is not unusul for receivleto e settled couple of dys fter its due dte, which impcts the ge intervl of one to 30 dys.
source of uncertaInty In the estImates!
on-current nd current receivles recognized in olvo’s customer
nncing opertions.
2016 or later
702
2015
2,512
2014
6,181
2013
13,815
2012
17,408
on-current customer-nancingreceivables maturities
1
7/29/2019 MBA VTU Project on VOLVO Group in India
http://slidepdf.com/reader/full/mba-vtu-project-on-volvo-group-in-india 110/166
Europe, 45.9%
North America, 26.9%
Asia, 12.3%
Other markets, 14.9%
Customer nancing receivables totalexposure
2011 2010
ot due 1–30 31–90 >90 otal ot due 1–30 31–90 >90 otal
Customer nancing receivables 70,085 6,828 1,971 965 79,849 63,153 6,425 2,369 2,066 74,013
Concentration o credit risk
ustomer concentrtionhe ten lrgest customers in ustomer Finnce ccount for 5.6 % (5.8)of the totl sset port folio. he rest of the portfolio is per tinent to lrgenumer of customers. his wy the credit risk is spred cross oth mnymrkets nd mong mny customers.
oncentrtion y geogrphicl mrkethe djcent tle shows the concentrtion of the customer-nncingportfolio divided into geogrphicl mrkets.
ead more about olvo’s overriding description of ll Group credit risksin ote 4, Finncil-risk mngement.
ead more about olvo Finncil Services’ trend during the yer onpage 66.
abS
16note
Credit loss reserveshe estlishment of credit loss provisions for ccount receivles isentered s soon s it is prole tht credit loss hs incurred. a creditloss hs incurrent when there hs een n event tht hs triggered thecustomer’s inility to py. at ecemer 31, 2011, the totl credit lossreserves for ccount receivles mounted to 2.57% (2.87) of totl
ccount receivles. efer to ote 4 for description of the credit risk.
Non-current receivables
2011 2010
ther interest-ering lons to externl prties 98 204ther interest-ering nncil receivles 596 562ther nncil receivles 2,131 1,741ther receivles 2,184 1,676otal1 5,009 4,184
1 f non-current receivles, 2,822 (2,528) pertins to nncil instruments.efer to otes 4 nd 30 for nncil instruments s well s gols nd policiesgoverning nncil risk nd nncil instruments.
sources of estImatIon uncertaInty!
Geographic market, percentage ocustomer-nancing port olio (%).
Change o valuation allowances or doubt-ul customer-nancing receivables 2011 2010
blnce sheet , ecemer 31, preceding yer 1,325 1,513ew vlution llownce chrged to income 910 1,586eversl of vlution llownce chrged to
income (250) (207)Utiliztion of vlution llownce relted toctul losses (821) (1,451)rnsltion differences (14) (116)Balance sheet, December 31 1,150 1,325
he totl contrctul mount to which the overdue pyments pertin represented in the tle elow. n order to provide for occurred ut not yetidentied customer-nncing receivles overdue, there re dditionlreserves of 776 (795). he remining exposure is secured y liens on thepurchsed equipment, nd, in certin circumstnces, other credit
enhncements such s personl gurntees, credit insurnce, liens onother property owned y the orrower etc.ollterl tken in possession tht meet the recognition criteri
mounted to 412 (594) t ecemer 31, 2011.
S Faa SaS
Faa Fa 2011
106

7/29/2019 MBA VTU Project on VOLVO Group in India
http://slidepdf.com/reader/full/mba-vtu-project-on-volvo-group-in-india 111/166
Current receivables
2011 2010
ons to externl prties 1 11
ther interest-ering nncil receivles 666 331accounts receivle 27,699 24,433Prepid expenses nd ccrued income 2,761 3,043a receivles 3,387 2,662ther nncil receivles 1,746 1,715ther receivles 5,932 4,436otal, ater deduction o valuationallowances or doubtul accountsreceivable1 42,191 36,633
1 f current receivles, 30,133 (26,490) pertins to nncil instruments. eferto otes 4 nd 30 for nncil instruments nd gols nd policies in nncilrisk mngement.
Credit risks in accounts receivable
Change o valuation allowances or doubt-ul accounts receivable 2011 2010
blnce sheet, ecemer 31, preceding yer 721 1,301ew vlution llownce chrged to income 175 187
eversl of vlution llownce chrgedto income (126) (609)Utiliztion of vlution llownce reltedto ctul losses (100) (86)acquired nd divested opertions 33 (1)rnsltion differences 5 (44)eclssictions, etc. 24 (28)Balance sheet, December 31 731 721
eer to ote 4 for more informtion regrding olvo’s nncil risks.
eer to ote 15 for more informtion regrding credit risk in customernncing receivles.
Age analysis o portolio value– Accounts receivable
2011 2010
ot ue 1-30 31-90 >90 otal ot ue 1-30 31-90 >90 otal
accounts receivle gross 26,152 1,102 465 711 28,430 23,324 799 391 640 25,154Provision for doutful ccounts receivle (155) (30) (57) (490) (731) (205) (26) (26) (464) (721)Accounts receivable net 25,997 1,073 408 221 27,699 23,119 773 365 176 24,433
S
17note
Inventoriesnventories re recognized t the lower of cost nd net relizle vlue.he cost is estlished using the rst-in, rst-out method (FF) nd issed on the stndrd cost method, including costs for ll direct mnu-fcturing expenses nd the ttriutle shre of cpcity nd othermnufcturing-relted costs. he stndrd costs re tested regulrly nddjustments re mde sed on current conditions. osts for reserchnd development, selling, dministrtion nd nncil expenses re notincluded. et relizle vlue is clculted s the selling price less coststtriutle to the sle.
2011 2010
Finished products 28,985 24,572Production mterils, etc. 15,614 15,265otal 44,599 39,837
nventories recognized s cost of sold products during the periodmounted to 219,946 (170,723).
ncrease (decrease) in allowance orinventory obsolescence 2011 2010
blnce sheet , ecemer 31, preceding yer 3,382 4,101ncrese in llownce for inventoryosolescence chrged to income (213) (79)Scrpping (264) (439)rnsltion differences (23) (191)eclssictions, etc. (258) (10)Balance sheet, December 31 2,624 3,382
accountInG polIcy
Inventory obsolescenceFir vlue is djusted y the estimted vlue depletion of outdted rticles,over-stocking, physicl dmges, inventory led-times, hndling nd otherselling costs. f the fir vlue is lower thn cost, vlution llownce isestlished for inventory osolescence. he totl inventory vlue, net ofinventory osolescence llownce, ws SK 44,599 (39,837) illion tecemer 31, 2011.
source of uncertaInty In the estImates
!
1
7/29/2019 MBA VTU Project on VOLVO Group in India
http://slidepdf.com/reader/full/mba-vtu-project-on-volvo-group-in-india 112/166
aKab SUS a U FUS
18note
sh nd csh equivlents include high liquid interest-ering securitiestht re considered esily convertile to csh. nterest-ering securitiestht fil to meet this denition re recognized s mrketle securities.
Marketable securities
rketle securities comprise minly interest-ering securities, dis-triuted s shown elow:
2011 2010
Government securities 136 146bnks nd nncil institutions 521 3,527
el estte nncil institutions 6,205 6,094otal 6,862 9,767
Cash and cash equivalents
2011 2010
sh in nks 21,206 16,858bnk certictes1 1,492 2,286ime deposits in nks 7,681 3,822otal 30,379 22,966
1 bnk certictes which mtures within three months of the dte of cquisition.
sh nd csh equivlents t ecemer 31, 2011, include SK 0.7 illion(0.7) tht is not ville for use y the olvo Group nd SK 9.3 illion(7.4) where other limittions exist, minly liquid funds in countries whereexchnge controls or other legl restrictions pply. With tht it is notpossile to immeditely use the liquid funds in other pr ts of the Group,however normlly there is no limittion for use for the Group’s opertion inthe respective country.
SHaHS’ U
19note
rnings per shre is clculted s income for the period, ttriutle tothe Prent ompny’s shreholders, divided y the Prent ompny’sverge numer of shres outstnding for the scl yer. iluted erningsper shre is clculted s income for the period ttriutle to the Prentompny’s shreholders divided y the verge numer of shres out-
stnding plus the verge numer of shres tht would e issued s neffect of ongoing shre-sed incentive progrms. f during the yer therewere potentil shres redeemed or expired during the period, these relso included in the verge numer of shres used to clculte the ern-ings per shre fter dilution.
he shre cpitl of the Prent ompny is divided into two series ofshres, a nd b. both series crry the sme rights, except tht echSeries a shre crries the right to one vote nd ech Series b shre crriesthe right to one tenth of vote. he shres quot vlue is SK 1.20.
sh dividend decided y the annul Generl eeting 2011 ws SK 2.50 (0.00) per shre or totl of SK 5,068.6 million (0.0).
uring 2011 ab olvo trnsferred, free of considertion, 929 tresuryb-shres, with totl quot vlue of 1,114.80 SK, to pr ticipnts of olvo’s
long-term, shre-sed incentive progrm for senior executives in theolvo Group, s ccelerted llotment.
he trnsferred tresury shres represent n insignicnt portion of theshre cpitl of ab olvo.
Unrestricted equity in the Prent ompny t ecemer 31, 2011mounted to SK 32,268 million (31,962).
he cumultive mount of the exchnge difference deferred to equityrelting to ssets held for sle mount to SK 33 million (3).
normation regardingnumber o shares 2011 2010
wn Series a shres 20,728,135 20,728,135wn Series b shres 80,264,131 80,265,060otal own shares 100,992,266 100,993,195
wn shres in % of totlregistered shres 4.74 4.74
utstnding Series a shres 642,766,887 656,873,495utstnding Ser ies b shres 1,384,661,067 1,370,553,530otal outstanding shares 2,027,427,954 2,027,427,025
otl registered Series a shres 663 ,495,022 677,601,630otl registered Series b shres 1,464,925,198 1,450,818,590otal registered shares 2,128,420,220 2,128,420,220
averge numer of outstndingshres 2,027,427,172 2,027,427,025
Change in other reserves (SK ) Hedge reserveaville-for-sle
reserve otl
blnce t Jnury 1, 2011 87 28 115Hedge contrcts reversed to income (3) – (3)x on hedge contrcts reversed to income 1 – 1hnge in fir vlue of commodity contrcts (142) – (142)Fir vlue djustments regrding holding in eutz – (159) (159)Fir vlue djustments regrding holdings in Jpnese compnies – 200 200Fir vlue djustments regrding other holdings – (2) (2)Balance at December 31, 2011 (57) 67 10
accountInG polIcy
accountInG polIcy
S Faa SaS
Faa Fa 2011
108
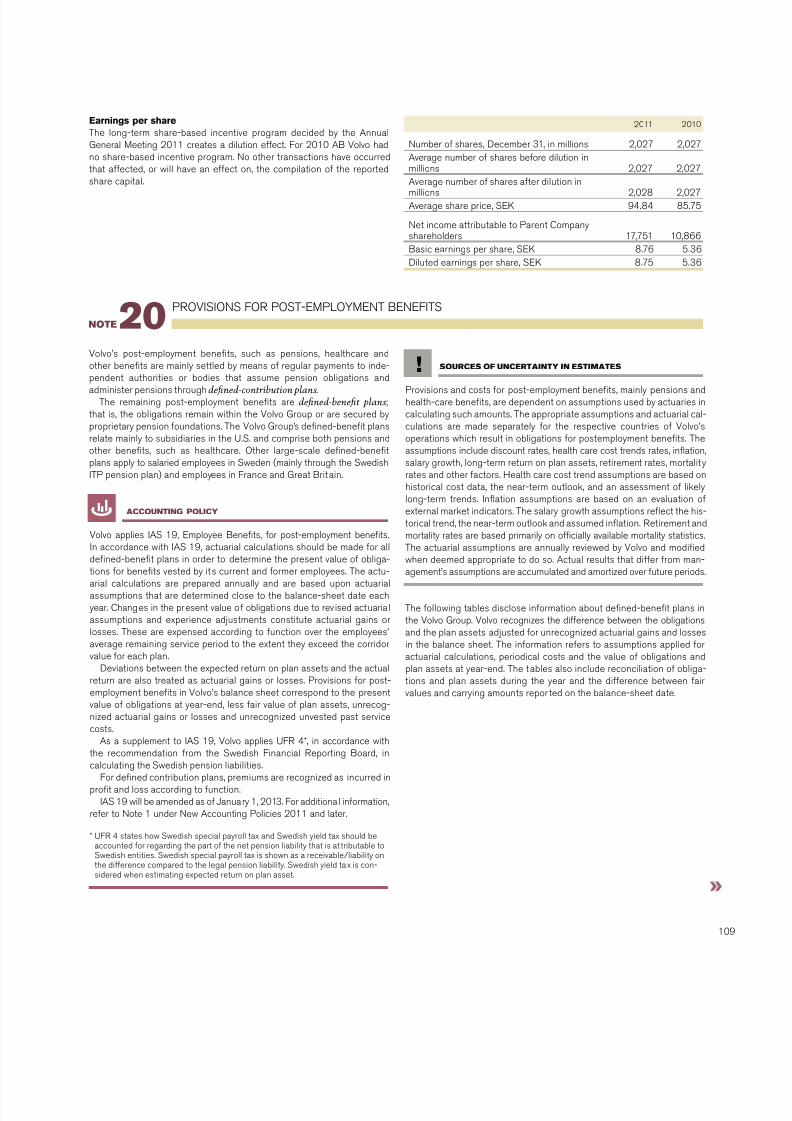
7/29/2019 MBA VTU Project on VOLVO Group in India
http://slidepdf.com/reader/full/mba-vtu-project-on-volvo-group-in-india 113/166
arnings per sharehe long-term shre-sed incentive progrm decided y the annulGenerl eeting 2011 cretes dilution effect. For 2010 ab olvo hdno shre-sed incentive progrm. o other trnsctions hve occurredtht ffected, or will hve n effect on, the compiltion of the reported
shre cpitl.
2011 2010
umer of shres, ecemer 31, in millions 2,027 2,027averge numer of shres efore dilution inmillions 2,027 2,027
averge numer of shres fter dilution inmillions 2,028 2,027averge shre price, SK 94.84 85.75
et income ttriutle to Prent ompnyshreholders 17,751 10,866bsic ernings per shre, SK 8.76 5.36iluted ernings per shre, SK 8.75 5.36
PSS F PS-P bFS
20note
olvo’s post-employment enets, such s pensions, helthcre nd
other enets re minly settled y mens of regulr pyments to inde-pendent uthorities or odies tht ssume pension oligtions nddminister pensions through defned-contribution plans.
he remining post-employment enets re defned-beneft plans;tht is, the oligtions remin within the olvo Group or re secured yproprietry pension foundtions. he olvo Group’s dened-enet plnsrelte minly to susidiries in the U.S. nd comprise oth pensions ndother enets, such s helthcre. ther lrge-scle dened-enetplns pply to slried employees in Sweden (minly through the SwedishP pension pln) nd employees in Frnce nd Gret britin.
sources of uncertaInty In estImates
!Provisions nd costs for post-employment enets, minly pensions ndhelth-cre enets, re dependent on ssumptions used y cturies inclculting such mounts. he pproprite ssumptions nd cturil cl-cultions re mde seprtely for the respective countries of olvo’sopertions which result in oligtions for postemployment enets. hessumptions include discount rtes, helth cre cost trends rtes, intion,slry growth, long-term return on pln ssets, retirement rtes, mortlit yrtes nd other fctors. Helth cre cost trend ssumptions re sed onhistoricl cost dt, the ner-term outlook, nd n ssessment of likelylong-term trends. ntion ssumptions re sed on n evlution ofexternl mrket indictors. he slry growth ssumptions reect the his-toricl trend, the ner-term outlook nd ssumed intion. etirement ndmortlity rtes re sed primrily on ofcilly ville mortlity sttistics.he cturil ssumptions re nnully reviewed y olvo nd modiedwhen deemed pproprite to do so. actul results tht differ from mn-gement’s ssumptions re ccumulted nd mortized over future periods.
he following tles disclose informtion out dened-enet plns inthe olvo Group. olvo recognizes the difference etween the oligtionsnd the pln ssets djusted for unrecognized cturil gins nd lossesin the lnce sheet. he informtion refers to ssumptions pplied forcturil clcultions, periodicl costs nd the vlue of oligtions ndpln ssets t yer-end. he tles lso include reconcilition of olig-tions nd pln ssets during the yer nd the difference etween firvlues nd crrying mounts repor ted on the lnce-sheet dte.
accountInG polIcy
olvo pplies aS 19, mployee benets, for post-employment enets.n ccordnce with aS 19, cturil clcultions should e mde for lldened-enet plns in order to determine the present vlue of olig-tions for enets vested y its current nd former employees. he ctu-ril clcultions re prepred nnully nd re sed upon cturilssumptions tht re determined close to the lnce-sheet dte ech yer. hnges in the present vlue of oligtions due to rev ised cturi lssumptions nd experience djustments constitute cturil gins orlosses. hese re expensed ccording to function over the employees’verge remining service period to the extent they exceed the corridorvlue for ech pln.
evitions etween the expected return on pln ssets nd the ctulreturn re lso treted s cturil gins or losses. Provisions for post-employment enets in olvo’s lnce sheet correspond to the presentvlue of oligtions t yer-end, less fir vlue of pln ssets, unrecog-nized cturil gins or losses nd unrecognized unvested pst servicecosts.
as supplement to aS 19, olvo pplies UF 4*, in ccordnce withthe recommendtion from the Swedish Finncil eporting bord, inclculting the Swedish pension liilities.
For dened contriution plns, premiums re recognized s incurred inprot nd loss ccording to function.
aS 19 will e mended s of Jnury 1, 2013. For dditionl informtion,refer to ote 1 under ew accounting Policies 2011 nd lter.
* UF 4 sttes how Swedish specil pyroll tx nd Swedish yield tx should eccounted for regrding the prt of the net pension liility tht is t triutle toSwedish entities. Swedish specil pyroll tx is shown s receivle/liility onthe difference compred to the legl pension liility. Swedish yield t x is con-sidered when estimting expected return on pln sset.
1
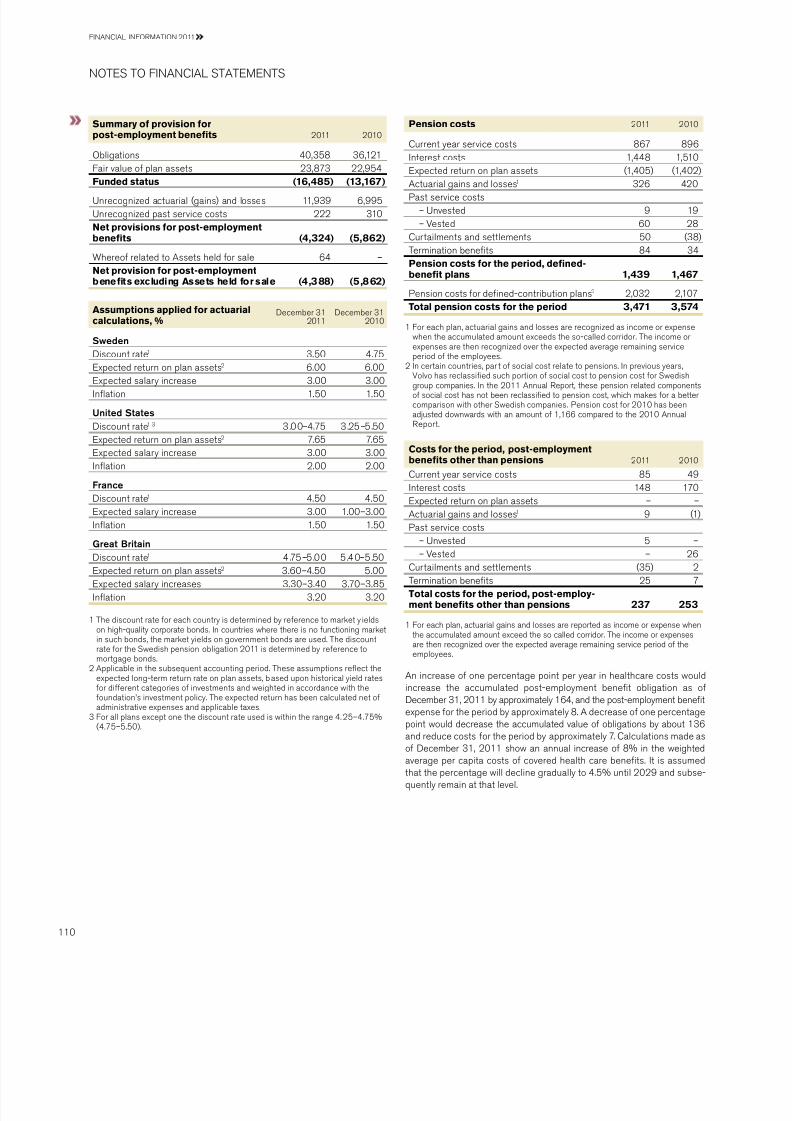
7/29/2019 MBA VTU Project on VOLVO Group in India
http://slidepdf.com/reader/full/mba-vtu-project-on-volvo-group-in-india 114/166
Summary o provision orpost-employment benets 2011 2010
ligtions 40,358 36,121Fir vlue of pln ssets 23,873 22,954
Funded status (16,485) (13,167)Unrecognized cturil (gins) nd losses 11,939 6,995Unrecognized pst service costs 222 310et provisions or post-employmentbenets (4,324) (5,862)
Whereof relted to assets held for sle 64 –et provision or post-employmentbenets excluding Assets held or sale (4,388) (5,862)
Assumptions applied or actuarialcalculations, %
ecemer 312011
ecemer 312010
Sweden iscount rte1 3.50 4.75
xpected return on pln ssets2 6.00 6.00xpected slry increse 3.00 3.00ntion 1.50 1.50
United States iscount rte1 3 3.00–4.75 3.25–5.50xpected return on pln ssets2 7.65 7.65xpected slry increse 3.00 3.00ntion 2.00 2.00
France iscount rte1 4.50 4.50xpected slry increse 3.00 1.00–3.00ntion 1.50 1.50
Great Britain
iscount rte1 4.75–5.00 5.40–5.50xpected return on pln ssets2 3.60–4.50 5.00xpected slry increses 3.30–3.40 3.70–3.85ntion 3.20 3.20
1 he discount rte for ech country is determined y reference to mrket y ieldson high-qulity corporte onds. n countries where there is no functioning mrketin such onds, the mrket yields on government onds re used. he discountrte for the Swedish pension oligtion 2011 is determined y reference tomortgge onds.
2 applicle in the susequent ccounting period. hese ssumptions reect theexpected long-term return rte on pln ssets, sed upon historicl yield rtesfor different ctegories of investments nd weighted in ccordnce with thefoundtion’s investment policy. he expected return hs een clculted net ofdministrtive expenses nd pplicle txes.
3 For ll plns except one the discount rte used is within the rnge 4. 25–4.75%(4.75–5.50).
Pension costs 2011 2010
urrent yer service costs 867 896nterest costs 1,448 1,510xpected return on pln ssets (1,405) (1,402)
acturil gins nd losses1 326 420Pst service costs
– Unvested 9 19– ested 60 28
urtilments nd settlements 50 (38)ermintion enets 84 34Pension costs or the period, dened-benet plans 1,439 1,467
Pension costs for dened-contriution plns2 2,032 2,107otal pension costs or the period 3,471 3,574
1 For ech pln, cturil gins nd losses re recognized s income or expensewhen the ccumulted mount exceeds the so-clled corridor. he income orexpenses re then recognized over the expected verge remining serviceperiod of the employees.
2 n certin countries, pr t of socil cost relte to pensions. n previous yers,olvo hs reclssied such portion of socil cost to pension cost for Swedishgroup compnies. n the 2011 annul eport, these pension relted componentsof socil cost hs not een reclssied to pension cost, which mkes for ettercomprison with other Swedish compnies. Pension cost for 2010 hs eendjusted downwrds with n mount of 1,166 compred to the 2010 annuleport.
Costs or the period, post-employmentbenets other than pensions 2011 2010
urrent yer service costs 85 49nterest costs 148 170xpected return on pln ssets – –acturil gins nd losses1 9 (1)Pst service costs
– Unvested 5 –
– ested – 26urtilments nd settlements (35) 2ermintion enets 25 7otal costs or the period, post-employ-ment benets other than pensions 237 253
1 For ech pln, cturil gins nd losses re reported s income or expense whenthe ccumulted mount exceed the so clled corridor. he income or expensesre then recognized over the expected verge remining service period of theemployees.
an increse of one percentge point per yer in helthcre costs wouldincrese the ccumulted post-employment enet oligtion s ofecemer 31, 2011 y pproximtely 164, nd the post-employment enetexpense for the period y pproximtely 8. a decrese of one percentgepoint would decrese the ccumulted vlue of oligtions y out 136
nd reduce costs for the period y pproximtely 7. lcultions mde sof ecemer 31, 2011 show n nnul increse of 8% in the weightedverge per cpit costs of covered helth cre enets. t is ssumedtht the percentge will decline grdully to 4.5% until 2029 nd suse-quently remin t tht level.
S Faa SaS
Faa Fa 2011
110
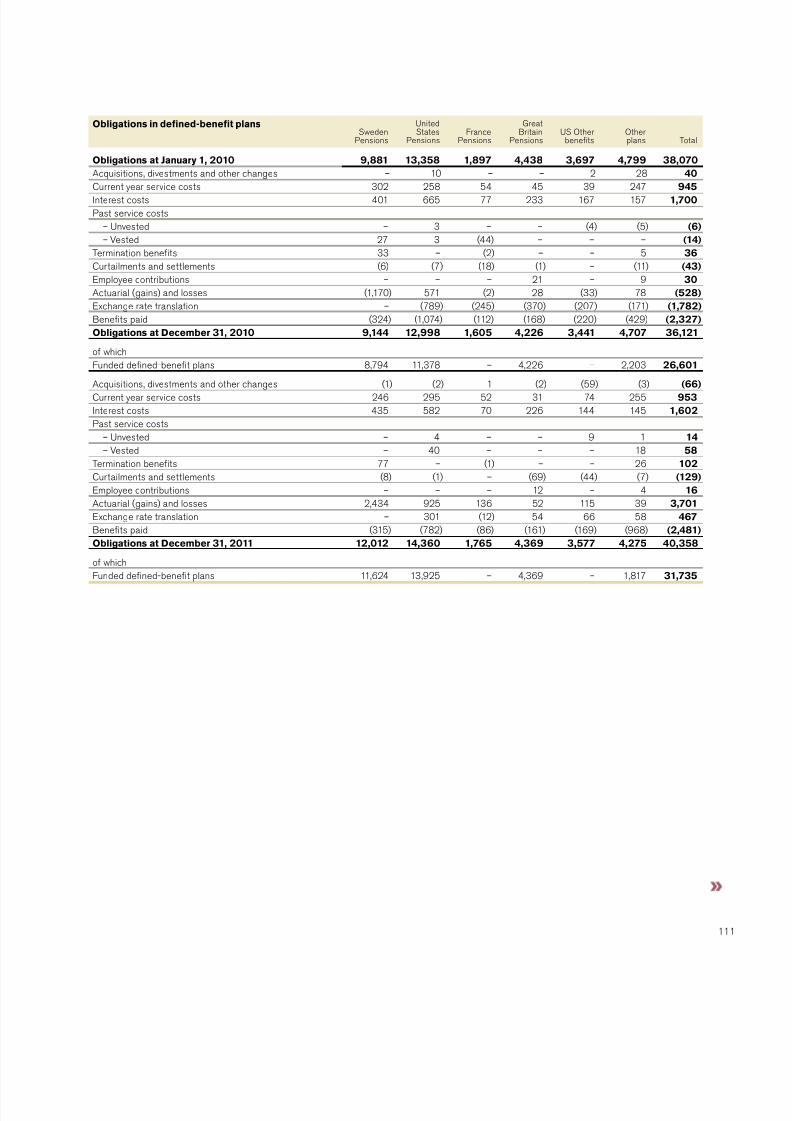
7/29/2019 MBA VTU Project on VOLVO Group in India
http://slidepdf.com/reader/full/mba-vtu-project-on-volvo-group-in-india 115/166
bligations in dened-benet plansSweden
Pensions
UnitedSttes
PensionsFrnce
Pensions
Gretbritin
PensionsUS therenets
therplns otl
bligations at January 1, 2010 9,881 13,358 1,897 4,438 3,697 4,799 38,070acquisitions, divestments nd other chnges – 10 – – 2 28 40
urrent yer service costs 302 258 54 45 39 247 945nterest costs 401 665 77 233 167 157 1,700Pst service costs
– Unvested – 3 – – (4) (5) (6)– ested 27 3 (44) – – – (14)
ermintion enets 33 – (2) – – 5 36urtilments nd settlements (6) (7) (18) (1) – (11) (43)mployee contriutions – – – 21 – 9 30acturil (gins) nd losses (1,170) 571 (2) 28 (33) 78 (528)xchnge rte trnsltion – (789) (245) (370) (207) (171) (1,782)benets pid (324) (1,074) (112) (168) (220) (429) (2,327)bligations at December 31, 2010 9,144 12,998 1,605 4,226 3,441 4,707 36,121
of which
Funded dened-enet plns 8,794 11,378 – 4,226 – 2,203 26,601acquisitions, divestments nd other chnges (1) (2) 1 (2) (59) (3) (66)urrent yer service costs 246 295 52 31 74 255 953nterest costs 435 582 70 226 144 145 1,602Pst service costs
– Unvested – 4 – – 9 1 14– ested – 40 – – – 18 58
ermintion enets 77 – (1) – – 26 102urtilments nd settlements (8) (1) – (69) (44) (7) (129)mployee contriutions – – – 12 – 4 16acturil (gins) nd losses 2,434 925 136 52 115 39 3,701xchnge rte trnsltion – 301 (12) 54 66 58 467benets pid (315) (782) (86) (161) (169) (968) (2,481)bligations at December 31, 2011 12,012 14,360 1,765 4,369 3,577 4,275 40,358
of whichFunded dened-enet plns 11,624 13,925 – 4,369 – 1,817 31,735
1

7/29/2019 MBA VTU Project on VOLVO Group in India
http://slidepdf.com/reader/full/mba-vtu-project-on-volvo-group-in-india 116/166
Fair value o plan assets in unded plansSweden
Pensions
UnitedSttes
PensionsFrnce
Pensions
Gretbritin
PensionsUS therenets
therplns otl
Plan assets at January 1, 2010 6,430 9,866 – 4,392 28 1,894 22,610acquisitions, divestments nd other chnges – 4 – (1) – 26 29
xpected return on pln ssets 386 719 – 216 – 77 1,398acturil gins nd (losses) 262 373 – 208 – 18 861mployer contriutions – 156 – 103 – 187 446mployee contriutions – – – 21 – 12 33xchnge rte trnsltion – (574) – (378) (2) (166) (1,120)benets pid – (1,009) – (168) (2) (124) (1,303)Plan assets at December 31, 2010 7,078 9,535 – 4,393 24 1,924 22,954
acquisitions, divestments nd other chnges 3 8 – – – 6 17
xpected return on pln ssets 426 683 – 204 – 92 1,405acturil gins nd (losses) (681) (628) – 81 – (96) (1,324)mployer contriutions 756 829 – 91 – 410 2,086mployee contriutions – – – 12 – 7 19xchnge rte trnsltion – 178 – 60 – (18) 220
benets pid (2) (763) – (161) – (578) (1,504)Plan assets at December 31, 2011 7,580 9,842 – 4,680 24 1,747 23,873
et provisions or post-employment benetsSweden
Pensions
UnitedSttes
PensionsFrnce
Pensions
Gretbritin
PensionsUS therenets
therplns otl
Funded status at December 31, 2010 (2,066) (3,463) (1,605) 167 (3,417) (2,783) (13,167)Unrecognized cturil (gins) nd losses 1,475 4,054 113 388 322 643 6,995Unrecognized pst service costs – (65) 380 – (5) – 310et provisions or post-employment benets atDecember 31, 2010 (591) 526 (1,112) 555 (3,100) (2,140) (5,862)
of which reported s
Prepid pensions – 900 – 555 110 83 1,648Provisions for post-employment enets (591) (374) (1,112) – (3,210) (2,223) (7,510)
Funded status at December 31, 2011 (4,432) (4,518) (1,765) 311 (3,553) (2,528) (16,485)Unrecognized cturil (gins) nd losses 4,569 5,509 333 341 434 753 11,939Unrecognized pst service costs – (54) 276 – – – 222et provisions or post-employment benets atDecember 31, 2011 137 937 (1,156) 652 (3,119) (1,775) (4,324)Whereof relted to assets held for sle 77 – – – – (13) 641
et provision or post-employment benets exclud-ing Assets held or sale 60 937 (1,156) 652 (3,119) (1,762) (4,388)
of which reported sPrepid pensions 60 1,381 – 652 102 82 2,277Provisions for post-employment enets – (444) (1,156) – (3,221) (1,844) (6,665)
1 Per ecemer 31, 2011 pension oligtion mounted to 1,394, pln ssets mounted to 926 nd unrecognized cturil losses mounted to 532 in regrds to assetsheld for sle.
S Faa SaS
Faa Fa 2011
112

7/29/2019 MBA VTU Project on VOLVO Group in India
http://slidepdf.com/reader/full/mba-vtu-project-on-volvo-group-in-india 117/166
actul return on pln ssets mounted to 81 (2,259).
Actuarial gains and losses 2011 2010
xperience-sed djustments in oligtions (3,492) 293 xperience-sed djustments in pln ssets (1,324) 861ffects of chnges in cturil ssumptions (209) 235Actuarial gains and (losses), net (5,025) 1,389
olvo’s pension foundtion in Sweden ws formed in 1996 to secure oli-gtions relting to retirement pensions for slried employees in Swedenin ccordnce with the P pln ( Swedish individul pension pln). Pln
ssets mounting to 2,456 were contriuted to the foundtion t its formtion,
corresponding to the vlue of the pension oligtions t tht time. Sinceits formtion, net contriutions of 2,228, whereof 756 during 2011, hveeen mde to the foundtion. he pln ssets in olvo’s Swedish pensionfoundtion re invested in Swedish nd foreign stocks nd mutul funds,nd in interest-ering securities, in ccordnce with distriution tht is
determined y the foundtion’s bord of irec tors. at ecemer 31, 2011,the fir vlue of the foundtion’s pln ssets mounted to 7,554 (7,059),of which 31% (57) ws invested in shres or mutul funds. at the smedte, retirement pension oligtions ttriutle to the P pln mountedto 11,624 (8,794).
Swedish compnies cn secure new pension oligtions throughlnce-sheet provisions or pension-fund contriutions. Furthermore, credit insurnce policy must e tken out for the vlue of the oligtions.n ddition to enets relting to retirement pensions, the P pln lsoincludes, for exmple, collective fmily pension, which olvo nncesthrough n insurnce policy with the alect insurnce compny. accord-ing to n interprettion from the Swedish Finncil eporting bord, thisis multi-employer dened-enet pln. For scl yer 2011, olvo didnot hve ccess to informtion from alect tht would hve enled thispln to e reported s dened-enet pln. accordingly, the pln hseen recognized s dened-contriution pln. alect’s funding rtio is113% (146).
olvo’s susidiries in the United Sttes minly secure their pensionoligtions through trnsfer of funds to pension plns. at the end of 2011,the totl vlue of pension oligtions secured y pension plns of thistype mounted to 13,925 (11,378). at the sme point in time, the totlvlue of the pln ssets in these plns mounted to 9,842 (9,535), ofwhich 54% (59) ws invested in shres or mutul funds. he regultionsfor securing pension oligtions stipulte certin minimum levels con-cerning the rtio etween the vlue of the pln ssets nd the vlue of theoligtions. uring 2011, olvo contriuted 829 (156) to the americnpension plns.
uring 2011, olvo hs mde extr contriutions to the pension plnsin Gret britin in the mount of 91 (103).
n 2012, olvo estimtes to trnsfer n mount of out SK 1 illionto pension plns.
H PSS
21note
ProvisionsProvisions re reported on lnce when legl or constructive olig-tion exists s result of pst event nd it is prole tht n outow ofresources will e required to settle the oligtion nd the mount cn erelily estimted.
Provisions for residul vlue risksesidul vlue risks re ttriutle to operting lese contrcts or slestrnsctions comined with uy-ck greements or residul vlue gur-ntees. esidul vlue risks re the risks tht olvo in the future wouldhve to dispose used products t loss if the price development of theseproducts is worse thn wht ws expected when the contrcts wereentered. Provisions for residul vlue risks re mde on continuing sissed upon estimtions of the used products’ future net relizle vlues.he estimtions of future net relizle vlues re mde with considertionto current prices, expected future price development, expected inventoryturnover period nd expected direct nd indirect selling expenses. f theresidul vlue risks pertin to products tht re reported s tngile
ssets in olvo’s lnce sheet, these risks re reected y deprecitionor write-down of the crrying vlue of these ssets. f the residul vluerisks pertin to products , which re not repor ted s ssets in olvo’s lncesheet, these risks re reected under the line item current provisions. Seelso note 7 ncome.
Provision or product war rantystimted provision for product wrrnties re reported when the prod-
ucts re sold. he provision includes oth contrctul wrrnty nd soclled goodwill wrrnty nd is determined sed on historicl sttisticsconsidering known qulity improvements, costs for remedy of defultse.t.c. Provision for cmpigns in connection with specic qulity prolemsre reported when the cmpign is decided.
Provision or Restruc tur ing cost sa provision for decided restructuring mesures is reported when detiledpln for the implementtion of the mesures is complete nd when thispln is communicted to those who re ffected. estructuring costs rereported s seprte line item in the income sttement if they relte to considerle chnge of the Group structure. ther restructuring costsre included in ther operting income nd expenses.
accountInG polIcy
Shares and participation, Volvo 403 (2%)
Shares and participations, other,11,494 (50%)
Bonds and interest-bearingsecurities, 9,100 (40%)
Property, 440 (2%)
Other, 1,517 (6%)
Plan assets by category 2010
i i i l
i i i
i ii i
Shares and par ticipation, Volvo 246 (1%)
Shares and participations, other, 9,565 (40%)
Bonds and interest-bearingsecurities, 12,460 (52%)
Property, 644 (3%)
Other, 958 (4%)
Plan assets by category 2011
1
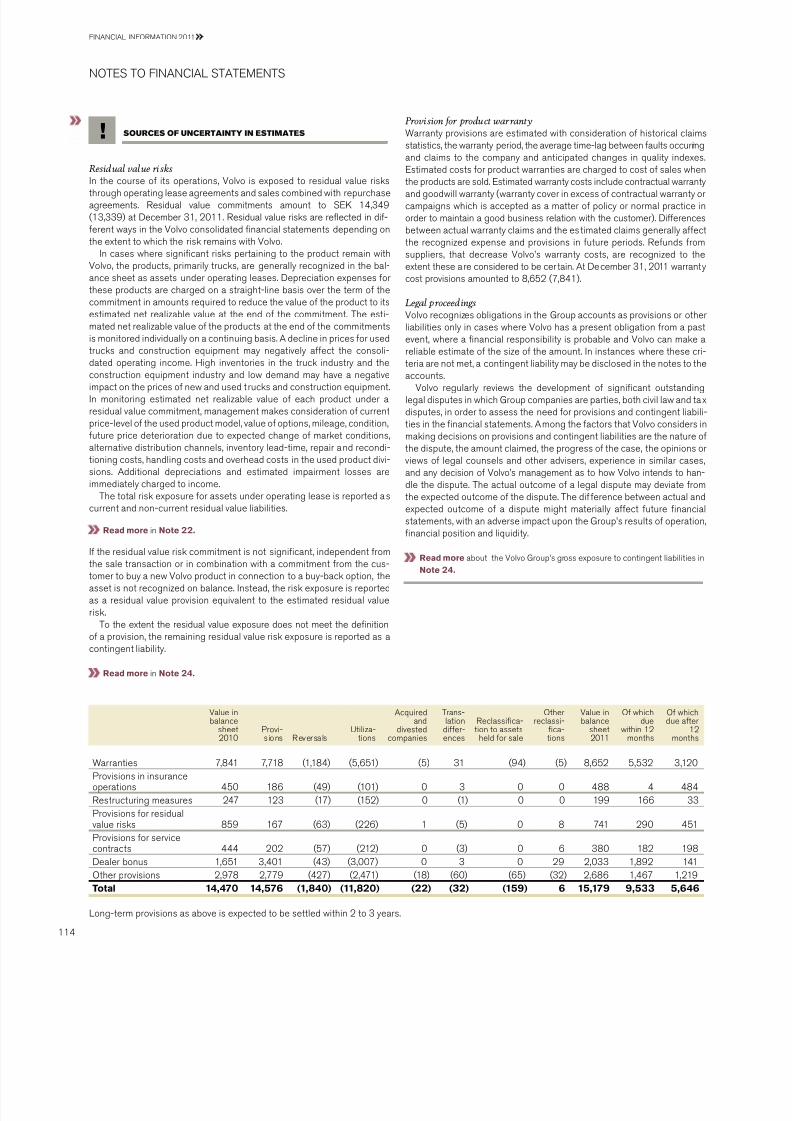
7/29/2019 MBA VTU Project on VOLVO Group in India
http://slidepdf.com/reader/full/mba-vtu-project-on-volvo-group-in-india 118/166
Provision or product war rantyWrrnty provisions re estimted with considertion of historicl climssttistics, the wrrnty period, the verge time-lg etween fults occurringnd clims to the compny nd nticipted chnges in qulity indexes.stimted costs for product wrrnties re chrged to cost of sles when
the products re sold. stimted wrrnty costs include contrctul wrrntynd goodwill wrrnty (wrrnty cover in excess of contrctul wrrnty orcmpigns which is ccepted s mtter of policy or norml prctice inorder to mintin good usiness reltion with the customer). ifferencesetween ctul wrrnty clims nd the estimted clims generlly ffectthe recognized expense nd provisions in future periods. efunds fromsuppliers, tht decrese olvo’s wrrnty costs, re recognized to theextent these re considered to e cer tin. at ecemer 31, 2011 wrrntycost provisions mounted to 8,652 (7,841).
Legal proceedingsolvo recognizes oligtions in the Group ccounts s provisions or otherliilities only in cses where olvo hs present oligtion from pstevent, where nncil responsiility is prole nd olvo cn mke relile estimte of the size of the mount. n instnces where these cri-
teri re not met, contingent liility my e disclosed in the notes to theccounts.olvo regulrly reviews the development of signicnt outstnding
legl disputes in which Group compnies re prties, oth civil lw nd t xdisputes, in order to ssess the need for provisions nd contingent liili-ties in the nncil sttements. among the fctors tht olvo considers inmking decisions on provisions nd contingent liilities re the nture ofthe dispute, the mount climed, the progress of the cse, the opinions orviews of legl counsels nd other dvisers, experience in similr cses,nd ny decision of olvo’s mngement s to how olvo intends to hn-dle the dispute. he ctul outcome of legl dispute my devite fromthe expected outcome of the dispute. he dif ference etween ctul ndexpected outcome of dispute might mterilly ffect future nncilsttements, with n dverse impct upon the Group’s results of opertion,nncil position nd liquidity.
ead more out the olvo Group’s gross exposure to contingent liilities in
ote 24.
lue inlnce
sheet
2010
Provi-
s ions evers ls
Utiliz-
tions
acquirednd
divested
compnies
rns-ltiondiffer-
ences
eclssic-tion to ssets
held for sle
therreclssi-
c-
tions
lue inlnce
sheet
2011
f whichdue
within 12
months
f whichdue fter
12
months
Wrrnties 7,841 7,718 (1,184) (5,651) (5) 31 (94) (5) 8,652 5,532 3,120Provisions in insurnceopertions 450 186 (49) (101) 0 3 0 0 488 4 484estructuring mesures 247 123 (17) (152) 0 (1) 0 0 199 166 33Provisions for residulvlue risks 859 167 (63) (226) 1 (5) 0 8 741 290 451Provisions for servicecontrcts 444 202 (57) (212) 0 (3) 0 6 380 182 198eler onus 1,651 3,401 (43) (3,007) 0 3 0 29 2,033 1,892 141ther provisions 2,978 2,779 (427) (2,471) (18) (60) (65) (32) 2,686 1,467 1,219otal 14,470 14,576 (1,840) (11,820) (22) (32) (159) 6 15,179 9,533 5,646
ong-term provisions s ove is expected to e settled within 2 to 3 yers.
sources of uncertaInty In estImates!
Residual value ri sks
n the course of its opertions, olvo is exposed to residul vlue risksthrough operting lese greements nd sles comined with repurchsegreements. esidul vlue commitments mount to SK 14,349(13,339) t ecemer 31, 2011. esidul vlue risks re reected in dif-ferent wys in the olvo consolidted nncil sttements depending onthe extent to which the risk remins with olvo.
n cses where signicnt risks pertining to the product remin witholvo, the products, primrily trucks, re generlly recognized in the l-nce sheet s ssets under operting leses. eprecition expenses forthese products re chrged on stright-line sis over the term of thecommitment in mounts required to reduce the vlue of the product to itsestimted net relizle vlue t the end of the commitment. he esti-mted net relizle vlue of the products t the end of the commitmentsis monitored individully on continuing sis. a decline in prices for usedtrucks nd construction equipment my negtively ffect the consoli-dted operting income. High inventories in the truck industry nd theconstruction equipment industry nd low demnd my hve negtiveimpct on the prices of new nd used t rucks nd construction equipment.n monitoring estimted net relizle vlue of ech product under residul vlue commitment, mngement mkes considertion of currentprice-level of the used product model, vlue of options, milege, condition,future price deteriortion due to expected chnge of mrket conditions,lterntive distriution chnnels, inventory led-time, repir nd recondi-tioning costs, hndling costs nd overhed costs in the used product divi-sions. additionl deprecitions nd estimted impirment losses reimmeditely chrged to income.
he totl risk exposure for ssets under operting lese is reported scurrent nd non-current residul vlue liilities.
ead more in ote 22.
f the residul vlue risk commitment is not signicnt, independent fromthe sle trnsction or in comintion with commitment from the cus-tomer to uy new olvo product in connection to uy-ck option, thesset is not recognized on lnce. nsted, the risk exposure is reporteds residul vlue provision equivlent to the estimted residul vluerisk.
o the extent the residul vlue exposure does not meet the denitionof provision, the remining residul vlue risk exposure is reported s contingent liility.
ead more in ote 24.
S Faa SaS
Faa Fa 2011
114

7/29/2019 MBA VTU Project on VOLVO Group in India
http://slidepdf.com/reader/full/mba-vtu-project-on-volvo-group-in-india 119/166
abS
22note
Non-current liabilities
he tles elow show the Group’s non-current liilities in which thelrgest lons re listed y currency. he min prt re issued y olvoresury ab. nformtion on lon terms is from ecemer 31, 2011. olvo
Bond loans actul interest rte ec 31, 2011, % ffective interest rte ec 31, 2011, % 2011 2010
U 2007–2011/2013-2017 2.01–9.92 2.03–9.92 16,591 20,384SK 2007–2011/2013–2017 2.82–5.84 2.85–5.97 15,904 12,553US 2009/2015 5.98 5.98 5,165 5,075K – – – 229GbP 2009/2014 6.6 6.77 532 525otal1 38,192 38,767
1 f which lons rised to nnce the credit port folio of the customer nncing opertions totlled 24,501 (14,940).
ther non-current loansactul interest rte
ec 31, 2011, %ffective interest rte
ec 31, 2011, % 2011 2010
US 2008–2011/2013–2018 0.63–7.66 0.63–7.66 8,883 13,433U 2004–2010/2013–2027 2.82–6.5 2.85–6.5 2,409 1,485GbP 2011/2013–2014 2.45 2.47 925 337SK 2007–2011/2013–2017 2.9–4.22 2.93–4.22 5,457 2,942a 2007–2011/2013–2016 1.81 1.82 1,439 2,928X 2009/2014 7.43–8.96 7.68–9.34 1,470 2,186JP 2006–2011/2013–2017 0.59–2.1 0.59–2.1 13,132 12,405HF 2011/2013 1.07 1.07 736 –b 2007–2011/2016–2019 6.33 6.58 5,081 5,348aU 2010–2011/2013 5.91–7.50 6.04–7.64 1,054 140ther lons 5,509 1,731
evlution of outstnding derivtives to SK 1,670 2,392otal other non-current loans1 47,765 45,327otal bond loans and other non-current loans 85,957 84,094eferred lesing income 2,000 1,778esidul vlue liilities 3,608 3,170accrued expenses service contrcts 1,996 1,273ther non-current nncil liilities 701 1,114ther non-current liilities 2,142 1,896otal 96,404 93,325
1 f which lons rised to nnce the credit port folio of the customer nncing opertions 24,517 (21,064). olvo resury employs cross-currency interest swps to ele to offer lending nd orrowing in vrious currencies without incresing olvo’s risk. he tle on pge 87 presents ndustril opertions nncil net position,including pensions, listed y currency. f non-current liilities, 87,923 (86,184) pertins to nncil instruments. efer to note 30 Finncil instruments.
f the ove lons, 516 (1,288) ws secured.
efer to ote 23 for n explntion of chnges to ssets pledged.on-current lons mture s follows:
2013 28,2282014 20,9122015 11,3562016 12,9542017 11,8002018 or lter 707otal 85,957
efer to ote 15 for mturities of non-current customer nncing receiv-
les.ost other non-current liilities will mture within ve yers.at yer-end 2011, credit fcilities grnted ut not ut ilized nd which cn
e used without restrictions mounted to pproximtely SK 33.6 illion(35.3). hese fcilities consisted of stnd-y fcilities for lons with vry-ing mturities through 2013 to 2016. a fee is normlly chrged for theunused portion of credit fcilities nd is recognized in prot or loss underother nncil income nd expenses.
hedges foreign-exchnge nd interest-rte risks using derivtive instru-ments. For more informtion refer to ote 4 Gols nd policies in nncilrisk mngement nd ote 30 Finncil nstruments.
1

7/29/2019 MBA VTU Project on VOLVO Group in India
http://slidepdf.com/reader/full/mba-vtu-project-on-volvo-group-in-india 120/166
Current liabilities
blnce sheet mounts for lons were s follows:
2011 2010
bnk lons 12,639 12,261
ther lons 31,883 27,340otal1 44,522 39,601
1 f which lons rised to nnce the credit portfolio of the customer nncingopertions mount to 31,844 (29,690) nd nncil derivtives t fir vlue1,362 (458).
bnk lons include current mturities of non-current lons 5,803 (3,246).ther lons include current mturities of non-current lons, 17,681(22,007), nd commercil pper, 8,393 (1,416). on-interest-eringcurrent liilities ccounted for 99,152 (84,457), or 69% (68) of the Group’stotl current liilities.
blnce sheet mounts for other current liilities were s follows:
2011 2010
advnces from customers 3,642 3,416
Wges, slries nd withholding txes 8,041 8,824a liilities 2,099 2,023accrued expenses nd prepid income 12,528 12,626eferred lesing income 1,683 1,640esidul vlue liility 1,783 2,154ther nncil liilities 367 242ther liilities 5,120 4,416otal 35,263 35,341
urrent liilities lso include trde pyles of 56,788 (47,250), currenttx liilities of 2,391 (1,732) nd non interest-ering nd interest-eringliilities held for sle, s recognized in ote 3. Secured nk lons t yer-end 2011 totlled 127 (216). he corresponding mount for othercurrent liilities ws 584 (1,442). f current liilities including trdepyles 102,331 (87,494) pertins to nncil instruments. efer to
note 30 Finncil instruments.
eer to ote 23 for n explntion of chnges to ssets pledged.
aSSS PG
23note
2011 2010
Property, plnt nd equipment – mortgges 128 168assets under operting leses 265 107eceivles 1,333 2,964sh, lons nd mrketle securities 78 100
ther ssets pledged 28 –otal 1,832 3,339
at yer-end, liilities for which the ove ssets were pledged totlled1,227 (2,946).
n 2010 n sset-cked securitiztion ws completed. Under theterms of the trnsction, US 616 of securities were issued tied toUS-sed lons with trucking nd construction equipment ssets scollterls. uring 2011 the lons hve een mortized nd the collterls
reduced.
G abS
24note
Contingent liabilitiesa contingent liility is recognized for possile oligtion, for which it isnot yet conrmed tht present oligtion exists tht could led to n
outow of resources; or for present oligtion tht does not meet thedenitions of provision or liility s it is not prole tht n outowof resources will e required to settle the oligtion or when sufcientlyrelile estimte of the mount cnnot e mde.
2011 2010
redit gurntees issued for customers ndothers 8,970 3,709x clims 521 490esidul vlue gurntees 2,969 2,993ther contingent liilities 4,694 3,811otal 17,154 11,003
x clims mounting to 521 (490) pertin to chrges ginst the olvoGroup for which provisions re not considered necessry.
ther contingent liilities include for exmple id nd performncecluses nd legl proceedings.
he recognized mounts for contingent liilities reect the olvoGroup’s risk exposure on gross sis. he recognized mounts hvethus not een reduced ecuse of counter gurntees received or othercollterls in cses where legl offsetting right does not exist. atecemer 31, 2011, the estimted vlue of counter gurntees receivednd other collterls, for exmple the estimted net selling price of usedproducts, mounted to 3,726 (3,893) nd minly pertins to credit gur-ntees nd residul vlue gurntees.
For more informtion regrding residul vlue gurntees, see note 21.
egal proceedingshe former lor greement etween ck rucks, nc. nd the Unitedauto Workers Union (UaW) expired on Septemer 30, 2007. ck rucksnd UaW susequently entered into new 40-month ster agreement.he greement includes the estlishment of n independent trust thtwill completely eliminte ck’s commitments for providing helthcre to
accountInG polIcy
S Faa SaS
Faa Fa 2011
116

7/29/2019 MBA VTU Project on VOLVO Group in India
http://slidepdf.com/reader/full/mba-vtu-project-on-volvo-group-in-india 121/166
retired employees. he trust ws pproved y the U.S. istrict ourt forthe stern istrict of Pennsylvni in Septemer 2011. he olvo Groupwill fund the trust with US 525 , whereof signicnt prt hs eenpid during the fourth qurter 2011. he remining funding oligtion isrecognized s nncil liility nd the remining mor tiztions will e
recognized s csh ow from nncing ctivities.n July 1999, olvo ruck orportion () nd olvo onstructionquipment () entered into onsent ecree with the U.S. nviron-mentl Protection agency (Pa). he onsent ecree stipulted, mongother provisions, tht new stricter emission requirements for certinengines tht would come into effect on Jnury 1, 2006, should epplied y nd from Jnury 1, 2005. he onsent ecree wslter trnsferred from nd to olvo Powertrin orportion. ur-ing 2008, the Pa demnded stipulted penlties from olvo Powertrinorportion in the mount, including interest, of US 72 , lleging thtthe stricter stndrds under the onsent ecree should hve een ppliedto engines mnufctured y olvo Pent during 2005. olvo Powertrindisgrees with Pa’s interprettion nd is defending the cse vigorouslysed on, mong other grounds, the fct tht the olvo Pent engineswere not suject to the onsent ecree. he dispute ws referred to U.S. court . he mount requested y the Pa is included in other contingentliilities.
issn iesel hilnd o. imited (the “”) on ovemer 30, 2009led clim t the Pthumthni Provincil ourt of First nstnce, hi-lnd, ginst ab olvo nd three of its employees, climing dmges inthe sum of bht 10.5 illion (equivlent to pproximtely SK 2.3 illion). ws one of U rucks orportion’s (U), wholly-owned susidiryof ab olvo, privte delers. clims tht ab olvo’s ctions cusedU to unlwfully terminte two greements dted ecemer 27, 2002etween U nd . n Septemer 2011, settlement ws reched´,nlly settling the sumitted clims. he settlement hd n insignicntimpct on the consolidted operting income nd nncil position of theolvo Group.
olvo is suject to numer of investigtions initited y competitionuthorities. he olvo Group is cooperting fully with the respectiveuthority.
n Septemer 2010, olvo rucks’ nd enult rucks’ UK susidirieshve, together with numer of other interntionl truck compnies,ecome the suject of n investigtion initited y the F (fce of Firrding), the british ompetition ommission. olvo rucks’ nd enultrucks’ british susidiries hve received letters from the F s pr t of
the investigtion.n Jnury 2011, the olvo Group nd numer of other compnies inthe truck industry ecme pr t of n investigtion y the uropen om-mission regrding possile violtion of U ntitrust rules.
n april 2011, the olvo Group’s truck usiness in Kore nd numerof other truck compnies ecme the suject of n investigtion y theKoren Fir rde ommission.
n y 2011, olvo Pent ecme prt of n investigtion y the uropenommission regrding possile violtion of U ntitrust rules.
n august 2011, olvo Pent ecme prt of n investigtion y theSwedish competition uthority regrding possile violtion of ntitrustrules. n ecemer 2011, the Swedish ompetition authority closed theinvestigtion, without further ctions.
Given the nture of the ongoing investigtions initited y competitionuthorities, the olvo Group cnnot exclude tht they my ffect theGroup’s result nd csh ow with n mount tht my e mteril. How-ever, s regrds the investigtions initited in urope, it is too erly tossess whether nd when such effect my occur nd hence if nd whenit could e ccounted for. he olvo Group hs therefore not reported nycontingent liility or ny provision for ny of the investigtions initited inurope. oncerning the investigtion initited in Kore contingent liilit yhs however een registered.
Glol compnies such s olvo re occsionlly involved in tx pro-cesses of vrying scope nd in vrious stges. olvo regulrly ssessesthese tx processes. When it is prole tht dditionl txes must epid nd the outcome cn e resonly estimted, the required provisionis mde.
olvo is lso involved in numer of other legl proceedings. olvodoes not elieve tht ny liilities relted to such proceedings re likelyto entil ny risk, in the ggregte, of hving mteril effect on thenncil position of the olvo Group.
aSaS WH a PaS
25note
he olvo Group engges in trnsctions with some of its ssocitedcompnies. he trnsctions consist minly of sles of vehicles to del-ers. ommercil terms nd mrket prices pply for the supply of goodsnd services to/from ssocited compnies.
2011 2010
Sles to ssocited compnies 1,296 1,082Purchse from ssocited compnies 60 50
eceivles from ssocited compnies,ec 31 186 174iilities to ssocited compnies,ec 31 129 125
he Group’s holdings of shres in ssocited compnies re presented inote 5, Shres nd prticiptions.
he olvo Group lso engges in trnsctions with enult s..s. ndits susidiries. Sles to nd purchses from enult s..s. mounted to53 (52) nd 2,321 (1,654). eceivles from nd liilities to enults. .s. totlled 11 (15) nd 372 (291), respecti vely, t ecemer 31, 2011.Sles were minly from enult rucks to enult s..s. nd comprisedcomponents nd spre prts. Purchses were minly mde y enultrucks from enult s..s. nd primrily comprised light trucks. enultrucks hs license from enult s..s. for the use of the trdemrk enult.
quipment of minor vlue ws divested to former memer of Groupmngement fter vlution y n independent vluer.
1

7/29/2019 MBA VTU Project on VOLVO Group in India
http://slidepdf.com/reader/full/mba-vtu-project-on-volvo-group-in-india 122/166
G GaS
26note
n 2011, government grnts of 783 (472) were received, nd 775 (413)
ws recognized in income sttement. he mount includes tx credits of545 (204) relted to product development, which were primrily receivedin Frnce nd the US.
ther grnts were minly received from the Swedish government nd the
uropen ommission.
PS
27note
Share-based paymentsolvo pplies FS2, Shre-sed pyments for shre-sed incentiveprogrms. FS 2 distinguishes etween “csh-settled” nd “equity-
settled” pyments. he olvo progrm includes oth csh-settled ndn equity-settled prt. he fir vlue of the equity-settled pyments isdetermined t the grnt dte, recognized s n expense during the vestingperiod nd off-set in equity. he fir vlue is sed on the shre pricereduced y dividends connected with the shre during the vesting period.additionl socil costs re reported s liility, revlued t ech lncesheet dte in ccordnce with UF 7, issued y the Swedish Finncileporting bord. he csh-settled pyment is revlued t ech lncesheet dte nd is reported s n expense during the vesting period nds short term liility. an ssessment whether the terms for llotmentwill e fullled is mde continuously. bsed on such ssessment, expensemight e djusted.
emuneration policy decided at
the Annual General eeting in 2011he annul Generl eeting of 2011 decided upon principles for remu-nertion nd other employment terms for the memers of olvo’s groupmngement. he decided principles cn e summrized s follows:
he guiding principle is tht remunertion nd other employment termsfor compny mngement, shll e competitive to ensure tht olvo cnttrct nd retin skilled persons in group mngement. he xed slryshll e competitive nd shll reect the individul’s re of responsiilitynd performnce.
n ddition to the xed slry vrile slry my e pid. he vrileslry my for the mount to mximum of 75% of the xed slrynd for the other senior executives mximum of 60% of the xed slry.he vrile slry shll e sed on the fullment of improvement tr-gets or certin nncil trgets for the olvo Group nd/or the orgniz-tionl unit for which the executive is responsile. hese trgets redecided y the bord of ab olvo nd cn e relted, for exmple, tooperting income nd/or csh ow.
he annul Generl eeting cn lso decide on shre, or shre-sed, incentive progrm. at the annul Generl eeting 2011, s pro-posed y the bord of ab olvo, it ws decided to implement long-termshre-sed incentive progrm consisting of three nnul progrms coveringech of the nncil yers 2011, 2012 nd 2013.
n ddition to xed nd vrile slry, normlly other customry enets ,such s compny cr nd compny helthcre re provided. n individulcses, ccommodtion enets nd other enets my e provided.
n ddition to pension enets provided y lw nd collective rgingreements, the memers of group mngement domiciled in Sweden cne offered dened-contriution pension pln wherey the mount of theindividul’s pensions comprises the premium pid nd ny return. emersof group mngement resident outside Sweden, or resident in Sweden uthving mteril connection to or hving een resident in country other
thn Sweden, cn e offered pension solutions tht re competitive in thecountry where the memers re, or hve een, resident or to which thememers hve mteril connection, however primrily dened-contriu-tion pension solutions.
With regrd to notice of termintion of employment for memers of groupmngement domiciled in Sweden, the notiction period is 12 months if the
compny termintes the employment nd six months if the individul termi-ntes the employment. n ddition, the employee is entitled to severnce pyof 12 months’ slry if the employment is terminted y the compny. emersresident outside Sweden or resident in Sweden ut hving mteril connec-tion to or hving een resident in country other thn Sweden cn e offerednotice periods for termintion nd severnce pyments tht re competitive inthe country where the memers re or hve een resident or to which thememers hve mteril connection, however primrily rrngements tht resimilr to wht is vlid for memers domiciled in Sweden.
he bord of ab olvo my devite from the remunertion policy if therere specic resons to do so in n individul cse. he bord hs decidedon one such devition y pproving tht the vrile slry for the Presidentof olvo aero cn exceed 60% of the xed nnul slry i f certin conditionsrelted to the potentil divestment of olvo aero re met.
Fee paid to the Board o directorsaccording to resolution dopted t the annul Generl eeting 2011,the fee to the bord of irectors ppointed t the annul Generl eetingfor the period until the close of the annul Generl eeting 2012 shll epid s follows: he hirmn of the bord should e wrded SK 1,800,000 nd ech of the other memers SK 600,000 with exceptionof the President nd hief xecutive fcer of ab olvo. n ddition, SK 300,000 should e wrded to the chirmn of the udit committee ndSK 150,000 to ech of the other memers of the udit committee ndSK 100,000 to ech of the memers of the remunertion committee.
erms o employment and remuneration tothe C and Deputy Cas of august 31, 2011, eif Johnsson retired from the position s Presi-dent nd hief xecutive fcer () of ab olvo nd ws replced ylof Persson from Septemer 1, 2011. he President nd is entitledto remunertion consisting of xed nnul slry nd vrile slry.he vrile slry is sed on operting income in reltion to the smeperiod lst yer nd/or csh ow for six months moving periods up to mximum of 75% of the xed nnul slry.
For the nncil yer 2011, eif Johnsson received xed slry of SK 8,640,000 nd vrile slr y of SK 5,913,000. he vrile slr y cor-responded to 68% of the xed slry. ther enets, minly pertining tocr nd housing, mounted to SK 329,621 in 2011. lof Persson receivedfor the period s President nd of ab olvo during 2011 xed slryof SK 3,840,000 nd vrile slry of SK 2,880,000. he vrileslry corresponded to 75% of the xed slry. ther enets from Septem-er 1, 2011, minly pertining to cr nd housing, mounted to SK 234,897.
uring his period s xecutive ice President nd eputy of abolvo from y 1 until august 31, 2011, lof Persson received xedslry of SK 2,245,000 nd vrile slry of SK 1,111,275. he vr i-
accountInG polIcy
S Faa SaS
Faa Fa 2011
118

7/29/2019 MBA VTU Project on VOLVO Group in India
http://slidepdf.com/reader/full/mba-vtu-project-on-volvo-group-in-india 123/166
le slry corresponded to 50% of the xed slry. For this period, otherenets, minly pertining to cr nd housing, mounted to SK 60,830.
eif Johnsson ws covered y the olvo executive pension plns,olvo ngement Pension (P) nd olvo xecutive Pension (P).lof Persson is covered oth y pension enets provided under collectivergin greements nd y the P nd P plns. he retirement enetunder the olvo executive pension plns is dened-contriution pln withrefund protection. he disility pension is dened-enet pln. ontriu-tions to P nd P re not tx-deductile, the enet from the insur-nce is not txle to the compny, ut pension pid will e tx-deductile.he pensionle slry consists of the nnul slry nd clculted vri-le slry component . he premium for the P is SK 30,000 plus 20%of the pensionle slry over 30 income se mounts nd the premiumfor P is 10% of pensionle slry. here re no commitments otherthn the pyment of the premiums. he disility pension for lof Perssonmounts to 50% of pensionle slry. he right to disility pension isconditionl to employment nd will cese upon termintion of duty.
he President nd of ab olvo is lso covered y olvo Företgs-pension, dened contriution pln for dditionl retirement enet. he
premium is negotited ech yer. For 2011 the premium mounted toSK 512 month .
Pension premiums 2011 for eif Johnsson mounted to SK 3,317,621nd for lof Persson, for the period s President nd nd for theperiod s xecutive ice President nd eputy , to SK 1,943,988nd 559,811 respectively.
lof Persson is lso prticipting in the long-term shre-sed incentiveprogrm decided y the annul Generl eeting 2011. bsed on for2011, lof Persson will receive 97,109 shres during 2014/2015 reltedto 2011 if ll progrm conditions re met (see further informtion underong-term incentive progrm elow). he mount of txle enetrelted to these shres is determined t the time of llotment.
lof Persson hs six-month notice of termintion on his own inititivend twelve months’ notice of termintion from ab olvo. f terminted y thecompny within three yers from entering the position s President nd
, lof Persson is entitled to severnce pyment equivlent to twelvemonths’ slry. herefter, he is not entitled to severnce pyments.
emuneration to other senior executives
Fixed and var iable salariesemers of group mngement nd numer of senior executivesreceive vrile slries in ddition to xed slries. rile slries rein most cses sed on the fulllment of certin improvement trgets ornncil trgets. he trgets re decided y the bord of irectors in abolvo nd cn, for exmple, relte to operting income in reltion to cor-responding period previous yer nd/or csh ow for six month rollingperiod. uring 2011, vrile slry could mount to mximum of 60%of the xed nnul slry.
For the nncil yer 2011, xed slries mounted to SK 58,225,074
nd vrile slries mounted to SK 23,875,016 for memers of groupmngement excluding the nd the eputy . Group mngementcomprised, in ddition to the nd eputy , 16 memers t theeginning of the yer nd 16 memers t the end of the yer. ther enets,minly pertining to cr nd housing, mounted to SK 7,243,479 in2011. Group mngement, excluding the nd the eputy , willreceive 576,965 shres during 2014/2015 relted to 2011 under thelong-term shre-sed incentive progrm if ll progrm conditions remet (see further informtion under ong-term incentive progrm elow).
Severance paymentshe employment contrcts for memers of group mngement nd certinother senior executives contin rules governing severnce pymentswhen the compny termintes the employment. For memers domiciled inSweden, the rules provide tht, when the compny termintes the employ-
ment, n employee is entitled to severnce pyment equivlent to twelve
months’ slry. n certin older contrcts, the pyment could equl 24months’ slry depending on ge t dte of severnce. n greementsconcluded fter the spring of 1993, severnce py is reduced, in the eventthe employee gins employment during the severnce period, with nmount equl to 75% of the income from the new employment. n gree-ments concluded fter the spring of 2004, severnce py is reduced ythe full income from the new employment. With few exceptions, the sever-nce pyment is equl to twelve months’ slry.
emers hving mteril connection to country other thn Sweden cne offered notice periods for termintion nd severnce pyments tht recompetitive in the country to which the memers hve mteril connection.
Pensionsemers of group mngement nd certin other senior executives reoffered pensions tht re competitive in the country in which the personis or hve een domiciled or in the country to which the person is essentillyconnected.
Previous pension greements for certin senior executives stipultedtht erly retirement could e otined from the ge of 60. agreements for
retirement t ge 60 re no longer signed, nd re insted replced y dened-contriution pln with pension premium pyments t the longest tothe ge of 65 yers. he premium constitutes 10% of the pensionle slry.
rlier dened-enet pension plns, which entitled the employee to50% of the pensionle slry fter norml retirement ge, hve in Swedeneen replced y dened-contriution pln. he pension pln includesemployees orn efore 1979 nd is complement to the collective greementregrding occuptionl pension. he premium constitutes of SK 30,000plus 20% of the pensionle slry over 30 income se mounts. hepensionle slry consists of the twelve times the current monthly slrynd the verge of the vrile slry for the previous ve yers. Pensionpremiums mounted to SK 29,143,321 for other memers of groupmngement in 2011.
Volvo Group’s total costs or remuneration and benets to
senior executivesosts for totl remunertion nd enets to the memers of group mnge-ment in 2011 re pertining to the following: xed slry SK 110 million(89); vrile slry SK 43 million (39); other enets SK 12 million(10) nd pensions SK 46 million (51). he cost relted to the long-termshre-sed incentive progrm is reected over the vesting period ndmounted to SK 26 million (0) for 2011. otl costs for memers ofgroup mngement include socil fees on slries nd enets, specilpension tx nd dditionl costs for other enets. he remunertionmodel of the olvo Group is to min prt designed to follow chnges inthe protility of the Group.
ong-term incentive programhe annul Generl eeting held in 2011 pproved long-term shre-sed incentive progrm for up to 300 prticipnts nd comprising the
yers 2011 to 2013. he progrm consists of three nnul progrms forwhich the mesurement periods re ech of the respective nncil yers. a prerequisi te for prticipt ion in the progrm is tht the prt ici-pnts invest portion of their slry in olvo shres nd retin theseshres nd continue to e employed y the olvo Group for t lest three yers f ter the investment hs een mde. Under specil circumstnces,it is possile to mke exceptions to the requirement of continued employ-ment (so clled “good lever” situtions).
he ab olvo bord is, in the event of exceptionl conditions, entitledto limit or omit llotment of performnce shres. n ddition, if the annulGenerl meeting of ab olvo resolves tht no dividend shll e pid to theshreholders for specic nncil yer, no mtching shres re llotedfor the yer in question. Shres re grnted under the progrm during therespective nncil yer. at the end of the vesting period, the min rule istht the prticipnts will e llotted one mtching shre per invested
shre nd, ssuming tht the olvo Group’s (return on equity) for the 1

7/29/2019 MBA VTU Project on VOLVO Group in India
http://slidepdf.com/reader/full/mba-vtu-project-on-volvo-group-in-india 124/166
ages, salaries and otherremunerations 2011 2010
SK bord nd
Presidents1
of which vrileslries
theremployees
bord ndPresidents1
of which vrileslries
theremployees
ab olvo 31.5 9.9 199.2 26.2 8.0 184.6Susidiries 770.9 175.5 36,036.9 1,005.0 104.8 32,647.4Group total 802.4 185.4 36,236.1 1,031.2 112.8 32,832.0
ages, salaries and otherremunerations and socialcosts 2011 2010
SK Wges, slries
remun. Socil costsPension
costsWges, slries
remun. Socil costs Pension costs4
ab olvo2 230.7 68.1 34.0 210.8 60.8 59.1Susidiries 36,807.8 8,583.5 3,437.0 33,652.4 8,308.8 3,514.8Group total3 37,038.5 8,651.6 3,471.0 33,863.2 8,369.6 3,573.9
1 ncluding current nd former bord memers, Presidents nd xecutive icePresidents.
2 he Prent ompny’s pension costs, per tining to bord memers nd Presidentsre disclosed in ote 3 in the Prent ompny.
3 f the Group’s pension costs, 96. 8 (146.6) pertin to bord memers nd Pres-idents, including current nd former bord memers, Presidents nd xecutiveice Presidents. he Group’s outstnding pension oligtions to these individu-ls mount to 337.7 (334.4).
4 n certin countries, such s Sweden, prt of socil cost relte to pensions. nprevious yers, olvo hs reclssied such portion of socil cost to pension costfor Swedish group compnies. n the 2011 annul eport , these pension reltedcomponents of socil cost hs not een reclssied to pension cost , whichmkes for etter comprison with other Swedish compnies. Pension cost for2010 hs een djusted downwrds with n mount of SK 1,166 million compredto the 2010 annul eport.
2011 2010
Average numbero employees
umer ofemployees
of whichwomen, %
umer ofemployees
of whichwomen, %
AB Volvo Sweden 171 49 198 51
Subsidiaries Sweden 24,793 20 23,313 20Western urope 24,241 17 23,515 17stern urope 6,220 21 5,768 22orth americ 15,380 18 12,429 19
South americ 6,080 14 5,264 14asi 22,915 11 21,205 10
ther countries 2,448 17 2,558 15Group total 102,248 18 94,250 17
2011 2010
Board members1 and other senior executives
umert yer-
end
of whichwomen,
%
umert yer-
end
of whichwomen,
%
AB Volvo bord memers1 14 14 12 17 nd G 17 6 17 6
Volvo Group bord memers1 898 13 929 12Presidents nd other seniorexecutives 1,034 17 1,053 15
1 xcluding deputy bord memers.
ong term incentive pro-gram (share settled planversion)
Shares granted conditional under the plan but not yet alloted (in thousand shares)
esting yerBeginning o
the year Grnted 2011ncelled/
forfeited 2011allotments
during 2011 nd o the yearost 2011
(SK )1
ear 2011incentive program 2014/2015 0 2,488 (11) (1) 2,476 69.8
1 he fir vlue of the pyments is determined sed on the shre price t the grnt dte reduced y the discounted vlue of expected dividends connected with theshre during the vesting period. he cost for the progrm is recognized over the vesting period. he cost includes socil security cost.
prticulr nncil yer mounts to t lest 10 percent, numer of per-formnce shres. ximum llotment of performnce shres correspondsto seven shres for the , six shres for other memers of group mn-gement nd ve shres for other prticipnts in the progrm for echinvested shre, suject to reching 25 percent. for 2011 ws
23.1%, which mens tht numer of per formnce shres reched out90 percent of the mximum grnt. allotment of shres will e mde
through olvo owned, erlier re-purchsed, olvo shres. Prticipnts incertin countries will e offered csh-sed version of the incentiveprogrm. For prticipnts in these countries, no investment is requiredy the prticipnt nd the progrm does not comprise n element ofmtching shres. allotment of shres in this version is replced y
csh llotment t the end of the vesting period. ther progrm condi-tions re similr etween the progrms.
he cost for the csh-sed version of the incentive progrm mountedto SK 4 million including socil security cost during 2011.
a numer of progrm prticipnts tht re leving the compny hs
een determined to e “good levers” nd re therefore entitled to ccu-multed llotment of shres. uring 2011, 929 shres hve een lloted
to prticipnts, nd n dditionl 203,520 shres will e lloted to pr-ticipnts when the employees leve the compny.
he totl cost for the 2011 incentive progrm over the period 2011 to
2014 is estimted to SK 273 million including socil security cost.actul cost will e impcted y chnges in the shre price.
S Faa SaS
Faa Fa 2011
120
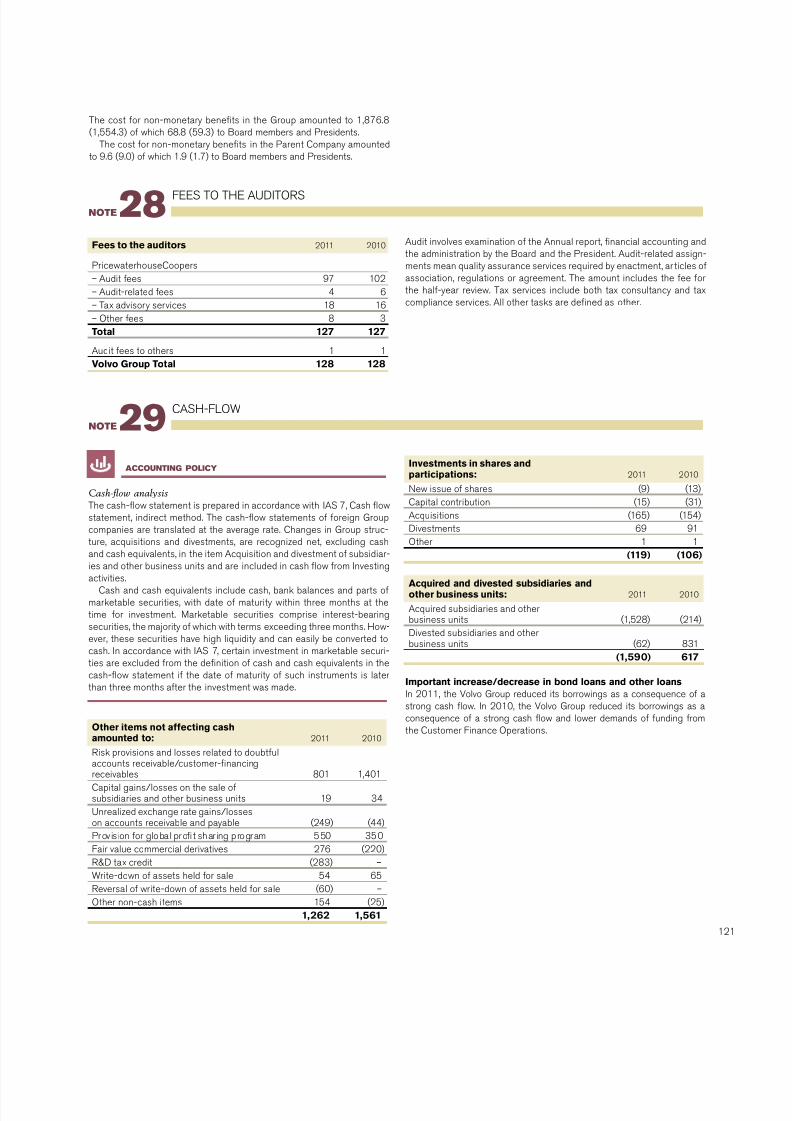
7/29/2019 MBA VTU Project on VOLVO Group in India
http://slidepdf.com/reader/full/mba-vtu-project-on-volvo-group-in-india 125/166
FS H aUS
28note
Fees to the auditors 2011 2010
Pricewterhouseoopers– audit fees 97 102– audit-relted fees 4 6– x dvisory services 18 16– ther fees 8 3otal 127 127
audit fees to others 1 1
Volvo Group otal 128 128
audit involves exmintion of the annul report, nncil ccounting ndthe dministrtion y the bord nd the President. audit-relted ssign-ments men qulity ssurnce services required y enctment, r ticles ofssocition, regultions or greement. he mount includes the fee forthe hlf-yer review. x services include oth tx consultncy nd txcomplince services. all other tsks re dened s other.
Cash-ow analysishe csh-ow sttement is prepred in ccordnce with aS 7, sh owsttement, indirect method. he csh-ow sttements of foreign Groupcompnies re trnslted t the verge rte. hnges in Group struc-ture, cquisitions nd divestments, re recognized net, excluding csh
nd csh equivlents, in the item acquisition nd divestment of susidir-ies nd other usiness units nd re included in csh ow from nvestingctivities.
sh nd csh equivlents include csh, nk lnces nd prts ofmrketle securities, with dte of mturity within three months t thetime for investment. rketle securities comprise interest-eringsecurities, the mjority of which with terms exceeding three months. How-ever, these securities hve high liquidity nd cn esily e converted tocsh. n ccordnce with aS 7, certin investment in mrketle securi-ties re excluded from the denition of csh nd csh equivlents in thecsh-ow sttement if the dte of mturity of such instruments is lterthn three months fter the investment ws mde.
ther items not aecting cash
amounted to: 2011 2010isk provisions nd losses relted to doutfulccounts receivle/customer-nncingreceivles 801 1,401pitl gins/losses on the sle ofsusidiries nd other usiness units 19 34Unrelized exchnge rte gins/losseson ccounts receivle nd pyle (249) (44)Prov is ion for glol prot shr ing progrm 550 350Fir vlue commercil derivtives 276 (220)& tx credit (283) –Write-down of ssets held for sle 54 65eversl of write-down of ssets held for sle (60) –ther non-csh items 154 (25)
1,262 1,561
nvestments in shares andparticipations: 2011 2010
ew issue of shres (9) (13)pitl contriution (15) (31)acquisitions (165) (154)ivestments 69 91ther 1 1
(119) (106)
Acquired and divested subsidiaries andother business units: 2011 2010
acquired susidiries nd otherusiness units (1,528) (214)ivested susidiries nd otherusiness units (62) 831
(1,590) 617
mportant increase/decrease in bond loans and other loansn 2011, the olvo Group reduced its orrowings s consequence of strong csh ow. n 2010, the olvo Group reduced its orrowings s consequence of strong csh ow nd lower demnds of funding fromthe ustomer Finnce pertions.
aSH-FW
29note
accountInG polIcy
he cost for non-monetry enets in the Group mounted to 1,876.8(1,554.3) of which 68.8 (59.3) to bord memers nd Presidents.
he cost for non-monetry enets in the Prent ompny mountedto 9.6 (9.0) of which 1.9 (1.7) to bord memers nd Presidents.
1

7/29/2019 MBA VTU Project on VOLVO Group in India
http://slidepdf.com/reader/full/mba-vtu-project-on-volvo-group-in-india 126/166
Recognition o fnancial asse ts and liabilit iesPurchses nd sles of nncil ssets nd liilities re recognized onthe trnsction dte. a nncil sset is derecognized in the lncesheet when ll signicnt risks nd enets linked to the sset hve eentrnsferred to third prty. he sme principles re pplied for nncilssets in the segment reporting of the olvo Group.
he fir vlue of ssets is determined sed on vlid mrket prices,when ville. f mrket prices re unville, the fir vlue is deter-mined for ech sset using vrious mesurement techniques. rnsctionexpenses re included in the sset’s fir vlue, except in cses in whichthe chnge in vlue is recognized in prot nd loss. he trnsction coststht rise in conjunction with the ssumption of nncil liilities remortized over the term of the lon s nncil cost .
medded derivtives re detched from the relted min contrct, if
pplicle. ontrcts contining emedded derivtives re vlued t firvlue in prot nd loss if the contrcts’ inherent risk nd other chrcter-istics indicte close reltion to the emedded derivtive.
Finncil ssets t fir vlue through prot nd lossall of olvo’s nncil ssets tht re recognized t fir vlue in prot ndloss re clssied s held for trding. his includes derivtives to whicholvo hs decided not to pply hedge ccounting s well s derivtes thtre not prt of n evidently effective hedge ccounting policy pursunt toaS 39. Gins nd losses on these ssets re recognized in prot ndloss. Short-term investments tht re recognized t fir vlue minly com-prise interest-ering nncil instruments nd re recognized in ote18. erivtives used for hedging interest rte exposure in the customernncing portfolio re included in this ctegory. Unrelized gins ndlosses from uctutions in the fir vlues of the nncil instruments re
recognized in net nncil items, since it is not prcticlly possile topply hedge ccounting in ccordnce with aS 39 due to the lrgenumer of contrcts tht the customer nncing portfolio comprises. npplicle cses, when the requirements for hedge ccounting re con-sidered to e fullled, olvo will herefter consider the ppliction ofhedge ccounting for these kinds of instruments. olvo intends to holdthese derivtives to mturity, which is why, over time, the mrket vlutionwill e offset s consequence of the interest-rte xing on orrowingnd lending for the customer-nnce opertions, nd thus not ffectoperting income or csh ow.
efer to note 9 regrding derivtives used for hedging interest rte expo-sure in the customer nncing portfolio recongniced in net nncil items.
Finncil instruments used for hedging currency risks rising fromfuture rm commercil csh ows re lso recognized under this ctegory.Unrelized gins nd losses from uctutions in the fir vlues of the
nncil instruments relted to receivle or pyle will e recognizedin the operting income of the respective segments. a ll other unrelizedgins nd losses from uctutions in the fir vlues of the nncil instru-ments re reported in the operting income of the segment Group func-tions nd other. When the nncil instruments hve een relized theincome effect is reported within the respective segments.
on receivles nd other receivlesons nd receivles re non-derivtive nncil ssets with xed ordeterminle pyments tht re not quoted in n ctive mrket. accountsreceivles re recognized initilly t fir vlue, which normlly corre-sponds to the nominl vlue. n the event tht the pyment terms exceedone yer, the receivle is recognized t the discounted present vlue.after initil recognition, lons nd receivles re mesured t mortized
cost in ccordnce with the effective interest method. Gins nd lossesre recognized in prot nd loss when the lons or receivles re
divested or impired, s well s in pce with recognition of ccrued interest.
Assessment o impairment requirement – loan receivables and other receivablesolvo performs routine controls to ensure tht the crrying mount ofssets vlued t mortized cost hs not decresed, which would result inrecognition of n impirment loss in prot nd loss. Provisions for doutfulreceivles re recognized on n ongoing sis following ssessments of possile chnge in the ility of customers to py.
mpirment comprises the difference etween the crrying mount ndthe current vlue of the estimted future pyment ow ttriutle to thespecic sset with considertion to the fir vlue of ny collterl. is-counting of future csh ow is sed on the effective interest rte usedinitilly. nitilly, the impirment requirement is evluted for ech respec-tive sset. f, sed on ojective grounds, it cnnot e determined tht
one or more ssets re suject to n impirment loss, the ssets regrouped in units sed, for exmple, on similr credit risks to evlute theimpirment loss requirement collectively. ndividully impired ssets orssets impired during previous periods re not included when groupingssets for collective ssessment. f the conditions tht gve rise to therecognition of n impirment loss lter prove to no longer e vlid theimpirment loss is reversed in prot nd loss s long s the crryingmount does not exceed the mortized cost t the time of the reversl.
eer to otes 15 and 16 for more informtion regrding olvo’s lonreceivles nd ccounts receivles.
assets ville for slehis ctegory includes ssets ville for sle nd ssets tht hve noteen clssied in ny of the other ctegories. hese ssets re initillymesured t fir vlue including trnsction costs. any chnge in vlue is
recognized directly in other comprehensive income. he cumultive ginor loss recognized in other comprehensive income is reversed in prot ndloss on the sle of the sset. Unrelized declines in vlue re recognizedin other comprehensive income, unless the decline is signicnt or pro-longed. hen the impirment is recognized in prot nd loss. f the eventtht cused the impirment no longer exists, impirment cn e reversedin prot nd loss if it does not involve n equity instrument.
rned or pid interest ttriutle to these ssets is recognized inprot nd loss s pr t of net nncil items in ccordnce with the effec-tive interest method. ividends received ttriutle to these ssets rerecognized in prot nd loss s ncome from other investments.
olvo recognizes shres nd prticiptions in listed compnies t mrketvlue on the lnce-sheet dte, with the exception of investments clssi-ed s ssocited compnies nd joint ventures. Holdings in unlistedcompnies for which mrket vlue is unville re recognized t
cquisition cost. olvo clssies these types of investments s ssetsville for sle.
Assessment o impairment – assets available or salef ssets ville for sle re impired, the impired mount is the differenceetween the sset’s cost (djusted for ny ccrued interest if pplicle)nd its fir vlue. However, if equity instruments, such s shres, reinvolved, completed impirment is not reversed in prot nd loss. n theother hnd, impirments performed on det instruments (interest-eringinstruments) re wholly or prtly reversile in prot nd loss, in thoseinstnces where n event, proven to hve occurred fter the impirmentws performed, is identied nd impcts the vlution of tht sset.
eer to ote 5 for olvo’s holdings of shres nd prticiptions in listedcompnies.
Faa SUS
30note
accountInG polIcy
S Faa SaS
Faa Fa 2011
122
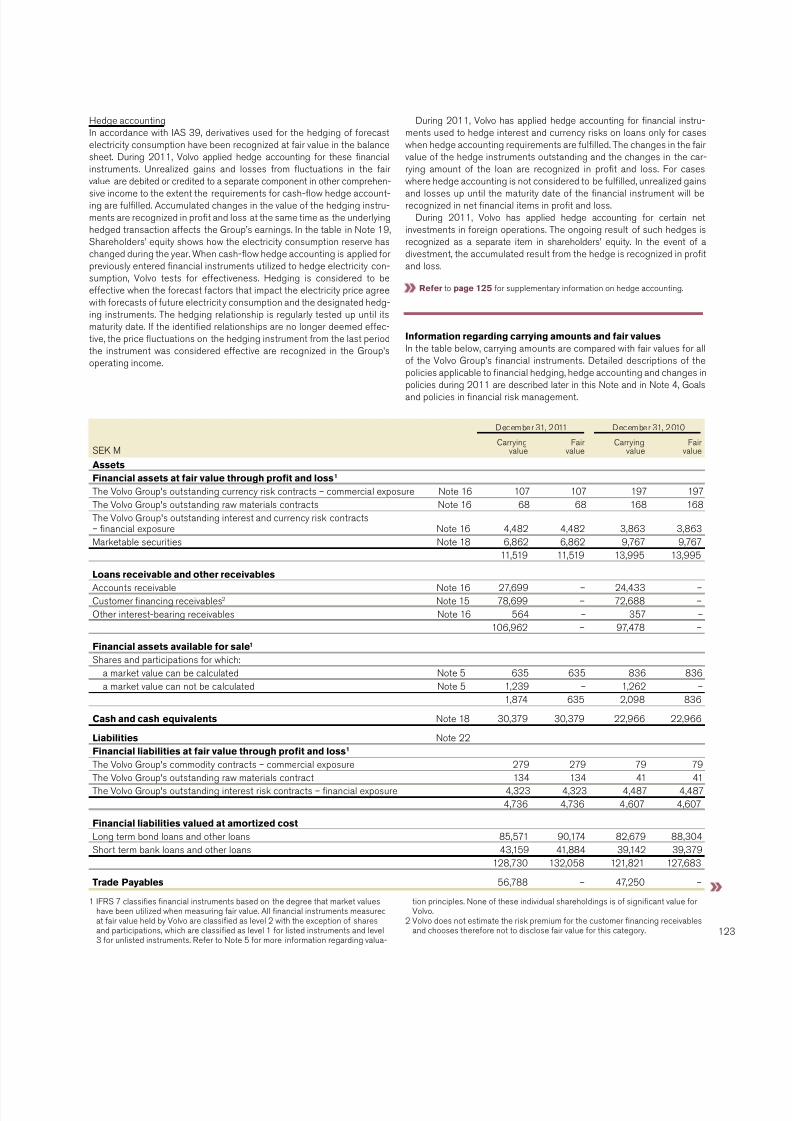
7/29/2019 MBA VTU Project on VOLVO Group in India
http://slidepdf.com/reader/full/mba-vtu-project-on-volvo-group-in-india 127/166
ecemer 31, 2011 ecemer 31, 2010
SK rrying
vlueFir
vluerrying
vlueFir
vlue
Assets Financial assets at air value through prot and loss1 he olvo Group's outstnding currency risk contrcts – commercil exposure ote 16 107 107 197 197he olvo Group's outstnding rw mterils contrcts ote 16 68 68 168 168he olvo Group's outstnding interest nd currency risk contrcts– nncil exposure ote 16 4,482 4,482 3,863 3,863rketle securities ote 18 6,862 6,862 9,767 9,767
11,519 11,519 13,995 13,995
oans receivable and other receivablesaccounts receivle ote 16 27,699 – 24,433 –ustomer nncing receivles2 ote 15 78,699 – 72,688 –ther interest-ering receivles ote 16 564 – 357 – 106,962 – 97,478 –
Financial assets available or sale1 Shres nd prticiptions for which:
mrket vlue cn e clculted ote 5 635 635 836 836 mrket vlue cn not e clculted ote 5 1,239 – 1,262 –
1,874 635 2,098 836
Cash and cash equivalents ote 18 30,379 30,379 22,966 22,966
iabilities ote 22 Financial liabilities at air value through prot and loss1 he olvo Group's commodity contrcts – commercil exposure 279 279 79 79he olvo Group's outstnding rw mterils contrct 134 134 41 41he olvo Group's outstnding interest risk contrcts – nncil exposure 4,323 4,323 4,487 4,487
4,736 4,736 4 ,607 4,607
Financial liabilities valued at amortized cost ong term ond lons nd other lons 85,571 90,174 82,679 88,304Short term nk lons nd other lons 43,159 41,884 39,142 39,379
128,730 132,058 121,821 127,683
rade Payables 56,788 – 47,250 –
Hedge ccountingn ccordnce with aS 39, derivtives used for the hedging of forecstelectricity consumption hve een recognized t fir vlue in the lncesheet. uring 2011, olvo pplied hedge ccounting for these nncilinstruments. Unrelized gins nd losses from uctutions in the fir
vlue re deited or credited to seprte component in other comprehen-sive income to the extent the requirements for csh-ow hedge ccount-ing re fullled. accumulted chnges in the vlue of the hedging instru-ments re recognized in prot nd loss t the sme time s the underlyinghedged trnsction ffects the Group’s ernings. n the tle in ote 19,Shreholders’ equity shows how the electricity consumption reserve hschnged during the yer. When csh-ow hedge ccounting is pplied forpreviously entered nncil instruments utilized to hedge electricity con-sumption, olvo tests for effectiveness. Hedging is considered to eeffective when the forecst fctors tht impct the electricity price greewith forecsts of future electricit y consumption nd the designted hedg-ing instruments. he hedging reltionship is regulrly tested up until itsmturity dte. f the identied reltionships re no longer deemed effec-tive, the price uctutions on the hedging instrument from the lst periodthe instrument ws considered effective re recognized in the Group’soperting income.
uring 2011, olvo hs pplied hedge ccounting for nncil instru-ments used to hedge interest nd currency risks on lons only for cseswhen hedge ccounting requirements re fullled. he chnges in the firvlue of the hedge instruments outstnding nd the chnges in the cr-rying mount of the lon re recognized in prot nd loss. For cses
where hedge ccounting is not considered to e fullled, unrelized ginsnd losses up until the mturity dte of the nncil instrument will erecognized in net nncil items in prot nd loss.
uring 2011, olvo hs pplied hedge ccounting for certin netinvestments in foreign opertions. he ongoing result of such hedges isrecognized s seprte item in shreholders’ equity. n the event of divestment, the ccumulted result from the hedge is recognized in protnd loss.
eer to page 125 for supplementry informtion on hedge ccounting.
normation regarding carrying amounts and air valuesn the tle elow, crrying mounts re compred with fir vlues for llof the olvo Group’s nncil instruments. etiled descriptions of thepolicies pplicle to nncil hedging, hedge ccounting nd chnges inpolicies during 2011 re descried lter in this ote nd in ote 4, Golsnd policies in nncil risk mngement.
1 FS 7 clssies nncil instruments sed on the degree tht mrket vlueshve een utilized when mesuring fir vlue. all nncil instruments mesured
t fir vlue held y olvo re clssied s level 2 with the exception of shresnd prticiptions, which re clssied s level 1 for listed instruments nd level3 for unlisted instruments. efer to ote 5 for more informtion regrding vlu-
tion principles. one of these individul shreholdings is of signicnt vlue forolvo.
2 olvo does not estimte the risk premium for the customer nncing receivlesnd chooses therefore not to disclose fir vlue for this ctegory. 1

7/29/2019 MBA VTU Project on VOLVO Group in India
http://slidepdf.com/reader/full/mba-vtu-project-on-volvo-group-in-india 128/166
eported in operating income1 2011 2010
SK Gins/losses
nterestincome
nterestexpenses
Gins/losses
nterestincome
nterestexpenses
Financial assets and liabilities at air value throughprot and loss2 urrency risk contrcts-commercil exposure3 (91) – – 661 – –oans receivable and other receivables accounts receivles / trde pyles 65 – – (239) – –ustomer nncing receivles FS 68 4,862 – 58 5,144 –Financial assets available or sale Shres nd prticiptions for which mrket vlue cn e clculted 20 – – 40 – –Shres nd prticiptions for which mrket vlue cnnot e clculted 25 – – 10 – –Financial liabilities valued at amortized cost4 – – (2,456) – – (2,830)ect on operating income 87 4,862 (2,456) 530 5,144 (2,830)
eported in net nancial items5
Financial assets and liabilities at air value throughprot and lossrketle securities 224 – – 290 – –nterest nd currency rte risk contrcts- nncil exposure6 (409) – – (1,319) – –
oans receivable and other receivables – 3 – – 7 –sh nd sh equivlents7 – 545 – (274) 423 –Financial liabilities valued at amortized cost6 771 – (2,642) 1,560 – (2,591)ect on net nancial items 586 548 (2,642) 257 430 (2,591)
1 nformtion is provided regrding chnges in provisions for doutful receivlesnd customer nncing in otes 15 nd 16, accounts receivle nd customernncing receivles, s well s in ote 8, ther nncil income nd expenses.
2 accrued nd relized interest is included in gins nd losses relted to Finncilssets nd liilities t fir vlue through prot nd loss.
3 olvo uses forwrd contrcts nd currency options to hedge the vlue of futurepyment ows in foreign currency. both unrelized nd relized result on currencyrisk contrcts re included in the tle. efer to ote 4, Gols nd policies innncil risk mngement.
4 nterest expenses ttriutle to nncil liilities vlued t mortized cost rec -ognized in operting income include interest expenses for nncing opertionllesing ctivities, not clssied s nncil instruments.
5 n gins, losses, income nd expenses relted to nncil instruments recognizedin et nncil items, 569 (520) ws recognized under other nncil incomend expenses. efer to ote 9, ther nncil income nd expenses for furtherinformtion. nterest expenses ttriutle to pensions, 191 (276) re not includedin this tle.
6 Gins nd losses relted to chnges in foreign currency rtes on currency rterisk contrcts for nncil exposure is neg 746 (neg 1,637) nd 771 (1,560) fornncil liilities vlued t mortized cost . efer to ote 9, ther nncil incomend expenses for further informtion.
7 he net effect of gins nd losses relted to the devlution in enezuel 2010ws neg 274.
Derecognition o nancial assetsFinncil ssets tht hve een trnsferred re included in full or in prtin the reported ssets of the olvo Group pursunt to the degree the risk nd rewrds relted to the sset hve een trnsferred to the recipient. nline with aS 39, Finncil nstruments, ecognition nd esurement, n
evlution is performed to estlish whether, sustntilly, ll the risksnd rewrds hve een trnsferred to n externl prty. Where olvo con-cludes this is not the cse, the portion of the nncil ssets correspond-ing to olvo’s continuous involvement is recognized. at ecemer 31,2011, ssets corresponding to olvo’s continuous involvement, primrilywithin customer nncing opertions, in n mount of SK 0.6 illion (1.2)were recognized y olvo.
Gains, losses, interest income and expenses related to nancialinstrumentshe tle elow shows how gins nd losses s well s interest incomend expenses hve ffected income fter nncil items in the olvoGroup divided on the different ctegories of nncil instruments.
S Faa SaS
Faa Fa 2011
124
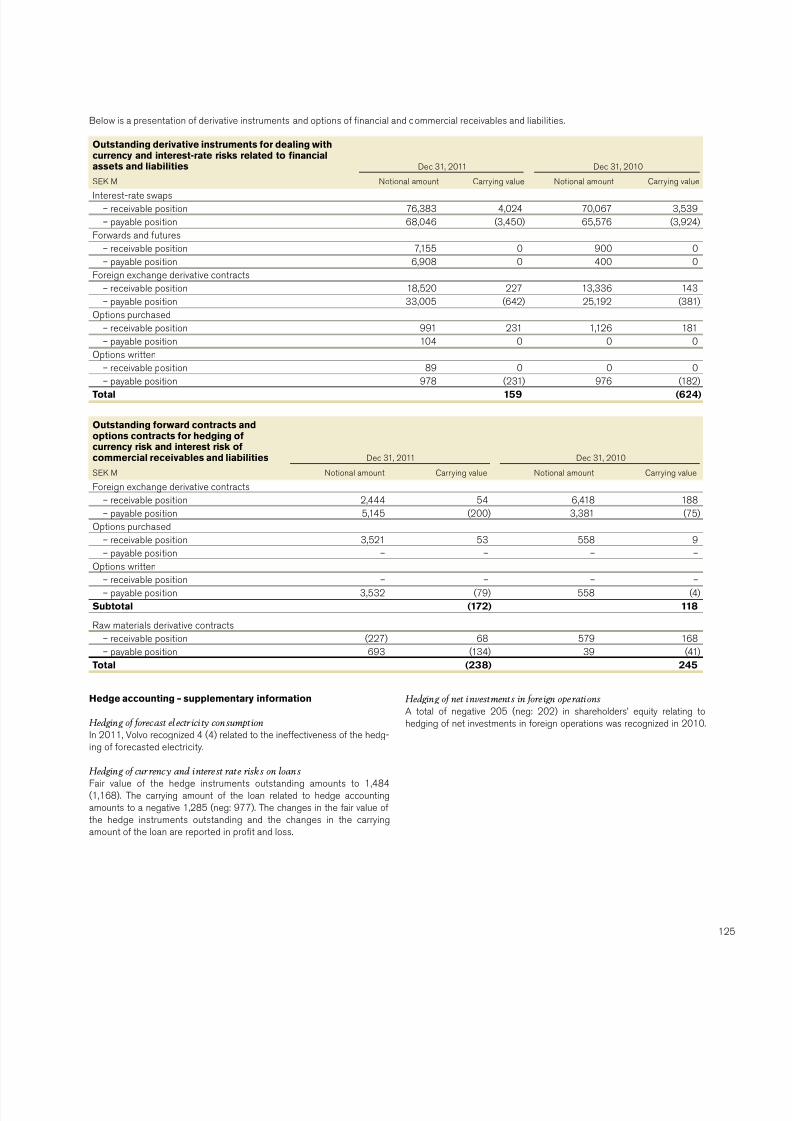
7/29/2019 MBA VTU Project on VOLVO Group in India
http://slidepdf.com/reader/full/mba-vtu-project-on-volvo-group-in-india 129/166
below is presenttion of derivtive instruments nd options of nncil nd commercil receivles nd liilities.
utstanding derivative instruments or dealing withcurrency and interest-rate risks related to nancialassets and liabilities
ec 31, 2011 ec 31, 2010
SK otionl mount rrying vlue otionl mount rrying vluenterest-rte swps
– receivle position 76,383 4,024 70,067 3,539– pyle position 68,046 (3,450) 65,576 (3,924)
Forwrds nd futures– receivle position 7,155 0 900 0– pyle position 6,908 0 400 0
Foreign exchnge derivtive contrcts– receivle position 18,520 227 13,336 143– pyle position 33,005 (642) 25,192 (381)
ptions purchsed– receivle position 991 231 1,126 181– pyle position 104 0 0 0
ptions written
– receivle position 89 0 0 0– pyle position 978 (231) 976 (182)
otal 159 (624)
utstanding orward contracts andoptions contracts or hedging ocurrency risk and interest risk ocommercial receivables and liabilities
ec 31, 2011 ec 31, 2010
SK otionl mount rrying vlue otionl mount rrying vlue
Foreign exchnge derivtive contrcts– receivle position 2,444 54 6,418 188– pyle position 5,145 (200) 3,381 (75)
ptions purchsed– receivle position 3,521 53 558 9
– pyle position – – – –ptions written
– receivle position – – – –– pyle position 3,532 (79) 558 (4)
Subtotal (172) 118
w mterils derivtive contrcts– receivle position (227) 68 579 168– pyle position 693 (134) 39 (41)
otal (238) 245
edge accounting – supplementary inormation
Hedging o orecast el ectr ici ty consumption
n 2011, olvo recognized 4 (4) relted to the ineffectiveness of the hedg-ing of forecsted electricity.
Hedging o cur renc y and interest rate risks on loansFir vlue of the hedge instruments outstnding mounts to 1,484(1,168). he crrying mount of the lon relted to hedge ccountingmounts to negtive 1,285 (neg: 977). he chnges in the fir vlue ofthe hedge instruments outstnding nd the chnges in the crryingmount of the lon re reported in prot nd loss.
Hedging o net investments in ore ign ope rationsa totl of negtive 205 (neg: 202) in shreholders’ equity relting tohedging of net investments in foreign opertions ws recognized in 2010.
1

7/29/2019 MBA VTU Project on VOLVO Group in India
http://slidepdf.com/reader/full/mba-vtu-project-on-volvo-group-in-india 130/166
Pa Pa ab orporte registrtion numer 556012-5790.amounts in SK unless otherwise specied. he mounts within prentheses refer to the preceding yer.
Board o Directors’ reportab olvo is Prent ompny of the olvo Group nd its opertions com-prise the Group’s hed ofce with stff together with some corportefunctions.
ncome from investments in Group compnies includes dividendsmounting to 2,719 (8,145) nd Group contriutions, trnsfer price djust-ments nd roylties net of 6,086 (5,126). ividends include 2,500 fromolvo onstruction quipment .
he crrying vlue of shres nd prticiptions in Group compniesmounted to 59,460 (59,429), of which 58,934 (58,903) pertined toshres in wholly owned susidiries. he corresponding shreholders’equity in the susidiries (including equity in untxed reserves ut exclud-ing minorit y interests) mounted to 99,139 (90,261).
Shres nd prticiptions in non-Group compnies included 413 (170) inssocited compnies tht re reported in ccordnce with the equitymethod in the consolidted ccounts. he portion of shreholders’ equity inssocited compnies ccruing to ab olvo totled 413 (322). Shres ndprticiptions in non-Group compnies include listed shres in eutz aGwith crrying vlue of 299, corresponding to the quoted mrket price t yer-end. n 2011 revlution of the ownership hs decresed the vlue y159, recognized in equity nd included in ther comprehensive income inthe income sttement.
Finncil net det mounted to 30,665 (30,376).ab olvo’s risk cpitl (shreholders’ equity plus untxed reserves)
mounted to 42,163 corresponding to 55% of totl ssets. he comprlegure t yer-end 2010 ws 54%.
Income statement
SK 2011 2010
Net sales ote 2 721 564
ost of sles ote 2 (721) (564)Gross income 0 0
administrtive expenses ote 2, 3 (880) (652)ther operting income nd expenses ote 4 (146) 8ncome from investments in Group compnies ote 5 8,743 13,252ncome from investments in ssocited compnies ote 6 130 (94)ncome from other investments ote 7 4 3Operating income 7,851 12,517
nterest income nd similr credits ote 8 0 0nterest expenses nd similr chrges ote 8 (1,677) (893)ther nncil income nd expenses ote 9 (96) (65)Income after nancial items 6,078 11,559
alloctions ote 10 0 0ncome txes ote 11 (597) (1,231)Income for the period 5,481 10,328
other comprehensIVe Income
Income for the period 5,481 10,328
aville-for-sle investments (159) 172Other comprehensive income, net of income taxes (159) 172
Total comprehensive income for the period 5,322 10,500
Faa Fa 2011
126

7/29/2019 MBA VTU Project on VOLVO Group in India
http://slidepdf.com/reader/full/mba-vtu-project-on-volvo-group-in-india 131/166
Balance sheet
SK December 31, 2011 ecemer 31, 2010
Assets
Non-current assets
ntngile ssets ote 12 88 103ngile ssets ote 12 80 16 Financial asse ts
Shres nd prticiptions in Group compnies ote 13 59,460 59,429eceivles from Group compnies 38 0ther shres nd prticiptions ote 13 2,953 2,498eferred tx ssets ote 11 3,060 3,657
Total non-current assets 65,679 65,703
Current assets
Current receivables
urrent receivles Group compnies 10,843 12,226urrent tx receivles 0 0ther current receivles ote 14 501 261
sh nd nk ccounts 0 0Total current assets 11,344 12,487
Total assets 77,023 78,190
Shareholders' equity and liabilities
Shreholders' equity Restric ted equity
Shre cpitl (2,128,420,220 shres, quot vlue SK 1,20) 2,554 2,554Sttutory reserve 7,337 7,337
Unrestricted equity
on-restricted reserves 224 383etined ernings 26,563 21,251ncome for the period 5,481 10,328
Total shareholders’ equity 42,159 41,853
Untxed reserves ote 15 4 4
Provisions
Provisions for pensions ote 16 141 133ther provisions ote 17 42 1
Non-current l iabi lities ote 18
iilities to Group compnies 7 7ther non-current liilities 11 10
Current liabilities
rde pyles 164 78ther liilities to Group compnies 34,260 35,835ther current liilities ote 19 235 269
Total shareholders' equity and liabilities 77,023 78,190
assets pledged – –ontingent liilities ote 20 270,346 250,606
1
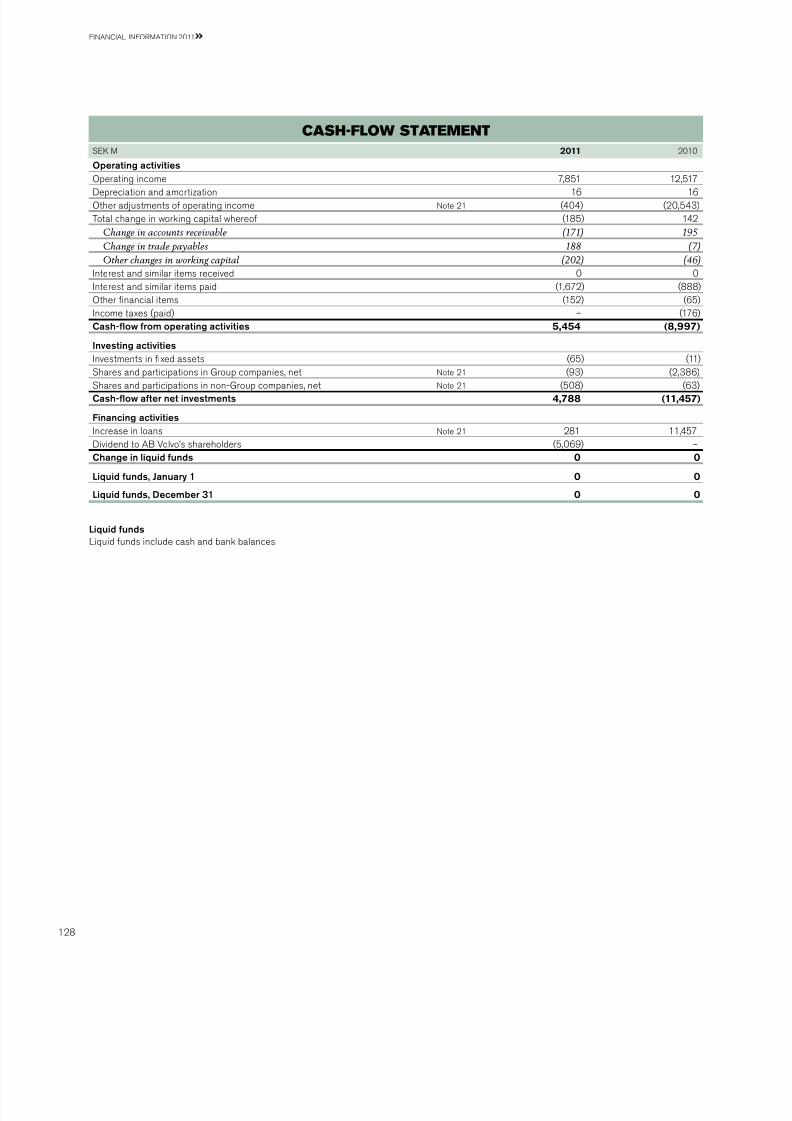
7/29/2019 MBA VTU Project on VOLVO Group in India
http://slidepdf.com/reader/full/mba-vtu-project-on-volvo-group-in-india 132/166
cash-flow statement
SK 2011 2010
Operating activities
perting income 7,851 12,517eprecition nd mortiztion 16 16ther djustments of operting income ote 21 (404) (20,543)otl chnge in working cpitl whereof (185) 142
Change in accounts receivable (171) 195
Change in trade payables 188 (7)
Other changes in working capital (202) (46)
nterest nd similr items received 0 0nterest nd similr items pid (1,672) (888)ther nncil items (152) (65)ncome txes (pid) – (176)Cash-ow from operating activities 5,454 (8,997)
Investing activities
nvestments in xed ssets (65) (11)
Shres nd prticiptions in Group compnies, net ote 21 (93) (2,386)Shres nd prticiptions in non-Group compnies, net ote 21 (508) (63)Cash-ow after net investments 4,788 (11,457)
Financing activities
ncrese in lons ote 21 281 11,457ividend to ab olvo’s shreholders (5,069) –Change in liquid funds 0 0
Liquid funds, January 1 0 0
Liquid funds, December 31 0 0
Liquid funds
iquid funds include csh nd nk lnces.
Faa Fa 2011
128

7/29/2019 MBA VTU Project on VOLVO Group in India
http://slidepdf.com/reader/full/mba-vtu-project-on-volvo-group-in-india 133/166
chanGes In shareholders’ equIty
estricted equity Unrestricted equity
SK
Shre
cpitl
Sttutory
reserve
Shrepremium
reserve
Fir vlue
reserve
etined
ernings otl
otlshreholders’
equity
Balance at December 31, 2009 2,554 7,337 190 21 21,251 21,462 31,353
ncome for the period – – – – 10,328 10,328 10,328
Other comprehensive income
aville-for-sle investments:Gin/(loss) t vlution to fir vlue – – – 172 – 172 172
ther comprehensive income – – – 172 – 172 172
Total income for the period – – – 172 10,328 10,500 10,500
Balance at December 31, 2010 2,554 7,337 190 193 31,579 31,962 41,853
ncome for the period – – – – 5,481 5,481 5,481
Other comprehensive income
aville-for-sle investments:Gin/(loss) t vlution to fir vlue – – – (159) – (159) (159)
ther comprehensive income – – – (159) – (159) (159)
Total income for the period – – – (159) 5,481 5,322 5,322
Transactions with shareholders
sh dividend – – – – (5,069) (5,069) (5,069)ividend to ab olvo’s shreholders – – 0 – 53 53 53rnsctions with shreholders – – 0 – (5,016) (5,016) (5,016)
Balance at December 31, 2011 2,554 7,337 190 34 32,044 32,268 42,159
Further informtion regrding the shre cpitl of the Prent ompny is shown in ote 19 to the consolidted nncil sttements.
1

7/29/2019 MBA VTU Project on VOLVO Group in India
http://slidepdf.com/reader/full/mba-vtu-project-on-volvo-group-in-india 134/166
amounts in SK unless otherwise specied. he mounts within prentheses refer to the preceding yer, 2010.
he ccounting principles pplied y olvo re descried in note 1 to theconsolidted nncil sttements.
he Prent ompny lso pplies F 2 including the exception in theppliction of aS 39 which concerns ccounting nd vlution of nn-cil contrcts of gurntee in fvour of susidiries nd ssocited com-pnies.
he long term shre-sed incentive progrm dopted t the annulGenerl eeting of 2011 is covered y FS 2 Shre-sed pyments.
he olvo Group hs dopted aS 19 mployee benets in its nncilreporting. he Prent ompny is still pplying the principles of Fr’secommendtion ed4 ”accounting of pension liilities nd pension costs”
f the Prent ompny’s net sles, 620 (499) pertined to Group compnies while purchses from Group compnies mounted to 602 (449).
Depreciationadministrtive expenses include deprecition of 16 (16) of which 0 (1)pertins to mchinery nd equipment, 1 (0) to uildings nd 15 (15) toother intngile ssets.
Fees to the auditors 2011 2010
Pricewterhouseoopers– audit fees 17 17– audit-relted fees 1 1– x dvisory services 0 0Total 18 18
See ote 28 for the Group for description of the different ctegories offees to the uditors.
s in previous yers. onsequently there re differences etween theolvo Group nd the Prent ompny in the ccounting for dened-enetpension plns s well s in vlution of pln ssets invested in the olvoPension Foundtion.
he difference etween deprecition ccording to pln nd tx depre-cition is reported s ccumulted dditionl deprecition, which is includedin untxed reserves. n the consolidted lnce sheet split is mdeetween deferred tx liility nd equity.
eporting of Group contriutions is in ccordnce with the lterntiverule in F 2. Group contriutions re reported mong ncome frominvestments in Group compnies.
PersonnelWges, slries nd other remunertions mounted to 231 (211), socilcosts to 68 (61) nd pension costs to 69 (81). f the pension costs, 7 (6)pertined to bord memers nd Presidents. he Prent ompny hsoutstnding pension oligtions of 0 (–) to these individuls.
Prt of socil costs relte to pensions. n previous yers, ab olvo hsreclssied such portion of socil costs to pension costs. n the 2011annul eport, this prt hs not een reclssied to pension costs s ndption to prxis. Pension costs for 2010 hs een djusted downwrdswith 23.
he numer of employees t yer-end ws 181 (198). nformtion onthe verge numer of employees, wges, slries nd other remuner-tions including incentive progrm s well s bord memers nd seniorexecutives y gender is shown in note 27 to the consolidted nncilsttements.
aUG PPS
1note
a-GUP aSaS2note
aSa XPSS
3note
Faa Fa 2011
130
S Faa SaS

7/29/2019 MBA VTU Project on VOLVO Group in India
http://slidepdf.com/reader/full/mba-vtu-project-on-volvo-group-in-india 135/166
f the income reported, 2,719 (8,145) pertin to dividends from Groupcompnies. f the dividends, 2,500 (1,801) pertin to dividend from olvoonstruction quipment , 156 (–) from olvo st asi td. nd 63 (–)
from olvo orge aS. he shres in olvo tli Spa were written down y60. iquidtion of olvo automotive Holding b hs resulted in net lossof 2.
Group ontriutions, trnsfer price djustments nd roylties totl net of 6 ,086 (5,126)
a dividend of 4 (2) reveived from icher otors td. is included in ncomefrom other investments.
ther nncil income nd expenses include gurntee commissions fromsusidiries, cost for credit fcilities, costs for credit rting nd costs ofhving olvo shres registered.
nterest income nd similr credits mounting to 0 (0) included interest inthe mount of 0 (0) from susidiries, nd interest expenses nd similrchrges totlling 1,677 (893) included interest of 1,672 (888) to susidi-ries.
alloction to dditionl deprecition hs een mde during the yer with0 (0).
ncome from ssocited compnies tht re reported in the Groupccounts in ccordnce with the equity method mounted to 106 (neg94). ividend of 24 (14) ws received from ommerci l ehicles td.he prticiptions in blue hip Jet Hb nd blue hip Jet Hb hve
effected the income with 5 (8) nd 101 (neg 116) respecti vely.
ther operting income nd expenses include expenses of 101 (–) dueto dmges from settlement of legl process. Further restructuringcosts of 42 (–) nd prot-shring pyments to employees of 3 (1) reincluded.
H PaG a XPSS F H SS
H Faa a XPSS
S a XPSS
aaS
F SS GUPPaS
F SS aSSa PaS
4 7
9
8
10
5
6
note
note
note
note
note
note
note
1

7/29/2019 MBA VTU Project on VOLVO Group in India
http://slidepdf.com/reader/full/mba-vtu-project-on-volvo-group-in-india 136/166
2011 2010
urrent txes – (176)eferred txes (597) (1,055)Total income taxes (597) (1,231)
urrent txes relte to prior periods.eferred txes relte to estimted tx on the chnge in tx-loss crry-
forwrds nd temporry differences. eferred tx ssets re reported tothe extent tht it is prole tht the mount cn e utilized ginst futuretxle income.
eferred txes relted to chnge in tx-loss crryforwrds mount ton expense of 602 (1,063) nd to chnges in other temporry differencesto 5 (8).
he tle elow shows the principl resons for the difference etweenthe corporte income tx of 26.3% nd the tx for the period.
2011 2010
ncome efore txes 6,078 11,559ncome tx ccording to pplicle tx rte (1,598) (3,040)pitl gins/losses 0 0on-txle dividends 723 2,146on-txle revlutions of shreholdings (16) (8)ther non-deductile expenses (6) (156)ther non-txle income 300 3adjustment of current txes for prior periods – (176)Income taxes for the period (597) (1,231)
Specication of deferred tax assets 2011 2010
x-loss crryforwrds 2,885 3,487lution llownce for doutful receivles 1 1Provision for post-employment enets 163 169ther deductile temporry differences 11 –Deferred tax assets 3,060 3,657
Acquisition cost lue in lnce sheet 2010 nvestments Sles/scrpping lue in lnce sheet 2011
ights 52 – – 52ther intngile ssets 138 – – 138Total intangible assets 190 – – 190
buildings 6 21 – 27
nd nd lnd improvements 3 11 – 14chinery nd equipment 46 1 0 47onstruction in progress – 32 – 32Total tangible assets 55 65 0 120
Accumulated depreciation lue in lncesheet 20101 eprecition2 Sles/scrpping
lue in lncesheet 2011
et crrying vlue inlnce sheet 20113
ights 52 – – 52 0ther intngile ssets 35 15 – 50 88Total intangible assets 87 15 – 102 88
buildings 2 1 – 3 24nd nd lnd improvements 0 0 – 0 14chinery nd equipment 37 0 0 37 10
onstruction in progress – – – – 32Total tangible assets 39 1 0 40 80
1 ncluding ccumulted write-downs.2 ncluding write-downs.3 acquisition vlue, less ccumulted deprecition, mortiztion nd write-downs.
pitl expenditures in intngile nd tngile ssets mounted to – (22)nd 65 (1) respectively. pitl expenditures pproved ut not yet imple-mented t yer-end 2011 mounted to 1 (0).
aXS
11note
aGb a aGb aSSS
12note
Faa Fa 2011
132
S Faa SaS

7/29/2019 MBA VTU Project on VOLVO Group in India
http://slidepdf.com/reader/full/mba-vtu-project-on-volvo-group-in-india 137/166
Holdings of shres nd prticiptions re specied in ab olvo’s holding of shres. hnges in holdings of shres nd pr ticiptions re shown elow.
Group compnies on-Group compnies
2011 2010 2011 2010
blnce sheet, ecemer 31, previous yer 59,429 57,062 2,498 2,363acquisitions/ew issue of shres 94 – 508 87ivestments (3) (3,493) – 0Shreholder contriutions – 5,879 – –Write-downs/prticiptions in prtnerships (60) (19) 106 (124)evlution of shres in listed compnies – – (159) 172Balance sheet, December 31 59,460 59,429 2,953 2,498
Shares and participations in Group companiesuring 2011 ab olvo cquired totl shres in FS tvi Sa to vlueof 9. Shres were lso cquired in olvo stvgnr ab, olvo bussr ab
nd ab olvo Pent y totl 85 from olvo tli Spa. ab olvo conse-quently hs got 100% hold in these compnies.Write-down ws mde t yer-end of the holding of shres in olvo
tli Spa with 60.olvo automotive Holding b with the ook vlue of 3 hs een liquidted.uring 2010 ab olvo trnsferred the compny´s holding of preference
shres in U rucks orportion, with the ook vlue of 3,493, s shre-holders’ contriution to olvo Group Jpn orportion. Shreholders’contriution ws lso mde to Kommersiell Fordon urop ab with1,801.
Shares and participations in non-Group companiesuring 2011 ab olvo quired 49% of the hold in Pa Systems ab fromolvo echnology rnsfer ab y 367. a cpitl contriution of 137 (76)
ws given to blue hip Jet Hb. he ook vlue of the prticiptions inthe prtnerships blue hip Jet Hb nd blue hip Jet Hb incresedduring the yer y net of 106 (neg 113).
he revlution of ab olvo’s ownership in the listed compny eutzaG hs decresed the vlue y 159, recognized in other comprehensiveincome (previous yer increse y 172).
ther shres nd prticiptions include the direct nd indirect holdingsof olvo icher ommercil ehicles td. () for totl mount of1,848. n the consolidted ccounts of the olvo group, is reporteds joint venture nd consolidted ccording to the proportionte method.he indirect ownership is n effect of the cquisition of 8.1% of icherotors td., which is the other venturer of . hese shres re notseprtely vlued s they form prt of the indirect ownership in .
2011 2010
accounts receivle 46 3Prepid expenses nd ccrued income 268 226ther receivles 187 32Total 501 261
The composition of untaxed reserves lue in lncesheet 2011
lue in lncesheet 2010
accumulted dditionl deprecitionnd 3 3chinery nd equipment 1 1
Total 4 4
he vlution llownce for doutful receivles mounted to 3 (4) t theend of the yer.
SS SHaS a PaPaS
13note
H U abS14note
UaX SS
15note
1

7/29/2019 MBA VTU Project on VOLVO Group in India
http://slidepdf.com/reader/full/mba-vtu-project-on-volvo-group-in-india 138/166
Provisions for pensions nd similr enets correspond to the cturilly
clculted vlue of oligtions not insured with third prties or securedthrough trnsfers of funds to pension foundtions. he mount of pen-sions flling due within one yer is included. ab olvo hs insured thepension oligtions with third prties. f the mount reported, 8 (0) per-tins to contrctul oligtions within the frmework of the P (Pensionegistrtion nstitute) system.
he olvo Pension Foundtion ws formed in 1996. Pln ssets mount-ing to 224 were contriuted to the foundtion t its formtion, correspondingto the vlue of the pension oligtions t tht time. Since its formtion, netcontriutions of 25 hve een mde to the foundtion.
ab olvo’s pension costs mounted to 69 (81).n previous yers, prt of socil costs hs een reclssied to pension
costs. n the 2011 annul eport, this prt hs not een reclssied to pen-sion costs s n dption to prxis. Pension costs for 2010 hs eendjusted downwrds with 23.
he ccumulted enet oligtion of ll ab olvo’s pension oligtionst yer-end 2011 mounted to 646, which hs een secured in prt throughprovisions in the lnce sheet nd through trnsfer of funds to pensionfoundtions. et sset vlue in the Pension Foundtion, mrked to mrket,ccrued to ab olvo ws 9 lower thn the corresponding pension olig-tions. a provision ws recorded to cover this decit.
ther provisions include provisions for restructuring mesures of 42 (–).
f the contingent liilities mounting to 270,346 (250,606), 270,336(250,597) pertined to Group compnies.
Gurntees for vrious credit progrms re included in mounts cor-responding to the credit limits. hese gurntees mount to 261,576(243,089), of which gurntees on ehlf of Group compnies totlled261,576 (243,089).
at the end of ech yer, the utilized portion mounted to 125,123
(108,562), including 125,113 (108,476) pertining to Group compnies.
2011 2010
Wges, slries nd withholding txes 70 94ther liilities 19 2accrued expenses nd prepid income 146 173Total 235 269
o collterl is provided for current liilities.
Other adjustments of operating income 2011 2010
evlution of shreholdings (46) 116Group contriutions nd trnsfer pricedjustments, current yer (7,110) (6,673)Settlements of previous yer’s Group contri-utions nd trnsfer price djustments 6,673 (14,016)ther 79 30
Total (404) (20,543)Further informtion is provided in otes 5, 6 nd 7.
Shares and participations in non-Groupcompanies, net 2011 2010
nvestments (508) (78)isposls – 15Net investments in shares andparticipations in non-Group companies (508) (63)
nvestments nd sles of shres in non-Group compnies re presented
in ote 13.
ncrease in loans
ncrese in lons is relted to the compny’s liility in the group ccountt olvo resury ab. he liility hs incresed y 281 (11,457).
Shares and participations in Groupcompanies, net 2011 2010
nvestments (94) (2,386)isposls 1 –Net investments in shares andparticipations in Group companies (93) (2,386)
nvestments nd sles of shres in Group compnies re shown inote 13.
PSS F PSS
16note
H PSS
17note
H U abS
19note
G abS
20note
aSH-FW
21note
-U abS
18note
on-current det mtures s follows:
2013 112016 or lter 7Total 18
Faa Fa 2011
134
S Faa SaS

7/29/2019 MBA VTU Project on VOLVO Group in India
http://slidepdf.com/reader/full/mba-vtu-project-on-volvo-group-in-india 139/166
ab ’S HG F SHaS
AB Volvo’s holding of shares
and participations in non-Group companies1
ec 31, 2011 ec 31, 2010
egistrtionnumer
Percentgeholding2
rrying vlue,SK
rrying vlue,SK
eutz aG, Germny – 7 299 458blue hip Jet Hb, Sweden 969717-2105 50 413 170ther investments 25 22Total carrying value, non-Group companies 737 650
1 ab olvo’s holdings of shres nd prticiptions include the direct nd indirect holdings of ommercil ehicles (). ab olvo’s direct holdings in mount toSK 1,848 . n the consolidted ccounts of the olvo group, is reported s joint venture, consolidted ccording to the proportionte method, nd ccordinglyincluded in the tle for Group compnies elow.
2 Percentge gures refer to shre cpitl s well s voting rights.
AB Volvo’s holding of shares andparticipations in major Group companies
ec 31, 2011 ec 31, 2010
egistrtion
numer
Percentge
holding
rrying vlue,
SK
rrying vlue,
SK Volvo Lastvagnar AB, Sweden 556013-9700 100 8,711 8,678
olvo ruck enter Sweden ab, Sweden 556072-7777 100 – –olvo Finlnd ab, Finlnd – 100 – –olvo Group belgium , belgium – 100 – –olvo Group UKtd, Gret britin – 100 – –olvo ndi td, ndi – 100 – –
Volvo Holding Sverige AB, Sweden 556539-9853 100 7,634 7,634bS td, Gret britin – 100 – –olvo onstruction quipment orth americ, nd – 100 – –olvo Polsk Sp. .., Polnd – 100 – –olvo (Southern afric) Pty td, South afric – 100 – –olvo do brsil eiculos td, brzil – 100 – –bnco olvo (brsil) Sa, brzil – 100 – –
olvo Group nd nc., nd – 100 – –Prévost r nc, nd – 100 – –olvo Group austrli Pty td, austrli – 100 – –olvo Group automotive icret, td, Sirketi, urkey1 – 100 – –
Volvo Holding France SA, France – 100 – –olvo rucks Frnce s..s., Frnce – 100 – –olvo ompct quipment s..s., Frnce – 100 – –olvo urope s..s., Frnce – 100 – –FS Finnce Frnce s..s., Frnce – 100 – –FS oction Frnce s..s., Frnce – 100 – –
1

7/29/2019 MBA VTU Project on VOLVO Group in India
http://slidepdf.com/reader/full/mba-vtu-project-on-volvo-group-in-india 140/166
AB Volvo’s holding of shares andparticipations in major Group companies (cont.)
ec 31, 2011 ec 31, 2010
egistrtionnumer
Percentgeholding
rrying vlue,SK
rrying vlue,SK
Renault Trucks s.a.s., France – 100 – –enult rucks eutschlnd GmH, Germny – 100 – –
enult rucks Polsk SP Z , Polnd – 100 – –enult rucks, spñ, Spin – 100 – –enult rucks tli Sp, tly – 100 – –
Volvo Group Japan Co, Japan – 100 6,379 6,379U rucks orportion, Jpn – 100 – – o., td, Jpn – 100 – –U rucks Jpn o, Jpn – 100 – –U rucks South afric (Pty) td., South afric – 100 – –
Volvo Bussar AB, Sweden 556197-3826 100 1,917 1,882
Volvo Construction Equipment NV, The Netherlands – 100 2,582 2,582olvo onstruction quipment ab, Sweden 556021-9338 100 – –olvo skin aS, orwy – 100 – –olvo onstruction quipment urope GmH, Germny – 100 – –abG algemeinen bumschinen GmH, Germny – 100 – –
AB Volvo Penta, Sweden 556034-1330 100 438 421
Volvo Aero AB, Sweden 556029-0347 100 2,885 2,885olvo aero orge aS, orwy – 100 – –
VNA Holding Inc., USA – 100 2,491 2,491olvo Group orth americ nc., USa – 100 – –arrow ruck Sles, nc., USa – 100 – –ck rucks nc., USa – 100 – –olvo onstruction quipment orth americ nc., USa – 100 – –olvo Pent of he americs nc., USa – 100 – –olvo ommercil Finnce he americs, USa – 100 – –FS US , USa – 100 – –
Faa Fa 2011
136
S Faa SaS

7/29/2019 MBA VTU Project on VOLVO Group in India
http://slidepdf.com/reader/full/mba-vtu-project-on-volvo-group-in-india 141/166
AB Volvo’s holding of shares andparticipations in major Group companies (cont.)
ec 31, 2011 ec 31, 2010
egistrtionnumer
Percentgeholding
rrying vlue,SK
rrying vlue,SK
Volvo Financial Services AB, Sweden 556000-5406 100 1,945 1,945FS nterntionl ab, Sweden 556316-6064 100 – –
FS ordic ab, Sweden 556579-1778 100 – –FS Finncil Services b, he etherlnds – 100 – –FS Finncil Services belgium , belgium – 100 – –FS Finncil Services (UK) td, Gret britin – 100 – –FS eutschlnd GmH, Germny – 100 – –FS Finncil Services Spin F, Sa, Spin – 100 – –olvo Finnce (Suisse) Sa, Switzerlnd – 100 – –FS ostok, ussi – 100 – –FS omni, omni – 100 – –FS nd nc, nd – 100 – –
ommercil ehicles, td, ndi2, 7 – 50 – –olvo resury ab, Sweden 556135-4449 100 13,044 13,044Sotrof ab, Sweden 556519-4494 100 1,388 1,388
olvo Group el stte ab, Sweden 556006-8313 100 – –
olvo Kore Holding ab, Sweden 556531-8572 100 2,655 2,655olvo Group Kore o td, South Kore – 100 – –
olvo hin nvestment o td, hin – 100 1,096 1,096Shnghi Sunwin bus o, hin 2 – 50 – –Shndong ingong onstruction chinery, hin – 70 – –
olvo automotive Finnce (hin) td, hin – 100 491 491olvo Group UK td, Gret britin3 – 100 413 413olvo Holding exico, exico – 100 531 531olvo echnology rnsfer ab, Sweden 556542-4370 100 361 361olvo Powertrin ab, Sweden 556000-0753 100 498 498olvo nformtion echnology ab, Sweden 556103-2698 100 663 663olvo Prts ab, Sweden 556365-9746 100 200 200olvo Group nsurnce Försäkrings ab, Sweden 516401-8037 100 182 182olvo business Services ab, Sweden 556029-5197 100 107 107
olvo nmrk Holding aS, enmrk – 100 104 104FS Servizi Finnciri Sp, tly4 – 100 79 79Kommersiell Fordon urop ab, Sweden 556049-3388 100 1,890 1,890olvo orge aS, orwy – 100 56 56olvo lysi Sdn, lysi – 100 48 48Za olvo ostok, ussi5 – 100 34 34olvo tli Sp, tly – 100 496 556olvo ogistics ab, Sweden 556197-9732 100 85 85ossreds Fstighets ab, Sweden 556009-1190 100 26 26alviv ab, Sweden 556622-8820 100 5 5olvo st asi (Pte) td, Singpore – 100 9 9olvo automotive Holding b, he etherlnds – 100 – 3olvo nformtion echnology Gb td, Gret britin – 100 3 3FS tvi Sa, tvi – 100 9 –
ther holdings 5 5Total carrying value Group companies6 59,460 59,429
1 otl holding y olvo Holding Sverige nd olvo stvgnr is 100%.2 Joint venture, reported in ccordnce with the proportionte consolidtion method in olvo’s consolidted ccounts.3 otl holding y olvo stvgnr ab nd ab olvo is 100%.4 otl holding y olvo tli nd ab olvo is 100%.5 otl holding y ab olvo nd olvo rucks egion entrl urope is 100%.6 ab olvo’s shre of shreholders’ equity in susidiries (including equity in untxed reserves) ws 99,139 (90,261).7 ab olvo’s holdings of shres nd pr ticiptions include the direct nd indirect holdings of ommercil ehicles (). ab olvo’s direct holdings
in mount to 1,848. n the consolidted ccounts of the olvo Group, is reported s joint venture, consolidted ccording to the proportion-te method, nd ccordingly included in the tle for group compnies ove.
1
7/29/2019 MBA VTU Project on VOLVO Group in India
http://slidepdf.com/reader/full/mba-vtu-project-on-volvo-group-in-india 142/166
he proposal by the Board o Directors o AB Volvo to beadopted by the Annual General eeting April 4, 2012.his Policy concerns the remunertion nd other terms of employment forthe olvo Group xecutive em. he memers of the olvo Group xecutiveem, including the President nd ny possile eputy President, re in
the following referred to s the “xecutives”.his Policy will e vlid for employment greements entered into fter
the pprovl of the Policy y the annul Generl eeting nd for chngesmde to existing employment greements therefter.
1. Guiding principles or remuneration and other terms o employment he guiding principle is tht the remunertion nd the other terms ofemployment for the xecutives shll e competitive in order to ensure thtthe olvo Group cn ttrct nd retin competent xecutives.
he nnul report 2011 sets out detils on the totl remunertion ndenets wrded to the xecutives during 2011.
2. The principles or fxed salarieshe xecutive’s xed slry shll e competitive nd sed on the indi-vidul xecutive’s responsiilities nd performnce.
3. The principal terms o variable salary and incentive schemes, including the relation between fxed and variable components o the remunerationand the linkage between perormance and remuneration
he xecutives my receive vrile slries in ddition to xed slries.he vrile slry my, s regrds the President, mount to mximumof 75% of the xed nnul slry nd, s regrds the other xecutives, mximum of 60% of the xed nnul slry.
he vrile slry my e sed on inter li the performnce of theentire olvo Group or the performnce of certin prt of the Groupwhere the xecutive is employed. he performnce will e relted to thefullment of vrious improvement trgets or the ttinment of certinnncil ojectives. Such trgets will e set y the bord nd my relteto inter li operting income, operting mrgin or csh ow. he bordmy under certin conditions decide to reclim vrile slry lredy
pid or to cncel or limit vrile slr y to e pid to the xecutives.he annul Generl eeting 2011 decided to dopt shre-sedincentive progrm for senior executives in the olvo Group relting to thenncil yers 2011, 2012 nd 2013. herefore, the bord hs decidednot to propose ny shre-sed incentive progrm to the annul Generleeting to e held in april 2012.
4. The principal terms o non-monetary benefts, pension, notice o termination and severance pay
4.1 Non-monetary beneftshe xecutives will e entitled to customry non-monetry enets suchs compny crs nd compny helth cre. n ddition thereto in individulcses compny housing nd other enets my lso e offered.
4.2 Pension
n ddition to pension enets which the xecutives re entitled to ccordingto lw nd collective rgining greements, xecutives resident in Swedenmy e offered two different dened-contriution plns with nnul premiums.For the rst pln the nnul premiums mount to SK 30,000 plus 20% ofthe pensionle slry over 30 income se mounts nd for the second plnthe nnul premiums mount to 10% of pensionle slry. n the twodened-contriution plns, the pension erned will correspond to the sum ofpid-in premiums nd possile return without ny gurnteed level of pensionreceived y the employee. Further no denite retirement dte is set in the twoplns ut premiums will e pid for the employee until his or her 65th irthdy.
xecutives resident outside Sweden or resident in Sweden ut hving mteril connection to or hving een resident in country other thn Swedenmy e offered pension enets tht re competitive in the country where the
xecutives re or hve een resident or to which the xecutives hve mterilconnection, preferly dened-contriution plns.
4.3 Notice o termination and severance payFor xecutives resident in Sweden, the termintion period from the ompny
will e 12 months nd 6 months from the xecutive. n ddition thereto,the xecutive, provided tht termintion hs een mde y the ompny,will e entitled to 12 months’ severnce py.
xecutives resident outside Sweden or resident in Sweden ut hving mteril connection to or hving een resident in country other thn Swedenmy e offered notice periods for termintion nd severnce pyment tht recompetitive in the country where the xecutives re or hve een resident orto which the xecutives hve mteril connection, preferly solutions com-prle to the solutions pplied to xecutives resident in Sweden.
5. The Board’s preparation and decision-making on issues concerning remuneration and other terms o employment or the Volvo Group Executive Team
he emunertion ommittee is responsile for (i) prepring the bord’sdecisions on issues concerning principles for remunertion, remunertions
nd other terms of employment for xecutives, (ii) monitoring nd evlutingprogrms for vrile remunertion, oth ongoing nd those tht hveended during the yer, for xecutives, (iii) monitoring nd evluting theppliction of this Policy, nd (iv) monitoring nd evluting currentremunertion structures nd levels in the ompny.
he emunertion ommittee prepres nd the bord decides on (i) termsof employment nd remunertion of the President nd the eputy President,if ny, nd (ii) principles for remunertion (incl. pension nd severnce py) forthe Group xecutive em. he emunertion ommittee shll pprove pro-posls on remunertion of the memers of the olvo Group xecutive em.
he emunertion ommittee is further responsile for the review ndrecommendtion to the bord of shre nd shre-price relted incentiveprogrms to e decided upon y the annul Generl eeting.
6. Authority to decide on deviations rom this Policy
he bord of irectors my devite from this Policy if there re specicresons to do so in n individul cse.
7. Inormation on earli er decisions on remuneration that has not becomedue or payment at the time o the Annual General Meeting’s consider-ation o this Policy
he decisions lredy tken on remunertion to the xecutives tht hs notecome due for pyment t the time of the annul Generl eeting 2012fll within the frmes of this policy, except tht some of the xecutives hve right to receive 24 months’ severnce py provided they re ove 50 yers of ge nd tht some of the xecutives re entitled to dened-enetpension plns stipulting pension pyments strt ing from the ge of 65 withthe possiility to receive prt of the pension pyment from the ge of 60.
8. Deviations rom current Policyhe bord of irectors ws uthorized to devite from the Policy ofemunertion to Senior xecutives dopted y the annul Generl eetingof ab olvo held in 2011 ccording to section 6 of sid Policy. he bordhs resolved on one such devition, y pproving tht the vrile slryfor the President of olvo aero my exceed 60% of the xed nnu l slryif certin prmeters in reltion to the potentil divestment of olvo aerore fullled. he reson for the devition is tht there is strong interestin securing the continued efforts of the President of olvo aero in thepossile divestment thereof, for the purpose of concluding trnsction onthe est possile terms for ab olvo nd its shreholders.
he policy concerning remunertion nd other terms of employment forthe Group xecutive em decided t the annul Generl eeting 2011is provided in ote 27 Personnel.
PPS Ua P
Faa Fa 2011
138

7/29/2019 MBA VTU Project on VOLVO Group in India
http://slidepdf.com/reader/full/mba-vtu-project-on-volvo-group-in-india 143/166
AB Volvo SK
etined ernings 26,787,875,659.22ncome for the period 2010 5,480,540,903.23Total retained earnings 32,268,416,562.45
he bord of irectors nd the President propose tht the ove sume disposed of s follows:
SK
o the shreholders, dividend of SK 3.00per shre 6,082,283,862.001
o e crried forwrd 26,186,132,700.45Total 32,268,416,562.45
PPS SPS F UaPPPa aGS
Group hve cpcity to ssume future usiness risks s well s to ercontingent losses. he proposed dividend is not expected to dverselyffect the ompny’s nd the Group’s ility to mke further commercilly justied investments in ccordnce with the bord of irectors’ plns .
n ddition to wht hs een stted ove, the bord of irectors hs
considered other known circumstnces which my e of importnce forthe ompny’s nd the Group’s nncil position. n doing so, no circum-stnce hs ppered tht does not justify the proposed dividend.
f the annul Generl eeting resolves in ccordnce with the bordof irectors’ proposl, SK 26,186,132,700.45 will remin of the omp-ny’s non-restricted equity, clculted s per yer end 2011.
he bord of irectors hs the view tht the ompny’s nd theGroup’s shreholders’ equity will, fter the proposed dividend, e sufcientin reltion to the nture, scope nd risks of the usiness.
Hd the ssets nd liilities not een estimted t their mrket vluepursunt to hpter 4, Section 14 of the Swedish annul accounts act,the compny’s shreholders’ equity would hve een SK 34,680,896.00 less.
1 he totl dividend mount is sed on the numer of outstnding shres s ofFerury 23, 2012, i.e. 2,027,427,954 shres. he totl dividend mount mychnge efore the record dte for determining who is entitled to receive dividends
due to trnsfer of tresury shres to prticipnts in the compny’s long-term,shre-sed incentive progrm.
he bord of irectors nd the President certify tht the nnul nncilreport hs een prepred in ccordnce with generlly ccepted ccount-ing principles nd tht the consolidted ccounts hve een prepred inccordnce with the interntionl set of ccounting stndrds referred toin egultion () o 1606/2002 of the uropen Prliment nd of theouncil of July 19, 2002 on the ppliction of interntionl ccountingstndrds, nd give true nd fir view of the position nd prot or loss ofthe ompny nd the Group, nd tht the mngement report for theompny nd for the Group gives fir review of the development ndperformnce of the usiness, position nd prot or loss of the ompnynd the Group, nd descries the principl risks nd uncertinties tht theompny nd the compnies in the Group fce.
Göteorg, Ferury 23, 2012
ouis Schweitzerbord hirmn
Peter bijurbord memer
Jen-bptiste uznbord memer
Hnne de orbord memer
anders yrénbord memer
lof PerssonPresident, nd
bord memer
vi enktesnbord memer
rs Westerergbord memer
ing ehbord memer
Peteris uertsbord memer
ikel Sällströmbord memer
berth hulinbord memer
ur udit report ws issued on Ferury 23, 2012
Pricewterhouseoopers ab
Görn idströmauthorized Pulic accountnt
ed auditor
John ippeauthorized Pulic accountnt
he record dte for determining who is entitled to receive dividends isproposed to e Wednesdy april 11, 2012.
n view of the bord of irectors’ proposl to the annul Generl eetingto e held april 4, 2012 to decide on the distriution of dividend of SK 3.00 per shre, the bord herey mkes the following sttement inccordnce with hpter 18, Section 4 of the Swedish ompnies act.
he bord of irectors concludes tht the ompny’s restricted equityis fully covered fter the proposed dividend. he bord further concludestht the proposed dividend is justile in view of the prmeters set outin hpter 17, Section 3, second nd third prgrphs of the Swedishompnies act. n connection herewith, the bord wishes to point out thefollowing.
he proposed dividend reduces the ompny’s solvency from 54.7 percent to 50.9 per cent nd the Group’s solvency from 24.3 per cent to 22.9per cent, clculted s per yer end 2011. he bord of irectors considersthis solvency to e stisfctory with regrd to the usiness in which theGroup is ctive.
according to the bord of irectors’ opinion, the proposed dividend willnot ffect the ompny’s or the Group’s ility to full their pyment oli-gtions nd the ompny nd the Group re well prepred to hndle othchnges in the liquidity nd unexpected events.
he bord of irectors is of the opinion tht the ompny nd the
1
7/29/2019 MBA VTU Project on VOLVO Group in India
http://slidepdf.com/reader/full/mba-vtu-project-on-volvo-group-in-india 144/166
aU P F ab
o the nnul meeting of the shreholders of ab olvo, corporte identity
numer 556012-5790
eport on the annual accounts and consolidated accountsWe hve udited the nnul ccounts nd consolidted ccounts of abolvo for the yer 2011. he nnul ccounts nd consolidted ccountsof the compny re included in the printed version of this document onpges 46–139.
Responsibil ities o the Board o Directors and the President or the annual accounts and consolidated accountshe bord of irectors nd the President re responsile for the preprtionnd fir presenttion of these nnul ccounts nd consolidted ccountsin ccordnce with nterntionl Finncil eporting Stndrds, sdopted y the U, nd the annul accounts act, nd for such internlcontrol s the bord of irectors nd the President determine is necessry
to enle the preprtion of nnul ccounts nd consolidted ccountstht re free from mteril missttement, whether due to frud or error.
Auditor’s responsibili tyur responsiility is to express n opinion on these nnul ccounts ndconsolidted ccounts sed on our udit. We conducted our udit inccordnce with nterntionl Stndrds on auditing nd generlly ccepteduditing stndrds in Sweden. hose stndrds require tht we complywith ethicl requirements nd pln nd perform the udit to otin reso-nle ssurnce out whether the nnul ccounts nd consolidtedccounts re free from mteril missttement.
an udit involves performing procedures to otin udit evidence outthe mounts nd disclosures in the nnul ccounts nd consolidtedccounts. he procedures selected depend on the uditor’s judgement,including the ssessment of the risks of mteril missttement of the
nnul ccounts nd consolidted ccounts, whether due to frud orerror. n mking those risk ssessments, the uditor considers internlcontrol relevnt to the compny’s preprtion nd fir presenttion of thennul ccounts nd consolidted ccounts in order to design udit pro-cedures tht re pproprite in the circumstnces, ut not for the purposeof expressing n opinion on the effectiveness of the compny’s internlcontrol. an udit lso includes evluting the ppropriteness of ccountingpolicies used nd the resonleness of ccounting estimtes mde ythe bord of irectors nd the President, s well s evluting the overllpresenttion of the nnul ccounts nd consolidted ccounts.
We elieve tht the udit evidence we hve otined is sufcient ndpproprite to provide sis for our udit opinion.
Opinionsn our opinion, the nnul ccounts hve een prepred in ccordncewith the annul accounts act nd present firly, in ll mteril respects,the nncil position of the prent compny s of 31 ecemer 2011 ndof its nncil performnce nd its csh ows for the yer then ended inccordnce with the annul accounts act, nd the consolidted ccounts
hve een prepred in ccordnce with the annul accounts act nd
present firly, in ll mteril respects, the nncil position of the Groups of 31 ecemer 2011 nd of their nncil performnce nd cshows in ccordnce with nterntionl Finncil eporting Stndrds, sdopted y the U, nd the annul accounts act. he sttutory dminis-trtion report is consistent with the other prts of the nnul ccountsnd consolidted ccounts.
We therefore recommend tht the nnul meeting of shreholdersdopt the income sttement nd lnce sheet for the Prent ompnynd the Group.
eport on other legal and regulatory requirementsn ddition to our udit of the nnul ccounts nd consolidted ccounts,we hve exmined the proposed ppropritions of the compny’s prot orloss nd the dministrtion of the bord of irectors nd the President ofab olvo for the yer 2011.
Responsibil ities o the Board o Directors and the President he bord of irectors is responsile for the proposl for ppropritionsof the compny’s prot or loss, nd the bord of irectors nd the Presidentre responsile for dministrtion under the ompnies act.
Auditor’s responsibili tyur responsiility is to express n opinion with resonle ssurnce onthe proposed ppropritions of the compny’s prot or loss nd on thedministrtion sed on our udit. We conducted the udit in ccordncewith generlly ccepted uditing stndrds in Sweden.
as sis for our opinion on the bord of irectors’ proposed ppro-pritions of the compny’s prot or loss, we exmined the bord of irec-tors’ resoned sttement nd selection of supporting evidence in orderto e le to ssess whether the proposl is in ccordnce with the om-
pnies act.as sis for our opinion concerning dischrge from liility, in dditionto our udit of the nnul ccounts nd consolidted ccounts, we exminedsignicnt decisions, ctions tken nd circumstnces of the compny inorder to determine whether ny memer of the bord of irectors or thePresident re lile to the compny. We lso exmined whether ny memerof the bord of irectors or the President hve, in ny other wy, cted incontrvention of the ompnies act, the annul accounts act or thearticles of assocition.
We elieve tht the udit evidence we hve otined is sufcient ndpproprite to provide sis for our opinion.
OpinionsWe recommend to the nnul meeting of shreholders tht the prot epproprited in ccordnce with the proposl in the sttutory dministrtion
report nd tht the memers of the bord of irectors nd the Presidente dischrged from liility for the nncil yer.
Göteorg Ferury 23, 2012
Pricewterhouseoopers ab
Görn idströmauthorized Pulic accountnt
ed auditor
John ippeauthorized Pulic accountnt
Faa Fa 2011
140

7/29/2019 MBA VTU Project on VOLVO Group in India
http://slidepdf.com/reader/full/mba-vtu-project-on-volvo-group-in-india 145/166
-a SUa
he eleven-yer summry presents ech yer in ccordnce with the
Generlly accepted accounting Prctice (GaaP) for tht yer. rlier yers re not res tted when new ccounting stndrds re pplied. he yers 2001–2003 re ccounted for in ccordnce with Swedish GaaPfor the respective yer. as from 2004 the reporting is sed on FS. hetrnsition to FS is descried in ote 3 in the 2005 nd 2006 annul
eports. as from Jnury 1, 2007, the enets from the synergies creted
in the usiness units re trnsferred ck to the product res. also, sfrom Jnury 1, 2007, the responsiilit y for the Group’s tresury opert ionsnd rel estte hs een trnsferred from olvo Finncil Services, which,s from Jnury 1, 2007, only re consolidted in ccordnce with thepurchse method. omprison gures for 2006 hve een reclculted.
Consolidated income statements
SK 2011 2010 2009 2008 2007 2006 2005 2004 2003 2002 2001
Net sales 310,367 264,749 218,361 303,667 285,405 258,835 240,559 211,076 183,291 186,198 189,280
ost of sles (235,104) (201,797) (186,167) (237,578) (219,600) (199,054) (186,662) (164,170) (146,879) (151,569) (155,592)
Gross income 75,263 62,952 32,194 66,089 65,805 59,781 53,897 46,906 36,412 34,629 33,688
eserch nd developmentexpenses (13,276) (12,970) (13,193) (14,348) (11,059) (8,354) (7,557) (7,614) (6,829) (5,869) (5,391)
Selling expenses (26,001) (24,149) (25,334) (27,129) (26,068) (21,213) (20,778) (19,369) (16,866) (16,604) (15,766)
administrtive expenses (7,132) (5,666) (5,863) (6,940) (7,133) (6,551) (6,301) (5,483) (5,467) (5,658) (6,709)
ther operting income ndexpenses (1,649) (2,023) (4,798) (1,915) 163 (3,466) (588) (618) (1,367) (4,152) (4,096)
ncome (loss) from investmentsin ssocited compnies (81) (86) (14) 25 430 61 (557) 27 200 182 50
ncome from other investments (225) (58) (6) 69 93 141 37 830 (3,579) 309 1,410
estructuring costs – – – – – – – – – – (3,862)
Operating income (loss) 26,899 18,000 (17,013) 15,851 22,231 20,399 18,153 14,679 2,504 2,837 (676)
nterest income ndsimilr credits 608 442 390 1,171 952 666 654 821 1,096 1,217 1,275
nterest expensesnd similr chrges (2,875) (3,142) (3,559) (1,935) (1,122) (585) (972) (1,254) (1,888) (1,840) (2,274)
ther nncil incomend expenses 297 213 (392) (1,077) (504) (181) 181 (1,210) (55) (201) (191)
Income (loss) after nancial
items 24,929 15,514 (20,573) 14,010 21,557 20,299 18,016 13,036 1,657 2,013 (1,866)
ncome txes (6,814) (4,302) 5,889 (3,994) (6,529) (3,981) (4,908) (3,129) (1,334) (590) 326
Income (loss) for the period 18,115 11,212 (14,685) 10,016 15,028 16,318 13,108 9,907 323 1,423 (1,540)
attriutle to
quity holders of the Prentompny 17,751 10,866 (14,718) 9,942 14,932 16,268 13,054 9,867 298 1,393 (1,467)
inority interest 364 346 33 74 96 50 54 40 25 30 (73)
18,115 11,212 (14,685) 10,016 15,028 16,318 13,108 9,907 323 1,423 (1,540)
Consolidated income statements ndustrial perations
SK 2011 2010 2009 2008 2007 2006 2005 2004 2003 2002 2001
Net sales 303,589 257,375 208,487 294,932 276,795 249,020 231,191 202,171 174,768 177,080 180,615
ost of sles (231,516) (197,480) (179,578) (232,247) (214,160) (192,400) (180,823) (158,453) (141,256) (145,453) (149,477)Gross income 72,073 59,895 28,909 62,685 62,635 56,620 50,368 43,718 33,512 31,627 31,138
eserch nd developmentexpenses (13,276) (12,970) (13,193) (14,348) (11,059) (8,354) (7,557) (7,614) (6,829) (5,869) (5,391)
Selling expenses (24,383) (22,649) (23,752) (25,597) (24,671) (19,999) (19,616) (18,317) (15,891) (15,393) (14,663)
administrtive expenses (7,105) (5,640) (5,838) (6,921) (7,092) (6,481) (6,147) (5,310) (5,259) (5,464) (6,474)
ther operting income ndexpenses (1,045) (659) (2,432) (1,457) 249 (3,275) (397) 7 (540) (2,989) (3,071)
ncome from olvo FinncilServices – – – – – – 2,033 1,365 926 490 325
ncome (loss) from investmentsin ssocited compnies (82) (86) (15) 23 428 61 (568) 2 166 126 (86)
ncome from other investments (225) (57) (13) 69 93 141 37 828 (3,581) 309 1,408
estructuring costs – – – – – – – – – – (3,862)
perating income (loss) 25,957 17,834 (16,333) 14,454 20,583 18,713 18,153 14,679 2,504 2,837 (676)
1
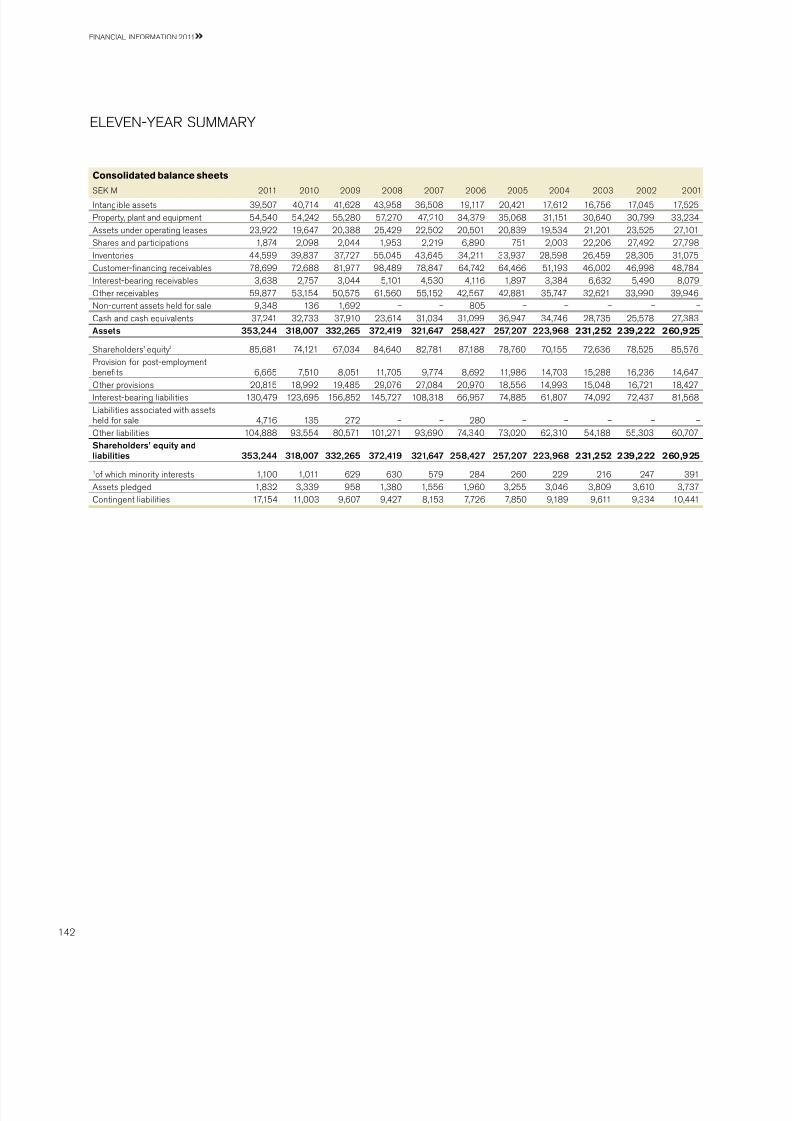
7/29/2019 MBA VTU Project on VOLVO Group in India
http://slidepdf.com/reader/full/mba-vtu-project-on-volvo-group-in-india 146/166
-a SUa
Consolidated balance sheets
SK 2011 2010 2009 2008 2007 2006 2005 2004 2003 2002 2001
ntngile ssets 39,507 40,714 41,628 43,958 36,508 19,117 20,421 17,612 16,756 17,045 17,525Property, plnt nd equipment 54,540 54,242 55,280 57,270 47,210 34,379 35,068 31,151 30,640 30,799 33,234assets under operting leses 23,922 19,647 20,388 25,429 22,502 20,501 20,839 19,534 21,201 23,525 27,101Shres nd prticiptions 1,874 2,098 2,044 1,953 2,219 6,890 751 2,003 22,206 27,492 27,798nventories 44,599 39,837 37,727 55,045 43,645 34,211 33,937 28,598 26,459 28,305 31,075ustomer-nncing receivles 78,699 72,688 81,977 98,489 78,847 64,742 64,466 51,193 46,002 46,998 48,784nterest-ering receivles 3,638 2,757 3,044 5,101 4,530 4,116 1,897 3,384 6,632 5,490 8,079ther receivles 59,877 53,154 50,575 61,560 55,152 42,567 42,881 35,747 32,621 33,990 39,946on-current ssets held for sle 9,348 136 1,692 – – 805 – – – – –sh nd csh equivlents 37,241 32,733 37,910 23,614 31,034 31,099 36,947 34,746 28,735 25,578 27,383Assets 353,244 318,007 332,265 372,419 321,647 258,427 257,207 223,968 231,252 239,222 260,925
Shreholders’ equity1 85,681 74,121 67,034 84,640 82,781 87,188 78,760 70,155 72,636 78,525 85,576Provision for post-employmentenets 6,665 7,510 8,051 11,705 9,774 8,692 11,986 14,703 15,288 16,236 14,647ther provisions 20,815 18,992 19,485 29,076 27,084 20,970 18,556 14,993 15,048 16,721 18,427nterest-ering liilities 130,479 123,695 156,852 145,727 108,318 66,957 74,885 61,807 74,092 72,437 81,568iilities ssocited with ssetsheld for sle 4,716 135 272 – – 280 – – – – –ther liilities 104,888 93,554 80,571 101,271 93,690 74,340 73,020 62,310 54,188 55,303 60,707Shareholders’ equity andliabilities 353,244 318,007 332,265 372,419 321,647 258,427 257,207 223,968 231,252 239,222 260,925
1of which minority interests 1,100 1,011 629 630 579 284 260 229 216 247 391assets pledged 1,832 3,339 958 1,380 1,556 1,960 3,255 3,046 3,809 3,610 3,737ontingent liilities 17,154 11,003 9,607 9,427 8,153 7,726 7,850 9,189 9,611 9,334 10,441
Faa Fa 2011
142

7/29/2019 MBA VTU Project on VOLVO Group in India
http://slidepdf.com/reader/full/mba-vtu-project-on-volvo-group-in-india 147/166
Consolidated balance sheets, ndustrial perations
SK 2011 2010 2009 2008 2007 2006 2005 2004 2003 2002 2001
ntngile ssets 39,385 40,613 41,532 43,909 36,441 19,054 20,348 17,570 16,662 16,919 17,366Property, plnt nd equipment 54,446 54,169 55,208 57,185 47,132 30,493 31,330 27,260 27,248 27,789 30,370assets under operting leses 16,749 13,217 13,539 16,967 13,850 11,822 10,260 8,477 8,976 11,155 15,020Shres nd prticiptions 1,871 2,080 2,025 1,935 2,189 16,565 10,357 10,116 30,022 34,750 35,145nventories 43,828 38,956 35,765 54,084 43,264 33,893 33,583 28,291 25,848 27,564 30,557ustomer-nncing receivles 1,702 1,428 1,367 975 1,233 1,193 1,377 230 118 99 114nterest-ering receivles 6,734 11,153 8,010 6,056 13,701 13,214 7,691 12,127 9,413 8,495 12,426ther receivles 59,062 52,358 49,008 60,586 55,970 43,335 43,992 36,535 33,079 34,256 38,815on-current ssets held for sle 9,348 136 1,692 – – 805 – – – – –sh nd csh equivlents 35,951 31,491 37,404 22,575 30,026 29,907 36,047 34,628 28,102 24,154 24,874Assets 269,076 245,602 245,550 264,272 243,806 200,281 194,985 175,234 179,468 185,181 204,687
Shreholders’ equity 76,682 66,101 58,485 75,046 75,129 87,188 78,760 70,155 72,636 78,525 85,576Provision for post-employmentenets 6,635 7,478 8,021 11,677 9,746 8,661 11,966 14,677 15,264 16,218 14,632ther provisions 19,101 17,240 17,456 27,015 25,372 19,385 17,164 14,115 12,792 13,893 14,085nterest-ering liilities 55,394 59,857 78,890 46,749 38,286 9,779 13,097 13,968 24,677 22,494 29,710iilities ssocited with ssetsheld for sle 4,716 135 272 – – 280 – – – – –ther liilities 106,548 94,791 82,426 103,785 95,273 74,988 73,998 62,319 54,099 54,051 60,684Shareholders’ equity andliabilities 269,076 245,602 245,550 264,272 243,806 200,281 194,985 175,234 179,468 185,181 204,687
1

7/29/2019 MBA VTU Project on VOLVO Group in India
http://slidepdf.com/reader/full/mba-vtu-project-on-volvo-group-in-india 148/166
-a SUa
Consolidated cash-fow statements
SK n 2011 2010 2009 2008 2007 2006 2005 2004 2003 2002 2001
perting income (loss) 26.9 18.0 (17.0) 15.9 22.2 20.4 18.2 14.7 2.5 2.8 (0.7)eprecition nd mortiztion 13.9 13.8 15.2 13.5 12.5 12.4 9.9 10.0 10.2 10.8 10.0ther non-csh items 1.3 1.6 4.4 (0.2) (0.5) 0.7 0.4 (0.1) 4.9 2.0 0.5hnge in working cpitl (15.1) 4.8 16.9 (23.3) (9.9) (7.7) (4.7) (1.4) 0.4 1.0 6.4ustomer nncing receivles, net – – – – – – (7.8) (7.4) (4.3) (5.7) (3.7)Finncil items nd income tx (7.3) (5.5) (4.6) (5.2) (5.9) (4.3) (2.0) (0.5) (0.9) (1.3) (2.1)Cash-ow from operatingactivities 19.7 32.7 14.9 0.7 18.4 21.5 14.0 15.3 12.8 9.6 10.4
nvestments in xed ssets (12.6) (10.4) (10.5) (12.7) (10.1) (10.0) (10.3) (7.4) (6.0) (6.7) (8.1)nvestments in lesing ssets (7.4) (4.8) (4.2) (5.4) (4.8) (4.6) (4.5) (4.4) (5.3) (5.2) (5.8)isposls of xed ssets nd lesing ssets 3.3 3.1 3.8 2.9 2.9 3.2 2.6 2.4 2.9 3.2 2.6Shres nd prticiptions, net (0.1) (0.1) 0.0 0.0 0.4 (5.8) 0.3 15.1 (0.1) (0.1) 3.9acquired nd divested susidiries nd other
usiness units, net (1.6) 0.6 0.2 (1.3) (15.0) 0.5 0.7 (0.1) 0.0 (0.2) 13.0nterest-ering receivles includingmrketle securities 2.6 6.8 (8.9) 10.9 3.6 7.7 (1.3) (6.4) (2.0) (1.5) (3.7)Cash-ow after net investments 3.9 27.9 (4.7) (4.9) (4.6) 12.5 1.5 14.5 2.3 (0.9) 12.3
hnge in lons, net 8.7 (25.7) 12.6 18.2 28.7 (2.6) 3.6 (8.8) 1.9 (0.1) 6.2epurchse of own shres - – 0.0 – – – (1.8) (2.5) – – (8.3)ividend to ab olvo’s shreholders (5.1) 0.0 (4.1) (11.1) (20.3) (6.8) (5.1) (3.4) (3.4) (3.4) (3.4)
sh pyment to minority 0.0 (0.1) – – – – – – – – –ther 0.0 0.0 (0.1) 0.0 0.0 0.0 0.0 0.0 0.1 0.1 0.1Change in cash and cash equivalentsexcluding translation differences 7.5 2.1 3.7 2.2 3.8 3.1 (1.8) (0.2) 0.9 (4.3) 6.9
rnsltion differences on csh nd cshequivlents (0.1) (0.4) (0.2) 1.0 0.0 (0.5) 1.1 (0.2) (0.6) (0.7) 0.6Change in cash and cash
equivalents 7.4 1.7 3.5 3.2 3.8 2.6 (0.7) (0.4) 0.3 (5.0) 7.5
perating cash-fow ndustrial perations
SK n 2011 2010 2009 2008 2007 2006 2005 2004 2003 2002 2001
perting income 26.0 17.8 (16.3) 14.5 20.6 18.7 16.1 13.3 1.6 2.3 (1.0)eprecition nd mortiztion 11.4 11.4 12.4 11.8 10.3 9.8 7.3 7.1 7.2 7.8 7.0ther items not ffecting csh 0.6 0.1 2.3 (0.7) (0.4) 0.2 0.2 (0.6) 4.1 1.0 0.0hnge in working cpitl (4.2) 4.6 4.7 (10.9) (0.1) (3.1) (5.6) (1.4) 0.7 0.4 6.8Finncil items nd income txes (6.9) (5.1) (4.7) (5.0) (6.0) (3.7) (1.9) (0.2) (0.7) (1.1) (2.3)Cash-ow from operating activities 26.9 28.8 (1.6) 9.7 24.4 21.9 16.1 18.2 12.9 10.4 10.5
nvestments in xed ssets (12.6) (10.3) (10.3) (12.6) (10.1) (9.7) (9.9) (7.2) (5.8) (6.3) (7.7)nvestments in lesing ssets (1.4) (0.3) (0.2) (0.4) (0.2) (0.5) (0.3) (0.3) (0.1) (0.1) (0.5)isposls of xed ssets nd lesing ssets 1.2 0.8 0.7 0.6 1.1 0.9 0.9 0.7 0.6 1.1 1.1Operating cash-ow 14.1 19.0 (11.4) (2.7) 15.2 12.6 6.8 11.4 7.6 5.1 3.4
Faa Fa 2011
144
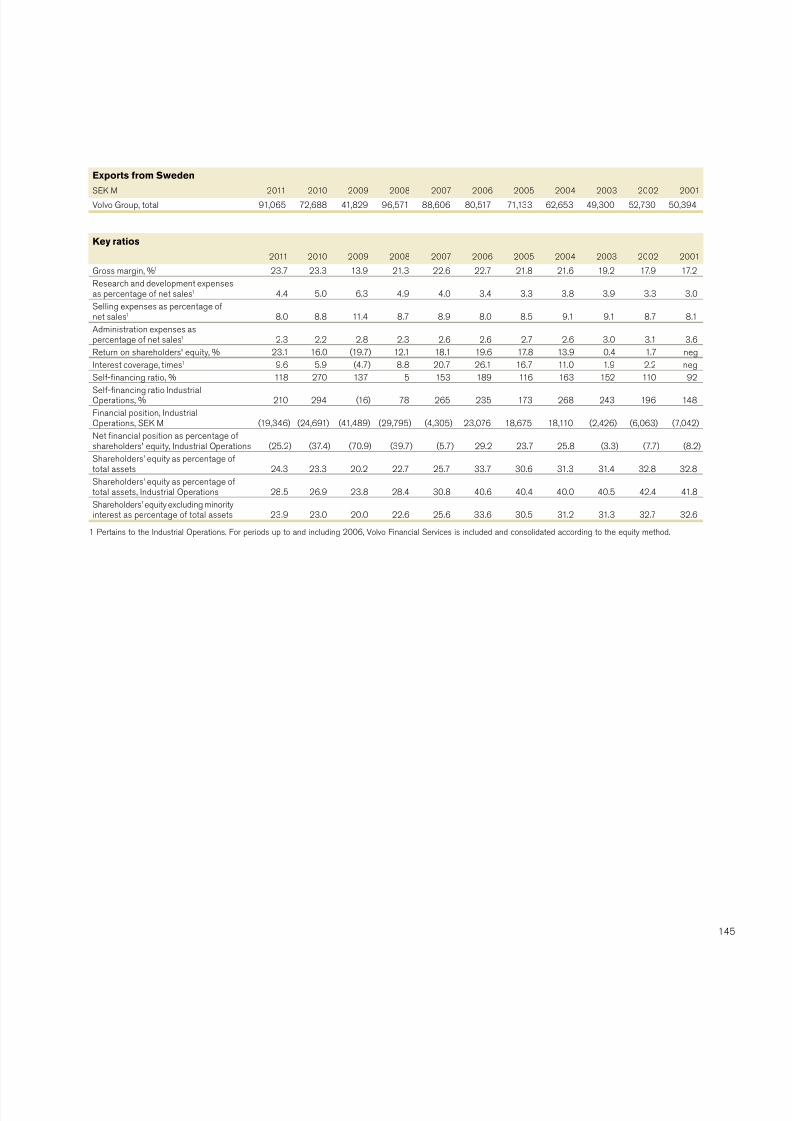
7/29/2019 MBA VTU Project on VOLVO Group in India
http://slidepdf.com/reader/full/mba-vtu-project-on-volvo-group-in-india 149/166
Key ratios
2011 2010 2009 2008 2007 2006 2005 2004 2003 2002 2001
Gross mrgin, %1 23.7 23.3 13.9 21.3 22.6 22.7 21.8 21.6 19.2 17.9 17.2eserch nd development expensess percentge of net sles1 4.4 5.0 6.3 4.9 4.0 3.4 3.3 3.8 3.9 3.3 3.0Selling expenses s percentge ofnet sles1 8.0 8.8 11.4 8.7 8.9 8.0 8.5 9.1 9.1 8.7 8.1administrtion expenses spercentge of net sles1 2.3 2.2 2.8 2.3 2.6 2.6 2.7 2.6 3.0 3.1 3.6eturn on shreholders' equity, % 23.1 16.0 (19.7) 12.1 18.1 19.6 17.8 13.9 0.4 1.7 neg
nterest coverge, times1
9.6 5.9 (4.7) 8.8 20.7 26.1 16.7 11.0 1.9 2.2 negSelf-nncing rtio, % 118 270 137 5 153 189 116 163 152 110 92Self-nncing rtio ndustrilpertions, % 210 294 (16) 78 265 235 173 268 243 196 148Finncil position, ndustrilpertions, SK (19,346) (24,691) (41,489) (29,795) (4,305) 23,076 18,675 18,110 (2,426) (6,063) (7,042)et nncil position s percentge ofshreholders' equity, ndustril pertions (25.2) (37.4) (70.9) (39.7) (5.7) 29.2 23.7 25.8 (3.3) (7.7) (8.2)Shreholders’ equity s percentge oftotl ssets 24.3 23.3 20.2 22.7 25.7 33.7 30.6 31.3 31.4 32.8 32.8Shreholders’ equity s percentge oftotl ssets, ndustril pertions 28.5 26.9 23.8 28.4 30.8 40.6 40.4 40.0 40.5 42.4 41.8Shreholders’ equity excluding minorityinterest s percentge of totl ssets 23.9 23.0 20.0 22.6 25.6 33.6 30.5 31.2 31.3 32.7 32.6
1 Pertins to the ndustril pertions. For periods up to nd including 2006, olvo Finncil Services is included nd consolidted ccording to the equity method.
xports rom Sweden
SK 2011 2010 2009 2008 2007 2006 2005 2004 2003 2002 2001
olvo Group, totl 91,065 72,688 41,829 96,571 88,606 80,517 71,133 62,653 49,300 52,730 50,394
1
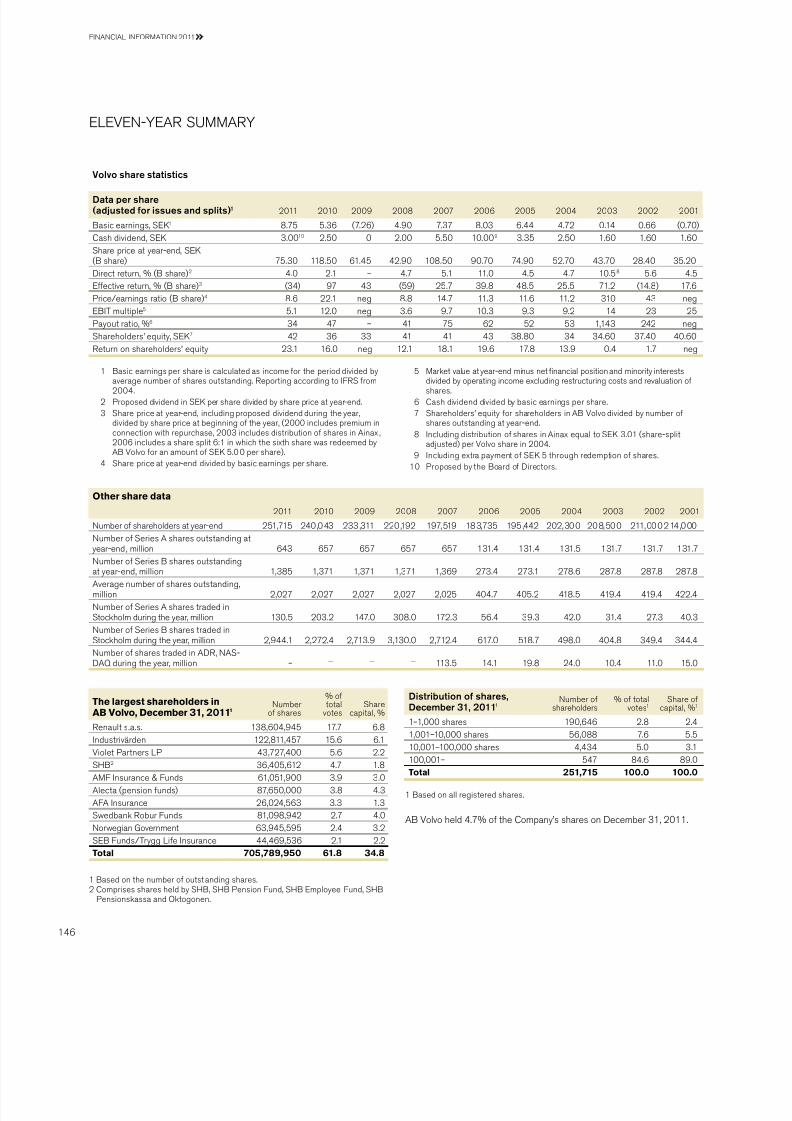
7/29/2019 MBA VTU Project on VOLVO Group in India
http://slidepdf.com/reader/full/mba-vtu-project-on-volvo-group-in-india 150/166
-a SUa
Volvo share statistics
Data per share(adjusted for issues and splits)1 2011 2010 2009 2008 2007 2006 2005 2004 2003 2002 2001
bsic ernings, SK 1 8.75 5.36 (7.26) 4.90 7.37 8.03 6.44 4.72 0.14 0.66 (0.70)sh dividend, SK 3.0010 2.50 0 2.00 5.50 10.009 3.35 2.50 1.60 1.60 1.60Shre price t yer-end, SK (b shre) 75.30 118.50 61.45 42.90 108.50 90.70 74.90 52.70 43.70 28.40 35.20irect return, % (b shre)2 4.0 2.1 – 4.7 5.1 11.0 4.5 4.7 10.58 5.6 4.5ffective return, % (b shre)3 (34) 97 43 (59) 25.7 39.8 48.5 25.5 71.2 (14.8) 17.6Price/ernings rtio (b shre)4 8.6 22.1 neg 8.8 14.7 11.3 11.6 11.2 310 43 negb multiple5 5.1 12.0 neg 3.6 9.7 10.3 9.3 9.2 14 23 25Pyout rtio, %6 34 47 – 41 75 62 52 53 1,143 242 negShreholders’ equity, SK 7 42 36 33 41 41 43 38.80 34 34.60 37.40 40.60eturn on shreholders' equity 23.1 16.0 neg 12.1 18.1 19.6 17.8 13.9 0.4 1.7 neg
ther share data
2011 2010 2009 2008 2007 2006 2005 2004 2003 2002 2001
umer of shreholders t yer-end 251,715 240 ,043 233 ,311 220 ,192 197,519 183,735 195 ,442 202,300 208,500 211,000214 ,000umer of Series a shres outstnding t
yer-end , million 643 657 657 657 657 131.4 131.4 131.5 131.7 131.7 131.7umer of Series b shres outstndingt yer-end, million 1,385 1,371 1,371 1,371 1,369 273.4 273.1 278.6 287.8 287.8 287.8averge numer of shres outstnding,million 2,027 2,027 2,027 2,027 2,025 404.7 405.2 418.5 419.4 419.4 422.4umer of Series a shres trded inStockholm during the yer, million 130.5 203.2 147.0 308.0 172.3 56.4 39.3 42.0 31.4 27.3 40.3umer of Series b shres trded inStockholm during the yer, million 2,944.1 2,272.4 2,713.9 3,130.0 2,712.4 617.0 518.7 498.0 404.8 349.4 344.4umer of shres trded in a, aS-a during the yer, million – — — — 113.5 14.1 19.8 24.0 10.4 11.0 15.0
1 bsic ernings per shre is clculted s income for the period divided yverge numer of shres outstnding. eporting ccording to FS from2004.
2 Proposed dividend in SK per shre divided y shre price t yer-end.3 Shre price t yer-end, including proposed dividend during the yer,
divided y shre price t eginning of the yer, (2000 includes premium inconnection with repurchse, 2003 includes distriution of shres in ainx ,2006 includes shre split 6:1 in which the sixth shre ws redeemed yab olvo for n mount of SK 5.00 per shre).
4 Shre price t yer-end divided y sic ernings per shre.
5 rket vlue t yer-end minus net nncil position nd minority interestsdivided y operting income excluding restructuring costs nd revlution ofshres.
6 sh dividend divided y sic ernings per shre.7 Shreholders’ equity for shreholders in ab olvo divided y numer of
shres outstnding t yer-end.8 ncluding distriution of shres in ainx equl to SK 3.01 (shre-split
djusted) per olvo shre in 2004.9 ncluding extr pyment of SK 5 through redemption of shres.
10 Proposed y the bord of irectors.
he largest shareholders inAB Volvo, December 31, 20111
umerof shres
% oftotl
votesShre
cpitl, %
enult s..s. 138,604,945 17.7 6.8
ndustrivärden 122,811,457 15.6 6.1iolet Prtners P 43,727,400 5.6 2.2SHb2 36,405,612 4.7 1.8aF nsurnce & Funds 61,051,900 3.9 3.0alect (pension funds) 87,650,000 3.8 4.3aFa nsurnce 26,024,563 3.3 1.3Swednk our Funds 81,098,942 2.7 4.0orwegin Government 63,945,595 2.4 3.2Sb Funds/rygg ife nsurnce 44,469,536 2.1 2.2otal 705,789,950 61.8 34.8
Distribution of shares,December 31, 20111
umer ofshreholders
% of totlvotes1
Shre ofcpitl, %1
1–1,000 shres 190,646 2.8 2.4
1,001–10,000 shres 56,088 7.6 5.510,001–100,000 shres 4,434 5.0 3.1100,001– 547 84.6 89.0otal 251,715 100.0 100.0
1 bsed on the numer of outst nding shres.2 omprises shres held y SHb, SHb Pension Fund, SHb mployee Fund, SHb
Pensionskss nd ktogonen.
1 bsed on ll registered shres.
ab olvo held 4.7% of the ompny’s shres on ecemer 31, 2011.
Faa Fa 2011
146

7/29/2019 MBA VTU Project on VOLVO Group in India
http://slidepdf.com/reader/full/mba-vtu-project-on-volvo-group-in-india 151/166
Business area statistics
et sales1
SK 2011 2010 2009 2008 2007 2006 2005 2004 2003 2002 2001
rucks urope 85,173 69,606 65,874 109,914 108,651 93,282 79,706 77,431 70,101 67,830 66,367
orth americ 37,120 26,901 21,563 26,588 27,255 50,605 46,129 35,154 28,151 33,721 33,630
South americ 26,822 21,680 12,490 14,680 11,483 9,213 7,657 5,223 3,464 3,277 3,993
asi 37,551 35,231 26,943 37,515 26,593 8,975 13,551 12,378 9,206 5,919 4,659
ther mrkets 14,037 13,887 12,069 14,538 13,910 9,190 8,353 6,693 6,047 8,005 7,919
otal 200,703 167,305 138,940 203,235 187,892 171,265 155,396 136,879 116,969 118,752 116,568
Buses urope 7,009 6,242 7,707 7,321 7,767 7,924 7,142 6,948 6,534 7,104 6,636
orth americ 7,541 7,200 5,673 5,355 4,630 4,910 4,247 2,960 2,984 3,838 6,847
South americ 2,721 1,737 1,235 1,571 1,623 1,537 2,641 521 329 366 757
asi 3,027 3,299 2,749 2,094 1,802 2,003 1,612 1,632 1,447 2,022 1,839
ther mrkets 1,991 2,038 1,101 971 786 897 947 661 684 705 596
otal 22,289 20,516 18,465 17,312 16,608 17,271 16,589 12,722 11,978 14,035 16,675
Construction urope 19,052 16,138 12,987 25,192 25,294 20,326 15,524 13,453 12,348 10,837 10,667quipment orth americ 7,862 6,267 5,475 10,159 11,170 11,280 10,337 8,601 5,428 5,667 6,145
South americ 4,177 4,130 2,578 2,913 2,155 1,358 1,238 922 636 709 847
asi 30,151 24,352 12,957 13,738 12,179 6,903 5,717 4,961 3,707 3,048 2,773
ther mrkets 3,745 2,923 1,661 4,077 2,835 2,264 2,000 1,423 1,035 751 703
otal 64,987 53,810 35,658 56,079 53,633 42,131 34,816 29,360 23,154 21,012 21,135
Volvo Penta urope 4,546 4,507 4,390 6,554 6,798 6,111 5,102 4,907 4,189 3,945 3,827orth americ 1,386 1,500 1,100 1,947 2,674 2,815 2,832 2,500 2,109 2,261 2,175South americ 342 335 284 364 274 221 208 142 146 127 213asi 2,245 2,008 2,054 2,082 1,624 1,359 1,427 1,324 947 1,141 988ther mrkets 340 366 331 486 349 268 207 184 205 195 177
otal 8,859 8,716 8,159 11,433 11,719 10,774 9,776 9,057 7,596 7,669 7,380
Volvo Aero urope 3,036 3,768 3,942 3,497 3,462 3,798 3,406 3,179 4,000 3,450 4,875orth americ 3,304 3,599 3,508 3,534 3,723 3,815 3,612 3,127 3,301 4,573 5,841
South americ 8 27 34 58 127 173 168 138 152 177 187
asi 108 233 205 234 234 356 284 400 428 497 708
ther mrkets 53 81 114 125 100 91 68 81 149 140 173
otal 6,509 7,708 7,803 7,448 7,646 8,233 7,538 6,925 8,030 8,837 11,784
ther ndelimintions 242 (680) (538) (575) (703) (654) 7,076 7,228 7,041 6,775 7,073
et sales ndustrialperations 303,589 257,375 208,487 294,932 276,795 249,020 231,191 202,171 174,768 177,080 180,615
Customer urope 4,663 4,733 7,127 7,099 4,484 4,388 4,797 6,613 6,078 5,997 5,674Finance orth americ 2,326 2,605 3,004 369 2,467 2,569 2,036 2,432 2,542 3,344 3,216
South americ 1,131 1,156 1,070 791 620 608 570 396 358 403 451
asi 571 435 435 158 87 45 101 90 65 49 24
ther mrkets 192 101 75 68 47 38 45 67 110 132 130
otal 8,883 9,031 11,711 8,485 7,705 7,648 7,549 9,598 9,153 9,925 9,495
limintions (2,104) (1,658) (1,836) 250 905 2,167 1,819 (693) (630) (807) (830)
Volvo Group total 310, 367 264,749 218,361 303,667 285,405 258,835 240,559 211,076 183,291 186,198 189,280
1 et sles 2001 hve een restted in ccordnce with new orgniztion effectivefrom 2002.
as of Jnury 1, 2007, the results from the synergies creted in the usi-ness units re trnsferred ck to the vrious usiness res. omprisongures for 2006 hve een restted.
1

7/29/2019 MBA VTU Project on VOLVO Group in India
http://slidepdf.com/reader/full/mba-vtu-project-on-volvo-group-in-india 152/166
-a SUa
perating income
SK 2011 2010 2009 2008 2007 20061 2005 20042 20033 2002 20014
rucks 18,260 10,112 (10,805) 12,167 15,193 13,116 11,717 8,992 3,951 1,189 (2,066)buses 1,036 780 (350) (76) 231 745 470 158 (790) (94) (916)onstruction quipment 6,653 6,180 (4,005) 1,808 4,218 4,072 2,752 1,898 908 406 527olvo Pent 781 578 (230) 928 1,173 1,105 943 940 695 647 658olvo aero 336 286 50 359 529 359 836 403 (44) 5 653ustomer Finnce 942 167 (680) 1,397 1,649 1,686 2,033 1,365 926 490 325ther (1,109) (102) (994) (731) (762) (684) (598) 923 (3,142) 194 143perating income (loss)Volvo Group 26,899 18,000 (17,013) 15,851 22,231 20,399 18,153 14,679 2,504 2,837 (676)
perating margin
% 2011 2010 2009 2008 2007 2006 2005 2004 2003 2002 2001
rucks 9.1 6.0 (7.8) 6.0 8.1 7.7 7.5 6.6 3.4 1.0 (1.8)onstruction quipment 10.2 11.5 (11.2) 3.2 7.9 9.7 7.9 6.5 3.9 1.9 2.5buses 4.6 3.8 (1.9) (0.4) 1.4 4.3 2.8 1.2 (6.6) (0.7) (5.5)olvo Pent 8.8 6.6 (2.8) 8.1 10.0 10.3 9.6 10.4 9.1 8.4 8.9olvo aero 5.2 3.7 0.6 4.8 6.9 4.4 11.1 5.8 (0.5) 0.1 5.5Volvo Group ndustrialperations 8.6 6.9 (7.8) 5.2 7.8 7.9 7.9 7.3 1.4 1.6 (0.4)
umber o employees at year-end
umer1, 2 2011 2010 2009 2008 2007 2006 2005 2004 2003 2002 2001
rucks 62,315 57,796 56,505 64,280 64,390 49,900 50,240 49,450 46,900 43,470 44,180buses 8,529 8,685 9,541 8,930 9,290 7,760 7,710 7,700 6,680 6,660 6,230onstruction quipment 18,422 16,648 16,126 19,810 19,710 11,050 10,290 9,930 9,280 8,410 7,780olvo Pent 2,549 2,353 2,928 2,940 3,000 1,650 1,560 1,580 1,440 1,410 1,370olvo aero 3,179 3,120 3,278 3,510 3,550 3,510 3,460 3,350 3,440 3,660 4,040Finncil Services 1,323 1,235 1,234 1,290 1,150 1,010 1,070 1,100 1,060 1,060 1,080ther 1,845 572 596 620 610 8,310 7,530 7,970 6,940 6,490 6,240Volvo Group, total 98,162 90,409 90,208 101,380 101,700 83,190 81,860 81,080 75,740 71,160 70,920
as of Jnury 1, 2007, the enets from the synergies creted in the usinessunits re trnsferred ck to the vrious usiness res. omprison gures for2006 hve een restted.1 perting income in 2006 includes djustment of goodwill of neg 1,712,
reported in rucks.
2 perting income in 2004 included reversl of write-down of shres in Scniab of 915, reported in ther, nd write-down of shres in Henlys Group Plc of95, reported in buses.
3 perting income in 2003 included write-down of shres in Scni ab ndHenlys Group Plc mounting to 4,030, of which 429 ws repor ted in buses(Henlys Group) nd 3,601 ws reported in ther (Scni ab).
4 perting income in 2001 included restructuring costs minly relted to theintegrtion of ck rucks nd enult rucks of 3,862 of which 3,106 in
rucks, 392 in buses nd 364 in onstruction quipment.
1 as of 2007, employees in usiness units re llocted to the usiness res.2 as of 2009 regulr employees re shown, previously temporry employees were lso included.
nvironmental perormance o Volvo production plants, ndustrial operations
asolute vlues relted to net sles 2011 2010 2009 2008
nergy consumption (GWh; Wh/SK ) 2,471; 8.1 2,315; 9.0 1,888; 9.1 2,530; 8.6
2 emissions (1,000 tons; tons/SK ) 255; 0.8 279; 1.1 213; 1.0 291; 1.0
Wter consumption (1,000 m3; m3/SK ) 7,970; 26.2 7,519; 29.2 6,637; 31.8 8,205; 27.8
x emissions (tons; kilos/SK ) 474; 1.6 719; 2.8 322; 1.5 800; 2.7
Solvent emissions (tons; kilos/SK ) 2,554; 8.4 2,294; 8.9 1,435; 6.9 1,945; 6.6
Sulphur dioxide emissions (tons; kilos/SK ) 34; 0.1 33; 0.1 38; 0.2 64; 0.2
Hzrdous wste (tons; kg/SK ) 25,943; 85.5 22,730; 88 17,558; 84 27,675; 94
et sles, SK n 303.6 257.4 208.5 294.9
1 xcluding U rucks nd ngersoll nd od evelopment.
Faa Fa 2011
148

7/29/2019 MBA VTU Project on VOLVO Group in India
http://slidepdf.com/reader/full/mba-vtu-project-on-volvo-group-in-india 153/166
mployees
umer1 2011 2010 2009 2008 2007 2006 2005 2004 2003 2002 2001
Sweden 24,663 23,073 22,763 28,190 28,660 27,830 27,070 28,530 26,380 25,420 24,350
urope, excluding Sweden 30,458 29,239 29,793 32,940 32,780 30,070 29,650 28,930 29,120 27,130 27,800
orth americ 15,427 12,844 12,640 14,200 15,750 14,820 15,140 14,620 12,270 12,440 12,670
South americ 5,234 4,322 4,257 4,380 4,640 3,890 3,690 3,110 2,640 2,020 2,090
asi 19,924 18,535 18,416 19,090 17,150 4,420 4,210 4,130 3,710 2,590 2,550
ther mrkets 2,456 2,396 2,339 2,580 2,720 2,160 2,100 1,760 1,620 1,560 1,460
Volvo Group total 98,162 90,409 90,208 101,380 101,700 83,190 81,860 81,080 75,740 71,160 70,920 1 as of 2009 regulr employees re shown, previously temporry employees were lso included.
Delivered units
umer 2011 2010 2009 2008 2007 2006 2005 2004 2003 2002 2001
Hevy-duty t rucks ( >16 t ons) 179,779 123,522 82,675 179,962 172,322 179,089 172,242 152,300 120,920 120 ,200 117,180
edium-duty trucks (7–15.9 tons) 34,631 30,657 21,653 30,817 27,933 14,695 18,643 18,800 15,870 16,220 17,310ight trucks (<7 tons) 23,982 25,811 23,354 40,372 36,101 26,147 23,494 22,120 19,200 20,710 20,820
otal trucks 238,391 179,989 127,681 251,151 236,356 219,931 214,379 193,220 155,990 157,130 155,310
umer 2011 2010 2009 2008 2007 2006 2005 2004 2003 2002 2001
rucks otl urope 95,113 65,503 49,145 121,847 128,070 114,417 103,622 102,670 92,080 96,290 98,040
Western urope 75,728 56,215 43,919 95,969 100,106 97,074 91,087 90,750 82,670 87,490 90,460
stern urope 19,385 9,288 5,226 25,878 27,964 17,343 12,535 11,920 9,410 8,800 7,580
orth americ 42,613 24,282 17,574 30,146 33,280 70,499 64,974 49,270 34,760 36,510 34,650
South americ 29,274 21,483 12,587 18,092 15,264 11,646 11,248 9,190 5,980 5,360 5,790
asi 56,165 53,833 34,800 60,725 39,916 12,817 25,706 24,880 16,290 9,140 6,600
ther mrkets 15,226 14,888 13,575 20,341 19,826 10,552 8,829 7,210 6,880 9,830 10,230
otal 238,391 179,989 127,681 251,151 236,356 219,931 214,379 193,220 155,990 157,130 155,310
Buses otl urope 2,695 2,395 3,164 3,313 3,748 3,570 3,723 3,417 3,087 3,413 3,115
Western urope 2,601 2,336 2,896 3,140 3,377 3,081 3,385 3,073 2,782 3,076 2,899
stern urope 94 59 268 173 371 489 338 344 305 337 216
orth americ 3,014 2,092 1,539 1,884 1,547 1,741 1,546 1,388 1,553 1,945 3,128
South americ 2,620 1,174 690 995 1,318 1,236 2,297 624 369 495 1,009
asi 3,417 3,477 3,839 3,033 2,757 3,349 2,554 2,341 2,227 2,639 2,209
ther mrkets 1,040 1,091 625 712 546 464 555 462 581 567 492
otal 12,786 10,229 9,857 9,937 9,916 10,360 10,675 8,232 7,817 9,059 9,953
20071 2006 2005 2004 2003 2002 2001
2,426; 9.6 2,612; 10.5 2,683; 11.6 2,695; 13.3 2,607; 14.9 2,564; 14.5 2,586; 14.3
242; 1.0 282; 11.4 292; 1.3 293; 1.5 298; 1.7 307; 1.7 316; 1.7
7,067; 27.9 7,596; 30.6 7,419; 32.1 8,495; 42.2 8,687; 49.1 9,202; 52.0 9,187; 50.9
542; 2.1 606; 2.4 672; 2.9 645; 3.2 570; 3.3 726; 4.1 730; 4.0
1,979; 7.8 2,048; 8.3 1,960; 8.5 2,085; 10.3 1,965; 11.2 1,896; 10.7 1,816; 10.1
58; 0.2 69; 0.3 209; 0.9 184; 0.9 200; 1.1 173; 1.0 308; 1.7
27,120; 107 26,987; 108.8 23,590; 102 24,675; 122.1 21,613; 124 20,531, 116 20,306; 112
253.2 248.1 231.2 202.1 174.8 177.1 180.6
1

7/29/2019 MBA VTU Project on VOLVO Group in India
http://slidepdf.com/reader/full/mba-vtu-project-on-volvo-group-in-india 154/166
lof Persson ssumed the position s deputy Presidentof ab olvo nd deputy of the olvo Group on y 1,2011. He ws previously President of olvo onstructionquipment since 2008. Ptrick lney ws ppointed newPresident of olvo onstruction quipment nd he ssumedhis position on y 1, 2011, when he lso ecme memerof the Group xecutive em.
n Septemer 1, 2011, lof Persson succeeded eifJohnsson s President of ab olvo nd of the olvoGroup.
n conjunction with the introduction of the new orgni-ztion on Jnury 1, 2012, the following chnges weremde to olvo’s Group xecutive em:
Stffn Jufors, President of olvo rucks, retired ndthus resigned from the Group xecutive em.
Stefno hmielewski, former President of enultrucks, Görn Gummeson, President of olvo Pent, Storukeuchi, President of U rucks, rtin Weissurg, Presi-dent of olvo Finncil Services nd Stffn Zckrisson,President of olvo aero, re not included in the Group xec-utive em s of Jnury 1, 2012.
Stefn Johnsson resigned from his position s directorof the Group xecutive em responsile for H mttersnd severl usiness units
ennis Slgle, former President of orth americnrucks nd ck rucks, ssumed newly estlishedposition s xecutive ice President Group rucks Sles& rketing americs, remining memer of the Groupxecutive em.
Peter Krlsten, former President of olvo Powertrinnd Senior ice President echnology of the olvo Group,ssumed newly estlished position s xecutive icePresident Group rucks Sles & rketing a,remining memer of the Group xecutive em.
Jochim osenerg, formerly responsile for olvoGroup asi ruck pertions, ssumed newly est-lished position s xecutive ice President Group rucksSles & rketing aPa, nd ecme memer of theGroup xecutive em.
Pär Österg, formerly responsile for rucks asi,ssumed newly estlished position s xecutive icePresident ruck Joint entures, remining memer ofthe Group xecutive em.
orjörn Holmström, former President of olvo 3P,ssumed newly estlished position s xecutive icePresident Group rucks echnology, nd ecme memer of the Group xecutive em.
ikel brtt, former F of the olvo Group, ssumed newly estlished position s xecutive ice PresidentGroup rucks pertions, remining memer of theGroup xecutive em.
Håkn Krlsson, former President of olvo buses,ssumed newly estlished position s xecutive icePresident business ares, remining memer of theGroup xecutive em.
anders serg, former President of olvo resury,ssumed newly estlished position s xecutive icePresident Finnce & business Support nd succeeded
Changes in the Group xecutive eam
ikel brtt s F of the olvo Group, with responsiilityfor mong other things olvo Finncil Services nd olvo. He lso ecme memer of the Group xecutive em.
gnus rlnder, former President of olvo ,ssumed newly estlished position s xecutive icePresident orporte Process & , nd ecme memerof the Group xecutive em.
Krin Flk, former President of olvo Group on-automotive Purchsing, ssumed newly estlishedposition s xecutive ice President orporte Strtegy,nd ecme memer of the Group xecutive em.
Kerstin enrd, former Senior ice President Humnesources for the olvo Group under Stefn Johnsson,ssumed newly estlished position s xecutive icePresident orporte Humn esources, nd ecme memer of the Group xecutive em.
v Persson, xecutive ice President orporteegl & omplince nd Generl ounsel, Per öjdquist,xecutive ice President orporte ommuniction,Ptrick lney, xecutive ice President olvo onstructionquipment nd Jn-ric Sundgren, xecutive ice Presi-dent Pulic & nvironmentl affirs, remin in the Groupxecutive em nd retin their current res of respons-iility mterilly unchnged.
12
3 4
56
7
89
10
1112 13
1415 16
Pa Ga P 2011
150
GUP aaG

7/29/2019 MBA VTU Project on VOLVO Group in India
http://slidepdf.com/reader/full/mba-vtu-project-on-volvo-group-in-india 155/166
1
3. Peter Karlstenxecutive Vice PresidentGroup rucks Sales & arketing A
born 1957. . Sc. lectricl ngineering. President ofolvo Powertrin 2007–2011. Senior ice President ech-nology for the olvo Group 2007–2011. Hed of olvo’sorth americn truck opertions 2003–2007. Hed ofolvo rucks in brzil 2001–2003. emer of the Groupxecutive em since 2007. With olvo since 2001. Hold-ings in Volvo, own and related parties: 99,195 shres,including 98,979 Series b shres.
7. Pär Östbergxecutive Vice President ruck Joint Ventures
born 1962. ster of business administrtion. Hs heldvrious senior positions in the olvo Group, most recentlys Senior ice President nd P resident rucks asi2008–2011. F of the olvo Group 2005–2008.Senior ice President nd F of enult rucks 2004–2005. emer of the Group xecutive em since 2005.With olvo since 1990. Holdings in Volvo, own andrelated parties: 7,768 shres, including 7,608 Series bshres.
1. lo PerssonPresident and C
born 1964. b. Sc. in business administrtion ndconomics. President of ab olvo nd hief xecutivefcer of the olvo Group since Septemer 1, 2011.President of olvo onstruction quipment 2008–2011.President of olvo aero 2006–2008. With olvo since2006. emer of the olvo bord since Septemer 1,2011. Holdings in Volvo, own and related parties: 56,344 Series b shres.
9. åkan Karlssonxecutive Vice President Business Areas
born 1961. . Sc. ngineering. President nd olvobuses 2003–2011. President of olvo ogistics 2000–2003. emer of the Group xecutive em since 2003.With olvo since 1986. Holdings in Volvo, own andrelated parties: 41,340 shres, including 39,849 Seriesb shres.
2. Dennis Slaglexecutive Vice PresidentGroup rucks Sales & arketing Americas
born 1954. b. Sc. President nd of orth americnrucks 2009–2011. President nd of ck rucks,nc. 2008–2009. President nd of olvo onstructionquipment orth americ 2003–2008. emer of the
Group xecutive em since 2008. With olvo since2000. Board member: West irgini Wesleyn ollegebord of rustees. Holdings in Volvo, own and relatedparties: 15,271 Series b shres.
Group anagement
5. ikael Brattxecutive Vice President Group rucks perations
born 1967. Hs held vrious senior positions in the nncilres in the olvo Group, most recently s Senior icePresident nd F 2008–2011. Prior to tht ice Presidentnd Hed of orporte Finnce t ab olvo. emer of theGroup xecutive em since 2008. With olvo since 1988.Holdings in Volvo, own and related parties: 78,884
shres, including 77,992 Series b shres.
11. va Perssonxecutive Vice President Corporate egal& Compliance and General Counsel
born 1953. ster of ws. esponsile within theGroup for legl mtters nd Generl ounsel of the olvoGroup since 1997. ice President, He d of orporteegl of ab olvo 1993–1997. emer of the Groupxecutive em since 1997. With olvo since 1988.Secretry to the olvo bord since 1997. Board member: Hndelsnken egion äst nd orsk Hydro aSa.Holdings in Volvo, own and related parties: 60,036shres, including 58,560 Series b shres.
14. Per öjdquistxecutive Vice PresidentCorporate Communication
born 1949. esponsile within the olvo Group for corpo-rte communictions since 1997. emer of the Groupxecutive em since 1997. With olvo since 1973. Hold-ings in Volvo, own and related parties: 118,236 shres ,including 101,456 Series b shres.
15. Jan-ric Sundgrenxecutive Vice PresidentPublic & nvironmental Aairs
born 1951. . Sc. ngineering, Ph in solid stte Physics,Professor in mterils science. esponsile within theolvo Group for pulic & environmentl ffirs since2006. emer of the Group xecutive em since 2006.With olvo since 2006. Chairman: SP echnicl eserchnstitute of Sweden ab. Board member: Hogi ab.emer of the oyl Swedish acdemy of ngineeringSciences. Holdings in Volvo, own and related parties: 28,939 shres, including 28,879 Series b shres.
4. Joachim osenbergxecutive Vice PresidentGroup rucks Sales & arketing APAC
born 1970. . Sc. ndustril ngineering nd ngement,. Sc. Finncil conomics, . Sc. business nd co-nomics. Hs held vrious senior positions in the olvoGroup, most recently s President of olvo Group asiruck pertions 2007–2011. ice President olvoGroup allince fce 2007. ice President olvo Power-trin 2005–2007. emer of the Group xecutive emsince 2012. With olvo since 2005. Holdings in Volvo,own and related parties: 8,224 Series b shres.
6. orbjörn olmströmxecutive Vice President Group rucks echnology
born 1955. . Sc. echnicl ngineering. President ofolvo 3P 2003–2011. Prior to tht he hs held vrioussenior positions t olvo Powertrin. emer of the Groupxecutive em since 2012. With olvo since 1979. Hold-ings in Volvo, own and related parties: 36,343 Seriesb shres.
8. Patrick lneyxecutive Vice PresidentVolvo Construction quipment
born 1968. b. Sc. business administrtion. Hed of olvoonstruction quipment since y 1, 2011. Prior to ththe hs held vrious senior positions t olvo onstruction
quipment, most recently s ice President nd Hed ofpertions. emer of the Group xecutive em since2011. With olvo since 2001. Holdings in Volvo, ownand related parties: 6,586 Series b shres.
10. Anders sbergxecutive Vice PresidentFinance and Business Support and CF
born 1961. b. Sc. Hs held vrious positions w ithin olvoGroup Finnce nd olvo resury, most recently s Presi-dent of olvo resury Group 2000–2011. emer of theGroup xecutive em since 2012. With olvo 1985–1988nd since 1992. Board member: he Swedish associtionof orporte resurers. Holdings in Volvo, own andrelated parties: 13,001 Series b shres.
12. Kerstin enardxecutive Vice PresidentCorporate uman esources
born 1961. b. Sc. Sociology. Senior ice President Humnesources for the olvo Group 2007–2011. Prior to thtSenior ice President Humn esources & ommunic-tions t olvo Powertrin 2005–2006. emer of theGroup xecutive em since 2012. With olvo since2005. Holdings in Volvo, own and related parties: 9,710 shres, including 9,550 Serie s b shres.
13. Karin Falk xecutive Vice President Corporate Strategy
born 1965. b. Sc. business administrtion. Hs heldvrious positions within the olvo Group, most recently sPresident of olvo Group aP (on-automotive Purchs-ing) 2008–2011. emer of the Group xecutive emsince 2012. With olvo 1988–1999 nd since 2008.Holdings in Volvo, own and related parties: 4,002shres, including 1,762 Series b shres.
16. agnus Carlanderxecutive Vice President Corporate Process &
born 1955. ster echnicl ngineering. Hs held vr-ious senior positions in the olvo Group, most recently sPresident of olvo 2008–2011. emer of the Groupxecutive em since 2012. With olvo since 1985. Hold-ings in Volvo, own and related parties: 48,116 shres,including 48,056 Series b shres.
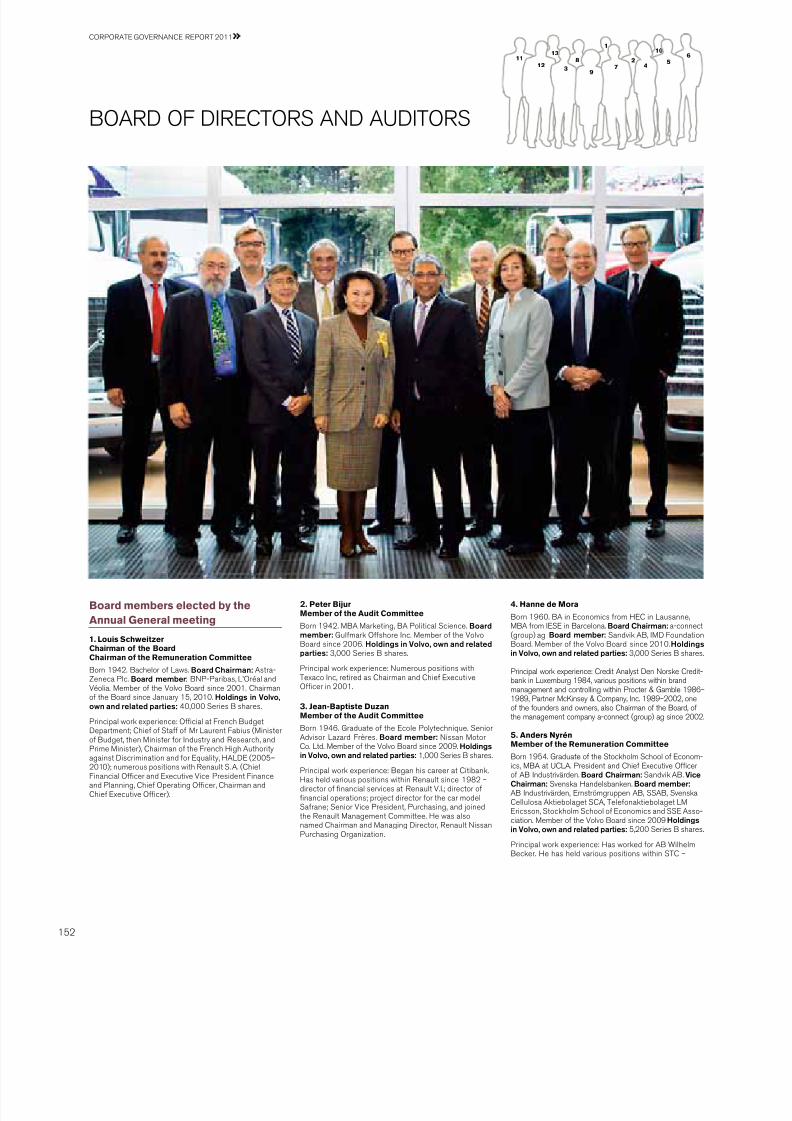
7/29/2019 MBA VTU Project on VOLVO Group in India
http://slidepdf.com/reader/full/mba-vtu-project-on-volvo-group-in-india 156/166
1
2
34
5
6
7
8
9
10
1113
12
Pa Ga P 2011
152
ba F S a aUS
Board members elected by theAnnual General meeting
1. ouis SchweitzerChairman o the BoardChairman o the emuneration Committee
born 1942. bchelor of ws. Board Chairman: astr-Zenec Plc. Board member: bP-Pris, ’rél ndéoli. emer of the olvo bord since 2001. hirmnof the bord since Jnury 15, 2010. Holdings in Volvo,own and related parties: 40,000 Series b shres.
Principl work experience: fcil t French budgeteprtment; hief of Stff of r urent Fius (inister
of budget, then inister for ndustry nd eserch, ndPrime inister), hirmn of the French High authorityginst iscrimintion nd for qulity, Ha (2005–2010); numerous positions with enult S. a. (hiefFinncil fcer nd xecutive ice President Finncend Plnning, hief perting fcer, hirmn ndhief xecutive fcer).
2. Peter Bijurember o the Audit Committee
born 1942. ba rketing, ba Politicl Science. Boardmember: Gulfmrk ffshore nc. emer of the olvobord since 2006. Holdings in Volvo, own and relatedparties: 3,000 Series b shres.
Principl work experience: umerous positions withexco nc, retired s hirmn nd hief xecuti vefcer in 2001.
3. Jean-Baptiste Duzanember o the Audit Committee
born 1946. Grdute of the cole Polytechnique. Senior
advisor zrd Frères. Board member: issn otoro. td. emer of the olvo bord since 2009. Holdingsin Volvo, own and related parties: 1,000 Series b shres.
Principl work experience: begn his creer t itink.Hs held vrious positions within enult since 1982 –director of nncil services t enult ..; director ofnncil opertions; project director for the cr modelSfrne; Senior ice President, Purchsing, nd joinedthe enult ngement ommittee. He ws lsonmed hirmn nd nging irector, enult issnPurchsing rgniztion.
4. anne de ora
born 1960. ba in conomics from H in usnne,ba from S in brcelon. Board Chairman: -connect(group) g. Board member: Sndvik ab, Foundtionbord. emer of the olvo bord since 2010. Holdingsin Volvo, own and related parties: 3,000 Series b shres.
Principl work experience: redit anlyst en orske redit-nk in uxemurg 1984, vrious positions within rndmngement nd controlling within Procter & Gmle 1986–1989, Prtner cKinsey & ompny, nc. 1989–2002, oneof the founders nd owners, lso hirmn of the bord, ofthe mngement compny -connect (group) g since 2002.
5. Anders yrénember o the emuneration Committee
born 1954. Grdute of the Stockholm School of conom-ics, ba t Ua. President nd hief xecutive fcerof ab ndustrivärden. Board Chairman: Sndvik ab. ViceChairman: Svensk Hndelsnken. Board member: ab ndustrivärden, rnströmgruppen ab, SSab, Svenskellulos aktieolget Sa, elefonktieolget ricsson, Stockholm School of conomics nd SS asso-cition. emer of the olvo bord since 2009 Holdingsin Volvo, own and related parties: 5,200 Series b shres.
Principl work experience: Hs worked for ab Wilhelmbecker. He hs held vrious positions within S –
7/29/2019 MBA VTU Project on VOLVO Group in India
http://slidepdf.com/reader/full/mba-vtu-project-on-volvo-group-in-india 157/166
1
ontroller, xecutive ice President nd F, nd Presidentof S enture ab; President nd hief xecutive f cert nterntionl ab; xecutive ice President ndF t Securum; irector with executive responsiilityfor rkets nd orporte Finnce t ordnken;xecutive ice President nd F t Sknsk.
6. lo Persson
born 1964. b. Sc. in business administrtion nd conomics.President of ab olvo nd hief xecutive fcer of theolvo Group since Septemer 1, 2011. emer of theolvo bord since Septemer 1, 2011. Holdings in Volvo,own and related parties: 56,344 Series b Shres.
Principl work experience: begn his creer t abb; hsheld numer of executive positions t adrnz ndbomrdier; President of inline nd etros ivision inbomrdier; President of olvo aero; President of olvoonstruction quipment.
7. avi Venkatesan
born 1963. ba, Hrvrd business School, nd .Sc.ndustril ngineering, Purdue University. Board member: nfosys td., advisory bord of bunge nc., on Protadvisory bord Hrvrd business School. emer of theolvo bord since 2008. Holdings in Volvo, own andrelated parties: 700 Series b shres.
Principl work experience: Severl leding positionswithin the americn engine mnufcturer ummins.hirmn of icrosoft ndi nd responsile for icrosoft’smrketing, opertionl nd usiness development effortsin ndi.
8. ars esterbergChairman o the Audit Committee
born 1948. .Sc. ngineering, bchelor businessadministrtion. Board Chairman: Husqvrn ab. Boardmember: SSab, Sndvik ab nd Sten ab. emer ofthe olvo bord since 2007. Holdings in Volvo, own andrelated parties: 60,000 Series a shres.
Principl work experience: President nd of Grängesab, Sab ab nd autoliv nc.
9. ing ehember o the emuneration Committee
born 1948. ba, iterture & nterntionl eltions.Board member: abb td. emer of the olvo bordsince 2006. Holdings in Volvo, own and relatedparties: one.
Principl work experience: Journlist b , ew ork.umerous positions with the U.S. Government ForeignService in burm, Hong Kong, iwn nd beijing. riouspositions with stmn Kodk in hin, ltest s Presidentnd hirmn, orth asi egion. hirmn of lcoGreter hin.
Board members and deputies
appointed by employee organisations
10. ikael Sällström
mployee representtive, ordinry memer. born 1959.With olvo 1980–1999 nd since 2009. emer of theolvo bord since 2009. Holdings in Volvo, own andrelated parties: one.
11. Berth hulin
mployee representtive, ordinry memer. born 1951.With olvo since 1975. eputy memer of the olvobord 1999–2009, memer since 2009. Holdings inVolvo, own and related parties: 1,425 Series b shres.
12. Peteris auberts
mployee representtive, ordinry memer. born 1948.With olvo since 1999. eputy memer of the olvo bord2010–2011, memer since ovemer 30 , 2011. Holdingsin Volvo, own and related parties:
216 Series a shres.13. ars Ask
mployee representtive, deputy memer. born 1959.With olvo since 1982. eputy memer of the olvo bordsince 2009. Holdings in Volvo, own and related parties: 406 shres, including 250 Series b shres.
ats enning
mployee representtive, deputy memer. born 1961.With olvo since 1982. eputy memer of th e olvobord sin ce oveme r 30, 2011 Holdings in Volvo,own and related parties: 250 Series b shres.
Changes in the Board
Board members elected by the Annual Generaleetingeif Johnsson, of the olvo Group until nd includ-ing august 31, 2011, resigned from the bord t thesme time nd ws replced s b ord memer y lofPersson from Septemer 1, 2011, who then lsossumed the position s .
Board members and deputies appointed byemployee organisationsas of ovemer 30, 2011 rtin inder left the bord ndws replced y Peteris uerts, former deputy memerof the bord. ts Henning ws ppointed new deputy sof the sme dte.
Secretary to the Board
va Persson
born 1953. ster of ws. xecutive ice Presidentorporte egl & omplince nd Generl ounsel ofthe olvo Group. Secretry to the olvo bord since 1997.Holdings in Volvo, own and related parties: 60,036shres, including 58,560 Series b shres.
Auditors
Pricewterhouseoopers ab
Göran idström
authorized Pulic accountnt.ed auditor.
auditor since 2006.
ther ssignments: auditor of ed ab. President ofFa (nterntionl Federtion of accountnt s).
born 1946.
Johan ippe
authorized Pulic accountnt.
auditor since 2010.
ther ssignments: auditor of Getinge ab nd lnders ab.
born 1968.

7/29/2019 MBA VTU Project on VOLVO Group in India
http://slidepdf.com/reader/full/mba-vtu-project-on-volvo-group-in-india 158/166
RenumerationCommittee
Audit Committee
Shareholders
President
Group Executive Committee
Auditors
The Volvo Group Corporate Governance Model
Board
Election CommitteeAnnual General Meeting
Pa Ga P
In March 2011, the Board of Directors resolved to appoint as of September 1, 2011, when Leif
Johansson resigned after almost 15 years as CEO, Olof Persson as the new President and CEO of
Volvo. During the year the Board of Directors also resolved to introduce new nancial targets for
the Volvo Group. Based on the uncertainty in the macroeconomic trend, the Board focused during
2011 particularly on continuously adapting the company’s activities to the prevailing demand.
Corporate bodies in
corporate governance
he governnce nd control of the olvo Group
is crried out through numer of corporteodies. at the annul Generl eeting, the
shreholders exercise their voting rights with
regrd, for exmple, to the composition of the
bord of irectors of ab olvo nd election of
externl uditors nd s otherwise stipulted in
the ompnies act. nformtion concerning the
lrgest shreholders in ab olvo s of ecem-
er 31, 2011, including informtion on shre-
holders, whose shreholdings in the compny
represent t lest one tenth of the votes for ll
shres in the compny, is provided in the bord
of irector’s report for olvo on pge 53.
he notice for annul Generl eetings (nd
for xtrordinry Generl eetings if ny) is
mde through dvertisement in the Post- nd
nrikes idningr (Swedish fcil Gzette) nd
on the compny’s wesite. announcement tht
the notice hs een pulished is dvertised in
Dagens Nyhete r nd Göteborgs-Posten.
an lection ommittee, ppointed y the
annul Generl eeting of ab olvo, proposes
bord memers, bord hirmn nd externl
uditors. he bord is responsile for the
Group’s long-term development nd strtegy,
for regulrly controlling nd evluting the com-pny’s opertions nd for the other duties set
forth in the ompnies act. n ddition, the
bord ppoints the President of ab olvo, who
is lso the hief xecutive fcer (). he
duties of the bord re pr tly exercised through
its audit ommittee nd its emunertion
ommittee. he is in chrge of the dily
mngement of the Group in ccordnce with
guidelines nd instructions provided y the bord.
n Jnury 1, 2012, the olvo Group intro-
duced new orgniztion, which ws presented
on ctoer 4, 2011, nd which mong other
things ims t the coordintion of products nd
rnds in the Group’s rucks opertions. n the
new orgniztion, the leds the opertions
the opertions of the Group prtly through the
Group xecutive em, s previously, ut lso
through the newly estlished Group rucks
xecutive ngement em. n ddition, the
conducts regulr follow-ups with the
heds of other usiness res, Group functions
nd corporte functions.
he Group xecutive em comprises those
who report directly to the . he Group
xecutive em hs 16 memers including the
. he Group xecutive em meetings,
which re heded y the , ddress Group-
wide issues nd issues ffecting individul
usiness res, Group functions or corporte
functions. he Group rucks xecutive n-
gement em comprises, in ddition to the
, mostly memers of the Group xecutive
em. emers of the Group xecutive em
Pa Ga P 2011
154

7/29/2019 MBA VTU Project on VOLVO Group in India
http://slidepdf.com/reader/full/mba-vtu-project-on-volvo-group-in-india 159/166
further hve positions in mngement tems
nd decision-mking odies for other usinessres nd Group functions. hese odies will
effect control nd follow-ups of nncil devel-
opment, strtegies nd trgets s well s mke
decisions regrding, for exmple, investments.
Swedish Code o Corporate Governance
olvo pplies the Swedish ode of orporte
Governnce (the ode), which is ville t
www.olgsstyrning.se.
between Jnury 1, 2011 nd ecemer 31,
2011, olvo did not devite from ny of the
regultions set forth in the ode.
his orporte Governnce eport hs een
prepred in ccordnce with the annul
accounts act nd the ode.
lection Committee
he lection ommittee is the shreholders’
ody responsile for sumitting to the annul
Generl eeting the nmes of cndidtes to
serve s hirmn t the eeting nd hirmn
nd other memers of the bord, s well s pro-
posing fees nd other compenstions to e
pid to the bord memers. n the yers in
which olvo elects uditors, the lection om-mittee presents proposls for the election of
uditors nd proposls for fees to e pid to the
uditors sed on the preprtions crried out
y olvo’s audit ommittee. n ddition, the
lection ommittee, in ccordnce with previling
instructions for olvo’s lection ommittee,
presents proposls for memers of the lection
ommittee for the following yer.
n ccordnce with the forementioned
instructions, the lection ommittee shll meet
s often s required for the ommittee to e
le to fulll its duties.
he lection ommittee’s proposl shll epresented to olvo in sufcient time to e
included in the notice to ttend the annul
Generl eeting nd to e pulished on olvo’s
wesite t the sme time. n conjunction with
the notice to ttend the annul Generl eeting
eing pulished, the lection ommittee shll,
mong other duties, comment on whether those
persons who re proposed to e elected s
bord memers re to e considered s inde-
pendent in reltion to the compny nd compny
mngement s well s to mjor shreholders
in the compny nd further to comment on their
mteril ssignments nd holding of shres inolvo. oreover, the ommittee shll report on
how it conducted its work.
n ccordnce with existing instructions, the
annul Generl eeting shll select ve mem-
ers to serve on the lection ommittee, of
whom four shll represent the lrgest shrehold-
ers in the compny, in terms of the numer of
votes, who hve expressed their willingness to
prticipte. n ddition, one of the memers shll
e the hirmn of the ab olvo bord. addition-
lly, the lection ommittee cn offer other
lrger shreholders to ppoint one representtive
s memer of the lection ommittee. f such
n offer is mde, it should e directed in turn to
the lrgest shreholder in terms of voting rights
not lredy eing represented on the lection
ommittee. he numer of memers on the lec-
tion ommittee, however, my not exceed seven.
n ccordnce with its instructions, olvo’s
2011 annul Generl eeting resolved to
ppoint the following individuls s memers of
the lection ommittee: olvo’s hirmn
ouis Schweitzer, Jen-bptiste uzn, repre-
senting enult s..s., rl-lof by, representing
ab ndustrivärden, Håkn Snderg, representingSvensk Hndelsnken, SHb Pension Fund,
SHb mployee Fund, SHb Pensionskss, nd
ktogonen, nd rs Förerg, representing
iolet Prtners P. he lection ommittee
ppointed rl-lof by s hirmn.
he Board
uring the period Jnury 1, 2011 – ecemer 31,
2011, ab olvo’s bord of irectors consisted
of nine memers elected y the annul Generl
eeting. n ddition, the bord hd three memers
nd two deputy memers ppointed y
employee orgniztions.eif Johnsson, who ws olvo’s until
Septemer 1, 2011, ws lso bord memer
until Septemer 1, 2011, when he ws replced
on the bord y lof Persson who lso
ssumed the position of .
uring 2011, six regulr meetings, one sttu-
tory meeting nd ve extrordinry meetings
were held.
he bord hs dopted work procedures for
its ctivities tht contin rules pertining to the
distriution of work etween the bord memers,
the numer of bord meetings, mtters to e
hndled t regulr meetings of the bord nd
duties incument on the hirmn. n ccord-
nce with these procedures, the bord’s hir-
mn shll orgnize nd guide the bord’s work,
e responsile for contcts with the owners
regrding ownership mtters nd provide the
owners’ viewpoints to the bord, ensure thtthe bord receives dequte informtion nd
decision documents for its work nd ensure
complince with the bord’s decisions. n ddition,
the work procedures contin directives con-
cerning the tsks of the audit ommittee nd
the emunertion ommittee respectively. he
bord hs lso issued written instructions
specifying how nncil informtion should e
reported to the bord, s well s dening the
distriution of duties etween the bord nd
the President.
he Board’s composition and attendance at
meetings January 1, 2011 to December 31,2011
bord
auditommit-
tee
emu-nertionommit-
tee
Peter bijur 12 8
Jen-bptiste uzn 12 8
eif Johnsson1 7
lof Persson2 4
Hne de or 12
anders yrén 12 4
ouis Schweitzer 12 4
vi enktesn 12
rs Westererg 12 8
ing eh 11 3
rtin inder3,employeerepresenttive 10
ikel Sällström,employeerepresenttive 11
berth hulin,employeerepresenttive 12
Peteris uerts4,employeerepresenttive 1
Total number ofmeetings 12 8 4
1 eft the bord on august 31, 2011.
2 Ws elected memer of the bord s of
Septemer 1, 2011.3 eft the bord on ovemer 30, 2011.
4 Joined the bord s memer s ofovemer 30, 2011, previously deputy.
1
7/29/2019 MBA VTU Project on VOLVO Group in India
http://slidepdf.com/reader/full/mba-vtu-project-on-volvo-group-in-india 160/166
he annul Generl eeting resolves on the
fees to e pid to the bord memers electedy the shreholders. he annul Generl eet-
ing held on april 6, 2011, pproved fee py-
ments to the bord, for the time until the end of
the next annul Generl eeting, s follows:
hirmn of the bord should receive fee of
SK 1,800,000 nd ech of the remining
memers should receive fee of SK 600,000,
with the exception of the President. n ddition,
the hirmn of the audit ommittee should
receive SK 300,000, the other memers of
the audit ommittee SK 150,000 ech nd
the memers of the emunertion ommittee
SK 100,000 ech.
n rch 2011, the bord nnounced tht it
hd resolved to ppoint lof Persson s the
new President nd for olvo s of Septemer
1, 2011, to replce eif Johnsson when he
would e stepping down. lof Persson ws
previously the President of olvo onstruction
quipment since 2008. Prior to tht, he ws the
President of olvo aero. he bord lso
resolved in Septemer 2011 to introduce new
nncil trgets for the olvo Group to pply s
of 2012, with the im of nnully mesuring
growth nd protility mong the Group’s vriousopertions nd mking comprisons with
numer of selected competitors. as result of
the uncertinty out the mcroeconomic
trend, the bord speciclly focused on moni-
toring the usiness environment in order to
continuously dpt the compny’s ctivities to
the previling demnd. he bord lso focused
on the trend for the Group’s opertions nd visited
severl of the Group’s fcilities in the US in
2011, meeting mngement nd customers.
he bord lso reviewed the nncil positions
of ab olvo nd the olvo Group on regulr
sis nd cted in order to ensure tht there reefcient systems with regrd to follow-up nd
control of the usiness nd nncil position of
the olvo Group. n connection therewith, the
audit ommittee ws responsile for prepring
the bord’s work to ssure the qulity of the
Group’s nncil reporting y reviewing the
interim reports, the annul eport nd consoli-
dted ccounting. n connection therewith, the
bord met with the compny’s uditors during
2011. he bord continuously evlutes the per-
formnce of the .
uring 2011, following preprtion in the
emunertion ommittee, the bord evlutedolvo’s systems for vrile remunertion to
senior executives, where the performnce trgets
were sed on operting income nd operting
rolling csh ow for executives in the industril
opertion. For executives in the customer-
nncing opertion, the performnce trgets
were relted to operting income nd return on
equity. he bord hs concluded tht the out-
come for 2011 hs een stisfctory nd con-
sequently found tht the existing system ws
well-functioning. rrespective of this, the bord
cme to the conclusion tht in future, the operting
mrgin would e etter mesure of the per-
formnce of the industril opertion thn oper-
ting income. n view of the new nncil trgets
for the Group presented y the bord in Sep-
temer 2011, the bord lso elieves tht the
new nncil trget pertining to competitive
comprison of operting mrgins should e
reected in the performnce trgets for vrile
remunertion for 2012, pertining to executives
in the industril opertion. according to the
bord, the operting csh ow is still relevnt
s mesure of the per formnce of the indus-
tril opertion. he bord hs lso found thtfor the customer nncing opertion performnce
trgets sed on return on equit y nd operting
income re still relevnt.
bsed on the ove mentioned evlution of
the vrile-remunertion systems, the bord
resolved to introduce prtly mended perform-
nce trgets for vrile remunertion to senior
executives to pply for 2012 pertining to most
of the industril opertion. he new perform-
nce trgets re sed on the following pr-
meters; (i) six months’ operting rolling csh ow,
(ii) operting mrgin compred to lst yer nd
(iii) protility mesured on operting mrgincompred with competitors. For the customer
nncing opertion, the bord resolved tht the
performnce trgets for vrile remunertion
will continue to focus on return on equity nd
operting income.
he bord’s work is minly per formed within
the frmework of forml bord meetings nd
through meetings in the respective committees
of the bord. n ddition, the hirmn of the
bord mintins regulr contct with the
in order to discuss on-going usiness nd to
ensure tht the decisions tken y the bord
re executed. an ccount of ech bord memer’sge, principl eduction, professionl experience,
ssignments in the ompny, other importnt
ord memerships, their own nd relted pr-
ties’ ownership of shres in olvo s of Ferury
23, 2012, nd the yer they were elected on the
olvo bord, is presented in the section bord
of irectors nd uditors on pge 153.
uring 2011, the bord performed its yerly
evlution of the bord’s work. he hirmn
hs informed the lection ommittee on the
result of the evlution.
ndependence requirements
he bord of irectors of ab olvo must meet
independence requirements pursunt to the
ode. he audit ommittee must lso meet inde-
pendence requirements pursunt to the ode
nd the Swedish ompnies act. below is short
description of the independence requirements. he
independence requirements minly stte tht only
one person from the compny’s mngement
my e memer of the bord, tht mjority of
the bord memers elected y the Generl
eeting shll e independent of the compny
nd the compny mngement nd tht t lesttwo of the bord memers elected y the Gen-
erl eeting who re independent of the com-
pny nd the compny’s mngement shll lso
e independent of the compny’s mjor shre-
holders. n ddition, the ode stipultes tht
mjority of the memers in the audit ommittee
shll e independent of the compny nd the
compny mngement, nd tht t lest one of
the memers who is independent of the compny
nd the compny mngement shll lso e inde-
pendent of the compny’s mjor shreholders.
according to the Swedish ompnies act, the
memers of the audit ommittee my not eemployees of the compny nd t lest one
memer of the audit ommittee shll e inde-
pendent of the compny, compny mngement
nd the compny’s lrgest shreholders nd hve
ccounting or uditing expertise. With regrd to
the emunertion ommittee, the ode sets the
requirement tht memers of the emunertion
ommittee, with the exception of the bord
hirmn if memer of the emunertion om-
mittee, shll e independent of the compny nd
compny mngement.
Pa Ga P 2011
156
7/29/2019 MBA VTU Project on VOLVO Group in India
http://slidepdf.com/reader/full/mba-vtu-project-on-volvo-group-in-india 161/166
Prior to the annul Generl eeting 2011,
considering the ove requirements regrding thebord’s independence, the lection ommittee
reported the following understnding concerning
the bord memers who were elected t the
annul Generl eeting in 2011:
Peter bijur, Hnne e or, ouis Schweitzer,
vi enktesn, rs Westererg nd ing eh
were ll considered independent of the compny
nd compny mngement s well s of the com-
pny’s mjor shreholders.
eif Johnsson, s olvo’s , ws con-
sidered independent of the compny’s mjor
shreholders ut not of the compny nd compny
mngement. lof Persson, who t the 2011
annul Generl eeting, ws the President of
olvo onstruction quipment nd who ws
elected memer of the bord s from Septemer
1, 2011, when he lso ws to ssume the position
s olvo’s , ws deemed independent of the
compny’s mjor shreholders ut ws not
deemed independent in reltion to the compny
nd the compny mngement, due to his position
in the olvo Group.
Jen-bptiste uzn ws considered inde-
pendent in reltion to the compny nd compny
mngement. However, in his cpcity s ndvisor to the of enult S.a., he ws
deemed to hve such reltion to enult s..s.
tht he could not e considered independent
thereof. Since enult s..s., prior to the 2011
annul Generl eeting, controlled more thn 10
percent of the votes in the compny, Jen-bptiste
uzn ws not considered independent in rel-
tion to one of the compny’s mjor shreholders.
anders yrén ws deemed independent in
reltion to the compny nd compny mnge-
ment. However, due to his cpcity s of ab
ndustrivärden, he ws not deemed independent
thereof. Since ab ndustrivärden, prior to the2011 annul Generl eeting, controlled more
thn 10 percent of the votes in the compny,
anders yrén ws not considered independent in
reltion to one of the compny’s mjor shre-
holders.
he lection ommittee must lso meet inde-
pendence requirements pursunt to the ode.
according to the ode, most of the memers of
the lection ommittee re to e independent of
the compny nd the compny mngement. at
lest one memer of the lection ommittee is to
e independent of the compny’s lrgest shre-
holder in terms of votes or ny group of shre-holders tht ct in concert in the governnce of
the compny. either the nor other memers
of the executive mngement re to e memers
of the lection ommittee. f bord memers re
included in the lection ommittee, they my not
constitute mjority of the lection ommittee’s
memers. he hirmn of the bord of the
compny or, ny other bord memer my not e
the hirmn of the lection ommittee. f more
thn one bord memer is included in the lec-
tion ommittee, not more thn one of them my
e dependent in reltion to the compny’s lrgest
shreholders. all memers of the lection om-
mittee hve een considered to e independent
of the compny nd the compny mngement.
all memers of the lection ommittee except
Jen-bptiste uzn hve, prior to eing
ppointed, een considered to e independent of
olvo’s lrgest shreholder in terms of votes. his
conclusion is sed on the fcts tht enult
s..s. is olvo’s lrgest shreholder in terms of
votes nd tht Jen-bptiste uzn represents
enult s..s. in the lection ommittee.
Audit Committeen ecemer 2002, the bord estlished n
audit ommittee primrily for the purpose of over-
seeing the ccounting nd nncil reporting proc-
esses nd the udit of the nncil sttements.
he audit ommittee is responsile for pre-
pring the bord’s work to ssure the qulity of
the Group’s nncil reporting y reviewing the
interim reports, the annul eport nd consoli-
dted ccounting. n ddition, the audit om-
mittee’s tsk is to estlish guidelines specifying
wht other services, eyond uditing, the com-
pny my procure from the compny’s uditors
nd to provide guidelines for trnsctions withcompnies nd persons closely ssocited with
olvo. he audit ommittee lso hs the tsk of
reviewing nd overseeing the imprtility nd
independence of the compny’s uditor. he
audit ommittee is lso responsile for evlu-
ting the internl nd externl uditors’ work,
providing the lection ommittee with the
results of the evlution of the externl uditors
nd to ssist in prepring proposls for the
election of uditors. Finlly, the audit ommittee
shll evlute the qulity, relevnce nd efciency
of the Group’s system for internl control over
nncil reporting, nd with respect to theinternl udit nd risk mngement.
at the sttutory bord meeting following the
2011 annul Generl eeting, rs Westererg,
Peter bijur nd Jen-bptiste uzn were
ppointed memers of the audit ommittee.
rs Westererg ws ppointed hirmn of
the audit ommittee.
he audit ommittee met with the externl
uditors nd Hed of nternl audit t the meet-
ings of the audit ommittee. he audit om-
mittee hs lso met seprtely with the externl
uditors nd the Hed of nternl audit without
the presence of the compny mngement. he
audit ommittee nd the externl uditors
hve, mong other tsks, discussed the externl
udit pln nd risk mngement. he audit
ommittee held eight meetings during 2011.
emuneration Committee
n april 2003, the bord estlished emu-
nertion ommittee for the purpose of prepring
nd deciding on issues relting to remunertion
to senior executives in the Group. he duties of
the ommittee include presenting recommen-
dtions for resolution y the bord regrdingthe terms nd conditions of employment nd
remunertion for the President of ab olvo,
principles for remunertion, including pensions
nd severnce pyments, for other memers of
the Group xecutive em, nd principles for
vrile slry systems, shre-sed incentive
progrms, pensions nd severnce pyment for
other senior executives in the Group. n ddition,
the emunertion ommittee shll pprove pro-
posls on remunertion of the other memers of
the Group xecutive em in ccordnce with
the principles estlished y the bord.
he emunertion ommittee shll monitornd evlute ongoing progrms nd progrms
concluded during the yer covering vrile
remunertion for the Group xecutive em,
ppliction of the guidelines for remunertion
to senior executives on which the annul Generl
eeting shll resolve nd the current remuner-
tion structures nd levels in the Group. he
bord shll, not lter thn two weeks prior to
the annul Generl eeting, sumit report on
the results of the emunertion ommittee’s
evlution on the compny’s wesite.
1

7/29/2019 MBA VTU Project on VOLVO Group in India
http://slidepdf.com/reader/full/mba-vtu-project-on-volvo-group-in-india 162/166
f the emunertion ommittee commissions
externl suppliers for its work, it must ensuretht there re no conicts of interest in reltion
to other ssignments this supplier my hve for
the Group or the Group xecutive em.
at the sttutory meeting of the bord follow-
ing the 2011 annul Generl eeting, ouis
Schweitzer, anders yrén nd ing eh were
ppointed memers of the emunertion om-
mittee. ouis Schweitzer ws nmed hirmn
of the emunertion ommittee. he emuner-
tion ommittee held four meetings dur ing 2011.
Group xecutive eam
an ccount of their respective ge, principl
eduction, bord memerships, their own nd
relted prties’ ownership of shres in olvo s
of Ferury 23, 2012, nd yer of joining olvo
for the nd ech memer of the Group
xecutive em is presented in the Group n-
gement section on pge 151.
xternal auditing
olvo’s uditors re elected y the annul Generl
eeting. he current uditor is Pricewter-
houseoopers ab (Pw), which ws elected t
the 2010 annul Generl eeting for periodof four yers. Görn idström nd John ippe
from Pw, re responsile for the udit of olvo.
Görn idström is the auditor in hrge. Görn
idström hs nnounced tht he will resign s
auditor in hrge t the annul Generl eeting
2012. He will e replced y Peter lemedtson,
prtner of Pw.
he externl uditors discuss the externl
udit pln nd risk mngement with the audit
ommittee. he uditors review the interim
report for the period Jnury 1 to June 30 nd
the annul eport nd the consolidted
ccounting. he uditors lso express n opinionwhether this orporte Governnce eport ws
prepred or not nd in such respect whether
certin informtion therein coincides with the
annul eport nd consolidted ccounting. he
uditors’ report their ndings with regrd to the
nnul report, consolidted ccounting nd the
orporte Governnce eport through the udit
reports nd seprte opinion regrding the
orporte Governnce eport, which they
present to the annul Generl eeting. n ddi-
tion, the uditors’ report detiled ndings from
their reviews to the audit ommittee twice yer
nd once yer to the full bord of irectors.When Pw is retined to provide services
other thn the udit, it is done in ccordnce with
rules decided y the audit ommittee pertining
to pre-pprovl of the nture of the services nd
the fees.
Disclosure Committee
a isclosure ommittee ws estlished in
2004. he ommittee contriutes to ensuring
tht olvo fullls its oligtions ccording to
pplicle legisltion s well s to listing rules
to timely disclose to the nncil mrket ll
shre price sensitive informtion.
he ommittee comprises the heds of the
deprtments orporte Finnce, nternl audit,
nvestor eltions, orporte egl, business
ontrol nd Finncil eporting. hirmn of
the isclosure ommittee is the xecutive ice
President responsile for orporte ommuni-
ction.
utstanding share and share-price
related incentive programs
an ccount of outstnding shre nd shre-
price relted incentive progrms is provided inote 27 Personnel in the Group’s notes.
eport on the key aspects o the compa-
ny’s and Group’s system or internal con-
trols and risk management in conjunction
with nancial reporting
he bord is responsile for the internl con-
trols ccording to the Swedish ompnies act
nd the ode. he purpose of this report is to
provide shreholders nd other interested prties
n understnding of how internl control is
orgnized t olvo with regrd to nncil
reporting. he report hs een prepred inccordnce with the annul accounts act.
onsequently the report is limited to internl
control over nncil reporting.
Introduction
olvo primrily pplies internl control princi-
ples introduced y the ommittee of Sponsoring
rgniztions of the redwy ommission
(S). he S principles consist of ve
interrelted components. he components re:
control environment, risk ssessment, control
ctivities, informtion nd communiction nd
follow-up.olvo hs specic function for internl control.
he ojective of the nternl ontrol function is
to provide support for mngement groups
within usiness res nd Group functions, tht
llows them to continuously provide solid nd
improved internl controls relting to nncil
reporting. Work tht is conducted through this
function is sed primrily on methodology,
which im is to ensure complince with direc-
tives nd policies, s well s to crete good
conditions for specic control ctivities in key
processes relted to nncil reporting. he
audit ommittee is informed of the result of the
work performed y the nternl ontrol function
within olvo with regrd to risks, control ctivities
nd follow-up on the nncil reporting.
olvo lso hs n nternl audit function with
the primry tsk of independently monitoring
tht compnies in the Group follow the principles
nd rules tht re stted in the Group’s direc-
tives, policies nd instructions for nncil
reporting. he hed of the nternl audit function
reports directly to the , nd in the new
orgniztion to the Group’s Generl ounsel
nd the bord’s audit ommittee.
Control environment
Fundmentl to olvo’s control environment is
the usiness culture tht is estlished within
the Group nd in which mngers nd employees
operte. olvo works ctively on communic-
tions nd trining regrding the compny’s sic
vlues s descried in he olvo Wy, n internl
document concerning olvo’s usiness culture,
nd the Group’s ode of onduct, to ensure
tht good morls, ethics nd integrity permete
the orgniztion.
he foundtion of the internl control pro-cess relting to the nncil reporting is uilt
up round the Group’s directives, policies nd
instructions, s well s the responsiility nd
uthority structure tht hs een dpted to the
Group’s orgniztion to crete nd mintin
stisfctory control environment. he pr inciples
for internl controls nd directives nd policies
for the nncil reporting re contined in olvo
Finncil Policies & Procedures (FPP), n internl
document comprising ll importnt instructions,
rules nd principles.
Pa Ga P 2011
158

7/29/2019 MBA VTU Project on VOLVO Group in India
http://slidepdf.com/reader/full/mba-vtu-project-on-volvo-group-in-india 163/166
Risk assessment
Risks relating to nancial reporting are evaluatedand monitored by the Board through the Audit
Committee inter alia through identifying what
types of risks that t ypically could be considered
as material and where they would typically
occur. The annual evaluation of internal control
activities conducted by the Internal Control and
Internal Audit functions, are based on a risk-
based model. The evaluation of the risk that
errors will appear in the nancial reporting is
based on a number of criteria. Complex
accounting principles can, for example, mean
that the nancial reporting risks being inaccu-
rate for those posts that are covered by such
principles. Valuation of a particular asset or lia-
bility according to various evaluation criteria
can also constitute a risk. The same is true for
complex and/or changing business circum-
stances.
Control activities
In addition to the Board of AB Volvo and its
Audit Committee, the management groups and
other decision-making bodies in the business
areas, Group functions and Group companies
constitute the overall supervisory body.Several control activities are applied in the
ongoing business processes to ensure that
potential errors or deviations in the nancial
reporting are prevented, discovered and cor-
rected. Control activities range from review of
outcome results in management group meet-
ings to specic reconciliation of accounts and
analysis of the ongoing processes for nancial
reporting. Responsibility for ensuring that control
activities in the nancial processes are appro-
priate and in accordance with the Group’s policies
and instructions are compiled in the Group’s
shared service center. Within the framework forthe nancial reporting, they are also responsible
for ensuring that authority structures are
designed so that one person cannot perform an
activity and then perform the control of the
same activity. Control activities within IT security
and maintenance are a key part of Volvo’s internal
control over nancial reporting.
Information and communication
Policies and instructions relating to the nancial
reporting are updated and communicated on a
regular basis from management to all affected
employees. In addition, there are a number of
committees and networks within Volvo that
serve as forums for information and discussionsregarding issues relating to the nancial reporting
and application of internal rules. Included in
these committees and networks are represent-
atives from the business areas and the Group’s
staff units who are responsible for nancial
reporting. Work in these committees and net-
works is aimed, among other things, at ensuring
a uniform application of the Group’s policies,
principles and instructions for the nancial
reporting and at identifying and communicating
shortcomings and areas of improvement in the
processes for nancial reporting.
Follow-up
Ongoing responsibility for follow-up rests with
the business areas’ management groups and
accounting and controller functions. In addition,
the Internal Audit and the Internal Control func-
tions conduct review and follow-up activities in
accordance with what is described in the intro-
duction of this report. More specically, the
Internal Control function runs and coordinates
evaluation activities through the “Volvo Group
Internal Control program”, which gives a sys-
tematic way of evaluating the quality and effec-tiveness of the internal control over nancial
reporting on a yearly basis. A yearly evaluation
plan is settled and presented to the Audit Com-
mittee. This evaluation program comprises three
main areas:
1. Control policies and guidelines:Self-assessment
procedure carried out by management teams
at business area and Group function levels as
well as local company level. Main areas eval-
uated are the adherence to the Group’s
nancial directives and policies found in FPP
along with The Volvo Way and the Group’sCode of Conduct.
2. Process controls at transaction levels: Pro-
cesses related to the nancial reporting are
evaluated by testing of specic routines and
controls based upon the Group’s framework
for internal control over nancial reporting,
VICS – “Volvo Internal Control Standards”.
The framework focus on the nancial reporting
areas deemed to have a relatively higher risk
for potential errors because e.g. complex
accounting principles, complex or changed
business operations etc.
3. General IT controls: Processes for main-
tenance, development and access manage-ment of nancial applications are evaluated
by testing of routines and controls.
The results of the evaluation activities are
reported to the Group management and the
Audit Committee.
Göteborg, February 23, 2012
AB Volvo (publ)
Board of Directors
Auditor’s report on the Corporate
Governance Report
To the annual meeting of the shareholders in AB
Volvo, corporate identity number 556012-5790
It is the Board of Directors who is responsible
for the Corporate Governance Report for the
year 2011 on pages 150–159 and that it has
been prepared in accordance with the Annual
Accounts Act.
We have read the Corporate GovernanceReport and based on that reading and our
knowledge of the company and the group we
believe that we have a sufcient basis for our
opinions. This means that our statutory exami-
nation of the Corporate Governance Report is
different and substantially less in scope than an
audit conducted in accordance with Interna-
tional Standards on Auditing and generally
accepted auditing standards in Sweden.
In our opinion, the Corporate Governance
Report has been prepared and its statutory
content is consistent with the annual accounts
and the consolidated accounts
Göteborg, February 23, 2012
PricewaterhouseCoopers AB
Göran TidströmAuthorized Public
AccountantLead Auditor
Johan RippeAuthorized Public
Accountant
7/29/2019 MBA VTU Project on VOLVO Group in India
http://slidepdf.com/reader/full/mba-vtu-project-on-volvo-group-in-india 164/166
Defnitions
Basic earnings per shareIncome for the period attributable to shareholders of the ParentCompany divided by the weighted average number of shares out-standing during the period.
Capital expenditures
Capital expenditures include investments in property, plant andequipment, intangible assets and assets under operating leases.Investments in xed assets included in the Group’s cash-owstatement include only capital expenditures that have reduced theGroup’s liquid funds during the year.
Cash-fow
Combined changes in the Group’s liquid funds during the scal
year. Changes in liquid funds are specied with reference tochanges in operations, operating activities, changes depending oninvestments in equipment, xed assets etc. and nancing activitiessuch as changes in loans and investments.
Diluted earnings per share
Diluted earnings per share is calculated as income for the periodattributable to the Parent Company’s shareholders divided by theaverage number of shares outstanding plus the average number ofshares that would be issued as an effect of ongoing share-basedincentive programs and employee stock option programs.
EBITDA
EBITDA is the operating income before depreciation and amortiza-
tion of tangible and intangible assets. This key gure is calculatedby adding back depreciation and amortization on the operatingincome of the Industrial operations.
Equity ratio
Shareholders’ equity divided by total assets.
Interest coverageOperating income plus interest income and similar credits dividedby interest expense and similar charges.
Joint ventures
Companies over which the Company has joint control together withone or more external parties.
Net nancial position
Cash and cash equivalents, marketable securities and interest-bearing short- and long-term receivables reduced by short- andlong-term interest-bearing liabilities and provisions for post-employment benets.
Operating marginOperating income divided by net sales.
Penetration rate
Share of unit sales nanced by Volvo Financial Services in relationto total number units sold by the Volvo Group in markets wherenancial services are offered.
Return on shareholders’ equity
Income for the period divided by average shareholders’ equity.
Sel-nancing ratio
Cash-ow from operating activities (see Cash-ow statement)divided by net investments in xed assets and leasing assets as
dened in the cash-ow statement.
7/29/2019 MBA VTU Project on VOLVO Group in India
http://slidepdf.com/reader/full/mba-vtu-project-on-volvo-group-in-india 165/166
Annual General Meeting, April 4, 2012
The Annual General Meeting of AB Volvo will be held in Göteborgin Lisebergshallen (entrance from Örgrytevägen) Wednesday,April 4, 2012, at 3:00 p.m. Doors to meeting hall open at 1.30 p.m.
Notice
Those who wish to participate must be recorded as shareholdersin the share register maintained by Euroclear Sweden AB onMarch 29, 2012 and give notice of intention to attend, not laterthan March 29, 2012, preferably before 12:00:• by telephone, +46 8 402 90 76, beginning February 29, 2012• by mail addressed to AB Volvo (publ), ”AGM”,
P.O. Box 7481, SE-103 98 Stockholm, Sweden• on AB Volvo’s website www.volvogroup.com
When giving notice, shareholders should state their:• name• personal registration number (corporate registration number)• address and telephone number• name and personal number (registration number) of the proxy, if any• name(s) of any accompanying assistant(s)
Shareholders who have trustee-registered shares should, in goodtime prior to March 29, 2012, request owner-registration, whichcould be temporary, at the bank or broker holding the shares.
Volvo’s Election Committee
The following persons are members of Volvo’s Election Committee:
Carl-Olof By Chairman of the Election Committee,AB Industrivärden
Jean-Baptiste Duzan Renault s.a.s.Lars Förberg Violet Partner LPHåkan Sandberg Handelsbanken SHB Pension Fund,
SHB Pensionskassa, SHB EmployeeFund and Oktogonen
Louis Schweitzer Chairman of the AB Volvo Board
Among other duties, the Election Committee is responsible forsubmitting to the Annual General Meeting proposals for candi-dates to serve as members of the Board of Directors and Chairman
of the Board and proposal for auditors if applicable. The Commit teealso proposes the amount of the fees to be paid to the holders ofthese positions.
Preliminary publication datesRepor t for the rst three months 2012 April 26 , 2012Report for the rst six months 2012 July 24, 2012Report for the rst nine months 2012 October 24, 2012Report on 2012 operations February, 2013Annual Report 2012 March, 2013
The reports are available on www.volvogroup.com on date of publi-cation and are also sent electronically to shareholders who haveadvised Volvo that they wish to receive nancial information.
Historical and current time series reecting the Volvo Group’smarket information and share data are published regularly on
www.volvogroup.com.
Contacts
Investor Relations:
Christer Johansson +46 31-66 13 34Patrik Stenberg +46 31-66 13 36Anders Christensson +46 31-66 11 91John Hartwell +1 212 418 7432
Aktiebolaget Volvo (publ) 556012-5790Investor Relations, VHK SE-405 08 GöteborgSwedenTel +46 31 66 00 00Fax +46 31 53 72 96E-mail: [email protected]

7/29/2019 MBA VTU Project on VOLVO Group in India
http://slidepdf.com/reader/full/mba-vtu-project-on-volvo-group-in-india 166/166
DiscoVer The worlD of The VolVo Group