MBA 3rd Sem- TQM
196
Elective TOTAL QUALITY MANAGEMENT Master of Business Administration – MBA Semester 3rd core MB0050 Research Methodology - 4 Credits ASSIGNMENT SET-1 Q 1. Give examples of specific situations that would call for the following types of research, explaining why – a) Exploratory research b) Descriptive research c) Diagnostic research d) Evaluation research. Ans.: Research may be classified crudely according to its major intent or the methods. According to the intent, research may be classified as: Basic (aka fundamental or pure) research is driven by a scientist's curiosity or interest in a scientific question. The main motivation is to expand man's knowledge, not to create or invent something. There is no obvious commercial value to the discoveries that result from basic research. For example, basic science investigations probe for answers to questions such as: How did the universe begin? What are protons, neutrons, and electrons composed of? How do slime molds reproduce? What is the specific genetic code of the fruit fly? Most scientists believe that a basic, fundamental understanding of all branches of science is needed in order for progress to take place. In other words, basic research lays down the foundation for the applied science that follows. If basic work is done first, then applied spin- offs often eventually result from this research. As Dr. George Smoot of LBNL says, "People cannot foresee the future well enough to predict what's going to develop from basic research. If we only did applied research, we would still be making better spears." Applied research is designed to solve practical problems of the modern world, rather than to acquire knowledge for knowledge's sake. One might say that the goal of the applied scientist is to improve the human condition. For example, applied researchers may investigate ways to: Improve agricultural crop production
-
Upload
charan-subramanyam -
Category
Documents
-
view
136 -
download
1
Transcript of MBA 3rd Sem- TQM
Elective TOTAL QUALITY MANAGEMENT
Master of Business Administration – MBA Semester 3rd core MB0050 Research Methodology - 4 Credits
ASSIGNMENT SET-1
Q 1. Give examples of specific situations that would call for the following types of research, explaining why – a) Exploratory research b) Descriptive research c) Diagnostic research d) Evaluation research.
Ans.: Research may be classified crudely according to its major intent or the methods. According to the intent, research may be classified as:Basic (aka fundamental or pure) research is driven by a scientist's curiosity or interest in a scientific question. The main motivation is to expand man's knowledge, not to create or invent something. There is no obvious commercial value to the discoveries that result from basic research.
For example, basic science investigations probe for answers to questions such as: How did the universe begin?
What are protons, neutrons, and electrons composed of?
How do slime molds reproduce?
What is the specific genetic code of the fruit fly?
Most scientists believe that a basic, fundamental understanding of all branches of science is needed in order for progress to take place. In other words, basic research lays down the foundation for the applied science that follows. If basic work is done first, then applied spin-offs often eventually result from this research. As Dr. George Smoot of LBNL says, "People cannot foresee the future well enough to predict what's going to develop from basic research. If we only did applied research, we would still be making better spears."
Applied research is designed to solve practical problems of the modern world, rather than to acquire knowledge for knowledge's sake. One might say that the goal of the applied scientist is to improve the human condition.
For example, applied researchers may investigate ways to: Improve agricultural crop production
Treat or cure a specific disease
Improve the energy efficiency of homes, offices, or modes of transportation
Some scientists feel that the time has come for a shift in emphasis away from purely basic research and toward applied science. This trend, they feel, is necessitated by the problems resulting from global overpopulation, pollution, and the overuse of the earth's natural resources.Exploratory research provides insights into and comprehension of an issue or situation. It should draw definitive conclusions only with extreme caution. Exploratory research is a type of research conducted because a problem has not been clearly defined. Exploratory research helps determine the best research design, data collection method and selection of subjects. Given its fundamental nature, exploratory research often concludes that a perceived problem does not actually exist.
Exploratory research often relies on secondary research such as reviewing available literature and/or data, or qualitative approaches such as informal discussions with consumers, employees, management or competitors, and more formal approaches through in-depth interviews, focus groups, projective methods, case studies or pilot studies. The Internet allows for research methods that are more interactive in nature: E.g., RSS feeds efficiently supply researchers with up-to-date information; major search engine search results may be sent by email to researchers by services such as Google Alerts; comprehensive search results are tracked over lengthy periods of time by services such as Google Trends; and Web sites may be created to attract worldwide feedback on any subject.The results of exploratory research are not usually useful for decision-making by themselves, but they can provide significant insight into a given situation. Although the results of qualitative research can give some indication as to the "why", "how" and "when" something occurs, it cannot tell us "how often" or "how many."Exploratory research is not typically generalizable to the population at large.A defining characteristic of causal research is the random assignment of participants to the conditions of the experiment; e.g., an Experimental and a Control Condition... Such assignment results in the groups being comparable at the beginning of the experiment. Any difference between the groups at the end of the experiment is attributable to the manipulated variable. Observational research typically looks for difference among "in-tact" defined groups. A common example compares smokers and non-smokers with regard to health problems. Causal conclusions can't be drawn from such a study because of other possible differences between the groups; e.g., smokers may drink more alcohol than non-smokers. Other unknown differences could exist as well. Hence, we may see a relation between smoking and health but a conclusion that smoking is a cause would not be warranted in this situation. (Cp)Descriptive research, also known as statistical research, describes data and characteristics about the population or phenomenon being studied. Descriptive research answers the questions who, what, where, when and how.Although the data description is factual, accurate and systematic, the research cannot describe what caused a situation. Thus, descriptive research cannot be used to create a causal relationship, where one variable affects another. In other words, descriptive research can be said to have a low requirement for internal validity.The description is used for frequencies, averages and other statistical calculations. Often the best approach, prior to writing descriptive research, is to conduct a survey investigation. Qualitative research often has the aim of description and researchers may follow-up with examinations of why the observations exist and what the implications of the findings are.In short descriptive research deals with everything that can be counted and studied. But there are always restrictions to that. Your research must have an impact to the life of the people around you. For example, finding the most frequent disease that affects the children of a town. The reader of the research will know what to do to prevent that disease thus; more people will live a healthy life.Diagnostic study: it is similar to descriptive study but with different focus. It is directed towards discovering what is happening and what can be done about. It aims at identifying the causes of a problem and the possible solutions for it. It may also be concerned with discovering and testing whether certain variables are associated. This type of research requires prior knowledge of the problem, its thorough formulation, clear-cut definition of the given population, adequate methods for collecting accurate information, precise measurement of variables, statistical analysis and test of significance. Evaluation Studies: it is a type of applied research. It is made for assessing the effectiveness of social or economic programmes implemented or for assessing the impact of development of the project area. It is thus directed to assess or appraise the quality and quantity of an activity and its performance and to specify its attributes and conditions required for its success. It is concerned with causal relationships and is more actively guided by hypothesis. It is concerned also with change over time. Action research is a reflective process of progressive problem solving led by individuals working with others in teams or as part of a "community of practice" to improve the way they address issues and solve problems. Action research can also be undertaken by larger organizations or
institutions, assisted or guided by professional researchers, with the aim of improving their strategies, practices, and knowledge of the environments within which they practice. As designers and stakeholders, researchers work with others to propose a new course of action to help their community improve its work practices (Center for Collaborative Action Research). Kurt Lewin, then a professor at MIT, first coined the term “action research” in about 1944, and it appears in his 1946 paper “Action Research and Minority Problems”. In that paper, he described action research as “a comparative research on the conditions and effects of various forms of social action and research leading to social action” that uses “a spiral of steps, each of which is composed of a circle of planning, action, and fact-finding about the result of the action”.Action research is an interactive inquiry process that balances problem solving actions implemented in a collaborative context with data-driven collaborative analysis or research to understand underlying causes enabling future predictions about personal and organizational change (Reason & Bradbury, 2001). After six decades of action research development, many methodologies have evolved that adjust the balance to focus more on the actions taken or more on the research that results from the reflective understanding of the actions. This tension exists between
● those that are more driven by the researcher’s agenda to those more driven by
participants;
Those that are motivated primarily by instrumental goal attainment to those motivated primarily by the aim of personal, organizational, or societal transformation; and 1st-, to 2nd-, to 3rd-person research, that is, my research on my own action, aimed primarily at personal change; our research on our group (family/team), aimed primarily at improving the group; and ‘scholarly’ research aimed primarily at theoretical generalization and/or large scale change.
Action research challenges traditional social science, by moving beyond reflective knowledge created by outside experts sampling variables to an active moment-to-moment theorizing, data collecting, and inquiring occurring in the midst of emergent structure. “Knowledge is always gained through action and for action. From this starting point, to question the validity of social knowledge is to question, not how to develop a reflective science about action, but how to develop genuinely well-informed action — how to conduct an action science” (Tolbert 2001).
Q 2.In the context of hypothesis testing, briefly explain the difference between a) Null and alternative hypothesis b) Type 1 and type 2 error c) Two tailed and one tailed test d) Parametric and non-parametric tests.
Ans.: Some basic concepts in the context of testing of hypotheses are explained below - 1) Null Hypotheses and Alternative Hypotheses: In the context of statistical analysis,
we often talk about null and alternative hypotheses. If we are to compare the superiority of method A with that of method B and we proceed on the assumption that both methods are equally good, then this assumption is termed as a null hypothesis. On the other hand, if we think that method A is superior, then it is known as an alternative hypothesis.
These are symbolically represented as: Null hypothesis = H0 and Alternative hypothesis = Ha Suppose we want to test the hypothesis that the population mean is equal to the hypothesized mean (µ H0) = 100. Then we would say that the null hypothesis is that the population mean is equal to the hypothesized mean 100 and symbolically we can express it as: H0: µ= µ H0=100 If our sample results do not support this null hypothesis, we should conclude that something else is true. What we conclude rejecting the null hypothesis is known as an alternative hypothesis. If we accept H0, then we are rejecting Ha and if we reject H0, then we are accepting Ha. For H0: µ= µ H0=100, we may consider three possible alternative hypotheses as follows:
Alternative Hypotheses
To be read as follows
Ha: µ≠µ H0 (The alternative hypothesis is that the population mean is not equal to 100 i.e., it may be more or less 100)
Ha: µ>µ H0 (The alternative hypothesis is that the population mean is greater than 100)
Ha: µ< µ H0 (The alternative hypothesis is that the population mean is less than 100)
The null hypotheses and the alternative hypotheses are chosen before the sample is drawn (the researcher must avoid the error of deriving hypotheses from the data he collects and testing the hypotheses from the same data). In the choice of null hypothesis, the following considerations are usually kept in view:
a. The alternative hypothesis is usually the one, which is to be proved, and the null hypothesis is the one that is to be disproved. Thus a null hypothesis represents the hypothesis we are trying to reject, while the alternative hypothesis represents all other possibilities.
b. If the rejection of a certain hypothesis when it is actually true involves great risk, it is taken as null hypothesis, because then the probability of rejecting it when it is true is α (the level of significance) which is chosen very small.
c. The null hypothesis should always be a specific hypothesis i.e., it should not state an approximate value.
Generally, in hypothesis testing, we proceed on the basis of the null hypothesis, keeping the alternative hypothesis in view. Why so? The answer is that on the assumption that the null hypothesis is true, one can assign the probabilities to different possible sample results, but this cannot be done if we proceed with alternative hypotheses. Hence the use of null hypotheses (at times also known as statistical hypotheses) is quite frequent.
2) The Level of Significance: This is a very important concept in the context of hypothesis testing. It is always some percentage (usually 5%), which should be chosen with great care, thought and reason. In case we take the significance level at 5%, then this implies that H0 will be rejected when the sampling result (i.e., observed evidence) has a less than 0.05 probability of occurring if H0 is true. In other words, the 5% level of significance means that the researcher is willing to take as much as 5% risk rejecting the null hypothesis when it (H0) happens to be true. Thus the significance level is the maximum value of the probability of rejecting H0 when it is true and is usually determined in advance before testing the hypothesis.
3) Decision Rule or Test of Hypotheses: Given a hypothesis Ha and an alternative hypothesis H0, we make a rule, which is known as a decision rule, according to which we accept H0 (i.e., reject Ha) or reject H0 (i.e., accept Ha). For instance, if H0 is that a certain lot is good (there are very few defective items in it), against Ha, that the lot is not good (there are many defective items in it), then we must decide the number of items to be tested and the criterion for accepting or rejecting the hypothesis. We might test 10 items in the lot and plan our decision saying that if there are none or only 1 defective item among the 10, we will accept H0; otherwise we will reject H0 (or accept Ha). This sort of basis is known as a decision rule.
4) Type I & II Errors: In the context of testing of hypotheses, there are basically two types of errors that we can make. We may reject H0 when H0 is true and we may accept H0 when it is not true. The former is known as Type I and the latter is known as Type II. In other words, Type I error means rejection of hypotheses, which should have been accepted, and Type II error means accepting of
hypotheses, which should have been rejected. Type I error is denoted by α (alpha), also called as level of significance of test; and Type II error is denoted by β(beta).
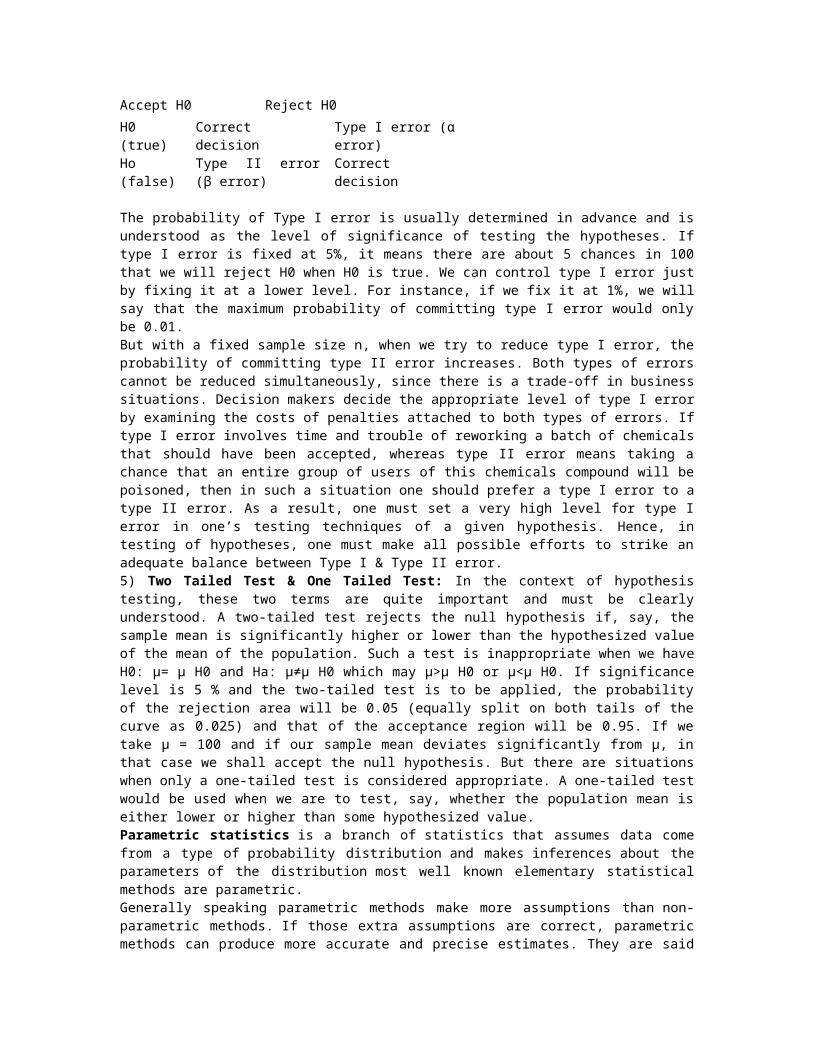
Decision
Accept H0 Reject H0
H0 (true) Correct decision Type I error (α error)
Ho (false) Type II error (β error) Correct decision
The probability of Type I error is usually determined in advance and is understood as the level of significance of testing the hypotheses. If type I error is fixed at 5%, it means there are about 5 chances in 100 that we will reject H0 when H0 is true. We can control type I error just by fixing it at a lower level. For instance, if we fix it at 1%, we will say that the maximum probability of committing type I error would only be 0.01. But with a fixed sample size n, when we try to reduce type I error, the probability of committing type II error increases. Both types of errors cannot be reduced simultaneously, since there is a trade-off in business situations. Decision makers decide the appropriate level of type I error by examining the costs of penalties attached to both types of errors. If type I error involves time and trouble of reworking a batch of chemicals that should have been accepted, whereas type II error means taking a chance that an entire group of users of this chemicals compound will be poisoned, then in such a situation one should prefer a type I error to a type II error. As a result, one must set a very high level for type I error in one’s testing techniques of a given hypothesis. Hence, in testing of hypotheses, one must make all possible efforts to strike an adequate balance between Type I & Type II error. 5) Two Tailed Test & One Tailed Test: In the context of hypothesis testing, these two terms are quite important and must be clearly understood. A two-tailed test rejects the null hypothesis if, say, the sample mean is significantly higher or lower than the hypothesized value of the mean of the population. Such a test is inappropriate when we have H0: µ= µ H0 and Ha: µ≠µ H0 which may µ>µ H0 or µ<µ H0. If significance level is 5 % and the two-tailed test is to be applied, the probability of the rejection area will be 0.05 (equally split on both tails of the curve as 0.025) and that of the acceptance region will be 0.95. If we take µ = 100 and if our sample mean deviates significantly from µ, in that case we shall accept the null hypothesis. But there are situations when only a one-tailed test is considered appropriate. A one-tailed test would be used when we are to test, say, whether the population mean is either lower or higher than some hypothesized value. Parametric statistics is a branch of statistics that assumes data come from a type of probability distribution and makes inferences about the parameters of the distribution most well known elementary statistical methods are parametric. Generally speaking parametric methods make more assumptions than non-parametric methods. If those extra assumptions are correct, parametric methods can produce more accurate and precise estimates. They are said to have more statistical power. However, if those assumptions are incorrect, parametric methods can be very misleading. For that reason they are often not considered robust. On the other hand, parametric formulae are often simpler to write down and faster to compute. In some, but definitely not all cases, their simplicity makes up for their non-robustness, especially if care is taken to examine diagnostic statistics. Because parametric statistics require a probability distribution, they are not distribution-free. Non-parametric models differ from parametric models in that the model structure is not specified a priori but is instead determined from data. The term nonparametric is not meant to imply that such models completely lack parameters but that the number and nature of the parameters are flexible and not fixed in advance.Kernel density estimation provides better estimates of the density than histograms.Nonparametric regression and semi parametric regression methods have been developed based on kernels, splines, and wavelets.
Data Envelopment Analysis provides efficiency coefficients similar to those obtained by Multivariate Analysis without any distributional assumption.
Q 3. Explain the difference between a causal relationship and correlation, with an example of each. What are the possible reasons for a correlation between two variables?
Ans.: Correlation: The correlation is knowing what the consumer wants, and providing it. Marketing research looks at trends in sales and studies all of the variables, i.e. price, color, availability, and styles, and the best way to give the customer what he or she wants. If you can give the customer what they want, they will buy, and let friends and family know where they got it. Making them happy makes the money.
Casual relationship Marketing was first defined as a form of marketing developed from direct response marketing campaigns, which emphasizes customer retention and satisfaction, rather than a dominant focus on sales transactions.
As a practice, Relationship Marketing differs from other forms of marketing in that it recognizes the long term value of customer relationships and extends communication beyond intrusive advertising and sales promotional messages.
With the growth of the internet and mobile platforms, Relationship Marketing has continued to evolve and move forward as technology opens more collaborative and social communication channels. This includes tools for managing relationships with customers that goes beyond simple demographic and customer service data. Relationship Marketing extends to include Inbound Marketing efforts (a combination of search optimization and Strategic Content), PR, Social Media and Application Development.
Just like Customer relationship management(CRM), Relationship Marketing is a broadly recognized, widely-implemented strategy for managing and nurturing a company’s interactions with clients and sales prospects. It also involves using technology to, organize, synchronize business processes (principally sales and marketing activities) and most importantly, automate those marketing and communication activities on concrete marketing sequences that could run in autopilot (also known as marketing sequences). The overall goals are to find, attract, and win new clients, nurture and retain those the company already has, entice former clients back into the fold, and reduce the costs of marketing and client service. [1] Once simply a label for a category of software tools, today, it generally denotes a company-wide business strategy embracing all client-facing departments and even beyond. When an implementation is effective, people, processes, and technology work in synergy to increase profitability, and reduce operational costs
Reasons for a correlation between two variables: Chance association, (the relationship is due to chance) or causative association (one variable causes the other).The information given by a correlation coefficient is not enough to define the dependence structure between random variables. The correlation coefficient completely defines the dependence structure only in very particular cases, for example when the distribution is a multivariate normal distribution. (See diagram above.) In the case of elliptic distributions it characterizes the (hyper-)ellipses of equal density, however, it does not completely characterize the dependence structure (for example, a multivariate t-distribution's degrees of freedom determine the level of tail dependence).
Distance correlation and Brownian covariance / Brownian correlation [8][9] were introduced to address the deficiency of Pearson's correlation that it can be zero for dependent random variables; zero distance correlation and zero Brownian correlation imply independence.
The correlation ratio is able to detect almost any functional dependency, or the entropy-based mutual information/total correlation which is capable of detecting even more general dependencies. The latter are sometimes referred to as multi-moment correlation measures, in comparison to those that consider only 2nd moment (pairwise or quadratic) dependence.
The polychoric correlation is another correlation applied to ordinal data that aims to estimate the correlation between theorised latent variables.
One way to capture a more complete view of dependence structure is to consider a copula between them.
Q 4. Briefly explain any two factors that affect the choice of a sampling technique. What are the characteristics of a good sample?
Ans.: The difference between non-probability and probability sampling is that non-probability sampling does not involve random selection and probability sampling does. Does that mean that non-probability samples aren't representative of the population? Not necessarily. But it does mean that non-probability samples cannot depend upon the rationale of probability theory. At least with a probabilistic sample, we know the odds or probability that we have represented the population well. We are able to estimate confidence intervals for the statistic. With non-probability samples, we may or may not represent the population well, and it will often be hard for us to know how well we've done so. In general, researchers prefer probabilistic or random sampling methods over non probabilistic ones, and consider them to be more accurate and rigorous. However, in applied social research there may be circumstances where it is not feasible, practical or theoretically sensible to do random sampling. Here, we consider a wide range of non-probabilistic alternatives.
We can divide non-probability sampling methods into two broad types: Accidental or purposive.
Most sampling methods are purposive in nature because we usually approach the sampling problem with a specific plan in mind. The most important distinctions among these types of sampling methods are the ones between the different types of purposive sampling approaches.
Accidental, Haphazard or Convenience Sampling
One of the most common methods of sampling goes under the various titles listed here. I would include in this category the traditional "man on the street" (of course, now it's probably the "person on the street") interviews conducted frequently by television news programs to get a quick (although non representative) reading of public opinion. I would also argue that the typical use of college students in much psychological research is primarily a matter of convenience. (You don't really believe that psychologists use college students because they believe they're representative of the population at large, do you?). In clinical practice, we might use clients who are available to us as our sample. In many research contexts, we sample simply by asking for volunteers. Clearly, the problem with all of these types of samples is that we have no evidence that they are representative of the populations we're interested in generalizing to -- and in many cases we would clearly suspect that they are not.
Purposive Sampling
In purposive sampling, we sample with a purpose in mind. We usually would have one or more specific predefined groups we are seeking. For instance, have you ever run into people in a
mall or on the street who are carrying a clipboard and who are stopping various people and asking if they could interview them? Most likely they are conducting a purposive sample (and most likely they are engaged in market research). They might be looking for Caucasian females between 30-40 years old. They size up the people passing by and anyone who looks to be in that category they stop to ask if they will participate. One of the first things they're likely to do is verify that the respondent does in fact meet the criteria for being in the sample. Purposive sampling can be very useful for situations where you need to reach a targeted sample quickly and where sampling for proportionality is not the primary concern. With a purposive sample, you are likely to get the opinions of your target population, but you are also likely to overweight subgroups in your population that are more readily accessible.
All of the methods that follow can be considered subcategories of purposive sampling methods. We might sample for specific groups or types of people as in modal instance, expert, or quota sampling. We might sample for diversity as in heterogeneity sampling. Or, we might capitalize on informal social networks to identify specific respondents who are hard to locate otherwise, as in snowball sampling. In all of these methods we know what we want -- we are sampling with a purpose.
Modal Instance SamplingIn statistics, the mode is the most frequently occurring value in a distribution. In sampling, when we do a modal instance sample, we are sampling the most frequent case, or the "typical" case. In a lot of informal public opinion polls, for instance, they interview a "typical" voter. There are a number of problems with this sampling approach. First, how do we know what the "typical" or "modal" case is? We could say that the modal voter is a person who is of average age, educational level, and income in the population. But, it's not clear that using the averages of these is the fairest (consider the skewed distribution of income, for instance). And, how do you know that those three variables -- age, education, income -- are the only or even the most relevant for classifying the typical voter? What if religion or ethnicity is an important discriminator? Clearly, modal instance sampling is only sensible for informal sampling contexts.
Expert SamplingExpert sampling involves the assembling of a sample of persons with known or demonstrable experience and expertise in some area. Often, we convene such a sample under the auspices of a "panel of experts." There are actually two reasons you might do expert sampling. First, because it would be the best way to elicit the views of persons who have specific expertise. In this case, expert sampling is essentially just a specific sub case of purposive sampling. But the other reason you might use expert sampling is to provide evidence for the validity of another sampling approach you've chosen. For instance, let's say you do modal instance sampling and are concerned that the criteria you used for defining the modal instance are subject to criticism. You might convene an expert panel consisting of persons with acknowledged experience and insight into that field or topic and ask them to examine your modal definitions and comment on their appropriateness and validity. The advantage of doing this is that you aren't out on your own trying to defend your decisions -- you have some acknowledged experts to back you. The disadvantage is that even the experts can be, and often are, wrong.
Quota SamplingIn quota sampling, you select people non-randomly according to some fixed quota. There are two types of quota sampling: proportional and non proportional. In proportional quota sampling you want to represent the major characteristics of the population by sampling a proportional amount of each. For instance, if you know the population has 40% women and 60% men, and that you want a total sample size of 100, you will continue sampling until you get those percentages and then you will stop. So, if you've already got the 40 women for your sample, but not the sixty men, you will continue to sample men but even if legitimate women respondents come along, you will not sample them because you have already "met your quota." The problem here (as in much purposive sampling) is that you have to decide the specific characteristics on which you will base the quota. Will it be by gender, age, education race, religion, etc.?
Non-proportional quota sampling is a bit less restrictive. In this method, you specify the minimum number of sampled units you want in each category. Here, you're not concerned with having numbers that match the proportions in the population. Instead, you simply want to have enough to assure that you will be able to talk about even small groups in the population. This method is the non-probabilistic analogue of stratified random sampling in that it is typically used to assure that smaller groups are adequately represented in your sample.
Heterogeneity SamplingWe sample for heterogeneity when we want to include all opinions or views, and we aren't concerned about representing these views proportionately. Another term for this is sampling for diversity. In many brainstorming or nominal group processes (including concept mapping), we would use some form of heterogeneity sampling because our primary interest is in getting broad spectrum of ideas, not identifying the "average" or "modal instance" ones. In effect, what we would like to be sampling is not people, but ideas. We imagine that there is a universe of all possible ideas relevant to some topic and that we want to sample this population, not the population of people who have the ideas. Clearly, in order to get all of the ideas, and especially the "outlier" or unusual ones, we have to include a broad and diverse range of participants. Heterogeneity sampling is, in this sense, almost the opposite of modal instance sampling.
Snowball SamplingIn snowball sampling, you begin by identifying someone who meets the criteria for inclusion in your study. You then ask them to recommend others who they may know who also meet the criteria. Although this method would hardly lead to representative samples, there are times when it may be the best method available. Snowball sampling is especially useful when you are trying to reach populations that are inaccessible or hard to find. For instance, if you are studying the homeless, you are not likely to be able to find good lists of homeless people within a specific geographical area. However, if you go to that area and identify one or two, you may find that they know very well whom the other homeless people in their vicinity are and how you can find them.Characteristics of good Sample: The decision process is a complicated one. The researcher has to first identify the limiting factor or factors and must judiciously balance the conflicting factors. The various criteria governing the choice of the sampling technique are:
1. Purpose of the Survey: What does the researcher aim at? If he intends to generalize the findings based on the sample survey to the population, then an appropriate probability sampling method must be selected. The choice of a particular type of probability sampling depends on the geographical area of the survey and the size and the nature of the population under study.
2.Measurability: The application of statistical inference theory requires computation of the sampling error from the sample itself. Only probability samples allow such computation. Hence, where the research objective requires statistical inference, the sample should be drawn by applying simple random sampling method or stratified random sampling method, depending on whether the population is homogenous or heterogeneous.
3.Degree of Precision: Should the results of the survey be very precise, or could even rough results serve the purpose? The desired level of precision is one of the criteria for sampling method selection. Where a high degree of precision of results is desired, probability sampling should be used. Where even crude results would serve the purpose (E.g., marketing surveys, readership surveys etc), any convenient non-random sampling like quota sampling would be enough.
4. Information about Population: How much information is available about the population to be studied? Where no list of population and no information about its nature are available, it is difficult to apply a probability sampling method. Then an exploratory study with non-probability sampling may be done to gain a better idea of the population. After gaining sufficient knowledge about the population through the exploratory study, an appropriate probability sampling design may be adopted.
5. The Nature of the Population: In terms of the variables to be studied, is the population homogenous or heterogeneous? In the case of a homogenous population,
even simple random sampling will give a representative sample. If the population is heterogeneous, stratified random sampling is appropriate.
6. Geographical Area of the Study and the Size of the Population: If the area covered by a survey is very large and the size of the population is quite large, multi-stage cluster sampling would be appropriate. But if the area and the size of the population are small, single stage probability sampling methods could be used.
7. Financial Resources: If the available finance is limited, it may become necessary to choose a less costly sampling plan like multistage cluster sampling, or even quota sampling as a compromise. However, if the objectives of the study and the desired level of precision cannot be attained within the stipulated budget, there is no alternative but to give up the proposed survey. Where the finance is not a constraint, a researcher can choose the most appropriate method of sampling that fits the research objective and the nature of population.
8. Time Limitation: The time limit within which the research project should be completed restricts the choice of a sampling method. Then, as a compromise, it may become necessary to choose less time consuming methods like simple random sampling, instead of stratified sampling/sampling with probability proportional to size; or multi-stage cluster sampling, instead of single-stage sampling of elements. Of course, the precision has to be sacrificed to some extent.
9. Economy: It should be another criterion in choosing the sampling method. It means achieving the desired level of precision at minimum cost. A sample is economical if the precision per unit cost is high, or the cost per unit of variance is low. The above criteria frequently conflict with each other and the researcher must balance and blend them to obtain a good sampling plan. The chosen plan thus represents an adaptation of the sampling theory to the available facilities and resources. That is, it represents a compromise between idealism and feasibility. One should use simple workable methods, instead of unduly elaborate and complicated techniques.
Q 5. Select any topic for research and explain how you will use both secondary and primary sources to gather the required information.
Ans.: Primary Sources of Data Primary sources are original sources from which the researcher directly collects data that has not been previously collected, e.g., collection of data directly by the researcher on brand awareness, brand preference, and brand loyalty and other aspects of consumer behavior, from a sample of consumers by interviewing them. Primary data is first hand information collected through various methods such as surveys, experiments and observation, for the purposes of the project immediately at hand. The advantages of primary data are –
It is unique to a particular research study It is recent information, unlike published information that is already available
The disadvantages are – It is expensive to collect, compared to gathering information from available sources Data collection is a time consuming process It requires trained interviewers and investigators
2 Secondary Sources of Data These are sources containing data, which has been collected and compiled for another purpose. Secondary sources may be internal sources, such as annual reports, financial statements, sales reports, inventory records, minutes of meetings and other information that is available within the firm, in the form of a marketing information system. They may also be external sources, such as
government agencies (e.g. census reports, reports of government departments), published sources (annual reports of currency and finance published by the Reserve Bank of India, publications of international organizations such as the UN, World Bank and International Monetary Fund, trade and financial journals, etc.), trade associations (e.g. Chambers of Commerce) and commercial services (outside suppliers of information).Methods of Data Collection:The researcher directly collects primary data from its original sources. In this case, the researcher can collect the required data precisely according to his research needs and he can collect them when he wants and in the form that he needs it. But the collection of primary data is costly and time consuming. Yet, for several types of social science research, required data is not available from secondary sources and it has to be directly gathered from the primary sources. Primary data has to be gathered in cases where the available data is inappropriate, inadequate or obsolete. It includes: socio economic surveys, social anthropological studies of rural communities and tribal communities, sociological studies of social problems and social institutions, marketing research, leadership studies, opinion polls, attitudinal surveys, radio listening and T.V. viewing surveys, knowledge-awareness practice (KAP) studies, farm management studies, business management studies etc. There are various methods of primary data collection, including surveys, audits and panels, observation and experiments. 1 Survey Research A survey is a fact-finding study. It is a method of research involving collection of data directly from a population or a sample at a particular time. A survey has certain characteristics: It is always conducted in a natural setting. It is a field study. It seeks responses directly from the respondents. It can cover a very large population. It may include an extensive study or an intensive study It covers a definite geographical area.
A survey involves the following steps - Selection of a problem and its formulation Preparation of the research design Operation concepts and construction of measuring indexes and scales Sampling Construction of tools for data collection Field work and collection of data Processing of data and tabulation Analysis of data Reporting
There are four basic survey methods, which include: Personal interview Telephone interview Mail survey and Fax survey Personal Interview Personal interviewing is one of the prominent methods of data collection. It may be defined as a two-way systematic conversation between an investigator and an informant, initiated for obtaining information relevant to a specific study. It involves not only conversation, but also learning from the respondent’s gestures, facial expressions and pauses, and his environment. Interviewing may be used either as a main method or as a supplementary one in studies of persons. Interviewing is the only suitable method for gathering information from illiterate or less educated respondents. It is useful for collecting a wide range of data, from factual demographic data to highly personal and intimate information relating to a person’s opinions, attitudes, values, beliefs, experiences and future intentions. Interviewing is appropriate when qualitative information is required, or probing is necessary to draw out the respondent fully. Where the area covered for
the survey is compact, or when a sufficient number of qualified interviewers are available, personal interview is feasible. Interview is often superior to other data-gathering methods. People are usually more willing to talk than to write. Once rapport is established, even confidential information may be obtained. It permits probing into the context and reasons for answers to questions. Interview can add flesh to statistical information. It enables the investigator to grasp the behavioral context of the data furnished by the respondents. It permits the investigator to seek clarifications and brings to the forefront those questions, which for some reason or the other the respondents do not want to answer. Interviewing as a method of data collection has certain characteristics. They are:
1. The participants – the interviewer and the respondent – are strangers; hence, the investigator has to get himself/herself introduced to the respondent in an appropriate manner.
2. The relationship between the participants is a transitory one. It has a fixed beginning and termination points. The interview proper is a fleeting, momentary experience for them.
3. The interview is not a mere casual conversational exchange, but a conversation with a specific purpose, viz., obtaining information relevant to a study.
4. The interview is a mode of obtaining verbal answers to questions put verbally.
5. The interaction between the interviewer and the respondent need not necessarily be on a face-to-face basis, because the interview can also be conducted over the telephone.
6. Although the interview is usually a conversation between two persons, it need not be limited to a single respondent. It can also be conducted with a group of persons, such as family members, or a group of children, or a group of customers, depending on the requirements of the study.
7. The interview is an interactive process. The interaction between the interviewer and the respondent depends upon how they perceive each other.
8. The respondent reacts to the interviewer’s appearance, behavior, gestures, facial expression and intonation, his perception of the thrust of the questions and his own personal needs. As far as possible, the interviewer should try to be closer to the social-economic level of the respondents.
9. The investigator records information furnished by the respondent in the interview. This poses a problem of seeing that recording does not interfere with the tempo of conversation.
10. Interviewing is not a standardized process like that of a chemical technician; it is rather a flexible, psychological process.
3 Telephone Interviewing Telephone interviewing is a non-personal method of data collection. It may be used as a major method or as a supplementary method. It will be useful in the following situations:
11. When the universe is composed of those persons whose names are listed in telephone directories, e.g. business houses, business executives, doctors and other professionals.
12. When the study requires responses to five or six simple questions, e.g. a radio or television program survey.
13. When the survey must be conducted in a very short period of time, provided the units of study are listed in the telephone directory.
14. When the subject is interesting or important to respondents, e.g. a survey relating to trade conducted by a trade association or a chamber of commerce, a survey relating to a profession conducted by the concerned professional association.
15. When the respondents are widely scattered and when there are many call backs to make.
4 Group Interviews A group interview may be defined as a method of collecting primary data in which a number of individuals with a common interest interact with each other. In a personal interview, the flow of information is multi dimensional. The group may consist of about six to eight individuals with a common interest. The interviewer acts as the discussion leader. Free discussion is encouraged on some aspect of the subject under study. The discussion leader stimulates the group members to interact with each other. The desired information may be obtained through self-administered questionnaire or interview, with the discussion serving as a guide to ensure consideration of the areas of concern. In particular, the interviewers look for evidence of common elements of attitudes, beliefs, intentions and opinions among individuals in the group. At the same time, he must be aware that a single comment by a member can provide important insight. Samples for group interviews can be obtained through schools, clubs and other organized groups. 5 Mail Survey The mail survey is another method of collecting primary data. This method involves sending questionnaires to the respondents with a request to complete them and return them by post. This can be used in the case of educated respondents only. The mail questionnaires should be simple so that the respondents can easily understand the questions and answer them. It should preferably contain mostly closed-ended and multiple choice questions, so that it could be completed within a few minutes. The distinctive feature of the mail survey is that the questionnaire is self-administered by the respondents themselves and the responses are recorded by them and not by the investigator, as in the case of personal interview method. It does not involve face-to-face conversation between the investigator and the respondent. Communication is carried out only in writing and this requires more cooperation from the respondents than verbal communication. The researcher should prepare a mailing list of the selected respondents, by collecting the addresses from the telephone directory of the association or organization to which they belong. The following procedures should be followed - a covering letter should accompany a copy of the questionnaire. It must explain to the respondent the purpose of the study and the importance of his cooperation to the success of the project. Anonymity must be assured. The sponsor’s identity may be revealed. However, when such information may bias the result, it is not desirable to reveal it. In this case, a disguised organization name may be used. A self-addressed stamped envelope should be enclosed in the covering letter. After a few days from the date of mailing the questionnaires to the respondents, the researcher can expect the return of completed ones from them. The progress in return may be watched and at the appropriate stage, follow-up efforts can be made.
The response rate in mail surveys is generally very low in developing countries like India. Certain techniques have to be adopted to increase the response rate. They are:
1. Quality printing: The questionnaire may be neatly printed on quality light colored paper, so as to attract the attention of the respondent.
2. Covering letter: The covering letter should be couched in a pleasant style, so as to attract and hold the interest of the respondent. It must anticipate objections and answer them briefly. It is desirable to address the respondent by name.
3. Advance information: Advance information can be provided to potential respondents by a telephone call, or advance notice in the newsletter of the concerned organization, or by a letter. Such preliminary contact with potential respondents is more successful than follow-up efforts.
4. Incentives: Money, stamps for collection and other incentives are also used to induce respondents to complete and return the mail questionnaire.
5. Follow-up-contacts: In the case of respondents belonging to an organization, they may be approached through someone in that organization known as the researcher.
6. Larger sample size: A larger sample may be drawn than the estimated sample size. For example, if the required sample size is 1000, a sample of 1500 may be drawn. This may help the researcher to secure an effective sample size closer to the required size.
Q 6. Case Study: You are engaged to carry out a market survey on behalf of a leading Newspaper that is keen to increase its circulation in Bangalore City, in order to ascertain reader habits and interests. Develop a title for the study; define the research problem and the objectives or questions to be answered by the study.
Ans.: Title: Newspaper reading choices
Research problem: A research problem is the situation that causes the researcher to feel apprehensive, confused and ill at ease. It is the demarcation of a problem area within a certain context involving the WHO or WHAT, the WHERE, the WHEN and the WHY of the problem situation.
There are many problem situations that may give rise to research. Three sources usually contribute to problem identification. Own experience or the experience of others may be a source of problem supply. A second source could be scientific literature. You may read about certain findings and notice that a certain field was not covered. This could lead to a research problem. Theories could be a third source. Shortcomings in theories could be researched.
Research can thus be aimed at clarifying or substantiating an existing theory, at clarifying contradictory findings, at correcting a faulty methodology, at correcting the inadequate or unsuitable use of statistical techniques, at reconciling conflicting opinions, or at solving existing practical problems
Types of questions to be asked :For more than 35 years, the news about newspapers and young readers has been mostly bad for the newspaper industry. Long before any competition from cable television or Nintendo, American newspaper publishers were worrying about declining readership among the young.
As early as 1960, at least 20 years prior to Music Television (MTV) or the Internet, media research scholars1 began to focus their studies on young adult readers' decreasing interest in newspaper content. The concern over a declining youth market preceded and perhaps foreshadowed today's fretting over market penetration. Even where circulation has grown or stayed stable, there is rising concern over penetration, defined as the percentage of occupied households in a geographic market that are served by a newspaper.2 Simply put, population growth is occurring more rapidly than newspaper readership in most communities.
This study looks at trends in newspaper readership among the 18-to-34 age group and examines some of the choices young adults make when reading newspapers.
One of the underlying concerns behind the decline in youth newspaper reading is the question of how young people view the newspaper. A number of studies explored how young readers evaluate and use newspaper content.
Comparing reader content preferences over a 10-year period, Gerald Stone and Timothy Boudreau found differences between readers ages 18-34 and those 35-plus.16 Younger readers showed increased interest in national news, weather, sports, and classified advertisements over the decade between 1984 and 1994, while older readers ranked weather, editorials, and food advertisements higher. Interest in international news and letters to the editor was less among younger readers, while older readers showed less interest in reports of births, obituaries, and marriages.
David Atkin explored the influence of telecommunication technology on newspaper readership among students in undergraduate media courses.17 He reported that computer-related
technologies, including electronic mail and computer networks, were unrelated to newspaper readership. The study found that newspaper subscribers preferred print formats over electronic. In a study of younger, school-age children, Brian Brooks and James Kropp found that electronic newspapers could persuade children to become news consumers, but that young readers would choose an electronic newspaper over a printed one.18
In an exploration of leisure reading among college students, Leo Jeffres and Atkin assessed dimensions of interest in newspapers, magazines, and books,19 exploring the influence of media use, non-media leisure, and academic major on newspaper content preferences. The study discovered that overall newspaper readership was positively related to students' focus on entertainment, job / travel information, and public affairs. However, the students' preference for reading as a leisure-time activity was related only to a public affairs focus. Content preferences for newspapers and other print media were related. The researchers found no significant differences in readership among various academic majors, or by gender, though there was a slight correlation between age and the public affairs readership index, with older readers more interested in news about public affairs.
Methodology
Sample
Participants in this study (N=267) were students enrolled in 100- and 200-level English courses at a midwestern public university. Courses that comprise the framework for this sample were selected because they could fulfill basic studies requirements for all majors. A basic studies course is one that is listed within the core curriculum required for all students. The researcher obtained permission from seven professors to distribute questionnaires in the eight classes during regularly scheduled class periods. The students' participation was voluntary; two students declined. The goal of this sampling procedure was to reach a cross-section of students representing various fields of study. In all, 53 majors were represented.
Of the 267 students who participated in the study, 65 (24.3 percent) were male and 177 (66.3 percent) were female. A total of 25 participants chose not to divulge their genders. Ages ranged from 17 to 56, with a mean age of 23.6 years. This mean does not include the 32 respondents who declined to give their ages. A total of 157 participants (58.8 percent) said they were of the Caucasian race, 59 (22.1 percent) African American, 10 (3.8 percent) Asian, five (1.9 percent) African/Native American, two (.8 percent) Hispanic, two (.8 percent) Native American, and one (.4 percent) Arabic. Most (214) of the students were enrolled full time, whereas a few (28) were part-time students. The class rank breakdown was: freshmen, 45 (16.9 percent); sophomores, 15 (5.6 percent); juniors, 33 (12.4 percent); seniors, 133 (49.8 percent); and graduate students, 16 (6 percent).
Procedure
After two pre-tests and revisions, questionnaires were distributed and collected by the investigator. In each of the eight classes, the researcher introduced herself to the students as a journalism professor who was conducting a study on students' use of newspapers and other media. Each questionnaire included a cover letter with the researcher's name, address, and phone number. The researcher provided pencils and was available to answer questions if anyone needed further assistance. The average time spent on the questionnaires was 20 minutes, with some individual students taking as long as an hour. Approximately six students asked to take the questionnaires home to finish. They returned the questionnaires to the researcher's mailbox within a couple of day.
Assignment Set- 2
Q 1.Discuss the relative advantages and disadvantages of the different methods of distributing questionnaires to the respondents of a study.
Ans.: There are some alternative methods of distributing questionnaires to the respondents. They are: 1) Personal delivery, 2) Attaching the questionnaire to a product, 3) Advertising the questionnaire in a newspaper or magazine, and 4) News-stand inserts. Personal delivery: The researcher or his assistant may deliver the questionnaires to the potential respondents, with a request to complete them at their convenience. After a day or two, the completed questionnaires can be collected from them. Often referred to as the self-administered questionnaire method, it combines the advantages of the personal interview and the mail survey. Alternatively, the questionnaires may be delivered in person and the respondents may return the completed questionnaires through mail. Attaching questionnaire to a product: A firm test marketing a product may attach a questionnaire to a product and request the buyer to complete it and mail it back to the firm. A gift or a discount coupon usually rewards the respondent. Advertising the questionnaire: The questionnaire with the instructions for completion may be advertised on a page of a magazine or in a section of newspapers. The potential respondent completes it, tears it out and mails it to the advertiser. For example, the committee of Banks Customer Services used this method for collecting information from the customers of commercial banks in India. This method may be useful for large-scale studies on topics of common interest. Newsstand inserts: This method involves inserting the covering letter, questionnaire and self addressed reply-paid envelope into a random sample of newsstand copies of a newspaper or magazine.Advantages and Disadvantages:The advantages of Questionnaire are: this method facilitates collection of more accurate data for longitudinal studies than any other method, because under this method, the event or action is reported soon after its occurrence. this method makes it possible to have before and after designs made for field based studies. For example, the effect of public relations or advertising campaigns or welfare measures can be measured by collecting data before, during and after the campaign. the panel method offers a good way of studying trends in events, behavior or attitudes. For example, a panel enables a market researcher to study how brand preferences change from month to month; it enables an economics researcher to study how employment, income and expenditure of agricultural laborers change from month to month; a political scientist can study the shifts in inclinations of voters and the causative influential factors during an election. It is also possible to find out how the constituency of the various economic and social strata of society changes through time and so on. A panel study also provides evidence on the causal relationship between variables. For example, a cross sectional study of employees may show an association between their attitude to their jobs and their positions in the organization, but it does not indicate as to which comes first - favorable attitude or promotion. A panel study can provide data for finding an answer to this question. It facilities depth interviewing, because panel members become well acquainted with the field workers and will be willing to allow probing interviews.
The major limitations or problems of Questionnaire method are: this method is very expensive. The selection of panel members, the payment of premiums, periodic training of investigators and supervisors, and the costs involved in replacing dropouts, all add to the expenditure. it is often difficult to set up a representative panel and to keep it representative. Many persons may be unwilling to participate in a panel study. In the course of the study, there may be frequent
dropouts. Persons with similar characteristics may replace the dropouts. However, there is no guarantee that the emerging panel would be representative. A real danger with the panel method is “panel conditioning” i.e., the risk that repeated interviews may sensitize the panel members and they become untypical, as a result of being on the panel. For example, the members of a panel study of political opinions may try to appear consistent in the views they express on consecutive occasions. In such cases, the panel becomes untypical of the population it was selected to represent. One possible safeguard to panel conditioning is to give members of a panel only a limited panel life and then to replace them with persons taken randomly from a reserve list. the quality of reporting may tend to decline, due to decreasing interest, after a panel
has been in operation for some time. Cheating by panel members or investigators may be
a problem in some cases.
Q 2. In processing data, what is the difference between measures of central tendency and measures of dispersion? What is the most important measure of central tendency and dispersion?
Ans.: Measures of Central tendency:Arithmetic MeanThe arithmetic mean is the most common measure of central tendency. It simply the sum of the numbers divided by the number of numbers. The symbol m is used for the mean of a population. The symbol M is used for the mean of a sample. The formula for m is shown below: m= ΣX
N
Where ΣX is the sum of all the numbers in the numbers in the sample and N is the number of numbers in the sample. As an example, the mean of the numbers 1+2+3+6+8= 20
5
=4 regardless of whether the numbers constitute the entire population or just a sample from the population. The table, Number of touchdown passes, shows the number of touchdown (TD) passes thrown by each of the 31 teams in the National Football League in the 2000 season. The mean number of touchdown passes thrown is 20.4516 as shown below. m= ΣX
N
= 634
31
=20.4516 37 33 33 32 29 28 28 23 22 22 22 21 21 21 20 20 19 19 18 18 18 18 16 15 14 14 14 12 12 9 6 Table 1: Number of touchdown passes
Although the arithmetic mean is not the only "mean" (there is also a geometric mean), it is by far
the most commonly used. Therefore, if the term "mean" is used without specifying whether it is the arithmetic mean, the geometric mean, or some other mean, it is assumed to refer to the arithmetic mean. MedianThe median is also a frequently used measure of central tendency. The median is the midpoint of a distribution: the same number of scores is above the median as below it. For the data in the table, Number of touchdown passes, there are 31 scores. The 16th highest score (which equals 20) is the median because there are 15 scores below the 16th score and 15 scores above the 16th score. The median can also be thought of as the 50th percentile. Let's return to the made up example of the quiz on which you made a three discussed previously in the module Introduction to Central Tendency and shown in Table 2.
Student Dataset 1 Dataset 2 Dataset 3 You 3 3 3 John's 3 4 2 Maria's 3 4 2 Shareecia's 3 4 2 Luther's 3 5 1 Table 2: Three possible datasets for the 5-point make-up quiz
For Dataset 1, the median is three, the same as your score. For Dataset 2, the median is 4. Therefore, your score is below the median. This means you are in the lower half of the class. Finally for Dataset 3, the median is 2. For this dataset, your score is above the median and therefore in the upper half of the distribution. Computation of the Median: When there is an odd number of numbers, the median is simply the middle number. For example, the median of 2, 4, and 7 is 4. When there is an even number of numbers, the median is the mean of the two middle numbers. Thus, the median of the numbers 2, 4, 7, 12 is 4+7
2
=5.5. ModeThe mode is the most frequently occurring value. For the data in the table, Number of touchdown passes, the mode is 18 since more teams (4) had 18 touchdown passes than any other number of touchdown passes. With continuous data such as response time measured to many decimals, the frequency of each value is one since no two scores will be exactly the same (see discussion of continuous variables). Therefore the mode of continuous data is normally computed from a grouped frequency distribution. The Grouped frequency distribution table shows a grouped frequency distribution for the target response time data. Since the interval with the highest frequency is 600-700, the mode is the middle of that interval (650).
Range Frequency 500-600 3 600-700 6 700-800 5 800-900 5 900-1000 0 1000-1100 1 Table 3: Grouped frequency distribution
Measures of Dispersion: A measure of statistical dispersion is a real number that is zero if all the data are identical, and increases as the data becomes more diverse. It cannot be less than zero.
Most measures of dispersion have the same scale as the quantity being measured. In other words, if the measurements have units, such as metres or seconds, the measure of dispersion has the same units. Such measures of dispersion include:
Standard deviation Interquartile range Range Mean difference Median absolute deviation Average absolute deviation (or simply called average deviation) Distance standard deviation
These are frequently used (together with scale factors) as estimators of scale parameters, in which capacity they are called estimates of scale.
All the above measures of statistical dispersion have the useful property that they are location-invariant, as well as linear in scale. So if a random variable X has a dispersion of SX then a linear transformation Y = aX + b for real a and b should have dispersion SY = |a|SX.
Other measures of dispersion are dimensionless (scale-free). In other words, they have no units even if the variable itself has units. These include:
Coefficient of variation Quartile coefficient of dispersion Relative mean difference , equal to twice the Gini coefficient
There are other measures of dispersion:
Variance (the square of the standard deviation) — location-invariant but not linear in scale.
Variance-to-mean ratio — mostly used for count data when the term coefficient of dispersion is used and when this ratio is dimensionless, as count data are themselves dimensionless: otherwise this is not scale-free.
Some measures of dispersion have specialized purposes, among them the Allan variance and the Hadamard variance.
For categorical variables, it is less common to measure dispersion by a single number. See qualitative variation. One measure that does so is the discrete entropy.
Sources of statistical dispersion
In the physical sciences, such variability may result only from random measurement errors: instrument measurements are often not perfectly precise, i.e., reproducible. One may assume that the quantity being measured is unchanging and stable, and that the variation between measurements is due to observational error.
In the biological sciences, this assumption is false: the variation observed might be intrinsic to the phenomenon: distinct members of a population differ greatly. This is also seen in the arena of manufactured products; even there, the meticulous scientist finds variation.The simple model of a stable quantity is preferred when it is tenable. Each phenomenon must be examined to see if it warrants such a simplification.
Q 3. What are the characteristics of a good research design? Explain how the research design for exploratory studies is different from the research design for descriptive and diagnostic studies.
Ans.: Good research design:Much contemporary social research is devoted to examining whether a program, treatment, or manipulation causes some outcome or result. For example, we might wish to know whether a new educational program causes subsequent achievement score gains, whether a special work release program for prisoners causes lower recidivism rates, whether a novel drug causes a reduction in symptoms, and so on. Cook and Campbell (1979) argue that three conditions must be met before we can infer that such a cause-effect relation exists:
1. Covariation. Changes in the presumed cause must be related to changes in the presumed effect. Thus, if we introduce, remove, or change the level of a treatment or program, we should observe some change in the outcome measures.
2. Temporal Precedence. The presumed cause must occur prior to the presumed effect. 3. No Plausible Alternative Explanations. The presumed cause must be the only
reasonable explanation for changes in the outcome measures. If there are other factors, which could be responsible for changes in the outcome measures, we cannot be confident that the presumed cause-effect relationship is correct.
In most social research the third condition is the most difficult to meet. Any number of factors other than the treatment or program could cause changes in outcome measures. Campbell and Stanley (1966) and later, Cook and Campbell (1979) list a number of common plausible alternative explanations (or, threats to internal validity). For example, it may be that some historical event which occurs at the same time that the program or treatment is instituted was responsible for the change in the outcome measures; or, changes in record keeping or measurement systems which occur at the same time as the program might be falsely attributed to the program. The reader is referred to standard research methods texts for more detailed discussions of threats to validity.
This paper is primarily heuristic in purpose. Standard social science methodology textbooks (Cook and Campbell 1979; Judd and Kenny, 1981) typically present an array of research designs and the alternative explanations, which these designs rule out or minimize. This tends to foster a "cookbook" approach to research design - an emphasis on the selection of an available design rather than on the construction of an appropriate research strategy. While standard designs may sometimes fit real-life situations, it will often be necessary to "tailor" a research design to minimize specific threats to validity. Furthermore, even if standard textbook designs are used, an understanding of the logic of design construction in general will improve the comprehension of these standard approaches. This paper takes a structural approach to research design. While this is by no means the only strategy for constructing research designs, it helps to clarify some of the basic principles of design logic.
Minimizing Threats to Validity
Good research designs minimize the plausible alternative explanations for the hypothesized cause-effect relationship. But such explanations may be ruled out or minimized in a number of ways other than by design. The discussion, which follows, outlines five ways to minimize threats to validity, one of which is by research design:
1. By Argument. The most straightforward way to rule out a potential threat to validity is to simply argue that the threat in question is not a reasonable one. Such an argument may be made either a priori or a posteriori, although the former will usually be more convincing than the latter. For example, depending on the situation, one might argue that
an instrumentation threat is not likely because the same test is used for pre and post test measurements and did not involve observers who might improve, or other such factors. In most cases, ruling out a potential threat to validity by argument alone will be weaker than the other approaches listed below. As a result, the most plausible threats in a study should not, except in unusual cases, be ruled out by argument only.
2. By Measurement or Observation. In some cases it will be possible to rule out a threat by measuring it and demonstrating that either it does not occur at all or occurs so minimally as to not be a strong alternative explanation for the cause-effect relationship. Consider, for example, a study of the effects of an advertising campaign on subsequent sales of a particular product. In such a study, history (i.e., the occurrence of other events which might lead to an increased desire to purchase the product) would be a plausible alternative explanation. For example, a change in the local economy, the removal of a competing product from the market, or similar events could cause an increase in product sales. One might attempt to minimize such threats by measuring local economic indicators and the availability and sales of competing products. If there is no change in these measures coincident with the onset of the advertising campaign, these threats would be considerably minimized. Similarly, if one is studying the effects of special mathematics training on math achievement scores of children, it might be useful to observe everyday classroom behavior in order to verify that students were not receiving any additional math training to that provided in the study.
3. By Design. Here, the major emphasis is on ruling out alternative explanations by adding treatment or control groups, waves of measurement, and the like. This topic will be discussed in more detail below.
4. By Analysis. There are a number of ways to rule out alternative explanations using statistical analysis. One interesting example is provided by Jurs and Glass (1971). They suggest that one could study the plausibility of an attrition or mortality threat by conducting a two-way analysis of variance. One factor in this study would be the original treatment group designations (i.e., program vs. comparison group), while the other factor would be attrition (i.e., dropout vs. non-dropout group). The dependent measure could be the pretest or other available pre-program measures. A main effect on the attrition factor would be indicative of a threat to external validity or generalizability, while an interaction between group and attrition factors would point to a possible threat to internal validity. Where both effects occur, it is reasonable to infer that there is a threat to both internal and external validity.
The plausibility of alternative explanations might also be minimized using covariance analysis. For example, in a study of the effects of "workfare" programs on social welfare caseloads, one plausible alternative explanation might be the status of local economic conditions. Here, it might be possible to construct a measure of economic conditions and include that measure as a covariate in the statistical analysis. One must be careful when using covariance adjustments of this type -- "perfect" covariates do not exist in most social research and the use of imperfect covariates will not completely adjust for potential alternative explanations. Nevertheless causal assertions are likely to be strengthened by demonstrating that treatment effects occur even after adjusting on a number of good covariates.
5. By Preventive Action. When potential threats are anticipated some type of preventive action can often rule them out. For example, if the program is a desirable one, it is likely that the comparison group would feel jealous or demoralized. Several actions can be taken to minimize the effects of these attitudes including offering the program to the comparison group upon completion of the study or using program and comparison groups which have little opportunity for contact and communication. In addition, auditing methods and quality control can be used to track potential experimental dropouts or to insure the standardization of measurement.
The five categories listed above should not be considered mutually exclusive. The inclusion of measurements designed to minimize threats to validity will obviously be related to the design structure and is likely to be a factor in the analysis. A good research plan should, where possible. make use of multiple methods for reducing threats. In general, reducing a particular threat by design or preventive action will probably be stronger than by using one of the other three approaches. The choice of which strategy to use for any particular threat is complex and depends at least on the cost of the strategy and on the potential seriousness of the threat.
Design Construction
Basic Design Elements. Most research designs can be constructed from four basic elements:
1. Time. A causal relationship, by its very nature, implies that some time has elapsed between the occurrence of the cause and the consequent effect. While for some phenomena the elapsed time might be measured in microseconds and therefore might be unnoticeable to a casual observer, we normally assume that the cause and effect in social science arenas do not occur simultaneously, In design notation we indicate this temporal element horizontally - whatever symbol is used to indicate the presumed cause would be placed to the left of the symbol indicating measurement of the effect. Thus, as we read from left to right in design notation we are reading across time. Complex designs might involve a lengthy sequence of observations and programs or treatments across time.
2. Program(s) or Treatment(s). The presumed cause may be a program or treatment under the explicit control of the researcher or the occurrence of some natural event or program not explicitly controlled. In design notation we usually depict a presumed cause with the symbol "X". When multiple programs or treatments are being studied using the same design, we can keep the programs distinct by using subscripts such as "X1" or "X2". For a comparison group (i.e., one which does not receive the program under study) no "X" is used.
3. Observation(s) or Measure(s). Measurements are typically depicted in design notation with the symbol "O". If the same measurement or observation is taken at every point in time in a design, then this "O" will be sufficient. Similarly, if the same set of measures is given at every point in time in this study, the "O" can be used to depict the entire set of measures. However, if different measures are given at different times it is useful to subscript the "O" to indicate which measurement is being given at which point in time.
4. Groups or Individuals. The final design element consists of the intact groups or the individuals who participate in various conditions. Typically, there will be one or more program and comparison groups. In design notation, each group is indicated on a separate line. Furthermore, the manner in which groups are assigned to the conditions can be indicated by an appropriate symbol at the beginning of each line. Here, "R" will represent a group, which was randomly assigned, "N" will depict a group, which was nonrandom assigned (i.e., a nonequivalent group or cohort) and a "C" will indicate that the group was assigned using a cutoff score on a measurement.
Q 4. How is the Case Study method useful in Business Research? Give two specific examples of how the case study method can be applied to business research.
Ans.: While case study writing may seem easy at first glance, developing an effective case study (also called a success story) is an art. Like other marketing communication skills, learning how to write a case study takes time. What’s more, writing case studies without careful planning usually results in sub optimal results?
Savvy case study writers increase their chances of success by following these ten proven techniques for writing an effective case study:
Involve the customer throughout the
process. Involving the customer throughout the case study development process helps ensure customer cooperation and approval, and results in an improved case study. Obtain customer permission before writing the document, solicit input during the development, and secure approval after drafting the document.
Write all customer quotes for their review. Rather than asking the customer to draft their quotes, writing them for their review usually results in more compelling material.
Case Study Writing Ideas
Establish a document template. A template serves as a roadmap for the case study process, and ensures that the document looks, feels, and reads consistently. Visually, the template helps build the brand; procedurally, it simplifies the actual writing. Before beginning work, define 3-5 specific elements to include in every case study, formalize those elements, and stick to them.
Start with a bang. Use action verbs and emphasize benefits in the case study title and subtitle. Include a short (less than 20-word) customer quote in larger text. Then, summarize the key points of the case study in 2-3 succinct bullet points. The goal should be to tease the reader into wanting to read more.
Organize according to problem, solution, and benefits. Regardless of length, the time-tested, most effective organization for a case study follows the problem-solution-benefits flow. First, describe the business and/or technical problem or issue; next, describe the solution to this problem or resolution of this issue; finally, describe how the customer benefited from the particular solution (more on this below). This natural story-telling sequence resonates with readers.
Use the general-to-specific-to-general approach. In the problem section, begin with a general discussion of the issue that faces the relevant industry. Then, describe the
specific problem or issue that the customer faced. In the solution section, use the opposite sequence. First, describe how the solution solved this specific problem; then indicate how it can also help resolve this issue more broadly within the industry. Beginning more generally draws the reader into the story; offering a specific example demonstrates, in a concrete way, how the solution resolves a commonly faced issue; and concluding more generally allows the reader to understand how the solution can also address their problem.
Quantify benefits when possible. No single element in a case study is more compelling than the ability to tie quantitative benefits to the solution. For example, “Using Solution X saved Customer Y over $ZZZ, ZZZ after just 6 months of implementation;” or, “Thanks to Solution X, employees at Customer Y have realized a ZZ% increase in productivity as measured by standard performance indicators.” Quantifying benefits can be challenging, but not impossible. The key is to present imaginative ideas to the customer for ways to quantify the benefits, and remain flexible during this discussion. If benefits cannot be quantified, attempt to develop a range of qualitative benefits; the latter can be quite compelling to readers as well. Use photos. Ask the customer if they can provide shots of personnel, ideally using the solution. The shots need not be professionally done; in fact, “homegrown” digital photos sometimes lead to surprisingly good results and often appear more genuine. Photos further personalize the story and help form a connection to readers. Reward the customer. After receiving final customer approval and finalizing the case study, provide a pdf, as well as printed copies, to the customer. Another idea is to frame a copy of the completed case study and present it to the customer in appreciation for their efforts and cooperation.Writing a case study is not easy. Even with the best plan, a case study is doomed to failure if the writer lacks the exceptional writing skills, technical savvy, and marketing experience that these documents require. In many cases, a talented writer can mean the difference between an ineffective case study and one that provides the greatest benefit. If a qualified internal writer is unavailable, consider outsourcing the task to professionals who specialize in case study writing.
Q 5. What are the differences between observation and interviewing as methods of data collection? Give two specific examples of situations where either observation or interviewing would be more appropriate.
Ans.: Observation means viewing or seeing. Observation may be defined as a systematic viewing of a specific phenomenon on its proper setting for the specific purpose of gathering data for a particular study. Observation is classical method of scientific study.
The prerequisites of observation consist of:
Observations must be done under conditions, which will permit accurate results. The observer must be in vantage point to see clearly the objects to be observed. The distance and the light must be satisfactory. The mechanical devices used must be in good working conditions and operated by skilled persons.
Observation must cover a sufficient number of representative samples of the cases.
Recording should be accurate and complete.
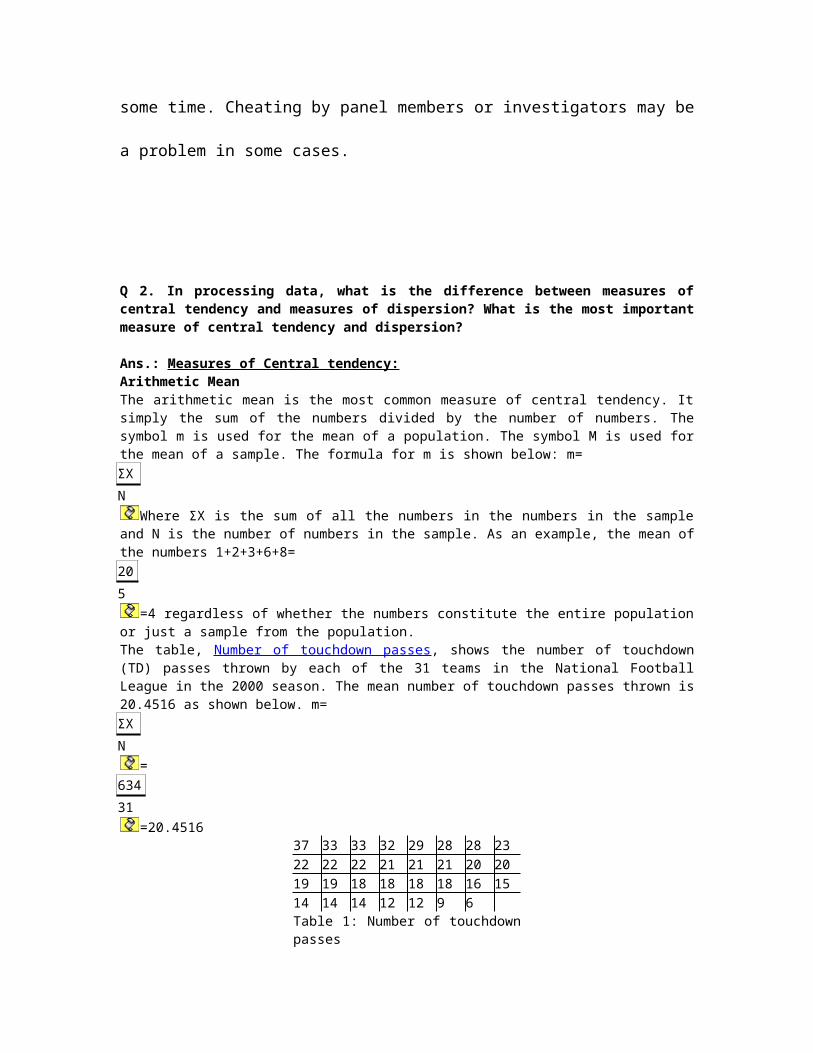
The accuracy and completeness of recorded results must be checked. A certain number of cases can be observered again by another observer/another set of mechanical devices as the case may be. If it is feasible two separate observers and set of instruments may be used in all or some of the original observations. The results could then be compared to determine their accuracy and completeness.
Advantages of observationo The main virtue of observation is its directness it makes it possible to study
behavior as it occurs. The researcher needs to ask people about their behavior and interactions he can simply watch what they do and say.
o Data collected by observation may describe the observed phenomena as they
occur in their natural settings. Other methods introduce elements or artificiality into the researched situation for instance in interview the respondent may not behave in a natural way. There is no such artificiality in observational studies especially when the observed persons are not aware of their being observed.
o Observations in more suitable for studying subjects who are unable to articulate
meaningfully e.g. studies of children, tribal animals, birds etc.
o Observations improve the opportunities for analyzing the contextual back ground
of behavior. Furthermore verbal resorts can be validated and compared with behavior through observation. The validity of what men of position and authority say can be verified by observing what they actually do.
o Observations make it possible to capture the whole event as it occurs. For
example only observation can be providing an insight into all the aspects of the process of negotiation between union and management representatives.
o Observation is less demanding of the subjects and has less biasing effect on
their conduct than questioning.
o It is easier to conduct disguised observation studies than disguised questioning.
o Mechanical devices may be used for recording data in order to secure more
accurate data and also of making continuous observations over longer periods.
Interviews are a crucial part of the recruitment process for all Organisations. Their purpose is to give the interviewer(s) a chance to assess your suitability for the role and for you to demonstrate your abilities and personality. As this is a two-way process, it is also a good opportunity for you to ask questions and to make sure the organisation and position are right for you.Interview format
Interviews take many different forms. It is a good idea to ask the organisation in advance what format the interview will take.
Competency/criteria based interviews - These are structured to reflect the competencies or qualities that an employer is seeking for a particular job, which will usually have been detailed in the job specification or advert. The interviewer is looking for evidence of your skills and may ask such things as: ‘Give an example of a time you worked as part of a team to achieve a common goal.’
The organisation determines the selection criteria based on the roles they are recruiting
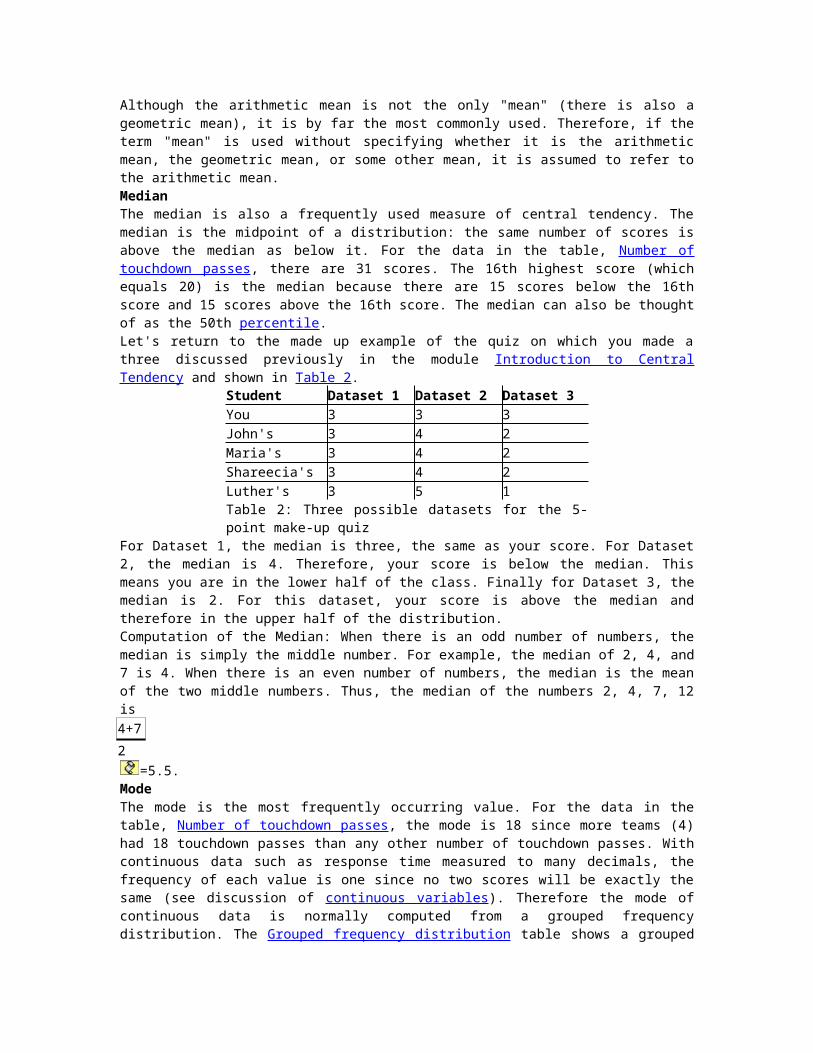
for and then, in an interview, examines whether or not you have evidence of possessing these.Recruitment Manager, The Cooperative Group
Technical interviews - If you have applied for a job or course that requires technical knowledge, it is likely that you will be asked technical questions or has a separate technical interview. Questions may focus on your final year project or on real or hypothetical technical problems. You should be prepared to prove yourself, but also to admit to what you do not know and stress that you are keen to learn. Do not worry if you do not know the exact answer - interviewers are interested in your thought process and logic.
Academic interviews - These are used for further study or research positions. Questions are likely to center on your academic history to date.
Structured interviews - The interviewer has a set list of questions, and asks all the candidates the same questions.
Formal/informal interviews - Some interviews may be very formal, while others will feel more like an informal chat about you and your interests. Be aware that you are still being assessed, however informal the discussion may seem.
Portfolio based interviews - If the role is within the arts, media or communications industries, you may be asked to bring a portfolio of your work to the interview, and to have an in-depth discussion about the pieces you have chosen to include.
Senior/case study interviews - These ranges from straightforward scenario questions (e.g. ‘What would you do in a situation where…?’) to the detailed analysis of a hypothetical business problem. You will be evaluated on your analysis of the problem, how you identify the key issues, how you pursue a particular line of thinking and whether you can develop and present an appropriate framework for organising your thoughts.
Specific types of interview
The Screening Interview
Companies use screening tools to ensure that candidates meet minimum qualification requirements. Computer programs are among the tools used to weed out unqualified candidates. (This is why you need a digital resume that is screening-friendly. See our resume center for help.) Sometimes human professionals are the gatekeepers. Screening interviewers often have honed skills to determine whether there is anything that might disqualify you for the position. Remember-they does not need to know whether you are the best fit for the position, only whether you are not a match. For this reason, screeners tend to dig for dirt. Screeners will hone in on gaps in your employment history or pieces of information that look inconsistent. They also will want to know from the outset whether you will be too expensive for the company.
Some tips for maintaining confidence during screening interviews:
Highlight your accomplishments and qualifications. Get into the straightforward groove. Personality is not as important to the screener as
verifying your qualifications. Answer questions directly and succinctly. Save your winning personality for the person making hiring decisions!
Be tactful about addressing income requirements. Give a range, and try to avoid giving specifics by replying, "I would be willing to consider your best offer."
If the interview is conducted by phone, it is helpful to have note cards with your vital information sitting next to the phone. That way, whether the interviewer catches you sleeping or vacuuming the floor, you will be able to switch gears quickly.
The Informational Interview
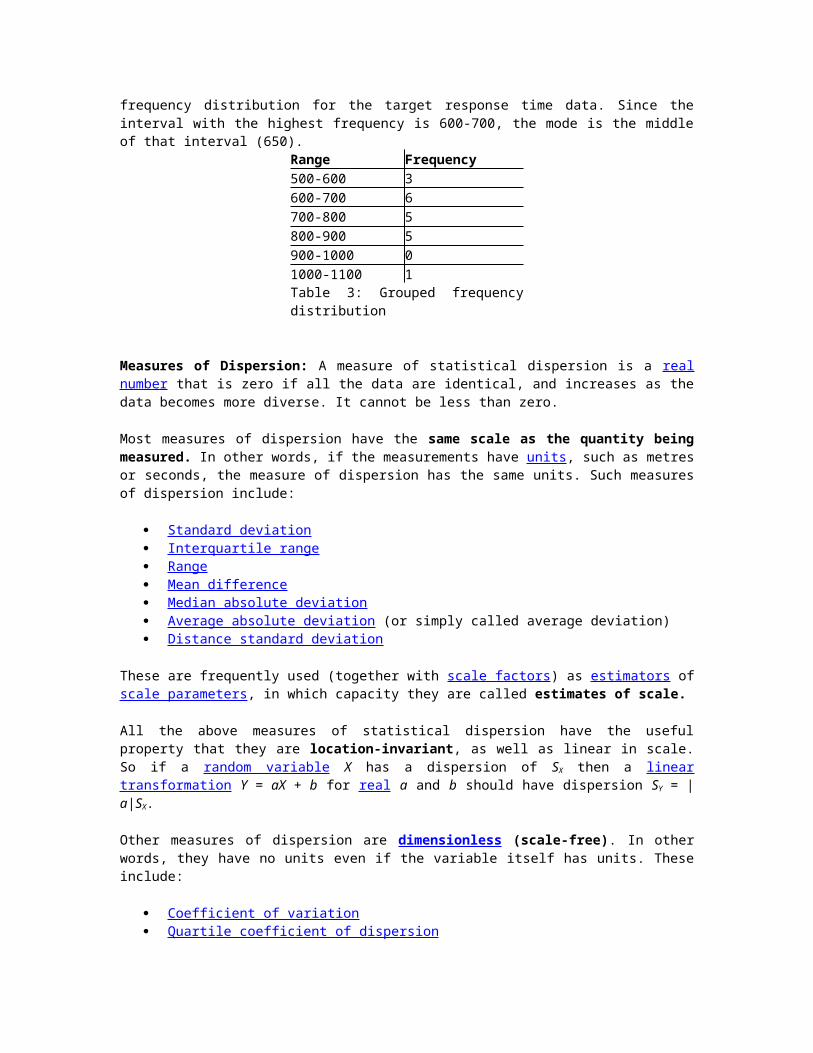
On the opposite end of the stress spectrum from screening interviews is the informational interview. A meeting that you initiate, the informational interview is underutilized by job-seekers who might otherwise consider themselves savvy to the merits of networking. Job seekers ostensibly secure informational meetings in order to seek the advice of someone in their current or desired field as well as to gain further references to people who can lend insight. Employers that like to stay apprised of available talent even when they do not have current job openings, are often open to informational interviews, especially if they like to share their knowledge, feel flattered by your interest, or esteem the mutual friend that connected you to them. During an informational interview, the jobseeker and employer exchange information and get to know one another better without reference to a specific job opening.
This takes off some of the performance pressure, but be intentional nonetheless:
Come prepared with thoughtful questions about the field and the company. Gain references to other people and make sure that the interviewer would be comfortable
if you contact other people and use his or her name. Give the interviewer your card, contact information and resume. Write a thank you note to the interviewer.
The Directive Style
In this style of interview, the interviewer has a clear agenda that he or she follows unflinchingly. Sometimes companies use this rigid format to ensure parity between interviews; when interviewers ask each candidate the same series of questions, they can more readily compare the results. Directive interviewers rely upon their own questions and methods to tease from you what they wish to know. You might feel like you are being steam-rolled, or you might find the conversation develops naturally. Their style does not necessarily mean that they have dominance issues, although you should keep an eye open for these if the interviewer would be your supervisor.
Either way, remember:
Flex with the interviewer, following his or her lead. Do not relinquish complete control of the interview. If the interviewer does not ask you for
information that you think is important to proving your superiority as a candidate, politely interject it.
The Meandering Style
This interview type, usually used by inexperienced interviewers, relies on you to lead the discussion. It might begin with a statement like "tell me about yourself," which you can use to your advantage. The interviewer might ask you another broad, open-ended question before falling into silence. This interview style allows you tactfully to guide the discussion in a way that best serves you.
The following strategies, which are helpful for any interview, are particularly important when interviewers use a non-directive approach:
Come to the interview prepared with highlights and anecdotes of your skills, qualities and experiences. Do not rely on the interviewer to spark your memory-jot down some notes that you can reference throughout the interview.
Remain alert to the interviewer. Even if you feel like you can take the driver's seat and go in any direction you wish, remain respectful of the interviewer's role. If he or she becomes more directive during the interview, adjust.
Ask well-placed questions. Although the open format allows you significantly to shape the interview, running with your own agenda and dominating the conversation means that you run the risk of missing important information about the company and its needs.
Q 6. Case Study: You are engaged to carry out a market survey on behalf of a leading Newspaper that is keen to increase its circulation in Bangalore City, in order to ascertain reader habits and interests. What type of research report would be most appropriate? Develop an outline of the research report with the main sections.
Ans.: There are four major interlinking processes in the presentation of a literature review:
1. Critiquing rather than merely listing each item a good literature review is led by your own critical thought processes - it is not simply a catalogue of what has been written.
Once you have established which authors and ideas are linked, take each group in turn and really think about what you want to achieve in presenting them this way. This is your opportunity for showing that you did not take all your reading at face value, but that you have the knowledge and skills to interpret the authors' meanings and intentions in relation to each other, particularly if there are conflicting views or incompatible findings in a particular area.
Rest assured that developing a sense of critical judgment in the literature surrounding a topic is a gradual process of gaining familiarity with the concepts, language, terminology and conventions in the field. In the early stages of your research you cannot be expected to have a fully developed appreciation of the implications of all findings.
As you get used to reading at this level of intensity within your field you will find it easier and more purposeful to ask questions as you read:
o What is this all about?o Who is saying it and what authorities do they have?o Why is it significant?o What is its context?o How was it reached?o How valid is it?o How reliable is the evidence?o What has been gained?o What do other authors say?o How does it contribute?o So what?
2. Structuring the fragments into a coherent body through your reading and discussions with your supervisor during the searching and organising phases of the cycle, you will eventually reach a final decision as to your own topic and research design.
As you begin to group together the items you read, the direction of your literature review will emerge with greater clarity. This is a good time to finalise your concept map, grouping linked items, ideas and authors into firm categories as they relate more obviously to your own study.
Now you can plan the structure of your written literature review, with your own intentions and conceptual framework in mind. Knowing what you want to convey will help you decide the most appropriate structure.
A review can take many forms; for example:
o An historical survey of theory and research in your fieldo A synthesis of several paradigmso A process of narrowing down to your own topic
It is likely that your literature review will contain elements of all of these.
As with all academic writing, a literature review needs:
o An introductiono A bodyo A conclusion
The introduction sets the scene and lays out the various elements that are to be explored.
The body takes each element in turn, usually as a series of headed sections and subsections. The first paragraph or two of each section mentions the major authors in association with their main ideas and areas of debate. The section then expands on these ideas and authors, showing how each relates to the others, and how the debate informs your understanding of the topic. A short conclusion at the end of each section presents a synthesis of these linked ideas.
The final conclusion of the literature review ties together the main points from each of your sections and this is then used to build the framework for your own study. Later, when you come to write the discussion chapter of your thesis, you should be able to relate your findings in one-to-one correspondence with many of the concepts or questions that were firmed up in the conclusion of your literature review.
3. Controlling the 'voice' of your citations in the text (by selective use of direct quoting, paraphrasing and summarizing)
You can treat published literature like any other data, but the difference is that it is not data you generated yourself.
When you report on your own findings, you are likely to present the results with reference to their source, for example:
o 'Table 2 shows that sixteen of the twenty subjects responded positively.'
When using published data, you would say:
o 'Positive responses were recorded for 80 per cent of the subjects (see table 2).'o 'From the results shown in table 2, it appears that the majority of subjects
responded positively.'
In these examples your source of information is table 2. Had you found the same results on page 17 of a text by Smith published in 1988, you would naturally substitute the name, date and page number for 'table 2'. In each case it would be your voice introducing a fact or statement that had been generated somewhere else.
You could see this process as building a wall: you select and place the 'bricks' and your 'voice' provides the ‘mortar’, which determines how strong the wall will be. In turn, this is significant in the assessment of the merit and rigor of your work.
There are three ways to combine an idea and its source with your own voice:
o Direct quoteo Paraphraseo Summary
In each method, the author's name and publication details must be associated with the words in the text, using an approved referencing system. If you don't do this you would be in severe breach of academic convention, and might be penalized. Your field of study has its own referencing conventions you should investigate before writing up your results.
Direct quoting repeats exact wording and thus directly represents the author:
o 'Rain is likely when the sky becomes overcast' (Smith 1988, page 27).
If the quotation is run in with your text, single quotation marks are used to enclose it, and it must be an identical copy of the original in every respect.
Overuse or simple 'listing' of quotes can substantially weaken your own argument by silencing your critical view or voice.
Paraphrasing is repeating an idea in your own words, with no loss of the author's intended meaning:
o As Smith (1988) pointed out in the late eighties, rain may well be indicated by the presence of cloud in the sky.
Paraphrasing allows you to organize the ideas expressed by the authors without being rigidly constrained by the grammar, tense and vocabulary of the original. You retain a degree of flexibility as to whose voice comes through most strongly.
Summarizing means to shorten or crystallize a detailed piece of writing by restating the main points in your own words and in the order in which you found them. The original writing is 'described' as if from the outside, and it is your own voice that is predominant:
o Referring to the possible effects of cloudy weather, Smith (1988) predicted the likelihood of rain.
o Smith (1988) claims that some degree of precipitation could be expected as the result of clouds in the sky: he has clearly discounted the findings of Jones (1986).
4. Using appropriate languageYour writing style represents you as a researcher, and reflects how you are dealing with the subtleties and complexities inherent in the literature.
Once you have established a good structure with appropriate headings for your literature review, and once you are confident in controlling the voice in your citations, you should find that your writing becomes more lucid and fluent because you know what you want to say and how to say it.
The good use of language depends on the quality of the thinking behind the writing, and on the context of the writing. You need to conform to discipline-specific requirements. However, there may still be some points of grammar and vocabulary you would like to improve. If you have doubts about your confidence to use the English language well, you can help yourself in several ways:
o Ask for feedback on your writing from friends, colleagues and academicso Look for specific language information in reference materialso Access programs or self-paced learning resources which may be available on
your campus
Grammar tips - practical and helpfulThe following guidance on tenses and other language tips may be useful.
Which tense should I use?
Use present tense:
o For generalizations and claims: The sky is blue.
o To convey ideas, especially theories, which exist for the reader at the time of reading:
I think therefore I am.o For authors' statements of a theoretical nature, which can then be compared on
equal terms with others: Smith (1988) suggests that...
o In referring to components of your own document: Table 2 shows...
Use present perfect tense for:
o Recent events or actions that are still linked in an unresolved way to the present: Several studies have attempted to...
Use simple past tense for:
o Completed events or actions: Smith (1988) discovered that...
Use past perfect tense for:
o Events which occurred before a specified past time: Prior to these findings, it had been thought that...
Use modals (may, might, could, would, should) to:
o Convey degrees of doubt This may indicate that ... this would imply that...
Other language tips
o Convey your meaning in the simplest possible way. Don't try to use an intellectual tone for the sake of it, and do not rely on your reader to read your mind!
o Keep sentences short and simple when you wish to emphasise a point.o Use compound (joined simple) sentences to write about two or more ideas which
may be linked with 'and', 'but', 'because', 'whereas' etc.o Use complex sentences when you are dealing with embedded ideas or those that
show the interaction of two or more complex elements.o Verbs are more dynamic than nouns, and nouns carry information more densely
than verbs.o Select active or passive verbs according to whether you are highlighting the
'doer' or the 'done to' of the action.o Keep punctuation to a minimum. Use it to separate the elements of complex
sentences in order to keep subject, verb and object in clear view.o Avoid densely packed strings of words, particularly nouns.
The total process
The story of a research study
IntroductionI looked at the situation and found that I had a question to ask about it. I wanted to investigate something in particular.
Review of literatureSo I read everything I could find on the topic - what was already known and said and what had previously been found. I established exactly where my investigation would fit into the big picture, and began to realise at this stage how my study would be different from anything done previously.
MethodologyI decided on the number and description of my subjects, and with my research question clearly in mind, designed my own investigation process, using certain known research methods (and perhaps some that are not so common). I began with the broad decision about which research paradigm I would work within (that is, qualitative/quantitative, critical/interpretive/ empiricist). Then I devised my research instrument to get the best out of what I was investigating. I knew I would have to analyse the raw data, so I made sure that the instrument and my proposed method(s) of analysis were compatible right from the start. Then I carried out the research study and recorded all the data in a methodical way according to my intended methods of analysis. As part of the analysis, I reduced the data (by means of my preferred form of classification) to manageable thematic representation (tables, graphs, categories, etc). It was then that I began to realise what I had found.
Findings/resultsWhat had I found? What did the tables/graphs/categories etc. have to say that could be pinned down? It was easy enough for me to see the salient points at a glance from these records, but in writing my report, I also spelled out what I had found truly significant to make sure my readers did not miss it. For each display of results, I wrote a corresponding summary of important observations relating only elements within my own set of results and comparing only like with like. I was careful not to let my own interpretations intrude or voice my excitement just yet. I wanted to state the facts - just the facts. I dealt correctly with all inferential statistical procedures, applying tests of significance where appropriate to ensure both reliability and validity. I knew that I wanted my results to be as watertight and squeaky clean as possible. They would carry a great deal more credibility, strength and thereby academic 'clout' if I took no shortcuts and remained both rigorous and scholarly.
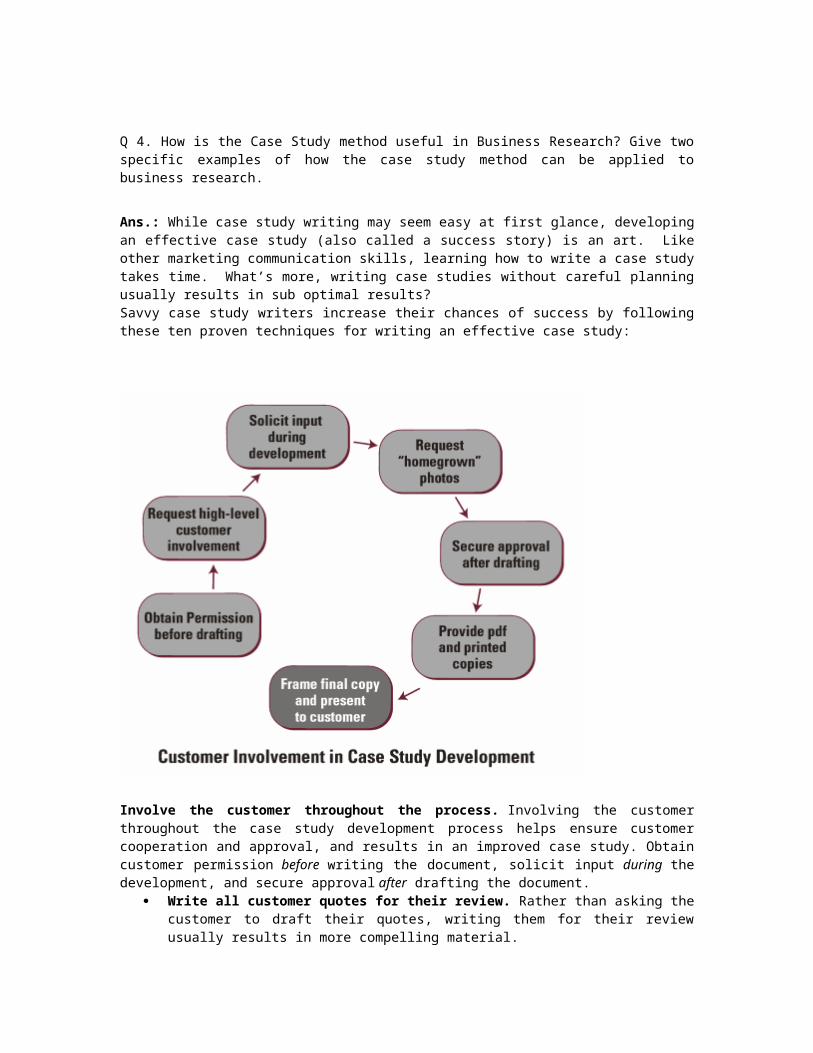
DiscussionNow I was free to let the world know the significance of my findings. What did I find in the results that answered my original research question? Why was I so sure I had some answers? What about the unexplained or unexpected findings? Had I interpreted the results correctly? Could there have been any other factors involved? Were my findings supported or contested by the results of similar studies? Where did that leave mine in terms of contribution to my field? Can I actually generalise from my findings in a breakthrough of some kind, or do I simply see myself as reinforcing existing knowledge? And so what, after all? There were some obvious limitations to my study, which, even so, I'll defend to the hilt. But I won't become over-apologetic about the things left undone, or the abandoned analyses, the fascinating byways sadly left behind. I have my memories...
ConclusionWe'll take a long hard look at this study from a broad perspective. How does it rate? How did I end up answering the question I first thought of? The conclusion needs to be a few clear, succinct sentences. That way, I'll know that I know what I'm talking about. I'll wrap up with whatever generalizations I can make, and whatever implications have arisen in my mind as a result of doing this thing at all. The more you find out, the more questions arise. How I wonder what you are ... how I speculate. OK, so where do we all go from here?
Three stages of research
1. Reading2. Research design and implementation3. Writing up the research report or thesis
Use an active, cyclical writing process: draft, check, reflect, revise, redraft.
Establishing good practice1. Keep your research question always in mind.2. Read widely to establish a context for your research.3. Read widely to collect information, which may relate to your topic, particularly to your
hypothesis or research question.4. Be systematic with your reading, note-taking and referencing records.5. Train yourself to select what you do need and reject what you don't need.6. Keep a research journal to reflect on your processes, decisions, state of mind, changes
of mind, reactions to experimental outcomes etc.7. Discuss your ideas with your supervisor and interested others.8. Keep a systematic log of technical records of your experimental and other research data,
remembering to date each entry, and noting any discrepancies or unexpected occurrences at the time you notice them.
9. Design your research approaches in detail in the early stages so that you have frameworks to fit findings into straightaway.
10. Know how you will analyse data so that your formats correspond from the start.Keep going back to the whole picture. Be thoughtful and think ahead about the way you will consider and store new information as it comes to light.
Q 1. Give examples of specific situations that would call for the following types of research,
explaining why – a) Exploratory research b) Descriptive research c) Diagnostic research d)
Evaluation research. (10 marks)
Research may be classified crudely according to its major intent or the methods. According to the intent, research may be classified as:
Basic (aka fundamental or pure) research is driven by a scientist's curiosity or interest in a scientific question. The main motivation is to expand man's knowledge, not to create or invent something. There is no obvious commercial value to the discoveries that result from basic research. For example, basic science investigations probe for answers to questions such as: • How did the universe begin? • What are protons, neutrons, and electrons composed of? • How do slime molds reproduce? • What is the specific genetic code of the fruit fly? Most scientists believe that a basic, fundamental understanding of all branches of science is needed in order for progress to take place. In other words, basic research lays down the foundation for the applied science that follows. If basic work is done first, then applied spin-offs often eventually result from this research. As Dr. George Smoot of LBNL says, "People cannot foresee the future well enough to predict what's going to develop from basic research. If we only did applied research, we would still be making better spears." Applied research is designed to solve practical problems of the modern world, rather than to acquire knowledge for knowledge's sake. One might say that the goal of the applied scientist is to improve the human condition.
Research in common parlance refers to a search for knowledge. The Advance Learner’s Dictionary of Current English defines the research as “careful investigation or inquiry through search for new facts in any branch of knowledge”. Redman and Mory defines research as “Systemized efforts to gain new knowledge”. Some people consider research as a movement, a movement from the known to unknown. According to Clifford Woody research compromises defining and redefining problems, formulating hypothesis or suggested solutions, collecting, organizing and evaluating data, making deductions and reaching conclusions and at last carefully testing the conclusions to determine whether they fit the formulating hypothesis. In general ‘research refers to the systematic method consisting of enunciation the problem, formulating a hypothesis, collecting the facts or data, analyzing the facts and researching certain conclusions ether in the form of solutions towards the concerned problem or in certain generalization for some theoretically formulation.Objectives: The main aim of research is to find out the truth which is hidden and has not been discovered yet. The research objectives are:
To gain familiarity with a phenomenon or to achieve new insight into it studies with this object in view are termed as exploratory or formulative research studies.
To portray accurately the characteristics of particular individual, situation or group. These are called descriptive research studies.
To determine the frequency with which something occurs or with which it is associated with something else. This study is known as diagnostic research study.
To test a hypothesis of a casual relationship between variables. Such study is known as testing research studies.
Motivation in Research : The possible motives for doing research may be either one or more of the following:
Desire to get a research degree along with its consequential benefits. Desire to face the challenge in solving the unsolved problems, i.e. concern over practical
problems initiates research. Desire to get intellectual joy of doing some creative work. Desire to be of service of society. Desire to get respectability.
a) Exploratory Research
It is also known as formulative research. It is preliminary study of an unfamiliar
problem about which the researcher has little or no knowledge. It is ill-structured and
much less focused on pre-determined objectives. It usually takes the form of a pilot
study. The purpose of this research may be to generate new ideas, or to increase the
researcher’s familiarity with the problem or to make a precise formulation of the
problem or to gather information for clarifying concepts or to determine whether it is
feasible to attempt the study. Katz conceptualizes two levels of exploratory studies.
“At the first level is the discovery of the significant variable in the situations; at the
second, the discovery of relationships between variables.”
b) Descriptive Study
It is a fact -finding investigation with adequate interpretation. It is the simplest type of
research. It is more specific than an exploratory research. It aims at identifying the
various characteristics of a community or institution or problem under study and also
aims at a classification of the range of elements comprising the subject matter of
study. It contributes to the development of a young science and useful in verifying
focal concepts through empirical observation. It can highlight important
methodological aspects of data collection and interpretation. The information
obtained may be useful for prediction about areas of social life outside the
boundaries of the research. They are valuable in providing facts needed for planning
social action program.
c) Diagnostic Study
It is similar to descriptive study but with a different focus. It is directed towards
discovering what is happening, why it is happening and what can be done about. It
aims at identifying the causes of a problem and the possible solutions for it. It may
also be concerned with discovering and testing whether certain variables are
associated. This type of research requires prior knowledge of the problem, its
thorough formulation, clear-cut definition of the given population, adequate methods
for collecting accurate information, precise measurement of variables, statistical
analysis and test of significance.
d) Evaluation Studies
It is a type of applied research. It is made for assessing the effectiveness of social or
economic programmes implemented or for assessing the impact of developmental
projects on the development of the project area. It is thus directed to assess or
appraise the quality and quantity of an activity and its performance, and to specify its
attributes and conditions required for its success. It is concerned with causal
relationships and is more actively guided by hypothesis. It is concerned also with
change over time.
Q 2.In the context of hypothesis testing, briefly explain the difference between a) Null and
alternative hypothesis b) Type 1 and type 2 error c) Two tailed and one tailed test d)
Parametric and non parametric tests. (10 marks)
Q 3. Explain the difference between a causal relationship and correlation, with an example of
each. What are the possible reasons for a correlation between two variables? (10 marks)
Q 4. Briefly explain any two factors that affect the choice of a sampling technique. What are
the characteristics of a good sample? (10 marks)
Q 5. Select any topic for research and explain how you will use both secondary and primary
sources to gather the required information. (10 marks)
Q 6.Case Study: You are engaged to carry out a market survey on behalf of a leading
Newspaper that is keen to increase its circulation in BangaloreCity, in order to ascertain
reader habits and interests. Develop a title for the study; define the research problem and the
objectives or questions be answered by the study. (10 marks)
MB0050 Research Methodology - 4 Credits
Assignment Set- 2 60 Marks
Note: Each question carries 10 Marks. Answer all the questions.
Q 1.Discuss the relative advantages and disadvantages of the different methods of
distributing questionnaires to the respondents of a study.(10 marks).
Q 2. In processing data, what is the difference between measures of central tendency and
measures of dispersion? What is the most important measure of central tendency and
dispersion? (10 marks).
Q 3. What are the characteristics of a good research design? Explain how the research design
for exploratory studies is different from the research design for descriptive and diagnostic
studies.( 10 marks).
Q 4. How is the Case Study method useful in Business Research? Give two specific examples
of how the case study method can be applied to business research. (10 marks).
Q 5. What are the differences between observation and interviewing as methods of data
collection? Give two specific examples of situations where either observation or interviewing
would be more appropriate.( 10 marks).
Q 6.Case Study: You are engaged to carry out a market survey on behalf of a leading
Newspaper that is keen to increase its circulation in BangaloreCity, in order to ascertain
reader habits and interests. What type of research report would be most appropriate? Develop
an outline of the research report with the main sections.(10 marks).
Fall 2010 Master of Business Administration – MBA Semester 3 MB0035 – Legal Aspects of Business - 3 Credits (Book ID: B0764) Assignment Set- 1 60 Marks Note: Each question carries 10 Marks. Answer all the questions.
Q.1 what do you mean by free consent? Under what circumstances consent is considered as free? Explain. [10 marks] One of the essential of a valid contract is free consent. Sec. 13 of the act defense consent has two or more persons are said to consent where they agree upon think in the same sense. There should be consents at the ad idem or identity of minds. The validity of consent depends not only on consents parties but their consents must also be free. According to section 14, consent is said to be free when it is not caused by 1) Coercion has defined under sec.15 or 2) Undue influence as defined under sec. 16 or 3) Fraud has defined under sec. 17 or 4) Mis-representation or defined under sec. 18 or 5) Mistake subject to the probations of sec. 21& 22. 1) Coercion: Sec. 15 “coercion is the committing or threatening to commit any act forbidden by the Indian penal code or the unlawful detaining or threatening to detain any property, to the prejudice of any
person whatever, with the intention of causing any person to enter into an agreement. “ It is immaterial weather the Indian penal code is or is not in force in the place where the coercion is employed. Under English Law, coercion must be applied to one’s person only whereas under Indian Law it can be one’s person or property. So also under English Law, the subject of it must be the contracting party himself or his wife, parent, child or other near relative. Under Indian Law, the act or threat may be against any person. It is to be noted that he act need not be committed in India itself. Unlawful detaining or threatening to detain any property it also coercion. While threat to sue does not amount to coercion threat to file a false suit amounts to coercion since Indian Penal Code forbids such an act. 2) Undue influence: In the words of Holland,” Undue influence refers to “the unconscious use of power over another person, such power being obtained by virtue of a present or previously existing dominating control arising out of relationship between the parties.” According sec. 16(1) “ A contract is said to be induced by undue influence where the relation subsisting between the parties are such that one of the parties is in a position to dominate the will of the other and uses that position to obtain an unfair advantage over the other.” A person is deemed to be in a position to dominate the will of other. (a) Where he holds a real or apparent authority over the other or where he stands in a fiduciary relation to the other; or (b) Where he makes a contract with a person whose mental capacity is temporarily or permanently affected by reason of age, illness or mental or bodily distress: (c) Where a person, who is in a position to dominate the will of another, enters into a contract with him and the transaction appears to be unconscionable. The burden of proving that such contract was not by undue influence shall lie upon the person in a position to dominate the will of the other. Both coercion and undue influence are closely related. What contributes coercion or undue influence depends upon the facts of each case. Sec. 16(i) provides that two elements must be present. The first one is that the relations subsisting between the parties to a contract are such that one of them is in a position to dominate the will of the other. Secondly, he uses that position to obtain unfair advantage over the other. In other words, unlike coercion undue influence must come from a party to the contract and not a stranger to it. Where the parties are not in equal footing or there is trust and confidence between the parties, one party may be able to dominate the will of the other and use the position to obtain an unfair advantage. However, where there is no relationship shown to exit from which undue influence is presumed, that influence must be proved. 3) Fraud:
A false statement made knowingly or without belief in its truth or recklessly careless whether it be true or false is called fraud. Sec. 17 of the act instead of defining fraud gives various acts which amount to fraud. Sec. 17: Fraud means and includes any of the following acts committed by a party to a contract or with his connivance or by his agent to induce him to enter into contract: 1) The suggestion that a fact is true when it is not true by one who does not believe it to be true. A false statement intentionally made is fraud. An absence of honest belief in the truth of the statement made is essential to constitute fraud. The false statement must be made intentionally. 2) The active concealment of a fact by a person who has knowledge or belief of the fact. Mere non-disclosure is not fraud where there is no duty to disclose. 3) A promise made without any intention of performing it. 4) Any other act fitted to deceive. The fertility of man’s invention in devising new schemes of fraud is so great that it would be difficult to confine fraud within the limits of any exhaustive definition. 5) Any such act or omission as the law specially declares to be fraudulent. 4) Misrepresentation: Before entering into a contract, the parties will may certain statements inducing the contract. Such statements are called representation. A representation is a statement of fact made by one party to the other at the time of entering into contract with an intention of inducing the other party to enter into the contract. If the representation is false or misleading, it is known as misrepresentation. A misrepresentation may be innocent or intentional. An intentional misrepresentation is called fraud and is covered under section 17 sec. 18 deals with an innocent misrepresentation. 5) Mistake: Usually, mistake refers to misunderstanding or wrong thinking or wrong belief. But legally, its meaning is restricted and is to mean “operative mistake”. Courts recognize only such mistakes, which invalidate the contract. Mistake may be mistake of fact or mistake of law. Sec. 20”Where both parties to an agreement are under a mistake as to a matter of fact essential to the agreement, the agreement is void”. Sec.21” A contract is not voidable because it was caused by a mistake as to any law in force in India: but a mistake as to a law not in force in India has the same effect as a mistake of fact”. Bilateral mistake: Sec.20 deals with bilateral mistake. Bilateral mistake is one where there is no real correspondence of offer and acceptance. The parties are not really in consensus-ad-item. Therefore there is no agreement at all. A bilateral mistake may be regarding the subject matter or the possibility of performing the contract.
Q.2 Define negotiable instrument. What are its features and characteristics? Which are the different types of negotiable instruments? If Mr. A is the holder of a negotiable instrument, under what situations
1. Will he be the Holder in due course?
2. He has the right to discharge?
3. He can make endorsements? [10 marks] Meaning of Negotiable Instruments To understand the meaning of negotiable instruments let us take a few examples of day-to-day business transactions. Suppose Pitamber, a book publisher has sold books to Prashant for Rs 10,000/- on three months credit. To be sure that Prashant will pay the money after three months, Pitamber may write an Order addressed to Prashant that he is to pay after three months, for value of goods received by him, Rs.10, 000/- to Pitamber or anyone holding the order and presenting it before him (Prashant) for payment. This written document has to be signed by Prashant to show his acceptance of the order. Now, Pitamber can hold the document with him for three months and on the due date can collect the money from Prashant. He can also use it for meeting different business transactions. For instance, after a month, if required, he can borrow money from Sunil for a period of two months and pass on this document to Sunil. He has to write on the back of the document an instruction to Prashant to pay money to Sunil, and sign it. Now Sunil becomes the owner of this document and he can claim money from Prashant on the due date. Sunil, if required, can further pass on the document to Amit after instructing and signing on the back of the document. This passing on process may continue further till the final payment is made. In the above example, Prashant who has bought books worth Rs. 10,000/- can also give an undertaking stating that after three month he will pay the amount to Pitamber. Now Pitamber can retain that document with himself till the end of three months or pass it on to others for meeting certain business obligation (like with Sunil, as discussed above) before the expiry of that three months time period. You must have heard about a cheque. What is it? It is a document issued to a bank that entitles the person whose name it bears to claim the amount mentioned in the cheque. If he wants, he can transfer it in favour of another person. For example, if Akash issues a cheque worth Rs. 5,000/ - In favour of Bidhan, then Bidhan can claim Rs. 5,000/- from the bank, or he can transfer it to Chander to meet any business obligation, like paying back a loan that he might have taken from Chander. Once he does it, Chander gets a right to Rs. 5,000/- and he can transfer it to Dayanand,
if required. Such transfers may continue till the payment is finally made to somebody. In the above examples, we find that there is certain documents used for payment in business transactions and are transferred freely from one person to another. Such documents are called Negotiable Instruments. Thus, we can say negotiable instrument is a transferable document, where negotiable means transferable and instrument means document. To elaborate it further, an instrument, as mentioned here, is a document used as a means for making some payment and it is negotiable i.e., its ownership can be easily transferred. Thus, negotiable instruments are documents meant for making payments, the ownership of which can be transferred from one person to another many times before the final payment is made. Definition of Negotiable Instrument According to section 13 of the Negotiable Instruments Act, 1881, a negotiable instrument means “promissory note, bill of exchange, or cheque, payable either to order or to bearer”. Types of Negotiable Instruments According to the Negotiable Instruments Act, 1881 there are just three types of negotiable instruments i.e., promissory note, bill of exchange and cheque. However many other documents are also recognized as negotiable instruments on the basis of custom and usage, like hundis, treasury bills, share warrants, etc., provided they possess the features of negotiability. In the following sections, we shall study about Promissory Notes (popularly called pronotes), Bills of Exchange (popularly called bills), Cheque and Hundis (a popular indigenous document prevalent in India), in detail. i. Promissory Note Suppose you take a loan of Rupees Five Thousand from your friend Ramesh. You can make a document stating that you will pay the money to Ramesh or the bearer on demand. Or you can mention in the document that you would like to pay the amount after three months. This document, once signed by you, duly stamped and handed over to Ramesh, becomes a negotiable instrument. Now Ramesh can personally present it before you for payment or give this document to some other person to collect money on his behalf. He can endorse it in somebody else’s name who in turn can endorse it further till the final payment is made by you to whosoever presents it before you. This type of a document is called a Promissory Note. Section 4 of the Negotiable Instruments Act, 1881 defines a promissory note as ‘an instrument in writing (not being a bank note or a currency note) containing an unconditional undertaking, signed by the maker, to pay a certain sum of money only to or to the order of a certain person or to the bearer of the instrument’. Specimen of a Promissory Note Rs. 10,000/- New Delhi
September 25, 2002 On demand, I promise to pay Ramesh, s/o RamLal of Meerut or order a sum of Rs 10,000/- (Rupees Ten Thousand only), for value received. To, Ramesh Sd/ Sanjeev Address… Stamp Features of a promissory note Let us know the features of a promissory note. i. A promissory note must be in writing, duly signed by its maker and properly stamped as per Indian Stamp Act. ii. It must contain an undertaking or promise to pay. Mere acknowledgement of indebtedness is not enough. For example, if some one writes ‘I owe Rs. 5000/- to Satya Prakash’, it is not a promissory note. iii. The promise to pay must not be conditional. For example, if it is written ‘I promise to pay Suresh Rs 5,000/- after my sister’s marriage’, is not a promissory note. iv. It must contain a promise to pay money only. For example, if some one writes ‘I promise to give Suresh a Maruti car’ it is not a promissory note. v. the parties to a promissory note, i.e. the maker and the payee must be certain. vi. A promissory note may be payable on demand or after a certain date. For example, if it is written ‘three months after date I promise to pay Satinder or order a sum of rupees Five Thousand only’ it is a promissory note. vii. The sum payable mentioned must be certain or capable of being made certain. It means that the sum payable may be in figures or may be such that it can be calculated. ii. Bill of Exchange Suppose Rajeev has given a loan of Rupees Ten Thousand to Sameer, which Sameer has to return. Now, Rajeev also has to give some money to Tarn. In this case, Rajeev can make a document Directing Sameer to make payment up to Rupees Ten Thousand to Tarn on demand or after expiry of a specified period. This document is called a bill of exchange, which can be transferred to some other person’s name by Tarn. Section 5 of the Negotiable Instruments Act, 1881 defines a bill of exchange as ‘an instrument in writing containing an unconditional order, signed by the maker, directing a certain person to pay a certain sum of money only to or to the order of a certain person, or to the bearer of the instrument’. iii. ChequesCheque is a very common form of negotiable instrument. If you have a savings bank account or current account in a bank, you can issue a cheque in your own name or in favour of others, thereby directing the bank to pay the specified amount to the person named in the cheque. Therefore, a cheque may be regarded as a bill of exchange; the only difference is that the bank is always the drawee in case of a cheque. The Negotiable Instruments Act, 1881 defines a cheque as a bill of exchange drawn on a
specified banker and not expressed to be payable otherwise than on demand. Actually, a cheque is an order by the account holder of the bank directing his banker to pay on demand, the specified amount, to or to the order of the person named therein or to the bearer. iv. Hundis A Hundi is a negotiable instrument by usage. It is often in the form of a bill of exchange drawn in any local language in accordance with the custom of the place. Some times it can also be in the form of a promissory note. A Hundi is the oldest known instrument used for the purpose of transfer of money without its actual physical movement. The provisions of the Negotiable Instruments Act shall apply to hundis only when there is no customary rule known to the people. Types of Hundis There are a variety of hundis used in our country. Let us discuss some of the most common ones. Shah-jog Hundi: one merchant draws this on another, asking the latter to pay the amount to a Shah. Shah is a respectable and responsible person, a man of worth and known in the bazaar. A shah-jog Hundi passes from one hand to another till it reaches a Shah, who, after reasonable enquiries, presents it to the drawee for acceptance of the payment. Darshani Hundi: This is a Hundi payable at sight. The holder must present it for payment within a reasonable time after its receipt. Thus, it is similar to a demand bill. Muddati Hundi: A Muddati or miadi Hundi is payable after a specified period of time. This is similar to a time bill. There are few other varieties like Nam-jog Hundi, Dhani-jog Hundi, and Jawabee Hundi, Jokhami Hundi, Fireman-jog Hundi, etc. Features of Negotiable Instruments After discussing the various types of negotiable instruments let us sum up their features as under. A negotiable instrument is freely transferable. Usually, when we transfer any property to somebody, we are required to make a transfer deed, get it registered, pay stamp duty, etc. But, such formalities are not required while transferring a negotiable instrument. The ownership is changed by mere delivery (when payable to the bearer) or by valid endorsement and delivery (when payable to order). Further, while transferring it is also not required to give a notice to the previous holder. ii. Negotiability confers absolute and good title on the transferee. It means that a person who receives a negotiable instrument has a clear and undisputable title to the instrument. However, the title of the receiver will be absolute, only if he has got the instrument in good faith and for a consideration. Also the receiver should have no knowledge of the previous holder having any defect in his title. Such a person is known as holder in due course. For example, suppose Rajeev issued a bearer cheque payable to Sanjay. A person, who passed it on to Girish, stole it from
Sanjay. If Girish received it in good faith and for value and without knowledge of cheque having been stolen, he will be entitled to receive the amount of the cheque. Here Girish will be regarded as ‘holder in due course’. iii. A negotiable instrument must be in writing. This includes handwriting, typing, computer print out and engraving, etc. iv. In every negotiable instrument there must be an unconditional order or promise for payment. v. The instrument must involve payment of a certain sum of money only and nothing else. For example, one cannot make a promissory note on assets, securities, or goods. vi. The time of payment must be certain. It means that the instrument must be payable at a time which is certain to arrive. If the time is mentioned as ‘when convenient’ it is not a negotiable instrument. However, if the time of payment is linked to the death of a person, it is nevertheless a negotiable instrument as death is certain, though the time thereof is not. vii. The payee must be a certain person. It means that the person in whose favour the instrument is made must be named or described with reasonable certainty. The term ‘person’ includes individual, body corporate, trade unions, even secretary, director or chairman of an institution. The payee can also be more than one person. viii. A negotiable instrument must bear the signature of its maker. Without the signature of the drawer or the maker, the instrument shall not be a valid one. ix. Delivery of the instrument is essential. Any negotiable instrument like a cheque or a promissory note is not complete till it is delivered to its payee. For example, you may issue a cheque in your brother’s name but it is not a negotiable instrument till it is given to your brother. x. Stamping of Bills of Exchange and Promissory Notes is mandatory. This is required as per the Indian Stamp Act, 1899. The value of stamp depends upon the value of the promote or bill and the time of their payment. Negotiation and indorsement Persons other than the original obligor and obligee can become parties to a negotiable instrument. The most common manner in which this is done is by placing one's signature on the instrument (“indorsement”): if the person who signs does so with the intention of obtaining payment of the instrument or acquiring or transferring rights to the instrument, the signature is called anin do rse me nt. There are four types of indorsements contemplated by the Code: • An indorsement which purports to transfer the instrument to a specified person is a special indorsement; • An indorsement by the payee or holder which does not contain any additional notation (thus puporting to make the instrument payable to bearer) is an indorsement in blank; • An indorsement which purports to require that the funds be applied in a certain manner (i.e. "for deposit only", "for collection") is a restrictive indorsement; and,
• An indorsement purporting to disclaim retroactive liability is called aqu a lif ied indorsement (through the inscription of the words "without recourse" as part of the indorsement on the instrument or in allonge to the instrument). If a note or draft is negotiated to a person who acquires the instrument 1.in good faith; 2.for value; 3.without notice of any defenses to payment, the transferee is a holder in due course and can enforce the instrumentwit ho u t being subject to defenses which the maker of the instrument would be able to assert against the original payee, except for certain real defenses. These real defenses include (1) forgery of the instrument; (2) fraud as to the nature of the instrument being signed; (3) alteration of the instrument; (4) incapacity of the signer to contract; (5) infancy of the signer; (6) duress; (7) discharge in bankruptcy; and, (8) the running of a statute of limitations as to the validity of the instrument. The holder-in-due-course rule is a rebuttable presumption that makes the free transfer of negotiable instruments feasible in the modern economy. A person or entity purchasing an instrument in the ordinary course of business can reasonably expect that it will be paid when presented to, and not subject to dishonor by, the maker, without involving itself in a dispute between the maker and the person to whom the instrument was first issued (this can be contrasted to the lesser rights and obligations accruing to mere holders). Article 3 of the Uniform Commercial Code as enacted in a particular State's law contemplate real defenses available to purported holders in due course. The foregoing is the theory and application presuming compliance with the relevant law. Practically, the obligor-payor on an instrument who feels he has been defrauded or otherwise unfairly dealt with by the payee may nonetheless refuse to pay even a holder in due course, requiring the latter to resort to litigation to recover on the instrument.
Q.3. a. Distinguish between guarantee and indemnity. [5 marks] b. Give a short note on Rights of Surety. [5 marks]
Indemnity Guarantee
Comprise only two parties- the indemnifier and the indemnity holder
There are three parties namely the surety, principal debtor and thecre d ito r
Liability of the indemnifier is primary
The liability of the surety is secondary. The surety is liable only if the principal debtor makes a default. The primary liability being that of the principal debtor
The indemnifier need not The surety give guarantee only
necessarily act at the request of the indemnified
at the request of the principal debtor
The possibility of any loss happening is the only contingency against which the indemnifier undertakes to indemnify
There is an existingdebt or duty, the performance of which is guarantee by the surety
Ans.: Joint sureties or debtors: Where several persons are bound together in any bond, bill or other writing as joint debtors or as joint sureties, in any sum of money made payable to any person, his/her executors, administrators, order or assign and such bond, bill, or other writing shall be paid by any of such joint debtors or joint sureties, the creditor shall assign such bond, bill, or other writing, to the person paying the same; and such assignee shall, in his/her own name, as assignee, or otherwise, have such action or remedy as the creditor himself/herself might have had against the other joint debtors, or sureties, or their representatives, to recover such proportion of the money, so paid, as may be justly due from the defendants. Defense of infancy to joint sureties or debtors: Where several persons are bound together in any bond, bill or other writing or judgment as joint debtors or as joint sureties, in any sum of money, made payable to any person or corporation, the executors, administrators, successors, order or assigns, and 1 or more of such persons was, at the time of making, signing or executing the same, or at the time of the rendition of such judgment, an infant, such fact shall be no defense in any action, proceeding or suit for the enforcement of the liability of those bound there under, excepting as regards the person who was an infant at the time of making, signing or executing such bond, bill or other writing, or who was an infant at the time such judgment was rendered. Rights of surety or of joint debtor on payment of judgment: (a) If a judgment recovered against principal and surety shall be paid by the surety, the creditor shall mark such judgment to the use of the surety so paying the same; and the transferee shall, in the name of the plaintiff, have the same remedy by execution or other process against the principal debtor as the creditor could have had, the transfer by marking to the use of the surety being first filed of record in the court where the judgment is. (b) Where there is a judgment against several debtors or sureties and any of them shall pay the whole, the creditor shall mark such judgment to the use of the persons so paying the same; and the transferee shall, in the name of the plaintiff, be entitled to an execution or other process against the other debtors or sureties in the judgment, for a proportion able part of the debt or damages paid by such transferee; but, no defendant shall be debarred of any remedy against the
plaintiff or the plaintiff's representatives or assigns by any legal or equitable course of proceeding whatever.
Q.4. a. Mention the remedies for breach of contract. How will the injured party claim it? [8 marks] b. What is the difference between anticipatory and actual breach? [2 marks] Ans.: Breach of Contract & Remedies: Nature of breach A breach of contract occurs where a party to a contract fails to perform, precisely and exactly, his obligations under the contract. This can take various forms for example, the failure to supply goods or perform a service as agreed. Breach of contract may be either actual or anticipatory. Actual breach occurs where one party refuses to form his side of the bargain on the due date or performs incompletely. For example: Poussard v Spiers and Bettini v Gye. Anticipatory breach occurs where one party announces, in advance of the due date for performance, that he intends not to perform his side of the bargain. The innocent party may sue for damages immediately the breach is announced. Hochster v De La Tour is an example. Effects of breach A breach of contract, no matter what form it may take, always entitles the innocent party to maintain an action for damages, but the rule established by a long line of authorities is that the right of a party to treat a contract as discharged arises only in three situations. The breaches, which give the innocent party the option of terminating the contract, are: (a) Renunciation Renunciation occurs where a party refuses to perform his obligations under the contract. It may be either express or implied. Hochster v De La Tour is a case law example of express renunciation. Renunciation is implied where the reasonable inference from the defendant’s conduct is that he no longer intends to perform his side of the contract. For example: Omnium D’Enterprises v Sutherland. (b) Breach of condition The second repudiator breach occurs where the party in default has committed a breach of condition. Thus, for example, in Poussard v Spiers the employer had a right to terminate the soprano’s employment when she failed to arrive for performances. (c) Fundamental breach The third repudiator breach is where the party in breach has committed a serious (or fundamental) breach of an in nominate term or totally fails to perform the contract. A repudiator breach does not automatically bring the contract to an end. The innocent party has two options: He may treat the contract as discharged and bring an action for damages for breach of contract immediately. This is what occurred in, for example, Hochster v De La Tour. He may elect to treat the contract as still valid, complete his side of the bargain and then sue for
payment by the other side. For example, White and Carter Ltd v McGregor. 2 Introduction to remedies Damages are the basic remedy available for a breach of contract. It is a common law remedy that can be claimed as of right by the innocent party. Ans.: Breach of Contract & Remedies: Nature of breach A breach of contract occurs where a party to a contract fails to perform, precisely and exactly, his obligations under the contract. This can take various forms for example, the failure to supply goods or perform a service as agreed. Breach of contract may be either actual or anticipatory. Actual breach occurs where one party refuses to form his side of the bargain on the due date or performs incompletely. For example: Poussard v Spiers and Bettini v Gye. Anticipatory breach occurs where one party announces, in advance of the due date for performance, that he intends not to perform his side of the bargain. The innocent party may sue for damages immediately the breach is announced. Hochster v De La Tour is an example. Effects of breach A breach of contract, no matter what form it may take, always entitles the innocent party to maintain an action for damages, but the rule established by a long line of authorities is that the right of a party to treat a contract as discharged arises only in three situations. The breaches, which give the innocent party the option of terminating the contract, are: (a) Renunciation Renunciation occurs where a party refuses to perform his obligations under the contract. It may be either express or implied. Hochster v De La Tour is a case law example of express renunciation. Renunciation is implied where the reasonable inference from the defendant’s conduct is that he no longer intends to perform his side of the contract. For example: Omnium D’Enterprises v Sutherland. (b) Breach of condition The second repudiator breach occurs where the party in default has committed a breach of condition. Thus, for example, in Poussard v Spiers the employer had a right to terminate the soprano’s employment when she failed to arrive for performances. (c) Fundamental breach The third repudiator breach is where the party in breach has committed a serious (or fundamental) breach of an in nominate term or totally fails to perform the contract. A repudiator breach does not automatically bring the contract to an end. The innocent party has two options: He may treat the contract as discharged and bring an action for damages for breach of contract immediately. This is what occurred in, for example, Hochster v De La Tour. He may elect to treat the contract as still valid, complete his side of the bargain and then sue for payment by the other side. For example, White and Carter Ltd v McGregor. 2 Introduction to remedies Damages are the basic remedy available for a breach of contract. It is a common law remedy that can be claimed as of right by the innocent party.
In order to recover substantial damages the innocent party must show that he has suffered actual loss; if there is no actual loss he will only be entitled to nominal damages in recognition of the fact that he has a valid cause of action. In making an award of damages, the court has two major considerations: Remoteness – for what consequences of the breach is the defendant legally responsible? The measure of damages – the principles upon which the loss or damage is evaluated or quantified in monetary terms. The second consideration is quite distinct from the first, and can be decided by the court only after the first has been determined. 2.Remoteness of loss The rule governing remoteness of loss in contract was established in Hadley v Baxendale. The court established the principle that where one party is in breach of contract, the other should receive damages which can fairly and reasonably be considered to arise naturally from the breach of contract itself (‘in the normal course of things’), or which may reasonably be assumed to have been within the contemplation of the parties at the time they made the contract as being the probable result of a breach. Thus, there are two types of loss for which damages may be recovered: 1. What arises naturally; and 2. What the parties could foresee when the contract was made as the likely result of breach. As a consequence of the first limb of the rule in Hadley v Baxendale, the party in breach is deemed to expect the normal consequences of the breach, whether he actually expected them or not. Under the second limb of the rule, the party in breach can only be held liable for abnormal consequences where he has actual knowledge that the abnormal consequences might follow or where he reasonably ought to know that the abnormal consequences might follow – Victoria Laundry v Newman Industries. 3.The measure (or quantum) of damages In assessing the amount of damages payable, the courts use the following principles: The amount of damages is to compensate the claimant for his loss not to punish the defendant. Damages are compensatory – not restitutionary. The most usual basis of compensatory damages is to put the innocent party into the same financial position he would have been in had the contract been properly performed. This is sometimes called the ‘expectation loss’ basis. In Victoria Laundry v Newman Industries, for example, Victoria Laundry were claiming for the profits they would have made had the boiler been installed on the contractually agreed date. Sometimes a claimant may prefer to frame his claim in the alternative on the ‘reliance loss’ basis and thereby recover expenses incurred in anticipation of performance and wasted as a result of the breach – Anglia Television v Reed. In a contract for the sale of goods, the statutory (Sale of
Goods Act 1979) measure of damages is the difference between the market price at the date of the breach and the contract price, so that only nominal damages will be awarded to a claimant buyer or claimant seller if the price at the date of breach was respectively less or more than the contract price. In fixing the amount of damages, the courts will usually deduct the tax (if any) which would have been payable by the claimant if the contract had not been broken. Thus if damages are awarded for loss of earnings, they will normally be by reference to net, not gross, pay. Difficulty in assessing the amount of damages does not prevent the injured party from receiving them: Chaplin v Hicks. In general, damages are not awarded for non-pecuniary loss such as mental distress and loss of enjoyment. Exceptionally, however, damages are awarded for such losses where the contract’s purpose is to promote happiness or enjoyment, as is the situation with contracts for holidays – Jarvis v Swan Tours. The innocent party must take reasonable steps to mitigate (minimise) his loss, for example, by trying to find an alternative method of performance of the contract: Brace v Calder. 4.Liquidated damages clauses and penalty clauses If a contract includes a provision that, on a breach of contract, damages of a certain amount or calculable at a certain rate will be payable, the courts will normally accept the relevant figure as a measure of damages. Such clauses are called liquidated damages clauses. The courts will uphold a liquidated damages clause even if that means that the injured party receives less (or more as the case may be) than his actual loss arising on the breach. This is because the clause setting out the damages constitutes one of the agreed contractual terms – Cellulose Acetate Silk Co Ltd v Widnes Foundry Ltd. However, a court will ignore a figure for damages put in a contract if it is classed as a penalty clause – that is, a sum which is not a genuine pre-estimate of the expected loss on breach. This could be the case whereSometimes a claimant may prefer to frame his claim in the alternative on the ‘reliance loss’ basis and thereby recover expenses incurred in anticipation of performance and wasted as a result of the breach – Anglia Television v Reed. In a contract for the sale of goods, the statutory (Sale of Goods Act 1979) measure of damages is the difference between the market price at the date of the breach and the contract price, so that only nominal damages will be awarded to a claimant buyer or claimant seller if the price at the date of breach was respectively less or more than the contract price. In fixing the amount of damages, the courts will usually deduct the tax (if any) which would have been payable by the claimant if the contract had not been broken. Thus if
damages are awarded for loss of earnings, they will normally be by reference to net, not gross, pay. Difficulty in assessing the amount of damages does not prevent the injured party from receiving them: Chaplin v Hicks. In general, damages are not awarded for non-pecuniary loss such as mental distress and loss of enjoyment. Exceptionally, however, damages are awarded for such losses where the contract’s purpose is to promote happiness or enjoyment, as is the situation with contracts for holidays – Jarvis v Swan Tours. The innocent party must take reasonable steps to mitigate (minimise) his loss, for example, by trying to find an alternative method of performance of the contract: Brace v Calder. 4.Liquidated damages clauses and penalty clauses If a contract includes a provision that, on a breach of contract, damages of a certain amount or calculable at a certain rate will be payable, the courts will normally accept the relevant figure as a measure of damages. Such clauses are called liquidated damages clauses. The courts will uphold a liquidated damages clause even if that means that the injured party receives less (or more as the case may be) than his actual loss arising on the breach. This is because the clause setting out the damages constitutes one of the agreed contractual terms – Cellulose Acetate Silk Co Ltd v Widnes Foundry Ltd. However, a court will ignore a figure for damages put in a contract if it is classed as a penalty clause – that is, a sum which is not a genuine pre-estimate of the expected loss on breach. This could be the case whereb. What is the difference between anticipatory and actual breach? Ans.: Anticipatory Breach: A seller and a buyer have entered into a contract. Prior to the start of the contract, the buyer informs the seller that he no longer requires his goods. The seller writes back stating his intention to store the goods until the contract expires and then sue for a breach of contract. The buyer replies with an angry letter stating that he could just sell the goods to someone else. Advise all parties. Actual breach: A breach of contract occurs where a party to a contract fails to perform, precisely and exactly, his obligations under the contract. This can take various forms for example, the failure to supply goods or perform a service as agreed. Breach of contract may be either actual or anticipatory. Actual breach occurs where one party refuses to form his side of the bargain on the due date or performs incompletely. For example: Poussard v Spiers and Bettini v Gye.
Q. 5 a. Explain the term Privity of contract. [3 marks] b. Define a company? What are the features of Joint Stock Company? [7 marks] Ans.: Privity of contract:
The doctrine of privity in contract law provides that a contract cannot confer rights or impose obligations arising under it on any person or agent except the parties to it. The premise is that only parties to contracts should be able to sue to enforce their rights or claim damages as such. However, the doctrine has proven problematic due to its implications upon contracts made for the benefit of third parties who are unable to enforce the obligations of the contracting parties. Third-party rights: Privity of contract occurs only between the parties to the contract, most commonly contract of sale of goods or services. Horizontal privity arises when the benefits from a contract are to be given to a third party. Vertical privity involves a contract between two parties, with an independent contract between one of the parties and another individual or company. If a third party gets a benefit under a contract, it does not have the right to go against the parties to the contract beyond its entitlement to a benefit. An example of this occurs when a manufacturer sells a product to a distributor and the distributor sells the product to a retailer. The retailer then sells the product to a consumer. There is no privity of contract between the manufacturer and the consumer. This, however, does not mean that the parties do not have another form of action e.g.Don og h ue v. Stevenson – here a friend of Ms. Donoghue bought her a bottle of ginger beer, which was defective. Specifically, the ginger beer contained the partially decomposed remains of a snail. Since the contract was between her friend and the shop owner, Mrs. Donoghue could not sue under the contract, but it was established that the manufacturer has a duty of care owed to their consumers and she was awarded damages in tort. Privity is the legal term for a close, mutual, or successive relationship to the same right of property or the power to enforce a promise or warranty. b. Define a company? What are the features of Joint Stock Company? Ans.: Company: The term ‘company’ implies an association of a number of persons for some common objective e.g. to carry on a business concern, to promote art, science or culture in the society, to run a sport club etc. Every association, however, may not be a company in the eyes of law as the legal import of the word ‘company’ is different from its common parlance meaning. In legal terminology its use is restricted to imply an association of persons,’ registered as a company' under the law of the land. The following are some of the definitions of the company given by legal luminaries and scholars of law. “Company means a company formed and registered under this Act or an existing company. Existing company means a company formed and registered under the previous company laws.” Companies Act, 1956 Sec. 3(i & ii)
A joint stock company is an artificial person invisible, intangible and existing only in the eyes of law. Being a mere creature of law, it possesses only those properties which the charter of its creation confers upon it, either expressly or as incidental to its very existence.” – Justice Marshall “A company is an association of many persons who contribute money or money’s worth to a common stock and employ it in some common trade or business and who share the profit or loss arising there from. The common stock so contributed is denoted in terms of money and is the capital of the company. The persons who contribute it or to whom it belongs are members. The proportion of capital to which each member is entitled is his share. Shares are always transferable although the right to transfer them is often more or less restricted." - Lord Lindley From the above definitions it is clear that a company has a corporate and legal personality. It is an artificial person and exists only in the eyes of law. It has an independent legal entity, a common seal and perpetual succession. Sometimes, the term ‘corporation’ (a word derived from the Latin word ‘corpus’ which means body) is also used for a company. At present the companies in India are incorporated under the Companies Act, 1956. Characteristics of Joint Stock Company: The various definitions reveal the following essential characteristics of a company 1. Artificial Person: A company is an association of persons who have agreed to form the company and become its members or shareholders with the object of carrying on a lawful business for profit. It comes into existence when it is registered under the Companies Act. The law treats it as a legal person as it can conduct lawful business and enter into contracts with other persons in its own name. It can sell or purchase property. It can sue and be sued in its name. It cannot be regarded as an imaginary person because it has a legal existence. Thus company is an artificial person created by law. 2. Independent corporate existence: A company has a separate independent corporate existence. It is in law a person. Its entity is always separate from its members. The property of the company belongs to it and not to the shareholders. The company cannot be held liable for the acts of the members and the members can not be held liable for the acts or wrongs or misdeeds of the company. Once a company is incorporated, it must be treated like any other independent person. As a consequence of separate legal entity, the company may enter into contracts with its members and vice-versa. 3. Perpetual existence: The attribute of separate entity also provides a company a perpetual existence, until dissolved by law. Its life remains unaffected by the lunacy, insolvency or death of its members. The members may come and go but the company can go on forever. Law creates it and the law alone can dissolve it. 4. Separate property: A company, being a legal entity, can buy and own property in its own
name. And, being a separate entity, such property belongs to it alone. Its members are not the joint owners of the property even though it is purchased out of funds contributed by them. Consequently, they do not have even insurable interest in the property of the company. The property of the company is not the property of the shareholders; it is the property of the company. 5. Limited liability: In the case of companies limited by shares the liability of every member of the company is limited to the amount of shares subscribed by him. If the member has paid full amount of the face value of the shares subscribed by him, his liability shall be nil and he cannot be asked to contribute anything more. Similarly, in the case of a company limited by guarantee, the liability of the members is limited up to the amount guaranteed by a member. The Companies Act, however, permits the formation of companies with unlimited liability. But such companies are very rare. 6. Common seal: As a company is devoid of physique, it can’t act in person like a human being. Hence it cannot sign any documents personally. It has to act through a human agency known as Directors. Therefore, every company must have a seal with its name engraved on it. The seal of the company is affixed on the documents, which require the approval of the company. Two Directors and the Secretary or such other person as the Board may authorize for this purpose, witness the affixation of the seal. Thus, the common seal is the official signature of the company. 7. Transferability of shares: The shares of a company are freely transferable and can be sold or purchased through the Stock Exchange. A shareholder can transfer his shares to any person without the consent of other members. Under the articles of association, even a public limited company can put certain restrictions on the transfer of shares but it cannot altogether stop it. A shareholder of a public limited company possessing fully paid up shares is at liberty to transfer his shares to anyone he likes in accordance with the manner provided for in the articles of association of the company. However, private limited company is required to put certain restrictions on transferability of its shares. But any absolute restriction on the right of transfer of shares is void 8. Capacity to sue and be sued: A company, being a body corporate, can sue and be sued in its own name.
Q. 6. Om is enrolled in a managerial course. He has to write an assignment on company management and various types of meetings that a company holds. You are asked to help him in preparing the assignment. [10 marks]
Ans.: There are many types of businesses, and because of this, businesses are classified in many ways. One of the most common focuses on the primary profit-generating activities of a business: • Agriculture and mining businesses are concerned with the production of raw material, such as plants or minerals. • Financial businesses include banks and other companies that generate profit through investment and management of capital. • Information businesses generate profits primarily from the resale of intellectual property and include movie studios, publishers and packaged software companies. • Manufacturers produce products, from raw materials or component parts, which they then sell at a profit. Companies that make physical goods, such as cars or pipes, are considered manufacturersReal estate businesses generate profit from the selling, renting, and development of properties, homes, and buildings. • Retailers and Distributors act as middle-men in getting goods produced by manufacturers to the intended consumer, generating a profit as a result of providing sales or distribution services. Most consumer-oriented stores and catalogue companies are distributors or retailers. See also: Franchising • Service businesses offer intangible goods or services and typically generate a profit by charging for labor or other services provided to government, other businesses, or consumers. Organizations ranging from house decorators to consulting firms, restaurants, and even entertainers are types of service businesses. • Transportation businesses deliver goods and individuals from location to location, generating a profit on the transportation costs • Utilities produce public services, such as heat, electricity, or sewage treatment, and are usually government chartered. There are many other divisions and subdivisions of businesses. The authoritative list of business types for North America is generally considered to be the North American Industry Classification System, or NAICS. The equivalent European Union list is the Statistical Classification of Economic Activities in the European Community (NACE). Management The efficient and effective operation of a business, and study of this subject, is called management. The main branches of management are financial management, marketing management, human resource management, strategic management, production management, operation management, service management and information technology management. Reforming State Enterprises In recent decades, assets and enterprises that were run by various states have been modeled after business enterprises. In 2003, the People's Republic of China reformed 80% of itsst at e - owned enterprises and modeled them on a company-type management system.[2] Many state institutions and enterprises in China and Russia have been transformed into joint-stock companies, with part of their shares being listed on public stock markets. Organization and government regulation
Most legal jurisdictions specify the forms of ownership that a business can take, creating a body of commercial law for each type. The major factors affecting how a business is organized are usually: The Bank of England in Threadneedle Street, London, England. • The size, scope of the business firm and its structure, management, and ownership, broadly analyzed in the theory of the firm. Generally a smaller business is more flexible, while larger businesses, or those with wider ownership or more formal structures, will usually tend to be organized as partnerships or (more commonly) corporations. In addition a business that wishes to raise money on a stock market or to be owned by a wide range of people will often be required to adopt a specific legal form to do so. • The sector and country. Private profit making businesses are different from government owned bodies. In some countries, certain businesses are legally obliged to be organized in certain ways. • Limited liability. Corporations, limited liability partnerships, and other specific types of business organizations protect their owners or shareholders from business failure by doing business under a separate legal entity with certain legal protections. In contrast, unincorporated businesses or persons working on their own are usually not so protected. Tax advantages. Different structures are treated differently in tax law, and may have advantages for this reason. • Disclosure and compliance requirements. Different business structures may be required to make more or less information public (or reported to relevant authorities), and may be bound to comply with different rules and regulations. Many businesses are operated through a separate entity such as a corporation or a partnership (either formed with or without limited liability). Most legal jurisdictions allow people to organize such an entity by filing certain charter documents with the relevant Secretary of State or equivalent and complying with certain other ongoing obligations. The relationships and legal rights of shareholders, limited partners, or members are governed partly by the charter documents and partly by the law of the jurisdiction where the entity is organized. Generally speaking, shareholders in a corporation, limited partners in a limited partnership, and members in a limited liability company are shielded from personal liability for the debts and obligations of the entity, which is legally treated as a separate "person." This means that unless there is misconduct, the owner's own possessions are strongly protected in law, if the business does not succeed. Where two or more individuals own a business together but have failed to organize a more specialized form of vehicle, they will be treated as a general partnership. The terms of a partnership are partly governed by a partnership agreement if one is created, and partly by the law of the jurisdiction where the partnership is located. No paperwork or filing is necessary to create a partnership, and without an agreement, the relationships and legal rights of the partners will be entirely governed by the law of the jurisdiction where the partnership is located. A single person who owns and runs a business is commonly known as a sole proprietor, whether he or she owns it directly or through a formally organized entity.
A few relevant factors to consider in deciding how to operate a business include: General partners in a partnership (other than a limited liability partnership), plus anyone who personally owns and operates a business without creating a separate legal entity, are personally liable for the debts and obligations of the business. 2.Generally, corporations are required to pay tax just like "real" people. In some tax systems, this can give rise to so-called double taxation, because first the corporation pays tax on the profit, and then when the corporation distributes its profits to its owners, individuals have to include dividends in their income when they complete their personal tax returns, at which point a second layer of income tax is imposed. 3. In most countries, there are laws which treat small corporations differently than large ones. They may be exempt from certain legal filing requirements or labor laws, have simplified procedures in specialized areas, and have simplified, advantageous, or slightly different tax treatment. 4.To "go public" (sometimes called IPO) -- which basically means to allow a part of the business to be owned by a wider range of investors or the public in general—you must organize a separate entity, which is usually required to comply with a tighter set of laws and procedures. Most public entities are corporations that have sold shares, but increasingly there are also public LLCs that sell units (sometimes also called shares), and other more exotic entities as well (for example,RE I Ts in the USA, Unit Trusts in the UK). However, you cannot take a general partnership "public." Types of meetings: Common types of meeting include: 1. Status Meetings, generally leader-led, which are about reporting by one-way communication 2. Work Meeting, which produces a product or intangible result such as a decision 3. Staff meeting, typically a meeting between a manager and those that report to the manager 4.Team meeting, a meeting among colleagues working on various aspects of a team project 5.Ad-hoc meeting, a meeting called for a special purpose 6. Management meeting, a meeting among managers 7.Board meeting, a meeting of the Board of directors of an organization 8. One-on-one meeting, between two individuals 9.Off-site meeting, also called "offsite retreat" and known as an Awayday meeting in the UK 10.Kickoff meeting, the first meeting with the project team and the client of the project to discuss the role of each team member 11. Pre-Bid Meeting, a meeting of various competitors and or contractors to visually inspect a jobsite for a future project. The meeting is normally hosted by the future customer or engineer who wrote the project specification to ensure all bidders are aware of the details and services expected of them. Attendance at the Pre-Bid Meeting may be mandatory. Failure to attend usually results in a rejected bid.
Fall 2010 Master of Business Administration - MBA Semester 3 MB0035 – Legal Aspects of Business - 3 Credits (Book ID: B0764) Assignment Set- 2 60 Marks Note: Each question carries 10 Marks. Answer all the questions. Q.1 a. What is an arbitration agreement? Discuss its essentials. [8 marks] b. What do you mean by mediation? [2 marks] Ans.: Arbitration Agreement: The foundation of arbitration is the arbitration agreement between the parties to submit to arbitration all or certain disputes which have arisen or which may arise between them. Thus, the provision of arbitration can be made at the time of entering the contract itself, so that if any dispute arises in future, the dispute can be referred to arbitrator as per the agreement. It is also possible to refer a dispute to arbitration after the dispute has arisen. Arbitration agreement may be in the form of an arbitration clause in a contract or in the form of a separate agreement. The agreement must be in writing and must be signed by both parties. The arbitration agreement can be by exchange of letters, document, telex, telegram etc Court must refer the matter to arbitration in some cases: If a party approaches court despite the arbitration agreement, the other party can raise objection. However, such objection must be raised before submitting his first statement on the substance of dispute. The original arbitration agreement or its certified copy must accompany such objection. On such application the judicial authority shall refer the parties to arbitration. Since the word used is “shall”, it is mandatory for judicial authority to refer the matter to arbitration. However, once the opposite party already makes first statement to court, the matter has to continue in the court. Once other party for referring the matter to arbitration makes an application, the arbitrator can continue with arbitration and even make an arbitral award. 1. It must be in writing [Section 7(3)]: Like the old law, the new law also requires the arbitration agreement to be in writing. It also provides in section 7(4) that an exchange of letters, telex, telegrams, or other means of telecommunications can also provide a record of such an agreement. Further, it is also provided that an exchange of claim and defense in which the existence of an arbitration agreement is alleged by one party and not denied by the other, will also amount to be an arbitration agreement. It is not necessary that the parties should sign such written agreement. All that is necessary is that the parties should accept the terms of an agreement reduced in writing. The naming of the arbitrator in the arbitration agreement is not necessary. No particular form or formal document is necessary. 2. It must have all the essential elements of a valid contract: An agreement stands on the same footing as any other agreement. Every person capable of entering into a contract may be a party to an arbitration agreement. The terms of the agreement must be definite and certain; if the terms are vague it is bad for indefiniteness. 3. The agreement must be to refer a dispute, present or future, between the parties to arbitration: If there is no dispute, there can be no right to demand arbitration. A dispute means

an assertion of a right by one party and repudiation thereof by another. A point as to which there is no dispute cannot be referred to arbitration. The dispute may relate to an act of commission or omission, for example, with holding a certificate to which a person is entitled or refusal to register a transfer of shares. Under the present law, certain disputes such as matrimonial disputes, criminal prosecution, questions relating to guardianship, questions about validity of a will etc. or treated as not suitable for arbitration. Section 2(3) of the new Act maintains this position. Subject to this qualification Section 7(1) of the new Act makes it permissible to enter into an arbitration agreement “in respect of a defined legal relationship whether contractual or not”. 4. An arbitration agreement may be in the form of an arbitration clause in a contract or in the form of a separate agreement [Section 7(2)]. Appointment of Arbitrator: The parties can agree on a procedure for appointing the arbitrator or arbitrators. If they are unable to agree, each party will appoint one arbitrator and the two appointed arbitrators will appoint the third arbitrator who will act as a presiding arbitrator [Section 11(3)]. If one of the parties does not appoint an arbitrator within 30 days, or if two appointed arbitrators do not appoint third arbitrator within 30 days, the party can request Chief Justice to appoint an arbitrator [Section 11(4)]. The Chief Justice can authorize any person or institution to appoint an arbitrator. [Some High Courts have authorized District Judge to appoint an arbitrator]. In case of international commercial dispute, the application for appointment of arbitrator has to be made to Chief Justice of India. In case of other domestic disputes, application has to be made to Chief Justice of High Court within whose jurisdiction the parties are situated [Section 11(12)] Challenge to Appointment of arbitrator: An arbitrator is expected to be independent and impartial. If there are some circumstances due to which his independence or impartiality can be challenged, he must disclose the circumstances before his appointment [Section 12(1)]. Appointment of Arbitrator can be challenged only if (a) Circumstances exist that give rise to justifiable doubts as to his independence or impartiality (b) He does not possess the qualifications agreed to by the parties [Section 12(3)]. Appointment of arbitrator cannot be challenged on any other ground. The challenge to appointment has to be decided by the arbitrator himself. If he does not accept the challenge, the proceedings can continue and the arbitrator can make the arbitral award. However, in such case, application for setting aside arbitral award can be made to Court. If the court agrees to the challenge, the arbitral award can be set aside [Section 13(6)]. Thus, even if the arbitrator does not accept the challenge to his appointment, the other party cannot stall further arbitration proceedings by rushing to court. The arbitration can continue and challenge can be made in Court only after arbitral award is made. Conduct of Arbitral Proceedings: The Arbitral Tribunal should treat the parties equally and each party should be given full opportunity to present his case [Section 18]. The Arbitral Tribunal is not bound by Code of Civil Procedure, 1908 or Indian Evidence Act, 1872 [Section 19(1)]. The parties to arbitration are free to agree on the procedure to be followed by the Arbitral Tribunal. If the parties do not agree to the procedure, the procedure will be as determined by the arbitral tribunal.
Law of Limitation Applicable: Limitation Act, 1963 is applicable. For this purpose, date on which the aggrieved party requests other party to refer the matter to arbitration shall be considered. If on that date, the claim is barred under Limitation Act, the arbitration cannot continue [Section 43(2)]. If Court sets Arbitration award aside, time spent in arbitration will be excluded for purpose of Limitation Act. So that case in court or fresh arbitration can start. Flexibility in respect of procedure, place and language: Arbitral Tribunal has full powers to decide the procedure to be followed, unless parties agree on the procedure to be followed [Section 19(3)]. The Tribunal also has powers to determine the admissibility, relevance, materiality and weight of any evidence [Section 19(4)]. Place of arbitration will be decided by mutual agreement. However, if the parties do not agree to the place, the same will be decided by tribunal [Section 20]. Similarly, language to be used in arbitral proceedings can be mutually agreed. Otherwise, Arbitral Tribunal can decide [Section 22]. Submission of statement of claim and defense: The claimant should submit statement of claims, points of issue and relief or remedy sought. The respondent shall state his defense in respect of these particulars. All relevant documents must be submitted. Such claim or defense can be amended or supplemented any time [section 23]. Hearings and Written Proceedings: After submission of documents and defense, unless the parties agree otherwise, the Arbitral Tribunal can decide whether there will be oral hearing or proceedings can be conducted on the basis of documents and other materials. However, if one of the parties requests the hearing shall be oral. Sufficient advance notice of hearing should be given to both the parties [Section 24]. [Thus, unless one party requests, oral hearing is not compulsory]. Settlement during Arbitration: It is permissible for parties to arrive at mutual settlement even when arbitration is proceeding. In fact, even the Tribunal can make efforts to encourage mutual settlement. If parties settle the dispute by mutual agreement, the arbitration shall be terminated. However, if both parties and the Arbitral Tribunal agree, the settlement can be recorded in the form of an arbitral award on agreed terms. Such Arbitral Award shall have the same force as any other Arbitral Award [Section 30]. Arbitral Award: Decision of Arbitral Tribunal is termed as 'Arbitral Award'. Arbitrator can decide the dispute ex aqua ET bono (In justice and in good faith) if both the parties expressly authorize him to do so [Section 28(2)]. The decision of Arbitral Tribunal will be by majority. The arbitral award shall be in writing and signed by the members of the tribunal [Section 29]. The award must be in writing and signed by the members of Arbitral Tribunal [Section 31(1)]. It must state the reasons for the award unless the parties have agreed that no reason for the award is to be given [Section 31(3)]. The award should be dated and place where it is made should be mentioned. Copy of award should be given to each party. Tribunal can make interim award also [Section 31(6)]. Cost of Arbitration- Cost of arbitration means reasonable cost relating to fees and expenses of arbitrators and witnesses, legal fees and expenses, administration fees of the institution supervising the arbitration and other expenses in connection with arbitral proceedings. The tribunal can decide the cost and share of each party [Section 3 1(8)]. If the parties refuse to pay the costs, the Arbitral Tribunal may refuse to deliver its award. In such case, any party can approach Court. The Court will ask for deposit from the parties and on such deposit, the Tribunal will deliver the award. Then Court will decide the costs of arbitration and shall pay the same to Arbitrators. Balance, if any, will be refunded to the party [Section 39]. Intervention by Court - One of the major defects of earlier arbitration law was that the party could access court almost at every stage of arbitration - right from appointment of arbitrator to

implementation of final award. Thus, the defending party could approach court at various stages and stall the proceedings. Now, approach to court has been drastically curtailed. In some cases, if the party raises an objection, Arbitral Tribunal itself can give the decision on that objection. After the decision, the arbitration proceedings are continued and the aggrieved party can approach Court only after Arbitral Award is made. Appeal to court is now only on restricted grounds. Of course, Tribunal cannot be given unlimited and uncontrolled powers and supervision of Courts cannot be totally eliminated. Arbitration Act has Over-Riding Effect: Section 5 of Act clarifies that notwithstanding anything contained in any other law for the time being in force, in matters governed by the Act, the judicial authority can intervene only as provided in this Act and not under any other Act. Modes of Arbitration (a) Arbitration without the intervention of the court. [Sec.3 to 19] (b) Arbitration with the intervention of the court when there is no suit pending [Sec.20] (c) Arbitration with the intervention of the court where a suit is pending. [Sec.21 to 25] b. What do you mean by mediation? Ans.: Meditation is a holistic discipline during which time the practitioner trains his or her mind in order to realize some benefit. Meditation is generally an internal, personal practice and most often done without any external involvement, except perhaps prayer beads to count prayers. Meditation often involves invoking or cultivating a feeling or internal state, such as compassion, or attending to a specific focal point. The term can refer to the state itself, as well as to practices or techniques employed to cultivate the state. There are hundreds of specific types of meditation. The word, 'meditation,' means many things dependent upon the context of its use. People practice meditation for many reasons, within the context of their social environment. editation is a component of many religions, and has been practiced since antiquity, particularly by monastics. A 2007 study by the U.S. government found that nearly 9.4% of U.S. adults (over 20 million) have used meditation within the past 12 months, up from 7.6% (more than 15 million people) in 2002. To date, the exact mechanism at work in meditation remains unclear, while scientific research continues. Ans.: Consumer right is defined as 'the right to be informed about the quality, quantity, potency, purity, standard and price of goods or services, as the case may be, so as to protect the consumer against unfair trade practices' Even though strong and clear laws exist in India to protect consumer rights, the actual plight of Indian consumers could be declared as completely dismal. Very few consumers are aware of their rights or understand their basic consumer rights. Of the several laws that have been enacted to protect the rights of consumers in India, the most significant is the Consumer Protection Act, 1986. Under this law, everyone, including individuals, a Hindu undivided family, a firm, and a company, can exercise their consumer rights for the goods and services purchased by them. It is important that, as consumers, we know at least our basic rights and about the courts and procedures that deal with the infringement of our rights. In general, the rights of consumers in India can be listed as under: * The right to be protected from all types of hazardous goods and services * The right to be fully informed about the performance and quality of all goods and services * The right to free choice of goods and services * The right to be heard in all decision-making processes related to consumer interests * The right to seek redressal, whenever consumer rights have been infringed * The right to complete consumer education The Consumer Protection Act, 1986 and various other laws like the Standards, Weights & Measures Act have been formulated to ensure fair competition in the market place and free flow of true information from the providers of goods and services to those who consume them. However, the success of these laws would depend upon the vigilance of consumers about their rights, as well as their responsibilities. In fact, the level of consumer protection in a country is considered as the correct indicator of the extent of progress of the nation.
The production and distribution systems have become larger and more complicated today. The high level of sophistication achieved by the providers of goods and services in their selling and marketing practices and various types of promotional activities like advertising resulted in an increased need for higher consumer awareness and protection. In India, the government has realized the plight of Indian consumers and the Ministry of Consumer Affairs, Food and Public Distribution has established the Department of Consumer Affairs as the nodal organization for the protection of consumer rights, redressal of all consumer grievances and promotion of standards governing goods and services offered in India. A complaint for infringement of consumer rights could be made under the following circumstances in the nearest designated consumer court: * The goods or services bought by a person or agreed to be bought by a person suffer from one or more deficiencies or defects in any respect * A trader or a service provider resorting to restrictive or unfair trade practices * A trader or a service provider charging a price in excess of the price displayed on the goods or the price that had been agreed upon between the parties or the price that had been stipulated under any law in force * Goods or services that pose a hazard to the safety and life of a person offered for sale, knowingly or unknowingly, causing injury to health, safety or life. Consumerdaddy.com is India's only online consumer protection site offering consumer report, consumer review and different opinions on different products and companies.
b. Distinguish between Memorandum of Association and Articles of Association. Ans.: Memorandum of Association: The memorandum of association of a company, often simply called theme mora ndum (and then often capitalised as an abbreviation for the official name, which is a proper noun and usually includes other words), is the document that governs the relationship between the company and the outside. It is one of the documents required to incorporate a company in the United Kingdom, Ireland and India, and is also used in many of the common law jurisdictions of the Commonwealth. Requirements While it is still necessary to file a memorandum of association to incorporate a new company, it no longer forms part of the company’s constitution and it contains limited information compared to the memorandum that was required prior to 1 October 2009. It is basically a statement that the subscribers wish to form a company under the 2006 Act, have agreed to become members and, in the case of a company that is to have a share capital, to take at least one share each. It is no longer required to state the name of the company, the type of company (such as public limited company or private company limited by shares), the location of its registered office, the objects of the company, and its authorised share capital.[1] Companies incorporated prior to 1 October 2009 are not required to amend their memorandum. Those details which are now required to appear in the Articles, such as the objects clause and details of the share capital, are deemed to form part of the Articles. Capacities The memorandum no longer restricts what a company is permitted to do. Since 1 October 2009, if a company's constitution contains any restrictions on the objects at all, those restrictions will form part of the articles of association. Historically, a company's memorandum of association contained an objects clause, which limited
its capacity to act. When the first limited companies were incorporated, the objects clause had to be widely drafted so as not to restrict the board of directors in their day to day trading. In the Companies Act 1989 the term "General Commercial Company" was introduced which meant that companies could undertake "any lawful or legal trade or business." The Companies Act 2006 relaxed the rules even further, removing the need for an objects clause at all. Companies incorporated on and after 1 October 2009 without an objects clause are deemed to have unrestricted objects. Existing companies may take advantage of this change by passing a special resolution to remove their objects clause. If the company is to be a non-profit making company, the articles will contain a statement saying that the profits shall not be distributed to the members. Articles of association: The term articles of association of a company, or articles of incorporation, of an American or Canadian Company, are often simply referred to asa rtic l es (and are often capitalized as an abbreviation for the full term). The Articles are a requirement for the establishment of a company under the law of India, the United Kingdom and many other countries. Together with the memorandum of association, they constitute the constitution of a company. The equivalent term for LLC is Articles of Organization. Roughly equivalent terms operate in other countries, such as Gesellschaftsvertrag in Germany, statuts in France, statut in Poland.[1] The following is largely based on British Company Law, references which are made at the end of this Article. The Articles can cover a medley of topics, not all of which is required in a country's law. Although all terms are not discussed, they may cover: • the issuing of shares (also called stock), different voting rights attached to different classes of shares • valuation of intellectual rights, say,the valuations of the IPR of one partner and,for example,the real estate of the other • the appointments of directors - which shows whether a shareholder dominates or shares equality with all contributors • directors meetings - the quorum and percentage of vote • management decisions - whether the board manages or a founder • transferability of shares - assignment rights of the founders or other members of the company do • special voting rights of a Chairman,and his/her mode of election • the dividend policy - a percentage of profits to be declared when there is profit or otherwise • winding up - the conditions, notice to members • confidentiality of know-how and the founders' agreement and penalties for disclosure • first right of refusal - purchase rights and counter-bid by a founder. A Company is essentially run by the shareholders, but for convenience, and day-to-day working, by the elected Directors. Usually, the shareholders elect a Board of Directors (BOD) at the Annual General Meeting (AGM), which may be statutory (e.g. India). The number of Directors depends on the size of the Company and statutory requirements. The Chairperson is generally a well-known outsider but he /she may be a working Executive of the company, typically of an American Company. The Directors may, or may not, be employees of the Company.
Q.2 a. What kinds of rights are considerable under consumer rights? [5 marks] b. Distinguish between Memorandum of Association and Articles of Association. [6 marks]
Q.3 a. Identify the types of evidence which are relied upon by complainants to establish defect in product. [3 marks]
b. Write a short note on unfair trade practices and Restrictive trade practice. [7 marks] 3. Write a short note on unfair trade practices and Restrictive trade practice. Ans.: Unfair trade practices: The law of unfair competition serves five purposes. First, the law seeks to protect the economic, intellectual, and creative investments made by businesses in distinguishing themselves and their products. Second, the law seeks to preserve the good will that businesses have established with consumers. Third, the law seeks to deter businesses from appropriating the good will of their competitors. Fourth, the law seeks to promote clarity and stability by encouraging consumers to rely on a merchant's good will and reputation when evaluating the quality of rival products. Fifth, the law seeks to increase competition by providing businesses with incentives to offer better goods and services than others in the same field. Although the law of unfair competition helps protect consumers from injuries caused by deceptive trade practices, the remedies provided to redress such injuries are available only to business entities and proprietors. Consumers who are injured by deceptive trade practices must avail themselves of the remedies provided by state and federal Consumer Protection laws. In general, businesses and proprietors injured by unfair competition have two remedies: injunctive relief (a court order restraining a competitor from engaging in a particular fraudulent or deceptive practice) and money damages (compensation for any losses suffered by an injured business). General Principles The freedom to pursue a livelihood, operate a business, and otherwise compete in the marketplace is essential to any free enterprise system. Competition creates incentives for businesses to earn customer loyalty by offering quality goods at reasonable prices. At the same time, competition can also inflict harm. The freedom to compete gives businesses the right to lure customers away from each other. When one business entices enough customers away from competitors, those rival businesses may be forced to shut down or moveThe law of unfair competition will not penalize a business merely for being successful in the marketplace. Nor will the law impose liability simply because a business is aggressively marketing its product. The law assumes, however, that for every dollar earned by one business, a competitor will lose a dollar. Accordingly, the law prohibits a business fromu nf a irly profiting at a competitor's expense. What constitutes unfair competition varies according to the Cause of Action asserted in each case. These include actions for the infringement of Patents, Trademarks, and copyrights; actions for the wrongful appropriation of Trade Dress, trade names, trade secrets, and service marks; and actions for the publication of defamatory, false, and misleading representations. Restrictive trade practice: The restrictive trade practices, or antitrust, provisions in the Trade Practices Act are aimed at deterring practices by firms which are anti-competitive in that they restrict free competition. This part of the act is enforced by the Australian Competition and Consumer Commission (ACCC). The ACCC can litigate in the Federal Court of Australia, and seek pecuniary penalties of up to $10 million from corporations and $500,000 from individuals. Private actions for compensation may also be available. These provisions prohibit:
• Most Price Agreements (see Cartel and Price-Fixing) • Primary boycotts (an agreement between parties to exclude another) • Secondary boycotts whose purpose is to cause substantial lessen competition (Actions between two persons engaging in conduct hindering 3rd person from supplying or acquiring goods or services from 4th) • Misuse of market power – taking advantage of substantial market power in a particular market, for one or more proscribed purposes; namely, to eliminate or damage an actual or potential competitor, to prevent a person from entering a market, or to deter or prevent a person from engaging in competitive conduct.
Exclusive dealing – an attempt to interfere with freedom of buyers to buy from other suppliers, such as agreeing to supply a product only if a retailer does not stock a competitor’s product. Most forms of exclusive dealing are only prohibited if they have the purpose or likely effect of substantially lessening competition in a market. • Third-line forcing: A type of exclusive dealing, third-line forcing involves the supply of goods or services on the condition that the acquirer also acquires goods or services from a third party. Third-line forcing is prohibited per se. • Resale price maintenance – fixing a price below which resellers cannot sell or advertise • Mergers and acquisitions that would result in a substantial lessening of competition A priority of ACCC enforcement action in recent years has been cartels. The ACCC has in place an immunity policy, which grants immunity from prosecution to the first party in a cartel to provide information to the ACCC allowing it to prosecute. This policy recognizes the difficulty in gaining information/evidence about price-fixing behaviours
Q.4. Present a detail note on Shops and Establishment Act. [10 marks] Ans.: Shops and Establishment Act: Objectives - To provide statutory obligation and rights to employees and employers in the unorganized sector of employment, i.e., shops and establishments. Scope And Coverage - A state legislation; each state has framed its own rules for the Act. - Applicable to all persons employed in an establishments with or without wages, except the members of the employer's family. - State government can exempt, either permanently or for a specified period, any establishments from all or any provisions of this Act. Main Provisions - Compulsory registration of shop/establishment within thirty days of commencement of work. - Communications of closure of the establishment within 15 days from the closing of the establishment. - Lays down the hours of work per day and week. - Lays down guidelines for spread-over, rest interval, opening and closing hours, closed days, national and religious holidays, overtime work. - Rules for employment of children, young persons and women - Rules for annual leave, maternity leave, sickness and casual leave, etc. - Rules for employment and termination of service. - Maintenance of registers and records and display of notices. - Obligations of employers. - Obligations of employees. About What: 1.To regulate conditions of work and employment in shops, commercial establishments, residential hotels, restaurants, eating houses, theatres, other places of public entertainment and other establishments. 2.Provisions include Regulation of Establishments, Employment of Children, Young Persons and Women, Leave and Payment of Wages, Health and Safety etc. Applicability & Coverage: 1. It applies to all local areas specified in Schedule-I 2.Establishment means any establishment to which the Act applies and any other such establishment to which the State Government may extend the provisions of the Act by notification
3.Employee means a person wholly or principally employed whether directly or through any agency, whether for wages or other considerations in connection with any establishment 4. Member of the family of an employer means, the husband, wife, son, daughter, father, mother, brother or sister and is dependent on such employer Returns: 1. Form-A or Form-B (as the case may be) {Section 7(2)(a), Rule 5} Before 15th December of the calendar year, i.e. 15 days before the expiry date The employer has to submit these forms to the authority notified along with the old certificate of registration and the renewal fees for minimum one year’s renewal and maximum of three year’s renewal Form-E (Notice of Change) {Rule 8} Within 15 days after the expiry of the quarter to which the changes relate in respect of total number of employees qualifying for higher fees as prescribed in Schedule-II and in respect of other changes in the original statement furnished within 30 days after the change has taken place. (Quarter means quarter ending on 31st March, 30th June, 30th September and 31st December) Registers: 1. Form-A {Rule 5} Register showing dates of Lime Washing etc 2.Form-H, Form-J {Rule 20(1)} (if opening & closing hours are ordinarily uniform) Register of Employment in a Shop or Commercial Establishment 3. Form-I {Rule 20(3)}, Form-K (if opening & closing hours are ordinarily uniform) Register of Employment in a Residential Hotel, Restaurant, Eating-House, Theatre, or other places of public amusement or entertainment 4. Form-M {Rule 20(4)} Register of Leave – This and all the above Registers have to be maintained by the Employer 5. Visit Book This shall be a bound book of size 7” x 6” containing at least 100 pages with every second page consecutively numbered, to be produced to the visiting Inspector on demand. The columns shall be: i. Name of the establishment or Employer ii. Locality iii.Registration Number iv.Date and v. Time
Q. 5 a. What is a cyber crime? What are the categories of cyber crime? [8 marks] b. Mention the provisions covered under IT Act? [2 marks] Ans.: Cyber crime It refers to all the activities done with criminal intent in cyberspace or using the medium of Internet. These could be either the criminal activities in the conventional sense or activities, newly evolved with the growth of the new medium. Any activity, which basically offends human sensibilities, can be included in the ambit of Cyber crimes. Because of the anonymous nature of Internet, it is possible to engage in a variety of criminal activities with impunity, and people with intelligence, have been grossly misusing this aspect of the Internet to commit criminal activities in cyberspace. The field of cyber crime is just emerging and new forms of criminal activities in cyberspace are coming to the forefront each day. For example, child pornography on Internet constitutes one serious cyber crime. Similarly, online pedophiles, using Internet to induce minor children into sex, are as much cyber crimes as any others. Categories of cyber crimes: Cyber crimes can be basically divided in to three major categories: 1. Cyber crimes against persons; 2. Cyber crimes against property; and 3. Cyber crimes against government. 1. Cyber crimes against persons: Cyber crimes committed against persons include various
crimes like transmission of child-pornography, harassment of any one with the use of a computer and cyber stalking. The trafficking, distribution, posting, and dissemination of obscene material including pornography, indecent exposure, and child pornography constitute the most important cyber crimes known today. These threaten to undermine the growth of the younger generation and also leave irreparable scars on the minds of the younger generation, if not controlled. Similarly, cyber harassment is a distinct cyber crime. Various kinds of harassments can and do occur in cyberspace, or through the use of cyberspace. Harassment can be sexual, racial, religious, or of any other nature. Cyber harassment as a crime also brings us to another related area of violation of privacy of citizens. Violation of privacy of online citizens is a cyber crime of a grave nature. Cyber stalking: The Internet is a wonderful place to work, play and study. The net is merely a mirror of the real world, and that means it also contains electronic versions of real life problems. Stalking and harassment are problems that many persons especially women, are familiar within real life. These problems also occur on the Internet, in the form of “cyber stalking” or “online harassment”. 2. Cyber crimes against property: The second category of Cyber crimes is Cyber crimes against all forms of property. These crimes include unauthorized computer trespassing through cyberspace, computer vandalism, and transmission of harmful programs and unauthorized possession of computerized information. 3. Cyber crimes against Government: The third category of Cyber crimes is Cyber crimes against Government. Cyber Terrorism is one distinct kind of crime in this category. The growth of Internet has shown that individuals and groups to threaten international governments as also to terrorize the citizens of a country are using the medium of cyberspace. This crime manifests itself into Cyber Terrorism when an individual “cracks” into a government or military maintained website, for the purpose of perpetuating terror. Since Cyber crime is a newly emerging field, a great deal of development has to take place in terms of putting into place the relevant legal mechanism for controlling and preventing cyber crime. The courts in United States of America have already begun taking cognizance of various kinds of fraud and cyber crimes being perpetrated in cyberspace. However, much work has to be done in this field. Just as the human mind is ingenious enough to devise new ways for perpetrating crime, similarly, human ingenuity needs to be canalized into developing effective legal and regulatory mechanisms to control and prevent cyber crimes. A criminal mind can assume very powerful manifestations if it is used on a network, given the reachability and size of the network. Legal recognition granted to Electronic Records and Digital Signatures would certainly boost E – Commerce in the country. It will help in conclusion of contracts and creation of rights and obligations through electronic medium. In order to guard against the misuse and fraudulent activities over the electronic medium, punitive measures are provided in the Act. The Act has recognized certain offences, which are punishable. They are: - Tampering with computer source documents (Sec 65) Any person, who knowingly or intentionally conceals, destroys or alters or intentionally or knowingly causes another person to conceal, destroy or alter any - i. Computer source code when the computer source code is required to be kept by law for the time being in force,
ii. Computer programme, iii. Computer system and iv. Computer network. - Is punishable with imprisonment up to three years, or with fine, which may extend up to two lakh rupees, or with both. Hacking with computer system (Sec 66): Hacking with computer system is a punishable offence under the Act. It means any person intentionally or knowingly causes wrongful loss or damage to the public or destroys or deletes or alters any information residing in the computer resources or diminishes its value or utility or affects it injuriously by any means, commits hacking. Such offenses will be punished with three years imprisonment or with fine of two lakh rupees or with both. Publishing of information which is obscene in electronic form (Sec 67): Whoever publishes or transmits or causes to be published in the electronic form, any material which is lascivious or appeals to prurient interest or if its effect is such as to tend to deprave and corrupt persons who are likely, having regard to all relevant circumstances, to read, see or hear the matter contained or embodied in it shall be punished on first conviction with imprisonment for a term extending up to 5 years and with fine which may extend to one lakh rupees. In case of second and subsequent conviction imprisonment may extend to ten years and also with fine which may extend up to two lakh rupees. Failure to comply with orders of the controller by a Certifying Authority or any employee of such authority (Sec 68): Failure to comply with orders of the Controller by any Certifying Authority or by any employees of Certifying Authority is a punishable offence. Such persons are liable to imprisonment for a term not exceeding three years or to a fine not exceeding two lakh rupees or to both. Fails to assist any agency of the Government to decrypt the information (Sec 69): If any subscriber or any person-in-charge of the computer fails to assist or to extend any facilities and technical assistance to any Government agency to decrypt the information on the orders of the Controller in the interest of the sovereignty and integrity of India etc. is a punishable offence under the Act. Such persons are liable for imprisonment for a term, which may extend to seven years. Unauthorized access to a protected system (Sec 70): Any person who secures access or attempts to secure access to a protected system in contravention of the provisions is punishable with imprisonment for a term which may extend to ten years and also liable to fine. Misrepresentation before authorities (Sec 71): Any person who obtains Digital Signature Certificate by misrepresentation or suppressing any material fact from the Controller or Certifying Authority as the case may be punished with imprisonment for a term which may extend two years or with fine up to one lakh rupees or with both. Breach of confidentiality and privacy (Sec 72): Any person in pursuant of the powers conferred under the act, unauthorized secures access, to any electronic record, books, register, correspondence, information, document or other material without the consent of the person concerned discloses such materials to any other person shall
be punished with imprisonment for a term which may extend to two years, or with fine up to one lakh rupees or with both. Publishing false particulars in Digital Signature Certificate (Sec 73): No person can publish a Digital Signature Certificate or otherwise make it available to any other person with the knowledge that: - a. The Certifying Authority listed in the certificate has not issued it; or b. The subscriber listed in the certificate has not accepted it; or c. The certificate has been revoked or suspended Unless such publication is for the purpose of verifying a digital signature created prior to such suspension or revocation. Any person who contravenes the provisions shall be punishable with imprisonment for a term, which may extend to two years or with fine up to rupees one lakh or with both. b. Mention the provisions covered under IT Act? Ans.: IT Act: Publication of Digital Signature Certificate for fraudulent purpose (Sec 74): Any person knowingly creates, publishes or otherwise makes available a Digital Signature Certificate for any fraudulent or unlawful purpose shall be punished with imprisonment for a term which may extend to two years or with fine up to one lakh rupees or with both. Search and Arrest Any Police Officer not below the rank of a Deputy Superintendent of Police or any other officer of the Central Government or a State Government authorized in this behalf may enter any public place, search and arrest without warrant any person found therein who is reasonably suspected or having committed or of committing or of being about to commit any offence under this Act.
Q. 6 Ishaan is a fresher and recently is appointed as a part-time employee in Consumer Redressal Dispute Agency. As his superior, how will you guide him regarding the redressal forums, the nature of making complaints and the working of the agency?
Ans.: Redressal forum: Twenty-five years ago, consumer action in India was virtually unheard of. It consisted of some action by individuals, usually addressing their own grievances. Even this was greatly limited by the resources available with these individuals. There was little organized effort or attempts to take up wider issues that affected classes of consumers or the general public. All this changed in the Eighties with the Supreme Court-led concept of public interest litigation. It gave individuals and the newly formed consumer groups, access to the law and introduced in their work the broad public interest perspective. Telepress Features Several important legislative changes took place during this period. Significant were the amendments to the Monopolies and Restrictive Trade Practices Act (hereafter "MRTP Act") and the Essential Commodities Acts, and the introduction of the Environment Protection Act and the Consumer Protection Act. These changes shifted the focus of law from merely regulating the private and public sectors to actively protecting consumer interests. The Consumer Protection Act, 1986 (hereafter "the Act") is a remarkable piece of legislation for its focus and clear objective, the minimal technical and legalistic procedures, providing access to redressal systems and the composition of courts with a majority of non-legal background members.
The Act establishes a hierarchy of courts, with at least one District Forum at the district level (Chennai has two), a State Commission at the State capitals and the National Commission at New Delhi. The pecuniary jurisdiction of the District Forum is up to Rs. one lakh and that of the State Commission is above Rs. one lakh and below Rs. 10 lakhs. All claims involving more than Rs. 10 lakhs are filed directly before the National Commission. Appeals from the District Forum are to be filed before the State Commission and from there to the National Commission, within thirty days of knowledge of the order. How to make a complaint This section explains how to make a complaint using our Complaints Registration Form. It tells you what information you need to include on the form, and where you need to send your completed form. Definition of a complaint The UK Border Agency defines a complaint as “any expression of dissatisfaction about the services provided by or for the UK Border Agency and/or about the professional conduct of UK Border Agency staff, including contractors.” The following will not be treated as complaints: • Letters relating to the decision to refuse a UK visa. Visa applicants are expected to raise this using the existing appeal channels. • Letters-chasing progress on an application unless it is outside our published processing times. What information should you send? You should make your complaint using our Complaints Registration Form. It is important that you give as much information about yourself as possible. The Complaints Registration Form tells you the type of information we need. This will help us to find the information relevant to your case and to contact you about it. If possible you should also include: • Full details about the complaint (including times, dates and locations); • The names of any UK Border Agency / Visa Application Centre staff you have dealt with; • Details of any witnesses to the incident (if appropriate); • Copies of letters or papers that are relevant; and • Any travel details that relate to your complaint. What happens next? The 'How we will deal with your complaint' page explains: • How we handle your complaint • What to do if you are not happy with the outcome of your complaint or how we have handled it • What will happen after your complaint has been dealt with
QM0010 – Foundation of Quality Management –4 Credits
Assignment Set-1 (60 Marks)
Note: Each question carries 10 Marks. Answer all the questions
1. Discuss the evolution of Quality Management.Explain the concept of Total Quality Management (TQM).
In the Pre Industrial revolution period, the quality wsa the responsibility of the crafts man or the master crafts man who was responsible for the workmanship of the other crafts men in his team. Even then, it has been observed that external persons were deployed to keep an eye on quality on behalf of the customers. Example: it has been recorded that royal Governments in Great Britain had appointed overseers to report on the construction and repair of ships. During this period, it was possible for the craftsmen/ workers to control the quality of their own out puts. The working conditions then propoably had been conducive for professional pride.The Industrial revolution led to the establishment of systems where number of people performing similar type of work was grouped together under the supervision of a person often call ‘foreman’, who was responsible for the quality and the output of the work output.In the late 19th century, pioneers like Frederick Taylor and Henry Ford recognized the limitations of methods deployed for the manufacturing of the goods through mass production and the resultant variation in the quality of the work output. Taylor established Quality Department to oversee the quality of production and rectifying error detected. Ford insisted on standardization of design and components to ensure that products produced are of standard in nature with little variation. Quality Department was responsible of the quality of the products and adopted the method of inspection of work out put to catch the defects.
Early 20th Century: During 20th century around the time of world war I, the products had become more complex requiring deployment of complex manufacturing processes. This period also witnessed the introduction of wide spread mass production and piece work. As the workers were paid on the number of pieces made, a tendency was developed among the workers to strive to push more products to earn extra, resulting in pushing the products with bad workmanship to the assembly lines/ customers.To counter the above tendency fulltime inspectors were introduced to identify quarantine and correct the defects. Quality Control in this method of inspections during 1920s and 30s led to the formal establishment of quality inspection functions, seperated from production.During 1930s mostly USA, the importance of quality has gained and efforts involved in rework and cost of scraps started getting some attention. This has led to the development of systematic approach to quality. The mass production has grown to such an extent that prevalent quality control mehtod – inspection of every product produced and become too cumbersome. At this point, statistical quality control (SQC) had come into beng. The introduction of statistical quality control is credited to Walter A Shewhart of Bell Labs.SQC came about with the realization that quality cannot be fully inspected into an important batch of products. SQC introduced to the inspectors control tools such as Sampling and Control Charts were 100% inspection is not practicable. The Statistical Techniques allow inspection and test of certain proportion of products (sample) for quality to get the desired level of confidence in the quality of the entire batch or lot of production.
Post war scenarioa. Japanese Experience: After second world war, US enthrusted the post war
re contruction of japan to Heneral Douglas MacArthur. Two members of Gen Macarthur’s team, W.Edwards demingv and Joseph Juran were introduced the statistical methods for quality control and management to Japanese Industrialists. Both individuals promoted gthe collaborative concepts of quality to japanese business and technical groups. Deming propounded the management philosophy in the form of 14 points which are high level abstraction that should be interpreted by learning and
understanding. These points encompass quality, productivity, Innovation, People aspects, competitive position and others
From this premise, he set out his 14 points for management, which we have paraphrased here:
1."Create constancy of purpose towards improvement". Replace short-term reaction with long-termplanning.
2."Adopt the new philosophy". The implication is that management should actually adopt his philosophy, rather than merely expect the workforce to do so.
3."Cease dependence on inspection". If variation is reduced, there is no need to inspect manufactured items for defects, because there won't be any.
4."Move towards a single supplier for any one item." Multiple suppliers mean variation between feedstocks.
5."Improve constantly and forever". Constantly strive to reduce variation.
6."Institute training on the job". If people are inadequately trained, they will not all work the same way, and this will introduce variation.
7."Institute leadership". Deming makes a distinction between leadership and mere supervision. The latter is quota- and target-based.
8."Drive out fear". Deming sees management by fear as counter- productive in the long term, because it prevents workers from acting in the organisation's best interests.
9."Break down barriers between departments". Another idea central to TQM is the concept of the 'internal customer', that each department serves not the management, but the other departments that use its outputs.
10."Eliminate slogans". Another central TQM idea is that it's not people who make most mistakes - it's the process they are working within. Harassing the workforce without improving the processes they use is counter-productive.
11."Eliminate management by objectives". Deming saw production targets as encouraging the delivery of poor-quality goods.
12."Remove barriers to pride of workmanship". Many of the other problems outlined reduce worker satisfaction.
13."Institute education and self-improvement".
14."The transformation is everyone's job".Deming’s contribution is significant in the evolution of Japan for Innovative High quality products and as an economic super power. His work in Japan has profound impact on the development of Japanese economy, that he was awarded : Order of the sacred – Treasure, Second class by the emperor of Hirohito.
In 1950, JUSE ( Union of Japanese Scientists and Engineers) have established the Deming Prize to repay him for his friendship and contribution. The deming Prize to repay him for his friendship and contribution. The Deming Prize – Particularly, the Deming Application prize given to companies has exerted immense influence on the development of Quality Movement in Japan.
It is Joseph Juran who has been credited for adding the human dimension quality. In his opinion, it is the human relations problems – resistance to change (Cultural resistance) is one of the main causes for the quality issues. He has pushed for training and education of the Managers on quality aspects. Juran also developed the Juran’s triology’ as cross functional management comprising of three managerial processes – Quality Planning, Quality Control and Quality Imrpovement. Juran is also credited with the application of Pareto Principle (Vital few, trivial Many) to handle the quality issuesEven while bring influenced by deming and Juran’s ideas on quality, the Japanese began developing their own contributions towards quality improvements. JUST IN TIME (JIT) concept propounded and implemented by Taichi Ohno of Toyota and Shigeo Shingo has challenged the traditional understanding of production management revolutionizing the relationship between the manufacturer and its supplier
Shiego Shingo has also developed the concept of Poka Yoka (Mistake Proofing), an important component of Toyota production system. Poka Yoke involves devising behavior shaping constraint or methods in which the operations are carried out so that three is no scope for occurence of inadvertent mistakesKaoru Ishikawa is another Japanese pioneer, who has contributed immensely towards the development of Quality Circles and the development of Quality tool – Ishikawa Diagram, popularly known as Fish and Bone diagram (Tool for identifying possible causes for the problem)In fact, some of the highly successful quality initiatives have been invented by the japanese. Among them are Taguchi Methods, Poka Yoke, Quality Function Deployment (QFD), Toyota Production system and others. Many of these methods provide techniques but also associated quality culture aspects
b. American Experience: Philip B.Crosby was busy in the endevors in Improvement in improvement quality in ITT coporation, USA. He has propounded theory, Zero Defects – Complete conformance to defined quality parameters and acceptable quality levels. Another important aspect of his theory is that quality is achieved by prevention and not by detection.
Armand Feigenbaum who was director of Manufactoruing operations in General Electric from 1958 to 1968, he has pioneered concept – Total Quality Control – an effective system for integrating efforts of various groups in the organization in developing, maintaining improving quality. He has also propounded the theory of ‘hidden factory’ highlighting extra work that is carried out in correcting mistakes and defects. His porposition that quality must actively managed and ensure visibility at the highest level in the organization led to the development of total quality management.In spite of such yeomen services undertaken by many individuals led by crosby and others, to lead united states industries towards a more comprehensive approach to quality, the US continued to apply the QC concepts of inspection and sampling to remove defective product from production lines, essentially ignoring advances in QA for decades. This has led to decline in american over japan interms of Quality, Productivity and cost competitiveness
1980, NBC broadcasts a documentary on success of Japanese companies in quality and asked ‘if Japanese can do why not we’? about the increasing industrial competition the united states was facing from japan. This documentary had featured Deming prominently. As a result of this, demind work attracted the attention of american business. Ford Motor company was the first to seek services of Deming in 1981. Deming facilitated the jump – start of quality movement in Ford, helping in turning around in fortunes. The main focus of these initiatives was on management and on company Quality Culture1982, MIT center for Advanced Engineering published a book by Dr.Deming – Quality, Productivity and Competitive Position. This book was later published with a new name – out of the crisis 1986, this became extremely popular in US among business leaders and laid foundation for Total Quality Management movement in US. In the book, Deming offers a thoery of Management based on famous 14 points for management. Management’s failure to plan for future brings about loss of market, which brings about loss of jobs. Management must be judged not only by the quartely dividend, but by innovative plans to stay in business, protect investment, ensure future dividends, and provide more jobs through improved products and services. ‘Long term commitment to new learning and new philosophy is required of any management that seeks transformation. The timid and fainthearted, and people that expect quick results, are doomed to disappointment’Total Quality Management
"We are what we repeatedly do. Excellence, therefore, is not an act, but a habit." - Aristotle 384BC-322BC
Total quality management is an integrated effort designed to improve quality performance at every level of the organization .This article is a study on the importance of TQM in management for the process of understanding and successful implementation and application of TQM philosophy, principles and identify the tools and techniques to solve quality related problems.
Dr.Kaoru Ishikawa's contributions to total quality concept and his emphasis on the human side of quality, the Ishikawa diagram and the assembly and the use of the "seven basic tools of quality" are discussed in this article.
The business success of Indian companies and their success story in form of case studies are briefly summarized in this article. Further an attempt in made to apply the TQM concepts and tools and techniques to improve the quality performance to enable companies to compete with the global markets and international firms by analyzing the importance of process management .
TQM philosophy & principles, Ishikawa diagram, process management, critical Critical success factors, key performance indicators.etc
After globalization Indian markets are completely opened up to the international competition today's powerful business strategy means gaining competitive advantages by achieving market superiority over its competitors. In order to gain competitive advantage the company should provide value to its customers that the competitors are unable to do so therefore the dynamic challenges of total quality management provides strong competitive advantage to improve product quality, increase speed of delivery of service, eliminate unproductive labour, ensures consistency, better management practices, increases the learning curve of an organization, delights the customers by providing total customer service and complete satisfaction which
ultimately leads towards customers business firms development with increase in its market share.
DEFINITION OF TQM
International Organization for Standardization (ISO) has defined TQM as : TQM is a management approach for an organization, centered on quality based on participation of all its members and aiming at long – term success through customer satisfaction, and benefits to all members of the organization and society (ISO 8402: 1994)
a.
" A system of management based on a commitment to the customer's total satisfaction understanding and improving the organizations processes, employee involvement and data based decision making" – MARK D.HANN
TQM can be defined as " an organization wide effort to develop systems, tools, techniques, skills and the mindset to establish a quality assurance system that is responsive to the emerging market needs" – B.MAHADEVAN
THE EVOLUTION OF TQM
In 1920's statistical theory began to be applied effectively to the quality control concept later in 1924 shewhart made the first sketch of a modern control chart. His works was later developed by process control .After the World War II Japan's industrial system was having a poor image of imitation of products and having an illiterate workforce.
The Japanese recognized these problems and their values concerned with quality and continuous improvement the total quality management become popular in 1950's as it tried to recover Japanese economy from the spoils of World War II .During the 1980's japans' exports into the USA and Europe increased significantly due to its cheaper, higher quality products, compared to the western countries.
Formation of TQM in India
In the early 1980's, confederation of Indian industries (CII) took the initiatives to set up TQM practices in India in 1982 quality circles were introduced for first time in India. The companies under which the quality circles were launched are Bharat Electronics Ltd, Bangalore and Bharat Heavy Electricals Ltd, Trichy. In 1986 CII invited professor Ishikawa to India, to address Indian Industry about quality. In 1987, a TQM division was set up the CII this division had 21 companies agreed to contribute resources to it and formed the National committee on quality"
In February 1991 an Indian company with assistance of the CII, obtained the first ISO 9000 certification in India. In 1996, the Govt. of India announced the setting up of quality council of India and a national agency for quality certification was setup as a part of WTO agreement.
TQM Five main advantages:
1. Encourages a strategic approach to management at the operational level through involving multiple departments' across functional improvement and systemic innovation processes.
2. Provides high return on investment through improved efficiency.
3. Works equally well for service and manufacturing sectors
4. Allows organizations to take advantage of developments that enable managing operations as cross-functional processes
5. Fits an orientation toward inter-organizational collaboration and strategic alliances through establishing a culture of collaboration among different departments within organization.
CONCEPTS OF THE TQM PHILOSOPHY
The specific concepts that make up the philosophy of TQM are:
1. Customer Focus:
Quality is defined as meeting or exceeding customer expectations. The goal of management should be to identity and meet the customers' needs. Therefore quality is customer driven. Customer focus keeps the business competitive in every level of market change.
2. Continuous Improvement:
One of the powerful TQM philosophy is the focus on continuous improvement. Continuous improvement is called kaizen by the Japanese which make the company continuously to learn and to be problem solving. Because we can never achieve perfection we must always evaluate our performance and take measures to improve it. The two approach that helps in continuous improvement are PDSA cycle and benchmarking.
3. Employee Empowerment:
TQM philosophy is to empower all employees to seek out quality problems and correct them. Today workers are empowered with decision making power to decide quality in the production process, their contributions are highly valued and workers suggestions to improve quality are implemented. This employee empowerment can be made through team approach have quality circle where a team of volunteer production employees and their supervisors who meet regularly to solve quality problems.
4. Use of Quality Tools
For Identification of quality related issues employees should be trained with the quality tools to identify the possible issues and to correct problems. These are often called the 'seven tools of quality control' they are:
Causeandeffectdiagrams Flowcharts Checklists Controlcharts ScatterDiagrams. ParetoAnalysis HistogramsProductDesign
To Build a quality the company's product design must meet customer's expectation and quality function deployment is a tool used to translate the preferences of the customer into specific technical requirements, it enables us to view the relationships among the variables involved in the design of a product, such as technical versus customer requirements.
6.ProcessManagement:
Under TQM quality of a product comes through continuous quality process. Therefore quality at the source is the belief that it is far better to uncover the source of quality problems and correct it than to discard defective items after production. The new concept of quality focuses on identifying quality problems at the source and correcting them.
7.ManagingSupplierQuality:
The philosophy of TQM extends the concept of quality to suppliers and ensures that they engage in the same quality practices. If suppliers meet preset quality standards, materials do not have to be inspected upon arrival. Today many companies have a representative residing at their supplier's location, there by involving the supplier in every stage from product design to final production.
PRINCIPLES OF TQM
TQM principles and philosophy is a managerial methodology therefore it is a frame work of principles as well as a systems approach. The principles of TQM are:
1. Quality Integration
Dr. Ishikawa captures the spirit of TQM by saying "Quality means quality of work, quality of service, quality of information, quality of process,quality of divisions, quality of people including workers, engineers, managers and executives, quality of objectives, briefly speaking it is Total Quality, or companywide quality". The above definition show quality is integrated with various activities.
2. Quality First
"Deming gives a strong statement saying "Productivity increases with improvement of quality" therefore giving primary importance to quality the firm or company gain competitive advantage, increase market share and achieves its sales target ensuring customer confidence.
3. Customer Orientation:
Customers are most important asset of the organization customers are both outside customers who are clientele and within the organization they are employees therefore Dr. Ishikawa proposes that manufacturers must study the requirements of consumers and to consider their opinions when they design and develop a product.
Example- Motorola has a successfully working TQM process. Motorola's fundamental objective
(Everyone's overriding responsibility) is Total Customer Satisfaction. They have won the Baldrige award and are corporate leaders in TQM. They will tell you that implementing TQM was a sound business decision and a matter of survival for them. Similar cases are available from other large corporations. They require a working TQM process of all contractors doing work for them
4. Prevention rather than Inspection:
One of the core principle of TQM is a do it right the first time. So modern approach argues to stop problems at the beginning rather than at ending their Deming says ' inspection is too late, ineffective and costly'. The TQM approach is to do it right the first time rather than to react after the problem happened, problem prevention can be assured by controlling are process discovering problems, identifying their root causes then improving the process in order to avoid the problems.
5. Factual Based Decisions:
Dr. Ishikawa proposes the following steps for conducting factual based decision in order to ensure that any analysis has the right basis for decision making:
1. Clearly recognizing facts, then
2. Expressing those facts with accurate data and finally,
3. Utilizing statistical methods to analyze the data.
Dr.Kaoru Ishikawa
Dr. Ishikawa suggests seven tools and he believed these tools should be known widely as 'seven basic tools of quality' they are:
1. Pareto analysis
Pareto analysis is designed by Alfredo pareto. The pareto diagram is a form of bar chart with the items arranged in descending order so that one can identify the highest contributing factors to a problem. This technique prioritises the types or sources of problems.
2. Stratification
The main objective of stratification is to grasp a problem or to analyze its causes by looking at possible and under standable factors or items. Eg: Data collected of a single population is divided by time, work force, machinery working methods, raw materials, so on in to a number of stratums to find certain characteristics among the date or they are same or similar.
3. Histograms
A histogram is a graphical representation of the variation in a set of data. Histograms are another form of bar chart in which measurement are grouped into bins, in this case each bin represent a range of values of some parameter. It shows the frequency or number of observations of a particular value or with n as specified group.
4. Scatter Diagrams
A scatter Diagrams examines the relationship between paired data, scatter diagrams are mainly used in quality circles when it wants to establish the relationship between cause and effect, the relationship between one cause and another Eg. Relationship between an ingredient and the hardness of a product, relationship between the speed of cutting and the variation in the length of parts cut.
5. Process Control charts:
Process control charts are the most complicated of the seven basic tools of TQM. These tools are part of statistical process control; the charts are made by plotting in sequence the measured value of samples taken from a process.
6. Check sheet:
Check sheet are forms used to collect data in an organized manner. They are used to validate problems or causes or to check progress during implementation of solutions. Check sheets come in several types, depending on the objective for collection data. Some of the types are:
1. Recording check sheet
2. Location check sheet
3. Checklist check sheet
7. Cause and Effect Diagram
The cause and effect diagram is the brilliant scientific diagram by Dr. Kaoru Ishikawa who pioneered quality management processes and became one of the founding father of modern quality management.
The Cause and Effect diagram is used to identify all the potential causes that result in a single effect. Firstly all causes are arranged on the basics of their level of importance and resulting in a depiction of relationships and hierarchy of events by this the root cause is identified the areas of occurrence of problems is found with the use of Ishikawa diagram.
When there is a team approach to problem solving the Ishikawa diagram is the powerful tool to capture different ideas and stimulate the team's brainstorming to diagram is also called fish bone diagram or cause and effect diagram.
The fishbone diagram expresses the various causes to specific problem and its effect if a quantitative data is available it is a comprehensive tool for in-depth analysis.
TQM is the foundation of activities, which include:- Commitment by Senior Management and all Employees- Meeting Customer Requirements- Just In Time- Improvement teams- Reducing product and service costs- Employee Involvement and Empowerment
- Recognition and celebration- Challenging Quantified goals and benchmarking- Focuss on processess/ Improvement plans- Specific Incorporation in strategic planning Continous Improvement through TQM:TQM is mainly concerned with continous improvement in all work from high level strategic planning and decision-making, to detailed execution of work elements on the shop floor. It stems from belief that mistakes can be avoided and defects can be prevented. It leads to continously improving results, in all aspects of work, as a result of continously improving capabilities, people, processes and technology and machine capabilities.A principle of TQM is that mistakes may be made by people, but most of them are caused, or at least permitted, by faulty systems and processes. This means that root cause of such mistakes can be identified and eliminated, and repetition can be prevented by changing the process.There are three major mechanisms of prevention:a. Mistake proofing – Poka-Yokeb. Where mistakes can’t be absolutely prevented, detecting them early to prevent
them being passed down the value added chain (inspection at source or by the next operation)
c. Where mistakes recur, stopping production until the process can be corrected, to prevent the production of more defects (stop in time)
2.What is relevance of Customer satisfaction in Quality Management? What is Customer Relationship Management? Explain.
Customer Satisfaction
A person who employs the service or buys the product is often termed as consumer or customer. Two types of customers are identified by the customers: External and Internal.
* Internal customers are those lying within the organization like engineering, order processing etc and * The external customers are those who are outside the organization and buy products and services of the organization.
Famou quote from Mahatma Gandhi ‘A Customer is the most important visitor on our premises. He is not dependent on us, we are dependant on him. He is not interruption in our, he is the purpose of it. He is not an outsider in our business, he is part of it. We are not doing him a favor by serving him, but he is doing a favor by giving us an oppurtunity to do so’
Customer satisfaction is an important factor for the botton line. A study has shown that a company with 98% customer retention rate was twice as profitable as those 94%. Studies have also shown that dissatisfied customr tell atleast twice as many friends about has experiences than they tell about good ones.
‘customer loyalty’ is one of the driving factors to achieve sustained profitability and increased market share. Loyal customers are those, who stay with the company and make positive referrals. Satisfaction and loyalty are different concepts. Customers who are merely satisfied may often purchase from competitiors becasue of convenience, promotions and other factors. Loyal customers place priority on doing business with a particular company,
will often go out of the way or pay premium to stay with the company. Loyal customers spend more, are willing to pay higher prices, refer new clients and are less costly to do business with.
In addition to value, satisfaction and loyalty are influenced greatly by serving quality, integrity and relationships that organizations build with customers. One study was found that customers are 5 times more likely to switch because of perceived service problems than for price concerns or product quality issues.
Measurement and Benefits
The above diagram depicts the process through which customer needs and expectations are translated into inuts from design, production and delivery processes
True customer needs and expectations might be called – Expected Quality. This was customer assumes will be received from the product, these needs and expectations are translated in to specifications for products and services (Design Quality)
Actual Quality is the outcome of production process and what is delivered to customer. However, actual quality may differ considerably from expected quality if information on expectations is misinterpreted or gets lost from one step to the next step in the flow map.
Customer needs and expectations (expected Quality)
Identification of Customer Needs
Translation in to product/ service specifications (design quality)
Output (Actual Quality)
Customer Perceptions (Perceived Quality)
Customer assesess quality and develop perceptions (Perceived Quality) by comparing their expectations (Expected Quality) with what they receive (Actual Quality). If the actual quality fails to match the expected quality, then the customer will be dissatisfied. On the other hand, if the actual quality exceeds expecations, then customer will be satisfied or even surprisingly delighted. As the perceived quality drives the customer behavvior, producers should make every effort to ensure that actual quality conforms to the expected quality
It should be noted that the customer perceptions are not statis but keeping changing over time. Hence rpoducers are expected to be on their toes to meet the expecations
Understanding these relationships requires a system of customer satisfaction measurement and ability to use customer feedback for imrpovement. It requires that producers must take great care to ensure that customer needs are met or exceeded by both design and production process
The producers are required to look at the processes through the customers eyees and not the organizations. An organizations focus is often reflected by measures that it uses to evaluate its performance. When a organizations focus is on such things are production schedules and costs productivity or output quantity rather than ease of production use, availability or cost, it is difficult to create customer – focussed culture
Consumer perception of quality:
As the customer's need, expectation and values keep on changing, there is no such picture of customer's quality need. As according to ASQ, survey, important factors for purchase for the customer are:
* Features * Performance * Price * Service * Reputation and * Warranty
TQM requires customer feedback to be continuously monitored. It is required to identify costumer dissatisfaction, needs, opportunities for enhancement and comparison with substitute in the market.
Methodology for feedback involves comment card, survey, focus group, toll free numbers, report card, internet, customer visits, employee feedback and using standard indexes like ACSI of "American Customer Satisfaction Index". ASCI allow contrast in between company and industry averages.
Using customer Complaints:
Studies suggest that the customer who did not complain is most prone to switch to another product. Every individual complaint is needed to be entertained. Results also suggest that half of the dissatisfied-customers will buy again if they feel that their complaint had been addressed.
Service Quality:
Research suggests that elements of customer service are:
* Customer care: A firm must revolve around the customers. * Communication: Communication with customers is essential. * Organization: Such that same level of quality can be delivered to everyone. * Front-line people: Only the best employees should be allowed to communicate with the customers. * Leadership: Involvement of management is essential in any quality management process.
Translating needs into requirements:
Kano model is the most basic conceptualization of customer requirement. There are three lines-red, blue and green to explain its ideology. The red line shows innovation, blue shows spoken and expected requirement and green line shows unspoken and expected requirements.
Kano model is based on an assumption that a customer buys when he needs something, however is it not completely true, an organization must overflow the customer needs. This can be understood by "Voice of the customer" concept.
Customer Retention:
It is more powerful and efficient in company's point of view as with customer satisfaction. It is involved with the activities which basically are related to customer satisfaction in order to increase the loyalty of the customers towards the company.
It moves customer satisfaction to next level by determining what is actually important for the customer.
CRM stands for Customer Relationship Management. It is a process or methodology used to learn more about customers' needs and behaviors in order to develop stronger relationships with them. There are many technological components to CRM, but thinking about CRM in primarily technological terms is a mistake. The more useful way to think about CRM is as a process that will help bring together lots of pieces of information about customers, sales, marketing effectiveness, responsiveness and market trends.
CRM helps businesses use technology and human resources to gain insight into the behavior of customers and the value of those customers
Excellent customer relationships management depends on following aspects:Accessibility and commitmentsSelecting and developing customer contact employeesRelevant customer contact requirementsEffective complaints managementStrategic partnerships and alliances
3. Explain the concept of “Cost of Quality” with Examples.

Philip Crosby has pointed out that Higher quality means, lower costs and expensive. In fact, efficient processes consume more resources and produce more wastes there by increasing the costs. In his famous book, ‘quality is free’ Crosby give umpteen examples that out come of well run processes result in optimum costs and the inefficient processes result in higher costs. Systematic quality improvements ensure efficient processes which in turn consume optimum resources. Reduce wastes to minimum or nil. It is generally known that if the results of inefficient process are converted in to monetary terms and reported to top managemetn, it will attract immediate attention and convey the gravity of situations, similarly benefits of improved process through quality improvement programs can be converted into monetary benefits and highlight the benefits of such improvement initiatives. The results of processes converted in to monetary terms are referred as ‘cost of quality’
The concept emerged in 1950s, and was first described by Armand Feigenbaum
The "cost of quality" isn't the price of creating a quality product or service. It's the cost of NOT creating a quality product or service.
Every time work is redone, the cost of quality increases. Obvious examples include:
The reworking of a manufactured item. The retesting of an assembly. The rebuilding of a tool. The correction of a bank statement. The reworking of a service, such as the reprocessing of a loan operation or the replacement of a
food order in a restaurant.
In short, any cost that would not have been expended if quality were perfect contributes to the cost of quality.
Prevention Costs
The costs of all activities specifically designed to prevent poor quality in products or services.
Examples are the costs of:
New product review Quality planning Supplier capability surveys Process capability evaluations Quality improvement team meetings Quality improvement projects Quality education and training
Appraisal Costs
The costs associated with measuring, evaluating or auditing products or services to assure conformance to quality standards and performance requirements.
These include the costs of:
Incoming and source inspection/test of purchased material In-process and final inspection/test Product, process or service audits Calibration of measuring and test equipment Associated supplies and materials
Failure Costs
The costs resulting from products or services not conforming to requirements or customer/user needs. Failure costs are divided into internal and external failure categories.
Internal Failure Costs
Failure costs occurring prior to delivery or shipment of the product, or the furnishing of a service, to the customer.
Examples are the costs of:
Scrap Rework Re-inspection Re-testing Material review Downgrading
External Failure Costs
Failure costs occurring after delivery or shipment of the product — and during or after furnishing of a service — to the customer.
Examples are the costs of:
Processing customer complaints Customer returns Warranty claims Product recalls
Total Quality Costs:
The sum of the above costs. This represents the difference between the actual cost of a product or service and what the reduced cost would be if there were no possibility of substandard service, failure of products or defects in their manufacture.
As defined by Crosby ("Quality Is Free"), Cost Of Quality (COQ) has two
main components: *Cost Of Conformance* and *Cost Of Non-
Conformance* (see respective definitions).
Cost of quality is the amount of money a business loses because its
product or service was not done right in the first place. From fixing a
warped piece on the assembly line to having to deal with a lawsuit
because of a malfunctioning machine or a badly performed service,
businesses lose money every day due to poor quality. For most
businesses, this can run from 15 to 30 percent of their total costs.
Cost of Poor Quality - COPQ
COPQ consists of those costs which are generated as a result of producing defective material.
This cost includes the cost involved in fulfilling the gap between the desired and actual
product/service quality. It also includes the cost of lost opportunity due to the loss of
resources used in rectifying the defect. This cost includes all the labor cost, rework cost,
disposition costs, and material costs that have been added to the unit up to the point of
rejection. COPQ does not include detection and prevention cost.
COPQ is annual monetary loss of products and processes that are not achieving their quality
objectives. The COPQ is not limited to quality but essentially the cost of waste associated in
poor performance process
There usually goes confusion between these two definitions COQ and COPQ.
Cost of quality (COQ) is actually a phrase coined by Philip Crosby, noted quality
expert and author and originator of the “zero defects” concept, to refer to the costs
associated with providing poor-quality products or services. Many quality
practitioners thus prefer the term cost of poor quality (COPQ).
To illustrate the impact this can have on the workforce can not be underestimated.
With a little imagination you could imagine the impact of storing all scrap for one year
then presenting it as an "in-your-face" visual presentation tactic at a business
improvement initiative.
Cost Of Conformance
(COC) A component of the *Cost Of Quality* for a work product. Cost of conformance is the
total cost of ensuring that a product is of good *Quality*. It includes costs of *Quality
Assurance* activities such as standards, training, and processes; and costs of *Quality
Control* activities such as reviews, audits, inspections, and testing.
COC represents an organisation's investment in the quality of its products.
Cost Of Non-Conformance
(CONC.) The element of the *Cost Of Quality* representing the total cost to the organisation
of failure to achieve a good *Quality* product.
Cost of Poor Quality (COPQ)
Cost of Non-Conformance
Cost of Inefficient Processes
Cost of los oppurtunities for sales income
CONC includes both in-process costs generated by quality failures, particularly the cost of
*Rework*; and post-delivery costs including further *Rework*, re-performance of lost work
(for products used internally), possible loss of business, possible legal redress, and other
potential costs.
Cost of Quality (COQ )
1. Cost of Control (Conformance)
Prevention Cost
Appraisal Cost
2. Cost of not controlling (Non-conformance)
Internal Failure Cost
External Failure Cost
Wanna know the definitons more clearly? Here they are:
Four categories of costs contribute to an organization’s overall COQ:
1. Internal failure costs - costs associated with defects found before the
customer receives the product or service
2. External failure costs - costs associated with defects found after the
customer receives the product or service
3. Appraisal costs - costs incurred to determine the degree of conformance to
quality requirements
4. Prevention Costs - Costs incurred to keep failure and appraisal costs to
minimum.
Table - Examples of Quality Costs Associated with Software Products
Prevention Appraisal
Statistical Process Control Capability/feasibility studies Improvement programmes Preventive actions Consultancies Training Procedures/Work instructions Communications
Calibration systems
Inspection
Design review Code inspection Audit (internal & external)
Testing
Glass box testing Black box testing
Training testers Beta testing Test equipment & automation Usability testing
Pre-release out-of-box testing by customer service staff
Internal Failure External Failure
Rectification Scrap Rework Concessionary work Investigations
Corrective Actions
Rectifying returned products Replacements Warranty claims Complaints Site repairs Lost custom/reputation
Legal ramifications
The minimum total cost,for example is shown below as being achieved at
98% perfection. This percentage is also known as best practice. That is,
the cost of achieving an improvement outweighs the benefits of that
improvement.
In my previous post, similar cost curve created doubts to few as the X-axis was labelled "Defects" there. In fact it is the Degree of perfection achieved towards the individual curves like Appraisal, Prevention etc. In few instances, this axis is taken with increasing Quality of Design.Allocation of Overheads to Cost of Quality:This issues often come up while calculating cost of quality. Any of the following 3 approaches may be followed. However, it is particularly
important to strictly adhere to the approach selected for over a period of time
a. Include total overheads using direct labour or some other base
b. Include the variable overhead onlyc. Do not include any overhead
Allocation of overhead has an impact on total costs of quality and on distrbution over various departments. Activity Baesd costing (ABC) can help to provide realistic allocation of overhead costs
4. Discuss how Planning for Measurement of Quality and its Control is done.Change in process will bring lot of benefit. Understanding best to visualize business as series of pipes containing products, information and money. If we dont spiral up towards less. It is hard, if not impossible to stay on a plateau, maintaining quality in a world or human error, mechanical failure and general change requires constant checking. The constant checking if we do it naturally leads to some degree of improvement. without that constant checking, quality is sure to degradeIf our competitors keep the focus on quality in an effective way, we will fall behind fast particularly in market shareA steady commitment to quality solves other problems, such as customer retention and employee retension, reducing cost of sales and cost of operations
If we think of task on having three core elements, and four ancillary elements, the major are:- Inputs, which are the ingredients, raw materials, or components that go into a process and become part of the output-Process, the activity of transforming inputs to make outputs the work-Outputs, the end results of a task, such as component or a finished product
Additional, minor elements are:Tool or equipment, which are used for task but not used upResources, including disposable items (such as cleaning supplies), and our effort, which are used up in the process but do not get included in the productTechniques, the instructions for the work processWork Environment, space and conditions within which the work is being done. Of course, each product may be built using many tasks- perhaps thousands or even millionsTasks are linked because output of one task is the input of another, until, we can link suppliers through all the tasks to the cut output- customer modelOf course, single product or company has many such chains that link all suppliers through many processes to all customers. We can map the five stages of our quality management framework to the SIPOC model as follows:- Quality definition comes before definition of processes- Quality planning includes defining what processes are required to deliver the product to meetOr exceed expectations, putting them in order by linking outputs of one process to inputs of the next, and then defining all seven aspects of each process with requirements and tolerances on all key variables, so that we can consistently produce all outputs of all processes to specification.- Quality control in broad sense including all forms of checking ensures that outputs and process meet requirements, that defective output is reworked or scrapped, and that all seven aspects of processes are adjusted and restored to work within tolerances-Quality assurance included activities to evaluate nad improve processes, re-engineer work to eliminate unnucessary processes or steps, ensure effective communication and mutual understanding throughout the SIPOC chain, and auditing and review to ensure all processes are maintained to standard and improved-Delivering quality means carrying the SIPOC chain all the way through to customers receipt of product or service, to the customer’s perception that he or she has indeed received value and quality in the product, service, and contact with the company.Defining Quality: Requirements ElicitationFew practices for obtaining good requirements.- Define your goal clearly at the start. Are you seeking tolearn about what your customers do and don’t like about your current product. Are you seeking to compare customer opinions of your product or service and your
competitors ? are you seeking to determine what specific changes to your product or service the customers most wantMake it interactive, we learn more by letting customers try out or taste or play with a sample or prototype than we do by asking questions. We want the customers focussed on product, not on us. If a prototype or sample isn’t possible, then we should use pictures, charts and diagrams.Record everything, if possible videotape or audiotape the sessions. If not, have two note takers so you lose as little as possibleUse industry best practices, such as focus groups and structure requirements elicitation methodsStudy your results, dont just gather a lot of data and ignore it. Put it all together and learn what you need to know. Quality management demystified will help with many analytic tools, the most important of which is plan, do, check and act (PDCA)Check and test your results, if you have limited set of customers, or customer representatives (such as marketing department) have them check and improve what you come up wiht from the sessions before it goes final. Otherwise, use multiple methods, such as a survey, a focus group and limited pilot product launch before you go into full production. After eliciting requirements, we will need to organize them into a clear, useful requirements specification. The best description one notice is found for what makes a good requirements document is from institute of electrical engineers, in their standards 1830-1993. ‘IEEE recommended practice of software requirements specifications’ summarized here in table.Characteristic
Description
Complete Nothing is missing, all attributes relevant to customer satisfaction are included, defined and given tolerances
Consistent Specification contains no internal contradictionsCorrect Specification accurately reflects customers and
stakeholders wants and needsFeasible Delivering to the specification is possible with technology
that is available can be obtained or can be developed. Delivering to specification is possible within time, cost and other constraints
Modifiable Specification is designed so that future changes can be made in a defined, practical, traceable way.
Necessary Each requirement adds value for customerpriortized Requirements are ranked as to how essential it is to
include each in the book. A group at the top may be
listed as required, and then optional ones listed below that, in priority order
Testable Each requirement must be defined in a way that will allow for one or more tests of either process or product that will ensure conformance and detect error
Traceable Each element is uniquely identified so that its origin and purpose can be traced to ensure that it is necessary, appropriate and accurate, this usually means assigning a number or code to each requirement that doesn’t change, and then adding codes to indicate changes to a requirement and giving requirement and giving each new requirement its own code or number
unambigious Each requirement has only one possible interpretationPlan for quality. Initially requirements specification is obtained. Definition of reviews, inspections and tests are planned. We define our approach to QA, QC, rework and scrapping, process improvement, and delivering customer delight. Of course, we may have standard practices we always use, in which case we adapt them for this particular project, service or product. We also need to make sure that our practices are upto date, conforming to current versions of relevant standards and regulations. And we may want to research best practices.Information obtained about quality and quality management from any process to improve thw way we do quality work. When we do, that will require additional planning. E.g., suppose a team member suggests a way that we can sell items that were being scrapped to different, less demanding market. We need to do lots of planning work, we define new market, see if it is really viable, and then define tests for scrap to make sure they meet lower requirements of that market. When we make use of what we learnt as we go by feeding that knowledge into ongoing quality plan and implement same. We accelerate continous improvement cycle and add value for companyCheck: Quality Control and Inspection.Classically called as inspection as well as statistical quality control. Both has goal conformance to specifications. Both require clear specification of each attribute, so it is definable and subject to a process that determines if result matches the requirement or falls within tolerances. Both can use review of documents, inspection of attributes, or testing of components as the method by which information is gathered. The results of both lead directly to a choise of allowing the rror through rework with retesting, scrapping. Both also feed information back into control of manufacturing process, so that future, similar problems can be prevented by bringing
process under control and by performing root cause analysis and applying a permanent preventive solutionClarifying ideas about inspection.In few circles, inspection has got bad name, as a result of misunderstanding of things that a number of quality gurus including W.Edwards Demings say, ‘Quality comes from Inspection, but improvmenet of process’ and old way : Inspect bad quality out, the new way; build good quality in’ Unfortunately, although he said ‘eliminate sologans,’ people have turned comments about inspection into a slogan, and then misunderstood and misapplied it. Deming’s point was not that inspections should be stopped, but it was to do more than just one product into scrap pile or rework line. We should information from inspection to imrpove way we do things so that we can build quality in. Inspection is essential to Deming’s total quality management because, by detecting errors we gather information for root cause analysis that will allow us to eliminate themOther misconception that, Statistical Quality Control methods can be applied if large quantities of identical components or products so precise measurements can be made to match against specifications and tolerances.Another misconception that inspection implies by people, human beings rather than machines. There are limits to effectiveness of inspection by human beings, now technology is developed to computer controlled sensors and robotic devices that perform inspections. In electronics manufacturing, for instance there are robots that can maniupulate a circuit board and test every circuit on every board, so that inspection is once again replacing statistical quality control. While human inspection cannot eliminate all errors, automated or robotic inspection is part of wave for futureQuality Assurance: developed in North Americal while TQM was developing in Japan. QA Focussed on solving quality problems, rather than living with rework and scrapping. The major difference between QA and TQM vis that QA was usually performed at an engineering or management level with little executive support. Also, QA tended to gather information by auditing after the fact, which meant that it didn’t bring in rapid benefits the way that methods that focus on earliest parts of process can. QA focussed on production the ratio of 10 in 1.10.100 rules more than on planning and requirements definition, where there is more to be gained. Nonetheless, QA offer some distinct and useful ideasProduct re-engineering: this is where we examine failure points of the product, and then redesign it to have fewer failure points. E.g,. if solder
joints often fail in testing, or too soon after delivering to customer, e might design the product to have fewer parts so that there are fewer solder joints, or we might use a different method for joining partsProcess Re-engineering: helps to reduce errorsEvaluation of customer satisfaction and customer service information: QC only had information from inside factory, QA gathered information from customers, service companies, company own repairment and used that to identify problemsCommunication across departments: QA experts saw quality problems unclear requirements.Communication with vendors: Bringing internal and vendor engineers and managers together to resolve quality problems across supply chain were a part of QA. QA offered many good ideas and added value but, did not produce transformative results that TQM did. QA had too little clout, engineers and some managers saw its value, but they were unable to convince upper management. As a result, productivity demans increased, people working on QA were told to ‘quit talking and get back to work’ QA was actively discoraged for another reasons, until difficult economic times of 1970, Hnery Ford’s methods were unchallenged in North America. The assembly line focussed on productivity and efficiency, not on quality, worse, shops were run by theory Y managers, and workers were assumed to be slackers. Disrespected workers build strong unions that were very ready to strike.In this environment of conflict, quiet voice of QA engineers and managers who saw a better way a way cooperative improvement was lost. By too late, means that QA focussed primarily on audits and defective products, and did not reach realization of implications, QA when supported and sustained, can add real value to organization.
5. What are the Barriers to Quality? Explain different ways to overcome Barriers to Quality.Barriers are found never ending with plenty of issues. In fact it starts from top management itself and flows down to all working levels. This is so in all business sectors, whether they are manufacturing, services, government and even educationPhysical: (Processes, Tools, Strcutures, Organization Design and Management perspectives)Infrastructure (Strategy, Measurements, Rewards, Systems and Procedures)Behavioral (What groups or individuals do)
Cultural (Deeply held assumptions, values, beliefs and norms, attitudes, values and beliefs)
Barriers/ obstacles of the groups are discussed with feasible actions to overcome such hindrance factos. While such obstacles are interrelated, it may be difficult to categorize them exactly to any one specifically
Physical/ management perspectivesSome of the attributes that may pose threat as barriers, which requires positive actions from management, are listed below
1. Lack of management commitment/ lack of leadership2. Inability to change the mind set (paradigms) of Top
Management3. Inability to maintain momentum for the transformation4. Lack of uniform management style5. Lack of longterm corporate directions6. Inability to change the culture of an organization7. Lack of effective communication8. Lack of discipline require to transform9. Incompatible organizational structure10. Isolated individuals and departments11. Who is responsible ? Inadequate empowerment and
team work12. Setting priorities13. Paying inadequate attention to internal and external
customer14. Ineffective measurements, lack of access to data and
results15. Organizational politics16. Lack of time
Lack of management commitment/ lack of leadershipThis will stop quality management efforts impeding quality management create a situation caled ‘slow death.’ This is similar to a plant whose parts
like leaves, branches and trunk has natural inclination to grow, but the gardner neglects and allows that plant to have a slow death. Therefore the gardener neglects and allow that plant to have a slow death. There fore, the gardener (top management) must create and direct energy necessary to transform an organization- when management commitment is missing, organizations will experiencef low employee participation in TQM program- there are two sources of energy, ‘a crisis or a vision’. Certain companies begin a program on QM as a reaction to the crisis, which may reflect on roganization’s inability to be competitive due to low quality and productivity- Top management can uncover and bring to the forefront the real or potential crisi through a probing question, in a brain storming sesson to make their employees to understand the real crisi and ask them commit to quality, productivity etc. Top management should develop a transformation plan- Another method is to transform via a vision. A vision can stimulate top management to expend energy needed to transform and as a rallying point for the creation of quality. A vision should inspire people to take action to transform their organization and should have long term purpose. The top management should initiate action via a crisis and or a vision process, synthesize the study and digest the crisis being faced and then formulate and articulate the vision of the organization, thus promoting commitment to transformation- Next Issue is the leader to the team. Is he committed to quality ? Without a good leadership, quality success is likely to be doomed. Lack of evidence of this commitment at the leader level may result in damaging results
Lack of Communication:- Eliminating communication barriers between management can improve production and increase product and service quality- Communication barriers can prove detrimental particularly those that isolate departments and individuals can prove detrimental- Both employees and management need to know ‘what is going on to be effective, so also customers and suppliers need to be involved- communication being a management responsibility and one of the major barriers to quality, top management should answer certain questions like - does organization design support or inhibit quality achievement
- Is Quality recognized as a problem- Is focus right for achieving quality
- Is mindset holistic or reductionist- what is relative health of orgganization Quality Improvement
Initiative- What are strength, ‘assets’ that support & reinforce quality
improvement efforts- Areas failing in sustaining quality improvement Philosophy- Are you seeing Quality results you had hoped for
Top Management’s commitment, support to total quality management program and proper communication will soften the barriers and promote team workRemoving barriers will increase employee’s perception of organization. Work satisfaction will improve as employees will better use of their resources
Incompatible Organizational Structure- Autocratic organizational structure and policies can lead to
implementation problems. If organizational structure is a problem and incompatible then it should be restructured for expected outcomes
Isolated Individuals and Departments- Teamwork is an essential part of TQM environment. When
TQM principles are used, isolation of individuals and departments will dissolve overtime. Team work for problem solving by using SQC tools will analyze root cause and easily solve then, thus taking advantage of their team work efforts
Ineefective Measurement Technique, Lack of Data and Results- Ineffective measurement techniques or absence of a
measurement process, maintaining inaccurate data, and lack of access to data may run as counter measure to TQM principles. Hence, quick easy access to data is important, data retrieval must be efficient, not time consuming or labour intensive
- Further, decision makers must also receive training in data analysis and inter[retation so that the measurement system will serve its intended purpose
Paying inadequate attention to internal and external customersOrganizations must pay attention to both internal and external customers and understand their needs and expectations. Managers may assume about customer needs and expectations, resulting in misdirected efforts and investments. This brings in customer dissatisfaction and labour mistrust
Not defining the ‘Quality’ properlyMany companies are cofused in defining quality. A specified definition by the management will help others to understand the meeting of quality and work for it
Focus on quick fix- Management is under constant pressure to find and fix
problems quickly, with immediate results. Instead, they must provide a long-term focus and look towards the future. Organization should focus on quality problems
Responsibility: Responsibility on quality aspects must be spelt out and owned rather than passing the buck. This approach is a barrier in itself
‘what’ we know and don’t know about people, equipment, processes, products and services is a barrier. Managers should know what is known and what is unknown, and plan for the right training. Management must provide employees with the oppurtunity to really do their job and have pride in their workmanship.Failure to understand the skeptismPeople inside have seen the previous programs, have failed and maangement fails to understand the conviction of a) need for quality effort b) determination to make efforts a successAny exhortation approach with work may not help as motivational technique and to inspire everyone to do better may not be forthcoming
6. What are Quality Standards? Write a note on the ISO 9000 series of Quality Standards and Malcolm Baldrige Criteria for Business Performance Excellence
QM0010 – Foundation of Quality Management – 4 Credits
Assignment Set-2 (60 Marks)
Note: Each question carries 10 Marks. Answer all the questions1. Discuss the role of quality in society and economy.
Environment surrounding the organization is both external and internal. External like Political, Economical, Environmental and Social. Quality is taken as synonymous with excellence an important element of quality. A more pragmatic, useful concept is one of ‘fitness for purpose’ or ‘satisfaying the customer’s need’Quality approach is to achieve excellence on economical, social and ecological parametes. It emphasises to provide quality in every dimension, process, system to all social, economical and
environmental factors. The focus is on wastage elimination, quality, efficiency, productivty, growth and overall quality.Business conditions are changing and evolving so as economic environment. In competitive environment, organization requires new approaches to survive. Quality is becoming prime priority for most organizations and implementing a quality system requires managmeent commitment to develop a quality assurance program. This embraces a variety of activities designed to ensure reliability in first place, specific quality control measures to monitor quality on routine basis.Goal of Quality system should be to avoid errors rather than to detect them. The reduction of correction costs is recognized as benefit which can be offset against cost of systemThe quality economical approach is to provide quality product or service at competitive prices while reducing wastage, decreasing cost, providing high customer satisfaction, gaining competitve advantage, provide a vibrant economy that affects in terms of taxation, government spending, general demand, interest rates, exchange rates, overall development and gowth.Some Quality Economical aspects:Reduce Cost: Organizations are struggling to provide quality at lesser cost to gain competitive edge. Quality helps an organization to reduce wastage and come up with quality product or service at competitive priceNow question arises as how to reduce cost and get quality.Quality costs are cost of not doing right things right first time or cost incurred because failure is possiblePhilip B.Crosby published in book ‘Quality is Free’ stressed upon the removal of defects which is in built cost in running any business. There are various costs associated, with quality negligenceCrosby suggested that by eliminating all errors and reaching zero dfects, it will not only reduce cost but also satisfy customersReduce Wastage: Wastage increases cost and lead to high pricing and in competitive scenarios it is difficult for organization to survive with high cost product. Quality approach provides elimination of wastage at every process. Wastages are due to mistakes and wrong process. Like Poka Yoke (Mistake proofing) – a method that concentrates on elimination of mistakes to avoid wastage.Gain Competitive advantage: Sustain competitive market that an organization needs to perform above average. Quality system designed on people centric approach is viable, other important thing is ability of organization to win or retain customers, its image or credibility, and staff morale.Tools to gain competitve advantage
- Creativity and Innovation: ‘ to produce artistic or imaginative efforts’ and innovation means doing something new or unusual ‘together they mean doing or producing something new or unusual through imaginative efforts’
- Poke Yoke: Mistake proofing process which focus on two aspects such as predicting and recognizing hat defect is about to occur, and then provide signals and warning by detecting and recognizing error after it has occurred and then stopping the process so that no further errors can be done.
- Just In Tme: developed in Toyota Motor Co (Japan) - Other tools like, Kaizen, Zero Defect Program, Benchmarking, Business Process Re-
engineering, Six SigmaQuality Social approach is to provide quality in every dimension of life – Health, Education, Culture, family religion, environment, society, Quality is as large as life itself.People centric and customer focussed: Quality is about meeting or exceeing customer expectations. The customer is judge of quality, value and product. Total quality approach focusses on customer satisfaction and delight in terms of product quality and services. The approach is customer satisfaction
through innovation, as there are many factors throughout customers overall purchase and service experiencesTo accomplish company effort need to extend well beyond merely meeting specifications, reducing errors, or resolving complaints, the entire process of a company shall be unending chain to delivery improve products and services. This must include both designing new products that truly delighting customer and responding rapidly to changing consumer and market demands. A company should focuses on customer needs and wants, and know how customer uses it, and anticipates needs that customer may not even able to express. The approach focusses on continually development of new ways of enhancing customer relationship. Underlying approach is total customer satisfaction
Social factors influencing quality:Changing Customer: Customer base are changing with globalization, new geographical areas, different customer tastes, perception, choices. An organization needs to cope with changing requirements and serves to provide best quality in order to gain performience in the market. As some of the companies are entering industrial and consumer market for first timeChanging customer needs : The customer expectations have spawned by competition, in many forms the needs are changing, organizations need to keep pace with changing customer need, with innovative product line and creative process and adding value at every step.Changing product mix: The organization needs to keep pace with market and customers demand, therefore it requires that they should provide correct product mix. E.g., earlier computer manufacturer were focussed primarily on low volume and high price mix now it is shiften to a mix that includes high volume and low priceProduct complexity: With changing demands and perception, organization are stressing on new innovative ideas to gain competitive advantage. The system and products have become more complex.
2. Explain the concept of Knowledge Management. With an example, describe the role of “Quality” in Knowledge Management
Information relases to description, ‘ definition or perspective (what, who, when wehre)Knowledge comprises strategy, practice, method or approach.
Knowledge management (KM) is a relatively new form of MIS that expands the concept to include information systems that provide decision-making tools and data to people at all levels of a company. The idea behind KM is to facilitate the sharing of information within a company in order to eliminate redundant work and improve decision-making. KM becomes particularly important as a small business grows. When there are only a few employees, they can remain in constant contact with one another and share knowledge directly. But as the number of employees increases and they are divided into teams or functional units, it becomes more difficult to keep the lines of communication open and encourage the sharing of ideas.
3. Explain Kaizen Approach to Problem Solving, with an example.4. What is meant by Quality Assurance? Explain with an example how Supplier’ quality affects
the cost of manufacture.
5. Describe the meaning and importance of Quality Audit. List the general guidelines for carrying out a quality assurance audit.
6. What is meant by Service Quality? Describe the “Gap Model of Service Quality”
QM0011 – Principles and Philosophies of Quality Management 4 Credits
Assignment Set-1 (60 Marks)
Note: Each question carries 10 Marks. Answer all the questions1.Write a note on “Quality Gurus”.
The Quality Gurus—Dr. W. Edwards Deming, Dr. Joseph Juran, Philip Crosby, Armand V. Feigenbaum, Dr. H. James Harrington, Dr. Kaoru Ishikawa, Dr. Walter A. Shewhart, Shigeo Shingo, Frederick Taylor, and Dr. Genichi Taguchi—have made a significant impact on the world through their contributions to improving not only businesses, but all organizations including state and national governments, military organizations, educational institutions, healthcare organizations, and many other establishments and organizations.
DR. W. EDWARDS DEMING (1900–1993)
Dr. W. Edward Deming is best known for reminding management that most problems are systemic and that it is management's responsibility to improve the systems so that workers (management and non-management) can do their jobs more effectively. Deming argued that higher quality leads to higher productivity, which, in turn, leads to long-term competitive strength. The theory is that improvements in quality lead to lower costs and higher productivity because they result in less rework, fewer mistakes, fewer delays, and better use of time and materials. With better quality and lower prices, a firm can achieve a greater market share and thus stay in business, providing more and more jobs.
When he died in December 1993 at the age of ninety-three, Deming had taught quality and productivity improvement for more than fifty years. His Fourteen Points, System of Profound Knowledge, and teachings on statistical control and process variability are studied by people all over the world. His books include: Out of the Crisis (1986), The New Economics (1993), and Statistical Adjustment of Data (1943).
In emphasizing management's responsibility, Deming noted that workers are responsible for 10 to 20 percent of the quality problems in a factory, and that the remaining 80 to 90 percent is under management's control. Workers are responsible for communicating to management the information they possess regarding the system. Deming's approach requires an organization-wide cultural transformation.
Deming's philosophy is summarized in his famous fourteen points, and it serves as a framework for quality and productivity improvement. Instead of relying on inspection at the end of the process to find flaws, Deming advocated a statistical analysis of the manufacturing process and emphasized cooperation of workers and management to achieve high-quality products.
Deming's quality methods centered on systematically tallying product defects, analyzing their causes, correcting the causes, and recording the effects of the corrections on subsequent
product quality as defects were prevented. He taught that it is less costly in the long-run to get things done right the first time then fix them later.
THE RISE OF DEMING'S INFLUENCE
The son of a small-town lawyer, Deming (a teacher and consultant in statistical studies) attended the University of Wyoming, University of Colorado, and Yale University, where he earned his Ph.D. in mathematical physics. He then taught physics at several universities, worked as a mathematical physicist at the U.S. Department of Agriculture and was a statistical adviser for the U.S. Census Bureau.
From 1946 to 1993 he was a professor of statistics at New York University's graduate school of business administration, and he taught at Columbia University. Deming became interested in the use of statistical analysis to achieve better quality control in industry in the 1930s.
In 1950 Deming began teaching and consulting with Japanese industrialists through the Union of Japanese Scientists and Engineers (JUSE). In 1960, he received the Second Order Medal of the Sacred Treasure from the Emperor of Japan for improvement of quality and the Japanese economy. In 1987 he received the National Medal of Technology from U. S. President Ronald Reagan because of his impact on quality in the United States.
From 1946 to 1993, he was an international teacher and consultant in the area of quality improvement based on statistics, leadership, and customer satisfaction. The Deming Prize for quality was established in 1951 in Japan by JUSE and in 1980 in the United States by the Metropolitan Section of the American Society for Quality.
American companies ignored Deming's teachings for years. In 1980, NBC aired the program "If Japan Can, Why Can't We?," highlighting Deming's contributions in Japan and American companies began to discover Deming. His ideas were used by major U.S. corporations as they sought to compete more effectively against foreign manufacturers.
As a consultant, Deming continued to conduct Quality Management seminars until just days before his death in 1993.
DEMING'S SYSTEM OF PROFOUND KNOWLEDGE
One of Deming's essential theories is his System of Profound Knowledge, which includes appreciation for a system, knowledge about variation (statistics), theory of knowledge, and psychology (of individuals, groups, society, and change). Although the Fourteen Points are probably the most widely known of Dr. Deming's theories, he actually taught them as a part of his System of Profound Knowledge. His knowledge system consists of four interrelated parts: (1) Theory of Optimization; (2) Theory of Variation; (3) Theory of Knowledge; and (4) Theory of Psychology.
THEORY OF OPTIMIZATION.
The objective of an organization is the optimization of the total system and not the optimization of the individual subsystems. The total system consists of all constituents—
customers, employees, suppliers, shareholders, the community, and the environment. A company's long-term objective is to create a win-win situation for all of its constituents.
Subsystem optimization works against this objective and can lead to a suboptimal total system. According to Deming, it is poor management, for example, to purchase materials or service at the lowest price or to minimize the cost of manufacturing if it is at the expense of the system. Inexpensive materials may be of such inferior quality that they will cause excessive costs in adjustment and repair during manufacturing and assembly.
THEORY OF VARIATION.
Deming's philosophy focuses on improving the product and service uncertainty and variability in design and manufacturing processes. Deming believed that variation is a major cause of poor quality. In mechanical assemblies, for example, variations from specifications for part dimensions lead to inconsistent performance and premature wear and failure. Likewise, inconsistencies in service frustrate customers and hurt companies' reputations. Deming taught Statistical Process Control and used control charts to demonstrate variation in processes and how to determine if a process is in statistical control.
There is a variation in every process. Even with the same inputs, a production process can produce different results because it contains many sources of variation, for example the materials may not be always be exactly the same; the tools wear out over time and they are subjected to vibration heat or cold; or the operators may make mistakes. Variation due to any of these individual sources appears at random; however, their combined effect is stable and usually can be predicted statistically. These factors that are present as a natural part of a process are referred to as common (or system) causes of variation.
Common causes are due to the inherent design and structure of the system. It is management's responsibility to reduce or eliminate common causes. Special causes are external to the system, and it is the responsibility of operating personnel to eliminate such causes. Common causes of variation generally account for about 80 to 90 percent of the observed variation in a production process. The remaining 10 to 20 percent are the result of special causes of variation, often called assignable causes. Factors such as bad material from a supplier, a poorly trained operator or excessive tool wear are examples of special causes. If no operators are trained, that is system problem, not a special cause. The system has to be changed.
THEORY OF KNOWLEDGE.
Deming emphasized that knowledge is not possible without theory, and experience alone does not establish a theory. Experience only describes—it cannot be tested or validated—and alone is no help for management. Theory, on the other hand, shows a cause-and-effect relationship that can be used for prediction. There is a lesson here for the widespread benchmarking practices: copying only an example of success, without understanding it in theory, may not lead to success, but could lead to disaster.
THEORY OF PSYCHOLOGY.
Psychology helps to understand people, interactions between people and circumstances, interactions between leaders and employees, and any system of management. Consequently,
managing people requires knowledge of psychology. Also required is knowledge of what motivates people. Job satisfaction and the motivation to excel are intrinsic. Reward and recognition are extrinsic. Management needs to create the right mix of intrinsic and extrinsic factors to motivate employees.
DEMING'S SEVEN DEADLY DISEASES
Deming believed that traditional management practices, such as the Seven Deadly Diseases listed below, significantly contributed to the American quality crisis.
1. Lack of constancy of purpose to plan and deliver products and services that will help a company survive in the long term.
2. Emphasis on short-term profits caused by short-term thinking (which is just the opposite of constancy of purpose), fear of takeovers, worry about quarterly dividends, and other types of reactive management.
3. Performance appraisals (i.e., annual reviews, merit ratings) that promote fear and stimulate unnecessary competition among employees.
4. Mobility of management (i.e., job hopping), which promotes short-term thinking. 5. Management by use of visible figures without concern about other data, such as the effect of
happy and unhappy customers on sales, and the increase in overall quality and productivity that comes from quality improvement upstream.
6. Excessive medical costs, which now have been acknowledged as excessive by federal and state governments, as well as industries themselves.
7. Excessive costs of liability further increased by lawyers working on contingency fees.
DEMING'S FOURTEEN POINTS
Deming formulated the following Fourteen Points to cure (eliminate) the Seven Deadly Diseases and help organizations to survive and flourish in the long term:
1. Create constancy of purpose toward improvement of product and service. Develop a plan to be competitive and stay in business. Everyone in the organization, from top management to shop floor workers, should learn the new philosophy.
2. Adopt the new philosophy. Commonly accepted levels of delays, mistakes, defective materials, and defective workmanship are now intolerable. We must prevent mistakes.
3. Cease dependence on mass inspection. Instead, design and build in quality. The purpose of inspection is not to send the product for rework because it does not add value. Instead of leaving the problems for someone else down the production line, workers must take responsibility for their work. Quality has to be designed and built into the product; it cannot be inspected into it. Inspection should be used as an information-gathering device, not as a means of "assuring" quality or blaming workers.
4. Don't award business on price tag alone (but also on quality, value, speed and long term relationship). Minimize total cost. Many companies and organizations award contracts to the lowest bidder as long as they meet certain requirements. However, low bids do not guarantee quality; and unless the quality aspect is considered, the effective price per unit that a company pays its vendors may be understated and, in some cases, unknown. Deming urged businesses to move toward single-sourcing, to establish long-term relationships with a few suppliers (one supplier per purchased part, for example) leading to loyalty and opportunities for mutual improvement. Using multiple suppliers has been long justified for reasons such as providing protection against strikes or natural disasters or making the suppliers compete against each other on cost. However, this approach has ignored "hidden" costs such as increased travel to visit suppliers, loss of volume discounts, increased set-up charges resulting in higher unit costs, and increased inventory and administrative expenses. Also constantly changing suppliers solely on the base of price increases the variation in the material supplied to production, since each supplier's process is different.
5. Continuously improve the system of production and service. Management's job is to continuously improve the system with input from workers and management. Deming was a disciple of Walter A. Shewhart, the developer of control charts and the continuous cycle of process improvement known as the Shewhart cycle. Deming popularized the Shewhart Cycle as the Plan-Do-Check-Act (PDCA) or Plan-Do-Study-Act (PDSA) cycle; therefore, it is also often referred to as the Deming cycle. In the planning stage, opportunities for improvement are recognized and operationally defined. In the doing stage, the theory and course of action developed in the previous stage is tested on a small scale through conducting trial runs in a laboratory or prototype setting. The results of the testing phase are analyzed in the check/study stage using statistical methods. In the action stage, a decision is made regarding the implementation of the proposed plan. If the results were positive in the pilot stage, then the plan will be implemented. Otherwise alternative plans are developed. After full scale implementation, customer and process feedback will again be obtained and the process of continuous improvement continues.
6. Institute training on the job. When training is an integral part of the system, operators are better able to prevent defects. Deming understood that employees are the fundamental asset of every company, and they must know and buy into a company's goals. Training enables employees to understand their responsibilities in meeting customers' needs.
7. Institute leadership (modern methods of supervision). The best supervisors are leaders and coaches, not dictators. Deming high-lighted the key role of supervisors who serve as a vital link between managers and workers. Supervisors first have to be trained in the quality management before they can communicate management's commitment to quality improvement and serve as role models and leaders.
8. Drive out fear. Create a fear-free environment where everyone can contribute and work effectively. There is an economic loss associated with fear in an organization. Employees try to please their superiors. Also, because they feel that they might lose their jobs, they are hesitant to ask questions about their jobs, production methods, and process parameters. If a supervisor or manager gives the impression that asking such questions is a waste of time, then employees will be more concerned about pleasing their supervisors than meeting long-term goals of the organization. Therefore, creating an environment of trust is a key task of management.
9. Break down barriers between areas. People should work cooperatively with mutual trust, respect, and appreciation for the needs of others in their work. Internal and external organizational barriers impede the flow of information, prevent entities from perceiving organizational goals, and foster the pursuit of subunit goals that are not necessarily consistent with the organizational goals. Barriers between organizational levels and departments are internal barriers. External barriers are between the company and its suppliers, customers, investors, and community. Barriers can be eliminated through better communication, cross-functional teams, and changing attitudes and cultures.
10. Eliminate slogans aimed solely at the work force. Most problems are system-related and require managerial involvement to rectify or change. Slogans don't help. Deming believed that people want to do work right the first time. It is the system that 80 to 90 percent of the time prevents people from doing their work right the first time.
11. Eliminate numerical goals, work standards, and quotas. Objectives set for others can force sub-optimization or defective output in order to achieve them. Instead, learn the capabilities of processes and how to improve them. Numerical goals set arbitrarily by management, especially if they are not accompanied by feasible courses of action, have a demoralizing effect. Goals should be set in a participative style together with methods for accomplishment. Deming argued that the quota or work standard system is a short-term solution and that quotas emphasize quantity over quality. They do not provide data about the process that can be used to meet the quota, and they fail to distinguish between special and common causes when seeking improvements to the process.
12. Remove barriers that hinder workers (and hinder pride in workmanship). The direct effect of pride in workmanship is increased motivation and a greater ability for employees to see themselves as part of the same team. This pride can be diminished by several factors: (1) management may be insensitive to workers' problems; (2) they may not communicate the company's goals to all levels; and (3) they may blame employees for failing to meet company goals when the real fault lies with the management.
13. Institute a vigorous program of education and self improvement. Deming's philosophy is based on long-term, continuous process improvement that cannot be carried out without
properly trained and motivated employees. This point addresses the need for ongoing and continuous education and self-improvement for the entire organization. This educational investment serves the following objectives: (1) it leads to better motivated employees; (2) it communicates the company goals to the employees; (3) it keeps the employees up-to-date on the latest techniques and promotes teamwork; (4) training and retraining provides a mechanism to ensure adequate performance as the job responsibilities change; and (5) through increasing job loyalty, it reduces the number of people who "job-hop."
14. Take action to accomplish the transformation. Create a structure in top management that will promote the previous thirteen points. It is the top management's responsibility to create and maintain a structure for the dissemination of the concepts outlined in the first thirteen points. Deming felt that people at all levels in the organization should learn and apply his Fourteen Points if statistical process control is to be a successful approach to process improvement and if organizations are to be transformed. However, he encouraged top management to learn them first. He believed that these points represent an all-or-nothing commitment and that they cannot be implemented selectively.
THE DEMING CYCLE
Known as the Deming Plan-Do-Check-Act (PDCA) Cycle, this concept was invented by Shewhart and popularized by Deming. This approach is a cyclic process for planning and testing improvement activities prior to full-scale implementation and/or prior to formalizing the improvement. When an improvement idea is identified, it is often wise to test it on a small scale prior to full implementation to validate its benefit. Additionally, by introducing a change on a small scale, employees have time to accept it and are more likely to support it. The Deming PDCA Cycle provides opportunities for continuous evaluation and improvement.
The steps in the Deming PDCA or PDSA Cycle as shown in Figure 1 are as follows:
1. Plan a change or test (P). 2. Do it (D). Carry out the change or test, preferably on a small scale. 3. Check it (C). Observe the effects of the change or test. Study it (S). 4. Act on what was learned (A). 5. Repeat Step 1, with new knowledge. 6. Repeat Step 2, and onward. Continuously evaluate and improve.
Deming was trained as a mathematical physicist, and he utilized mathematical concepts and tools (Statistical Process Control) to reduce variation and prevent defects. However, one of his greatest contributions might have been in recognizing the importance of organizational culture and employee attitudes in creating a successful organization. In many ways, his philosophies paralleled the development of the resource-based view of organizations that emphasized that employee knowledge and skills and organizational culture are very difficult to imitate or replicate, and they can serve as a basis of sustainable competitive advantage.
DR. JOSEPH JURAN (B. 1904)
Dr. Juran was born on December 24, 1904 in Braila, Romania. He moved to the United States in 1912 at the age of 8. Juran's teaching and consulting career spanned more than seventy years, known as one of the foremost experts on quality in the world.
A quality professional from the beginning of his career, Juran joined the inspection branch of the Hawthorne Co. of Western Electric (a Bell manufacturing company) in 1924, after completing his B.S. in Electrical Engineering. In 1934, he became a quality manager. He
worked with the U. S. government during World War II and afterward became a quality consultant. In 1952, Dr. Juran was invited to Japan. Dr. Edward Deming helped arrange the meeting that led to this invitation and his many years of work with Japanese companies.
Juran founded the Juran Center for Quality Improvement at the University of Minnesota and the Juran Institute. His third book, Juran's Quality Control Handbook, published in 1951, was translated into Japanese. Other books include Juran on Planning for Quality (1988), Juran on Leadership for Quality (1989), Juran on Quality by Design (1992), Quality Planning and Analysis (1993), and A History of Managing for Quality (1995). Architect of Quality (2004) is his autobiography.
SELECTED JURAN QUALITY THEORIES
Juran's concepts can be used to establish a traditional quality system, as well as to support Strategic Quality Management. Among other things, Juran's philosophy includes the Quality Trilogy and the Quality Planning Roadmap.
JURAN'S QUALITY TRILOGY.
The Quality Trilogy emphasizes the roles of quality planning, quality control, and quality improvement. Quality planning's purpose is to provide operators with the ability to produce goods and services that can meet customers' needs. In the quality planning stage, an organization must determine who the customers are and what they need, develop the product or service features that meet customers' needs, develop processes which are able to deliver those products and services, and transfer the plans to the operating forces. If quality planning is deficient, then chronic waste occurs.
Quality control is used to prevent things from getting worse. Quality control is the inspection part of the Quality Trilogy where operators compare actual performance with plans and resolve the differences. Chronic waste should be considered an opportunity for quality improvement, the third element of the Trilogy. Quality improvement encompasses improvement of fitness-for-use and error reduction, seeks a new level of performance that is superior to any previous level, and is attained by applying breakthrough thinking.
While up-front quality planning is what organizations should be doing, it is normal for organizations to focus their first quality efforts on quality control. In this aspect of the Quality Trilogy, activities include inspection to determine percent defective (or first pass yield) and deviations from quality standards. Activities can then focus on another part of the trilogy, quality improvement, and make it an integral part of daily work for individuals and teams.
Quality planning must be integrated into every aspect of the organization's work, such as strategic plans; product, service and process designs; operations; and delivery to the customer. The Quality Trilogy is depicted below in Figure.
Quality Control Quality Planning
JURAN'S QUALITY PLANNING ROAD MAP.
Juran's Quality Planning Road Map can be used by individuals and teams throughout the world as a checklist for understanding customer requirements, establishing measurements based on customer needs, optimizing product design, and developing a process that is capable of meeting customer requirements. The Quality Planning Roadmap is used for Product and Process Development and is shown in Figure 3.
Juran's Quality Trilogy and Quality Roadmap are not enough. An infrastructure for Quality must be developed, and teams must work on improvement projects. The infrastructure should include a quality steering team with top management leading the effort, quality should become an integral part of the strategic plan, and all people should be involved. As people identify areas with improvement potential, they should team together to improve processes and produce quality products and services.
Under the "Big Q" concept, all people and departments are responsible for quality. In the old era under the concept of "little q," the quality department was responsible for quality. Big "Q" allows workers to regain pride in workmanship by assuming responsibility for quality. Juran believed quality is associated with customer satisfaction and dissatisfaction with the product and emphasized the necessity for ongoing quality improvement through a succession of small improvement
Projects carried out throughout the organization. His ten steps to quality Improvement are:
Build awareness of the need and opportunity for improvement Set goals for improvement
Organize to reach the goals
Provide training
Cary out projects to solve
Quality Improvement
Breakthrough Pareto Analysis
Holding the gains
Supplier CustomerProcess
Report progress
Give recognition
Communicate results
Keep score of improvements achieved
Maintain momentum
He concentrated not just on the end customer, but on other external and internal customers. Each person along the chain, from product designer to final user is a supplier and a customer. In addition, the person will be a process, carrying out some transformation or activity
PHILIP CROSBY (1926–2001)
Philip Bayard Crosby was born in Wheeling, West Virginia, in 1926. After Crosby graduated from high school, he joined the Navy and became a hospital corpsman. In 1946 Crosby entered the Ohio College of Podiatric Medicine in Cleveland. After graduation he returned to Wheeling and practiced podiatry with his father. He was recalled to military service during the Korean conflict, this time he served as a Marine Medical Corpsman.
In 1952 Crosby went to work for the Crosley Corp. in Richmond, Indiana, as a junior electronic test technician. He joined the American Society for Quality, where his early concepts concerning Quality began to form. In 1955, he went to work for Bendix Corp. as a reliability technician and quality engineer. He investigated defects found by the test people and inspectors.
In 1957 he became a senior quality engineer with Martin Marietta Co. in Orlando, Florida. During his eight years with Martin Marietta, Crosby developed his "Zero Defects" concepts, began writing articles for various journals, and started his speaking career.
In 1965 International Telephone and Telegraph (ITT) hired Crosby as vice president in charge of corporate quality. During his fourteen years with ITT, Crosby worked with many of the world's largest industrial and service companies, implementing his pragmatic management philosophy, and found that it worked.
After a number of years in industry, Crosby established the Crosby Quality College in Winter Park, Florida. He is well known as an author and consultant and has written many articles and books. He is probably best known for his book Quality is Free (1979) and concepts such as his Absolutes of Quality Management, Zero Defects, Quality Management Maturity Grid, 14 Quality Improvement Steps, Cost of Quality, and Cost of Nonconformance. Other books he has written include Quality Without Tears (1984) and Completeness (1994).
Attention to customer requirements and preventing defects is evident in Crosby's definitions of quality and "non-quality" as follows: "Quality is conformance to requirements; non-quality is nonconformance."
CROSBY'S COST OF QUALITY.
In his book Quality Is Free, Crosby makes the point that it costs money to achieve quality, but it costs more money when quality is not achieved. When an organization designs and builds an item right the first time (or provides a service without errors), quality is free. It does not cost anything above what would have already been spent. When an organization has to rework or scrap an item because of poor quality, it costs more. Crosby discusses Cost of Quality and Cost of Nonconformance or Cost of Nonquality. The intention is spend more money on preventing defects and less on inspection and rework.
CROSBY'S FOUR ABSOLUTES OF QUALITY.
Crosby espoused his basic theories about quality in four Absolutes of Quality Management as follows:
1. Quality means conformance to requirements, not goodness. 2. The system for causing quality is prevention, not appraisal. 3. The performance standard must be zero defects, not "that's close enough." 4. The measurement of quality is the price of nonconformance, not indexes.
To support his Four Absolutes of Quality Management, Crosby developed the Quality Management Maturity Grid and Fourteen Steps of Quality Improvement. Crosby sees the Quality Management Maturity Grid as a first step in moving an organization towards quality management. After a company has located its position on the grid, it implements a quality improvement system based on Crosby's Fourteen Steps of Quality Improvement as shown in Figure 4.
Crosby's Absolutes of Quality Management are further delineated in his Fourteen Steps of Quality Improvement as shown below:
Step 1. Management Commitment
Step 2. Quality Improvement Teams
Step 3. Quality Measurement
Step 4. Cost of Quality Evaluation
Step 5. Quality Awareness
Step 6. Corrective Action
Step 7. Zero-Defects Planning
Step 8. Supervisory Training
Step 9. Zero Defects
Step 10. Goal Setting
Step 11. Error Cause Removal
Step 12. Recognition
Step 13. Quality Councils
Step 14. Do It All Over Again
ARMAND V. FEIGENBAUM
Feigenbaum was still a doctoral student at the Massachusetts Institute of Technology when he completed the first edition of Total Quality Control (1951). An engineer at General Electric during World War II, Feigenbaum used statistical techniques to determine what was wrong with early jet airplane engines. For ten years he served as manager of worldwide manufacturing operations and quality control at GE. Feigenbaum serves as president of General Systems Company, Inc., Pittsfield, Massachusetts, an international engineering firm that designs and installs integrated operational systems for major corporations in the United States and abroad.
Feigenbaum was the founding chairman of the International Academy for Quality and is a past president of the American Society for Quality Control, which presented him its Edwards Medal and Lancaster Award for his contributions to quality and productivity. His Total Quality Control concepts have had a very positive impact on quality and productivity for many organizations throughout the industrialized world.
DR. H. JAMES HARRINGTON
An author and consultant in the area of process improvement, Harrington spent forty years with IBM. His career included serving as Senior Engineer and Project Manager of Quality Assurance for IBM, San Jose, California. He was President of Harrington, Hurd and Reicker, a well-known performance improvement consulting firm until Ernst & Young bought the organization. He is the international quality advisor for Ernst and Young and on the board of directors of various national and international companies.
Harrington served as president and chairman of the American Society for Quality and the International Academy for Quality. In addition, he has been elected as an honorary member of six quality associations outside of North America and was selected for the Singapore Hall of Fame. His books include The Improvement Process, Business Process Improvement, Total Improvement Management, ISO 9000 and Beyond, Area Activity Analysis, The Creativity Toolkit, Statistical Analysis Simplified, The Quality/Profit Connection, and High Performance Benchmarking.
DR. KAORU ISHIKAWA (1915–1989)
A professor of engineering at the University of Tokyo and a student of Dr. W. Edwards Deming, Ishikawa was active in the quality movement in Japan, and was a member of the Union of Japanese Scientists and Engineers. He was awarded the Deming Prize, the Nihon Keizai Press Prize, and the Industrial Standardization Prize for his writings on quality control, and the Grant Award from the American Society for Quality Control for his educational program on quality control.
Ishikawa's book, Guide to Quality Control (1982), is considered a classic because of its in-depth explanations of quality tools and related statistics. The tool for which he is best known is the cause and effect diagram. Ishikawa is considered the Father of the Quality Circle Movement. Letters of praise from representatives of companies for which he was a consultant were published in his book What Is Total Quality Control? (1985). Those companies include IBM, Ford, Bridgestone, Komatsu Manufacturing, and Cummins Engine Co.
Ishikawa believed that quality improvement initiatives must be organization-wide in order to be successful and sustainable over the long term. He promoted the use of Quality Circles to: (1) Support improvement; (2) Respect human relations in the workplace; (3) Increase job satisfaction; and (4) More fully recognize employee capabilities and utilize their ideas. Quality Circles are effective when management understands statistical techniques and act on recommendations from members of the Quality Circles.
DR. WALTER A. SHEWHART (1891–1967)
A statistician who worked at Western Electric, Bell Laboratories, Dr. Walter A. Shewhart used statistics to explain process variability. It was Dr. W. Edward Deming who publicized the usefulness of control charts, as well as the Shewhart Cycle. However, Deming rightfully credited Shewhart with the development of theories of process control as well as the Shewhart transformation process on which the Deming PDCA (Plan-Do-Check or Study-Act) Cycle is based. Shewhart's theories were first published in his book Economic Control of Quality of Manufactured Product (1931).
SHIGEO SHINGO (1919–1990)
One of the world's leading experts on improving the manufacturing process, Shigeo Shingo created, with Taiichi Ohno, many of the features of just-in-time (JIT) manufacturing methods, systems, and processes, which constitute the Toyota Production System. He has written many books including A Study of the Toyota Production System From An Industrial Engineering Viewpoint (1989), Revolution in Manufacturing: The SMED (Single Minute Exchange of Die) System (1985), and Zero Quality Control: Source Inspection and the Poka Yoke System (1986).
Shingo's greatness seems to be based on his ability to understand exactly why products are manufactured the way they are, and then transform that understanding into a workable system for low-cost, high quality production. Established in 1988, the Shingo Prize is the premier manufacturing award in the United States, Canada, and Mexico. In partnership with the National Association of Manufacturers, Utah State University administers the Shingo Prize for Excellence in Manufacturing, which promotes world class manufacturing and recognizes companies that excel in productivity and process improvement, quality enhancement, and customer satisfaction.
Rather than focusing on theory, Shingo focused on practical concepts that made an immediate difference. Specific concepts attributed to Shingo are:
Poka Yoke requires stopping processes as soon as a defect occurs, identifying the source of the defect, and preventing it from happening again.
Mistake Proofing is a component of Poka Yoke. Literally, this means making it impossible to make mistakes (i.e., preventing errors at the source).
SMED (Single Minute Exchange of Die) is a system for quick changeovers between products. The intent is to simplify materials, machinery, processes and skills in order to dramatically reduce changeover times from hours to minutes. As a result products could be produced in small batches or even single units with minimal disruption.
Just-in-Time (JIT) Production is about supplying customers with what they want when they want it. The aim of JIT is to minimize inventories by producing only what is required when it is required. Orders are "pulled" through the system when triggered by customer orders, not pushed through the system in order to achieve economies of scale with the production of larger batches.
FREDERICK TAYLOR (1856–1915)
An industrial (efficiency) engineer, manager, and consultant, Frederick Taylor is known as the Father of Scientific Management. In 1911, he published The Principles of Scientific Management. Taylor believed in task specialization and is noted for his time and motion studies. Some of his ideas are the predecessors for modern industrial engineering tools and concepts that are used in cycle time reduction.
While quality experts would agree that Taylor's concepts increase productivity, some argue that his concepts are focused on productivity, not process improvement and as a result could cause less emphasis on quality. Dr. Joseph Juran said that Taylor's concepts made the United States the world leader in productivity. However, the Taylor system required separation of planning work from executing the work. This separation was based on the idea that engineers should do the planning because supervisors and workers were not educated. Today, the emphasis is on transferring planning to the people doing the work.
DR. GENICHI TAGUCHI (B. 1924)
Dr. Genichi Taguchi was a Japanese engineer and statistician who defined what product specification means and how this can be translated into cost effective production. He worked in the Japanese Ministry of Public Health and Welfare, Institute of Statistical Mathematics, Ministry of Education. He also worked with the Electrical Communications Laboratory of the Nippon Telephone and Telegraph Co. to increase the productivity of the R&D activities.
In the mid 1950s Taguchi was Indian Statistical Institute visiting professor, where he met Walter Shewhart. He was a Visiting Research Associate at Princeton University in 1962, the same year he received his Ph.D. from Kyushu University. He was a Professor at Tokyo's Aoyama Gakuin University and Director of the Japanese Academy of Quality.
Taguchi was awarded the Deming Application prize (1960), Deming awards for literature on quality (1951, 1953, and 1984), Willard F. Rockwell Medal by the International Technologies Institute (1986).
Taguchi's contributions are in robust design in the area of product development. The Taguchi Loss Function, The Taguchi Method (Design of Experiments), and other methodologies have made major contributions in the reduction of variation and greatly improved engineering quality and productivity. By consciously considering the noise factors (environmental variation during the product's usage, manufacturing variation, and component deterioration) and the cost of failure in the field, Taguchi methodologies help ensure customer satisfaction.
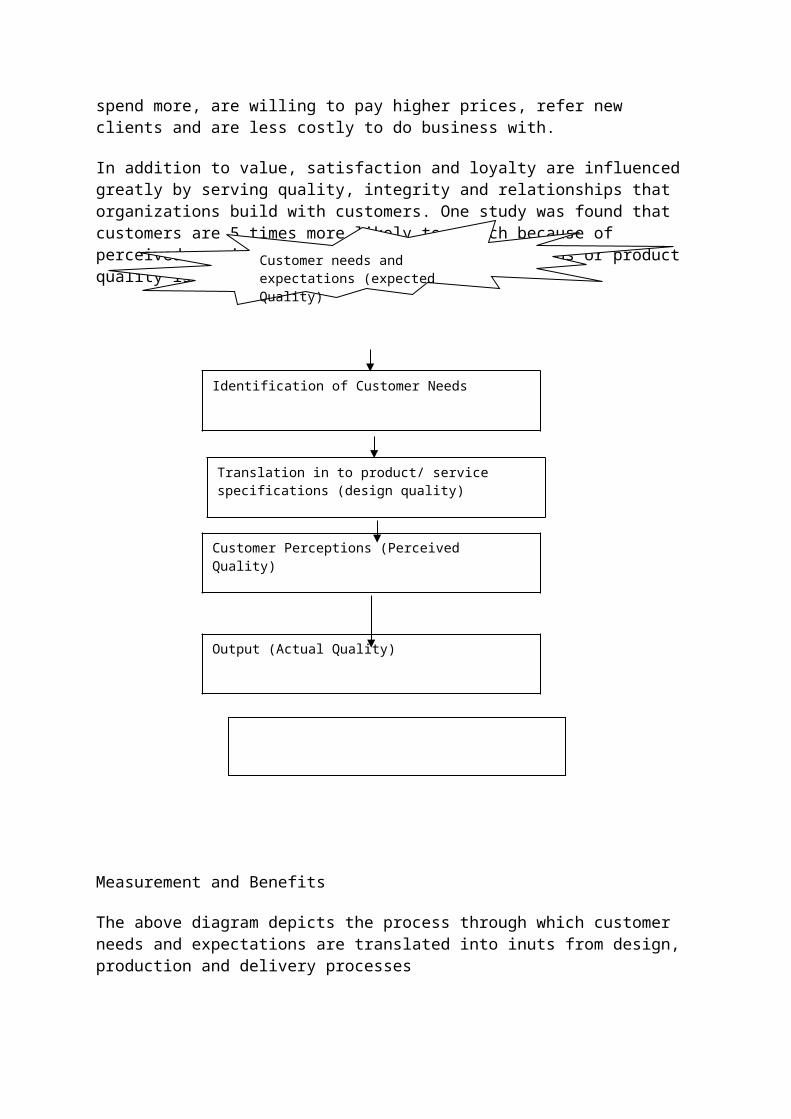
Robust Design focuses on improving the fundamental function of the product or process, thus facilitating flexible designs and concurrent engineering. Taguchi product development includes three stages: (1) system design (the non-statistical stage for engineering, marketing, customer and other knowledge); (2) parameter stage (determining how the product should perform against defined parameters; and (3) tolerance design (finding the balance between manufacturing cost and loss).
2. Describe(a) Crosby’s Four absolutes of Quality
Armand V. Feigenbaum, a General Electric quality control engineer proposed the theory of Total Quality control.
Feigebaum defines "Quality Control as an effective system for cordinating the quality maintaince and quality improvement efforts of the various groups in an organization so as to enable production at the most economical levels which allow for full customer satisfaction" According to Feigenbaum, Quality didnt mean giving the best product to the customer. More important as a tool was control, which focuses on the following
devising clear and achievable quality stands Enhancing existing working condition to reach the desired quality
standard. Setting new quality standard with an aim to further improve
According to him, Quality must encompasses all the phases in the manufacuring of a product. This includes design, manufacturing, Quality checks, sales, after sales services and customer satisfaction when the product is deliver to the customer.
1. What is meant by “Design of Experiments”? Describe its features and Uses.
When collecting new data for multivariate modeling, one should pay attention to the following criteria:
Efficiency
Focusin
gGet more information from fewerexperiments Collect only the information that is really needed
There are four basic ways to collect data for an analysis:
1. Obtain historical data
2. Collect new data
3. Run specific experiments by disturbing (exciting) the system being studied
4. Design experiments in a structured, mathematical way
With designed experiments there is a better possibility of testing the significance of the effects and the relevance of the whole model.
Experimental design (commonly referred to as DOE) is a useful complement to multivariate data analysis because it generates “structured” data tables, i.e. data tables that contain an important amount of structured variation. This underlying structure will then be used as a basis for multivariate modeling, which will guarantee stable and robust models.
More generally, careful sample selection increases the chances of extracting useful information from the data. When one has the possibility to actively perturb the system (experiment with the variables), these chances become even greater. The critical part is to decide which variables to change, the intervals for this variation, and the pattern of the experimental points.
Experimental design is a strategy to gather empirical knowledge, i.e. knowledge based on the analysis of experimental data and not on theoretical models. It can be applied when investigating a phenomenon in order to gain understanding or improve performance.
Building a design means carefully choosing a small number of experiments that are to be performed under controlled conditions. There are four interrelated steps in building a design: : e.g. "better understand" or "sort out important variables" or "find the optimum conditions"
a. Define the objective of the investigation: e.g. “better understand” or “sort out important variables” or “find the optimum conditions”
b. Define the variables that will be controlled during the experiment (design variables), and their levels or ranges of variation.
c. Define the variables that will be measured to describe the outcome of the experimental runs (response variables), and examine their precision
d. Choose among the available standard designs the one that is compatible with the objective, number of design variables and precision of measurements, and has a reasonable cost
Most of the standard experimental designs can be generated in The Unscrambler® X once the experimental objective, the number (and nature) of the design variables, the nature of the responses and the economical number of experimental runs have been defined. Generating such a design will provide the user with the list of all experiments to be performed in order to gather the required information to meet the objectives.
The figure above shows the Box-Behnken design drawn in two different ways. In the left drawing one
can see how it is built, while the drawing to the right shows how the design is rotatable.
DOE is a systematic approach to investigation of a system or process. A series of structured tests are designed in which planned changes are made to the input variables of a process or system. The effects of these changes on a pre-defined output are then assessed.
DOE is important as a formal way of maximizing information gained while resources required. It has more to offer than 'one change at a time' experimental methods, because it allows a judgement on the significance to the output of input variables acting alone, as well input variables acting in combination with one another.
'One change at a time' testing always carries the risk that the experimenter may find one input variable to have a significant effect on the response (output) while failing to discover that changing another variable may alter the effect of the first (i.e. some kind of dependency or interaction). This is because the temptation is to stop the test when this first significant effect has been found. In order to reveal an interaction or dependency, 'one change at a time' testing relies on the experimenter carrying the tests in the appropriate direction. However, DOE plans for all possible dependencies in the first place, and then prescribes exactly what data are needed to assess them i.e. whether input variables change the response on their own, when combined, or not at all. In terms of resource the exact length and size of the experiment are set by the design (i.e. before testing begins).
DOE can be used to find answers in situations such as "what is the main contributing factor to a problem?", "how well does the system/process perform in the presence of noise?", "what is the best configuration of factor values to minimize variation in a response?" etc. In general, these questions are given labels as particular types of study. In the examples given above, these are problem solving, parameter design and robustness study. In each case, DOE is used to find the answer, the only thing that marks them different is which factors would be used in the experiment.
(b) Contribution of Armand Feigenbaum to “Quality Management”
3. What is meant by “Design of Experiments”? Describe its features and Uses.
Write a note on Malcolm Baldrige Quality Award.What is meant by Total Productive Maintenance (TPM)? Describe the Eight pillars of TPM.Explain “Six Sigma” methodology. Illustrate with examples, how Companies which have benefited from implementing “Six Sigma” methodology.
QM0011 – Principles and Philosophies of Quality Management – 4 Credits
Assignment Set-1 (60 Marks)
Note: Each question carries 10 Marks. Answer all the questions7. Write a brief note on (a) History of Quality Management and (b) Statistical Quality Control
8. Describe how Deming’s Principles and work on Quality Management helped the Companies across the World in improving the overall Quality and Business. Give Examples.
9. Describe the work of Joseph Juran on “Quality Management”.
10. Describe the contribution of Kaoru Ishikawa to the world of “Quality Management”.
11. What is meant by “5S” principle with respect to “Quality Management”? What are its benefits? Give some examples of Companies which have implemented “5S” and benefited from it.
12. (a) Explain the core concepts of “Business Excellence”.
(b) Suppose you are running a medium sized Business. What actions will you take to achieve
“Business Excellence” in your Organization?
QM0012 – Statistical Process Control and Process Capability – 4 Credits
Assignment Set-1 (60 Marks)Note: Each question carries 10 Marks. Answer all the questions
Describe the “Quality Control Tools”
Quality control is a process employed to ensure a certain level of quality in a product or service. It may include whatever actions a business deems necessary to provide for the control and verification of certain characteristics of a product or service. The basic goal of quality control is to ensure that the products, services, or processes provided meet specific requirements and are dependable, satisfactory, and fiscally sound.
Essentially, quality control involves the examination of a product, service, or process for certain minimum levels of quality. The goal of a quality control team is to identify products or services that do not meet a company’s specified standards of quality. If a problem is identified, the job of a quality control team or professional may involve stopping production temporarily. Depending on the particular service or product, as well as the type of problem identified, production or implementation
Quality control (QC) is a procedure or set of procedures intended to ensure that a manufactured product or performed service adheres to a defined set of quality criteria or meets the requirements of the client or customer. QC is similar to, but not identical with, quality assurance (QA). QA is defined as a procedure or set of procedures intended to ensure that a product or service under development (before work is complete, as opposed to afterwards) meets specified requirements. QA is sometimes expressed together with QC as a single expression, quality assurance and control (QA/QC).
In order to implement an effective QC program, an enterprise must first decide which specific standards the product or service must meet. Then the extent of QC actions must be determined (for example, the percentage of units to be tested from each lot). Next, real-world data must be collected (for example, the percentage of units that fail) and the results reported to management personnel. After this, corrective action must be decided upon and taken (for example, defective units must be repaired or rejected and poor service repeated at no charge until the customer is satisfied). If too many unit failures or instances of poor service occur, a plan must be devised to improve the production or service process and then that plan must be put into action. Finally, the QC process must be ongoing to ensure that remedial efforts, if required, have produced satisfactory results and to immediately detect recurrences or new instances of trouble.
Explain the concept of Process. What is meant by SIPOC with regard to Process Management
Suppliers: Internal or external suppliers of the inputs Inputs: Significant raw materials (or computer data, or personnel) Process: The process transforms inputs from the suppliers and creates outputs for the customers Outputs: Significant products which go to customers Customers: Direct internal or external recipients of the outputs
o If the “customer” receives an output from a third party (other than your business), then the “third party” is your customer – not the person you considered a customer. For example:
You manufacture and sell ball bearings to bicycle manufacturers. You do not sell packages of ball bearings to retail customers. Cyclists are not your customers; they are the bicycle manufacturers’ customers.
A SIPOC diagram is a high-level “map” of a manufacturing or business process.
Why make a SIPOC Diagram?
The SIPOC diagram is useful in analysing a business or manufacturing process. It forces the participants to focus on the value stream:
What is needed or supplied? Who supplies or needs it?
The SIPOC diagram is required early in any process-improvement project. Participants use the SIPOC diagram to ensure they have a clear concept of the process and the flow from suppliers to customers.
How to make a SIPOC Diagram?
Initially, focus on the process: describe three to six critical steps.
Add the outputs, and then the customers. It may help to focus on a few significant customers, ranking the characteristics – quality, timeliness and cost – they value most about the outputs they receive.
Finally, define the necessary inputs, and the suppliers. Again, identify the most important characteristics of these inputs.
Describe Deming’s Funnel ExperimentThe funnel experiment is a visual representation of a process. It shows that a process in controldelivers the best results if left alone. The funnel experiment shows the adverse effects of tamperingwith a process through the four setting rules.The experiment was devised by Dr. W. Edwards Deming. It described in his famous book titled 'Outof the Crisis'. Deming (1986, chap. 11) described the funnel experiment to demonstrate over-adjustment of a process which is on target and subject to purely random errors. It is also often used in training situations to demonstrate the effects of tampering with a process. A funnel is supported at a fixed height above a table. A point on the table is designated as the target, and a marble is repeatedly dropped through the funnel, with an aiming point determined by one of four rules. The spot at which the marble comes to rest each time is marked.
Mathematically, we consider only a one-dimensional version of the funnel experiment. The target value for the marble is taken as 0. Let [y.sub.i] be the random variable defining the distance from the target to where the marble came to rest at the ith drop. Deming's four "rules of the funnel" are:
Rule 1. Leave the funnel fixed, aimed at the target, with no adjustment.
Rule 2. At drop i (i = 1,2,3, . . .) the marble will come to rest at point [y.sub.i], measured from the target. (In other words, [y.sub.i] is the error at drop i.) Move the funnel the distance -[y.sub.i] from its last position to aim for the next drop.
Rule 3. At drop i the marble comes to rest at point [y.sub.i] from the target, then for the next drop …
The funnel experiment is a mechanical representation of many real world processes at our placesof work. The aim of the experiment is to demonstrate the losses caused by tampering with these
very same processes. The primary source of this tampering is the use of Management by Results,reactions to every individual result.In the experiment, a marble is dropped through a funnel, and allowed to drop on a sheet ofpaper, which contains a target. The objective of the process is to get the marble to come to astop as close to the target as possible. The experiment uses several methods to attempt tomanipulate the funnel’s location such that the spread about the target is minimized. Thesemethods are referred to as “rules”.Funnel Experiment: Rule 1During the first setup, the funnel is aligned above the target, and marbles dropped from this location. No action is taken to move the funnel to improve performance. This “rule” serves as our initial baseline for comparison with improved rules. The results of rule 1 are a disappointment.The marble does not appear to behave consistently. The marble rolls off in various directions for various distances. Certainly there must be a better (smart) way to position the funnel to improve the pattern.
Funnel Experiment: Rule 2During rule 2, we examine the previous result and take action to counteract the motion of the marble. We correct for the error of the previous drop. If the marble rolled 2 inches northeast, we position the funnel 2 inches to the southwest of where it last was. A common example is worker adjustments to machinery. A worker may be working to make a unit of uniform eight. If the last item was 2 pounds underweight, increase the setting for the amount of material in the next item by 2 pounds. Other real examples of Rule 2 include periodic calibrations. One checks a meter’s measurement against a known standard, and adjusts the meter to compensate for the error against the standard. Many automated feedback mechanisms perform this adjustment continuously. Other examples include taking action to change policies and production levels based upon on last month’s budget variances, profit margins, and output. We also see this when setting next year’s goals and targets based upon last year’s levels.
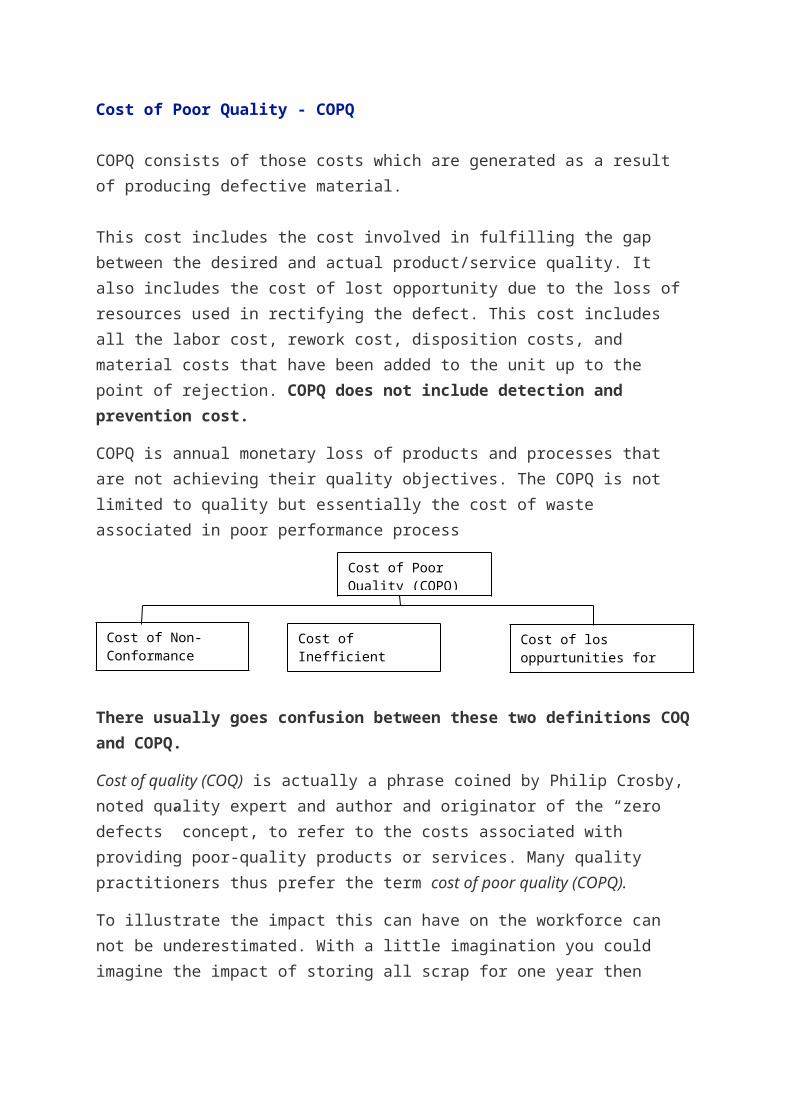
Funnel Experiment: Rule 3A possible flaw in rule 2 was that it adjusted the funnel from its last position, rather than relativeto the target. If the marble rolled 2 inches northeast last time, we should set the funnel 2 inchessouthwest of the target. Then when the marble again rolls 2 inches northeast, it will stop on the target. The funnel is set at an equal and opposite direction from the target to compensate for the last error. We see rule 3 at work in systems where two parties react to each other’s actions. Their goal is to maintain parity. If one country increases its nuclear arsenal, the rival country increases their arsenal to maintain the perceived balance. If drug enforcement increases, prices rise dueto increased demand, and drug runners have incentive to go to further lengths due to increased price. A common example provided in economics courses is agriculture. A drought occurs one year causing a drop in crop output. Prices rise, causing farmers to plant more crop next year. In the next year, there are surpluses, causing the price to drop. Farmers plant less next year.
a) Differentiate between ‘Discrete’ and ‘Continuous’ Probability Distribution.
A discrete probability distribution is defined over a set value (such as a value of 1 or 2 or 3, etc).
A continuous probability distribution is defined over an infinite number of points (such as all values between 1 and 3, inclusive).
(b) Write a note on “Normal Distribution”
Normal Distribution
Normal distributions are a family of distributions that have the shape shown below.
Normal distributions are symmetric with scores more concentrated in the middle than in the tails. They are defined by two parameters: the mean (μ) and the standard deviation (σ). Many kinds of behavioral data are approximated well by the normal distribution. Many statistical tests assume a normal distribution. Most of these tests work well even if the distribution is only approximately normal and in many cases as long as it does not deviate greatly from normality.
The formula for the height (y) of a normal distribution for a given value of x is:
As with any continuous probability function, the area under the curve must equal 1, and the area between two values of X (say, a and b) represents the probability that X lies between a and b as illustrated on Figure 1. Further, since the normal is a symmetric distribution, it has the nice property that a known percentage of all possible values of X lie within ± a certain number of standard deviations of the mean, as illustrated by Figure 2. For example, 68.27% of the values of any normally distributed variable lie within the interval (µ - 1s, µ + 1s).
Percent 99.73% 99% 95.45% 95% 90% 80% 68.27%
No. Of ± s's 3.00 2.58 2.00 1.96 1.645 1.28 1.00
The probability of the normal as given above is difficult to work with in determining areas under the curve, and each set of X values generates another curve as long as the means and standard deviations are translated to a new axis, a Z-axis, with the translation defined as
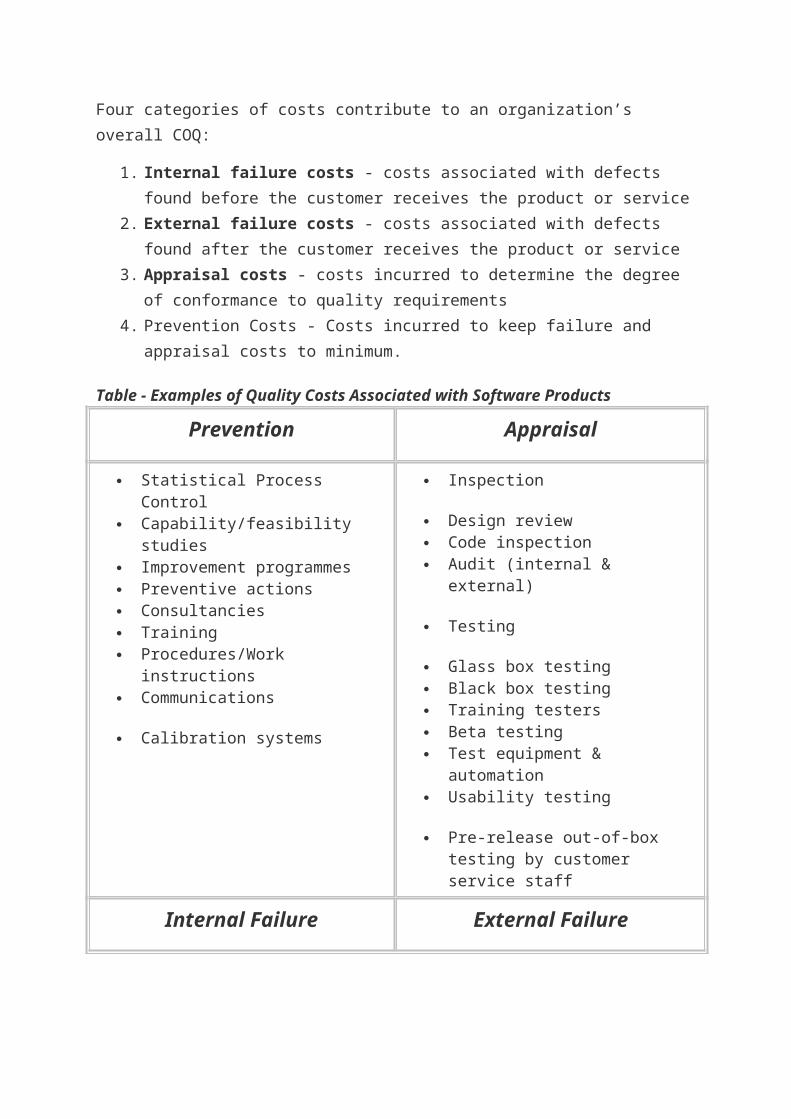
The resulting values, called Z-values, are the values of a new variable called the standard normal variate, Z. The translation process is depicted in Figure
What are Control Charts? Describe the Structure and Construction of Control Charts.
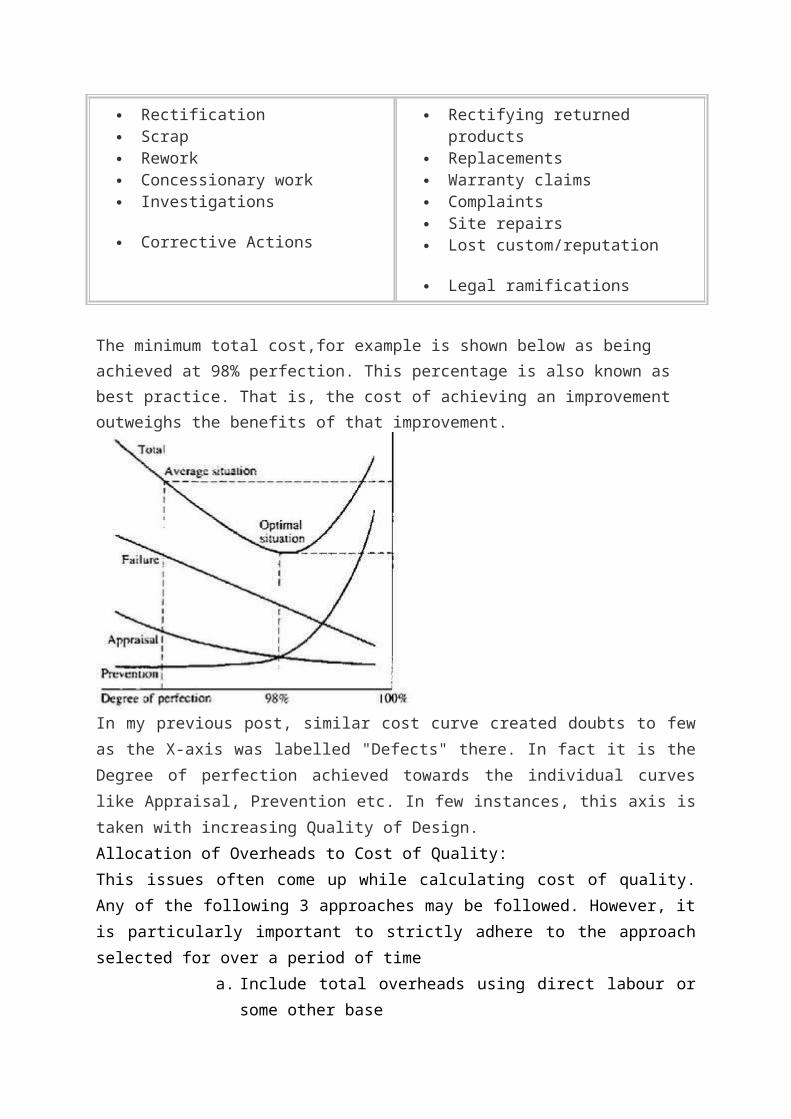
A control chart is a popular statistical tool for monitoring and improving quality. Originated by Walter Shewhart in 1924 for the manufacturing environment, it was later extended by W. Edward Deming to the quality improvement in all areas of an organization (a philosophy known as Total Quality Management, or TQM).
Try our control chart calculator for attributes (discrete data) and control chart calculator for variables (continuous data).
The purpose of control charts
The success of Shewhart's approach is based on the idea that no matter how well the process is designed, there exists a certain amount of nature variability in output measurements.
When the variation in process quality is due to random causes alone, the process is said to be in-control. If the process variation includes both random and special causes of variation, the process is said to be out-of-control.
The control chart is supposed to detect the presence of special causes of variation.
In its basic form, the control chart is a plot of some function of process measurements against time. The points that are plotted on the graph are compared to a pair of control limits. A point that exceeds the control limits signals an alarm.
An alarm signaled by a control chart may indicate that special causes of variation are present, and some action should be taken, ranging from taking a re-check sample to the stopping of a production line in order to trace and eliminate these causes. On the other hand, an alarm may be a false one, when in practice no change has occurred in the process. The design of control charts is a compromise between the risks of not detecting real changes and of false alarms.
Assumptions underlying Control Charts
The two important assumptions are:
1. The measurement-function (e.g. the mean), that is used to monitor the process parameter, is distributed according to a normal distribution. In practice, if your data seem very far from meeting this assumption, try to transform them.
2. Measurements are independent of each other.
Comparison of univariate and multivariate control data
Control charts are used to routinely monitor quality. Depending on the number of process characteristics to be monitored, there are two basic types of control charts. The first, referred to as a univariate control chart, is a graphical display (chart) of one quality characteristic. The second, referred to as a multivariate control chart, is a graphical display of a statistic that summarizes or represents more than one quality characteristic.
Characteristics of control charts
If a single quality characteristic has been measured or computed from a sample, the control chart shows the value of the quality characteristic versus the sample number or versus time. In general, the chart contains a center line that represents the mean value for the in-control process. Two other horizontal lines, called the upper control limit (UCL) and the lower control limit (LCL), are also shown on the chart. These control limits are chosen so that almost all of the data points will fall within these limits as long as the process remains in-control. The figure below illustrates this.
Chart demonstrating basis of control chart
Why control charts "work"
The control limits as pictured in the graph might be .001 probability limits. If so, and if chance causes alone were present, the probability of a point falling above the upper limit would be one out of a thousand, and similarly, a point falling below the lower limit would be one out of a thousand. We would be searching for an assignable cause if a point would fall outside these limits. Where we put these limits will determine the risk of undertaking such a search when in reality there is no assignable cause for variation.
Since two out of a thousand is a very small risk, the 0.001 limits may be said to give practical assurances that, if a point falls outside these limits, the variation was caused be an assignable cause. It must be noted that two out of one thousand is a purely arbitrary number. There is no reason why it could not have been set to one out a hundred or even larger. The decision would depend on the amount of risk the management of the quality control program is willing to take. In general (in the world of quality control) it is customary to use limits that approximate the 0.002 standard.
Letting X denote the value of a process characteristic, if the system of chance causes generates a variation in X that follows the normal distribution, the 0.001 probability limits will be very close to the 3
limits. From normal tables we glean that the 3 in one direction is 0.00135, or in both directions 0.0027. For normal distributions, therefore, the 3 limits are the practical equivalent of 0.001 probability limits.
Plus or minus "3 In the U.S., whether X is normally distributed or not, it is an acceptable
sigma" limits are typical
practice to base the control limits upon a multiple of the standard deviation. Usually this multiple is 3 and thus the limits are called 3-sigma limits. This term is used whether the standard deviation is the universe or population parameter, or some estimate thereof, or simply a "standard value" for control chart purposes. It should be inferred from the context what standard deviation is involved. (Note that in the U.K., statisticians generally prefer to adhere to probability limits.)
If the underlying distribution is skewed, say in the positive direction, the 3-sigma limit will fall short of the upper 0.001 limit, while the lower 3-sigma limit will fall below the 0.001 limit. This situation means that the risk of looking for assignable causes of positive variation when none exists will be greater than one out of a thousand. But the risk of searching for an assignable cause of negative variation, when none exists, will be reduced. The net result, however, will be an increase in the risk of a chance variation beyond the control limits. How much this risk will be increased will depend on the degree of skewness.
If variation in quality follows a Poisson distribution, for example, for which np = .8, the risk of exceeding the upper limit by chance would be raised by the use of 3-sigma limits from 0.001 to 0.009 and the lower limit reduces from 0.001 to 0. For a Poisson distribution the mean and variance both equal np. Hence the upper 3-sigma limit is 0.8 + 3 sqrt(.8) = 3.48 and the lower limit = 0 (here sqrt denotes "square root"). For np = .8 the probability of getting more than 3 successes = 0.009.
Strategies for dealing with out-of-control findings
If a data point falls outside the control limits, we assume that the process is probably out of control and that an investigation is warranted to find and eliminate the cause or causes.
Does this mean that when all points fall within the limits, the process is in control? Not necessarily. If the plot looks non-random, that is, if the points exhibit some form of systematic behavior, there is still something wrong. For example, if the first 25 of 30 points fall above the center line and the last 5 fall below the center line, we would wish to know why this is so. Statistical methods to detect sequences or nonrandom patterns can be applied to the interpretation of control charts. To be sure, "in control" implies that all points are between the control limits and they form a random pattern.
Suppose you are the Manager – “Quality” in a manufacturing Company. Describe the methodology you will adopt for SPC implementation.
QM0012 – Statistical Process Control and Process Capability – 4 Credits
Assignment Set-2 (60 Marks)
Note: Each question carries 10 Marks. Answer all the questions13. Define the term “Quality”. State the dimensions of Quality. What is meant by Statistical
Process Control?
Quality itself has been defined as fundamentally relational: 'Quality is the ongoing process of building and sustaining relationships by assessing, anticipating, and fulfilling stated and implied needs.' "Even those quality definitions which are not expressly relational have an implicit relational character. Why do we try to do the right thing right, on time, every time? To build and sustain relationships. Why do we seek zero defects and conformance to requirements (or their modern counterpart, six sigma)? To build and sustain relationships. Why do we seek to structure features or characteristics of a product or service that bear on their ability to satisfy stated and implied needs? (ANSI/ASQC.) To build and sustain relationships. The focus of continuous improvement is, likewise, the building and sustaining of relationships. It would be difficult to find a realistic definition of quality that did not have, implicit within the definition, a fundamental express or implied focus of building and sustaining relationships."
Quality is the customers' perception of the value of the suppliers' work output.
Error-free, value-added care and service that meets and/or exceeds both
the needs and legitimate expectations of those served as well as those
within the Medical Center
Quality is a momentary perception that occurs when something in our environment interacts with us, in the pre-intellectual awareness that comes before rational thought takes over and begins establishing order. Judgment of the resulting order is then reported as good or bad quality value.
There are two definitive types of "quality".
Quality of design
Quality of the process
Whether you are in discrete manufacturing, process manufacturing or a service related industry you have design issues of usability, comfort, and tolerance of durability beyond prescribe use and identity of "status" of design quality. In this regard, you do not have the axiom of "variation is inherent..."
The ability to live up to the "quality of design" is maintained by the "quality of the process"
All your actions aimed at the translation, transformation and realization of customer expectations , converting them to requirements, both qualitatively and quantitatively and measuring your process performance during and after the realization of these expectations and requirements .
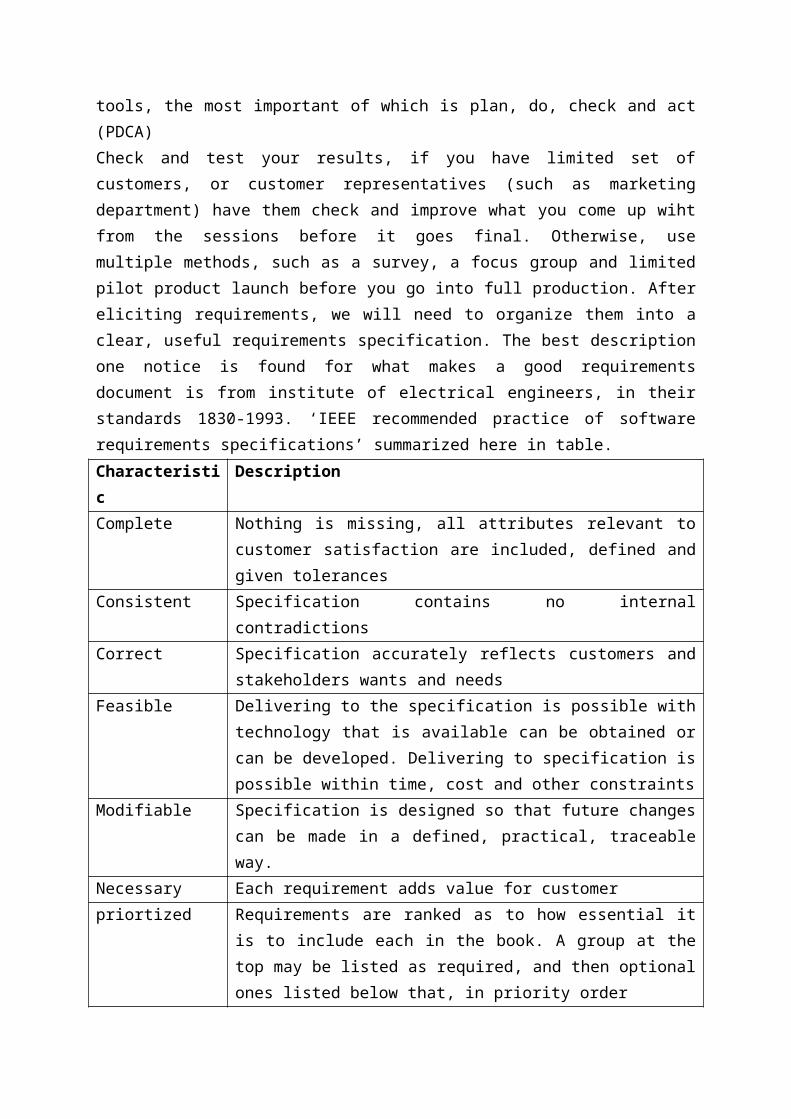
Quality is doing the right things right and is uniquely defined by each individual.
A product or process that is Reliable, and that performs its intended function is said to be a quality product.
The degree to which something meets or exceeds the expectations of its consumers.
Conformance to *Valid* Requirements"
where to be valid, the requirements must be proven (in advance by management) to:
1) be achievable in operation
2) meet the needs of the intended user
making this a universal, operational and easy-to-use definition for the quality for all outputs from any work activity or process.
Eight Dimensions of Quality are:
performance
features
reliability
conformance
durability
serviceability
aesthetics
perceived quality
Statistical process control (SPC) procedures can help you monitor process behavior.
Arguably the most successful SPC tool is the control chart, originally developed by Walter Shewhart in the early 1920s. A control chart helps you record data and lets you see when an unusual event, e.g., a very high or low observation compared with “typical” process performance, occurs.
Control charts attempt to distinguish between two types of process variation:
Common cause variation, which is intrinsic to the process and will always be present. Special cause variation, which stems from external sources and indicates that the process is out
of statistical control.
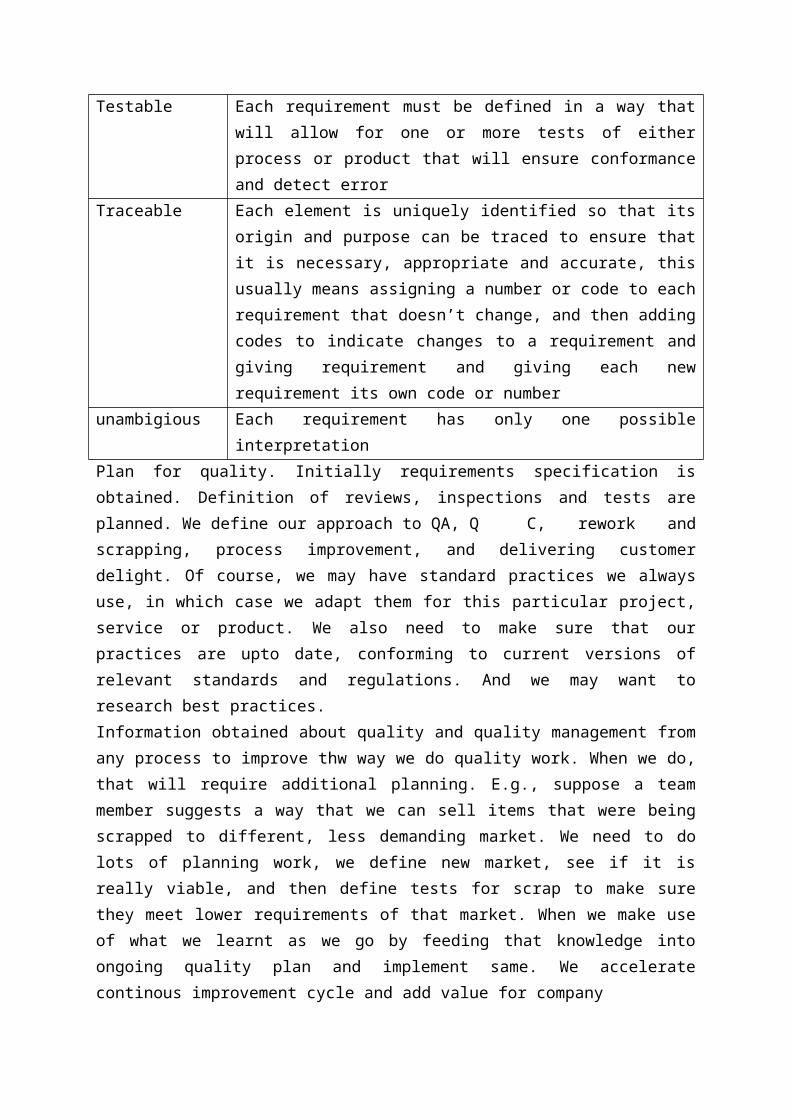
Various tests can help determine when an out-of-control event has occurred. However, as more tests are employed, the probability of a false alarm also increases.
Statistical process control (SPC) involves using statistical techniques to measure and analyze the variation in processes. Most often used for manufacturing processes, the intent of SPC is to monitor product quality and maintain processes to fixed targets. Statistical quality control refers to using statistical techniques for measuring and improving the quality of processes and includes SPC in addition to other techniques, such as sampling plans, experimental design, variation reduction, process capability analysis, and process improvement plans.
SPC is used to monitor the consistency of processes used to manufacture a product as designed. It aims to get and keep processes under control. No matter how good or bad the design, SPC can ensure that the product is being manufactured as designed and intended. Thus, SPC will not improve a poorly designed product's reliability, but can be used to maintain the consistency of how the product is made and, therefore, of the manufactured product itself and its as-designed reliability.
A primary tool used for SPC is the control chart, a graphical representation of certain descriptive statistics for specific quantitative measurements of the manufacturing process. These descriptive statistics are displayed in the control chart in comparison to their "in-control" sampling distributions. The comparison detects any unusual variation in the manufacturing process, which could indicate a problem with the process. Several different descriptive statistics can be used in control charts and there are several different types of control charts that can test for different causes, such as how quickly major vs. minor shifts in process means are detected. Control charts are also used with product measurements to analyze process capability and for continuous process improvement efforts.
Typical charts and analyses used to monitor and improve manufacturing process consistency and capability (produced with Minitab statistical software).
Benefits:
Provides surveillance and feedback for keeping processes in control Signals when a problem with the process has occurred Detects assignable causes of variation Accomplishes process characterization Reduces need for inspection Monitors process quality Provides mechanism to make process changes and track effects of those
changes Once a process is stable (assignable causes of variation have been
eliminated), provides process capability analysis with comparison to the product tolerance
Capabilities:
All forms of SPC control charts o Variable and attribute charts o Average (X— ), Range (R), standard deviation (s), Shewhart, CuSum,
combined Shewhart-CuSum, exponentially weighted moving average (EWMA)
Selection of measures for SPC Process and machine capability analysis (Cp and Cpk) Process characterization Variation reduction Experimental design Quality problem solving Cause and effect diagrams
14. Illustrate with an example the“Cause and Effect diagram”. What are the uses of “Cause and Effect diagram”?
Fishbone Diagram
Also Called: Cause-and-Effect Diagram, Ishikawa Diagram
Variations: cause enumeration diagram, process fishbone, time-delay fishbone, CEDAC (cause-and-effect diagram with the addition of cards), desired-result fishbone, reverse fishbone diagram
Description
The fishbone diagram identifies many possible causes for an effect or problem. It can be used to structure a brainstorming session. It immediately sorts ideas into useful categories.
When to Use a Fishbone Diagram
When identifying possible causes for a problem. Especially when a team’s thinking tends to fall into ruts.
Fishbone Diagram Procedure
Materials needed: flipchart or whiteboard, marking pens.
1. Agree on a problem statement (effect). Write it at the center right of the flipchart or whiteboard. Draw a box around it and draw a horizontal arrow running to it.
2. Brainstorm the major categories of causes of the problem. If this is difficult use generic headings:
o Methodso Machines (equipment)o People (manpower)o Materialso Measuremento Environment
3. Write the categories of causes as branches from the main arrow.4. Brainstorm all the possible causes of the problem. Ask: “Why does this happen?” As each idea is
given, the facilitator writes it as a branch from the appropriate category. Causes can be written in several places if they relate to several categories.
5. Again ask “why does this happen?” about each cause. Write sub-causes branching off the causes. Continue to ask “Why?” and generate deeper levels of causes. Layers of branches indicate causal relationships.
6. When the group runs out of ideas, focus attention to places on the chart where ideas are few.
Fishbone Diagram Example
This fishbone diagram was drawn by a manufacturing team to try to understand the source of periodic iron contamination. The team used the six generic headings to prompt ideas. Layers of branches show thorough thinking about the causes of the problem.
Fishbone Diagram Example
For example, under the heading “Machines,” the idea “materials of construction” shows four kinds of equipment and then several specific machine numbers.
Note that some ideas appear in two different places. “Calibration” shows up under “Methods” as a factor in the analytical procedure, and also under “Measurement” as a cause of lab error. “Iron tools” can be considered a “Methods” problem when taking samples or a “Manpower” problem with maintenance personnel.
Example
The managing director of a weighing machine company received a number of irate letters, complaining of slow service and a constantly engaged telephone. Rather surprised, he asked his support and marketing managers to look into it. With two other people, they first defined the key symptom as 'lack of responsiveness to customers' and then met to brainstorm possible causes, using a Cause-Effect Diagram, as illustrated.
They used the 'Four Ms' (Manpower, Methods, Machines and Materials) as primary cause areas, and then added secondary cause areas before adding actual causes, thus helping to ensure that all possible causes were considered. Causes common to several areas were flagged with capital letters, and key causes to verify and address were circled.
On further investigation, they found that service visits were not well organized; engineers just picked up a pile of calls and did them in order. They consequently set up regions by engineer and sorted calls; this significantly reduced traveling time and increased service turnaround time. They also improved the telephone system and recommended a review of suppliers' quality procedures.
Fig. 1. Example Cause-Effect Diagram
Other examples
A sales team, working to increase the number of customers putting the company on their shortlist for major purchases, identifies through a survey that the key problem is that the customers perceive the company as a producer of poor quality goods. They use a Cause-Effect Diagram to brainstorm possible causes of this.
A pig farmer gets swine fever in her stock. To help ensure it never recurs, she uses a Cause-Effect Diagram to identify possible causes of the infection, and then checks if they can happen and implements preventive action to ensure none can happen in future.
A wood turner notices that his chisels sometimes become blunt earlier than usual. He uses a Cause-Effect Diagram to identify potential causes. Checking up
on these, he finds that this happens after working with oak. Consequently, he resharpens the chisels after turning each oak piece.
15. What is meant by “Process variation”? Explain the causes of variation in a process?
Conformance to customer CTQs can be measured in process variation and is important in the Six Sigma methodology, because the customer is always evaluating our services, products and processes to determine how well they are meeting their needs.
It is well established that there exist 8 dimensions of quality:
1. Conformance
2. Performance
3. Features
4. Reliability
5. Durability
6. Serviceability
7. Aesthetics, and
8. Perceived Quality
Each dimension can be explicitly defined and is self-exclusive from the other dimensions of quality. A customer may rate your service or product high in conformance, but low in reliability. Or they may view two dimensions to work in conjunction with eachother, such as durability and reliability.
This article will discuss the dimension of conformance and how process variation should be interpretted. Process variation is important in the Six Sigma methodology, because the customer is always evaluating our services, products and processes to determine how well they are meeting their CTQs; in other words, how well they conform to the standards.
Understanding ConformanceConformance can simply be defined as the degree to which your service or product meets the CTQs and predefined standards. For the purpose of this article, it should be noted that your organization's services and products are a funtion of your internal processes, as well as your supplier's processes. (We know that everything in business is a process, right?)
Here are a few examples:
1. You manufacture tires and the tread depth needs to be 5/8 inch plus or minus 0.05 inch.
2. You approve loans and you promise a response to the customer within 24 business hours of receipt.
3. You write code and your manager expects less than 5 bugs found over the life of the product per
thousand lines of code written.
4. You process invoices for healthcare services and your customers expect zero errors on their bills.
A simple way to teach the concept of how well your service or product conforms to the CTQs is with a picture of a target. A target, like those used in archery or shooting, has a series of concentric circles that alternate color. In the center of the target is the bullseye. When services or products are developed by your organization, the bullseye is defined by CTQs, the parts are defined by dimensional standards, and the materials are defined by purity requirements. As we see from the four examples above, the conformance CTQs usually involve a target dimension (the exact center of the target), as well as a permissible range of variation (center yellow area).
Figure 1: Targetting Process Variation
In Figure 1, three pictures help explain the variation in a process. The picture on the left displays a process that covers the entire target. While all the bullets appear to have hit the target, very few are in the bullseye. This is an example of a process that is centered around the target, but very seldomly meets the CTQs of the customer.
The middle picture in Figure 1 displays a process that is well grouped on the target (all the bullets hit the target in close proximity to eachother), but is well off target. In this picture -- like in the first picture -- almost every service or product produced fails to meet the customer CTQs.
The far right picture in Figure 1 displays a process that is well grouped on the target, and all the bullets are within the bullseye. This case displays a process that is centered and is within the tolerance of the customer CTQs. Because this definition of conformance defines "good quality" with all of the bullets landing within the bullseye tolerance band, there is little interest in whether the bullets are exactly centered. For the most part, variation (or dispersion) within the CTQ specification limits is not an issue for the customer.
Relating The Bullseye To Frequency CurvesIn the real-world, we seldom view our processes as bullseyes (unless you work at a shooting range). So how can you determine if your process is scattered around the target, grouped well but off the bullseye, or grouped well on the bullseye? We can display our data in frequency distributions showing the number (percentage) of our process outputs having the indicated dimensions.
Figure 2: Targetting Process Variation With The Process Capability Ratio
One can easily see the direct relationship of Figure 2 to Figure 1. In Figure 2, the far left picture displays wide variation that is centered on the target. The middle picture shows little variation, but off target. And the far right picture displays little variation centered on the target. Shaded areas falling between the specification limits indicate process output dimensions meeting specifications; shaded areas falling either to the left of the lower specification limit or to the right of the upper specification limit indicate items falling outside specification limits.
Interpretting Process VariationMost Black Belts have little time to completely understand the variation of their process before they move into the Improve phase of DMAIC. For instance, do the critical X's of your process have a larger impact on variation (spread) or central tendency (centering)? Segmentation or subgrouping the data can help you find the correct critical X. Hypothesis testing will help you prove that it is so.
ConclusionImprovements in meeting customer CTQs and specification limits are objective measures of quality that translate directly into quality gains, because transactional processing errors, late deliveries and product defects are regarded as undesirable by all customers.
Shewhart (1931, 1980) defined control as follows:
A phenomenon will be said to be controlled when, through the use of past experience, we can predict, at least within limits, how the phenomenon may be expected to vary in the future. Here it is understood that prediction within limits means that we can state, at least approximately, the probability that the observed phenomenon will fall within the given limits.
The critical point in this definition is that control is not defined as the complete absence of variation. Control is simply a state where all variation is predictable variation. A controlled process isn't necessarily a sign of good management, nor is an out-of-control process necessarily producing non-conforming product.
In all forms of prediction there is an element of chance. For our purposes, we will call any unknown random cause of variation a chance cause or a common cause, the terms are synonymous and will be used as such. If the influence of any particular chance cause is very small, and if the number of chance causes of variation are very large and relatively constant, we have a situation where the variation is predictable within limits. You can see from the definition above, that a system such as this qualifies as a controlled system. Where Dr. Shewhart used the term chance cause, Dr. W. Edwards Deming coined the term common cause to describe the same phenomenon. Both terms are encountered in practice.
Needless to say, not all phenomena arise from constant systems of common causes. At times, the variation is caused by a source of variation that is not part of the constant system. These sources of variation were called assignable causes by Shewhart, special causes of variation by Dr. Deming. Experience indicates that special causes of variation can usually be found without undue difficulty, leading to a process that is less variable.
Statistical tools are needed to help us effectively identify the effects of special causes of variation. This leads us to another definition:
Statistical process control–the use of valid analytical statistical methods to identify the existence of special causes of variation in a process.
The basic rule of statistical process control is:
Variation from common-cause systems should be left to chance, but special causes of variation should be identified and eliminated.
This is Shewhart’s original rule. However, the rule should not be misinterpreted as meaning that variation from common causes should be ignored. Rather, common-cause variation is explored "off-line." That is, we
look for long-term process improvements to address common-cause variation.
Figure IV.5 illustrates the need for statistical methods to determine the category of variation.
Figure IV.5. Should these variations be left to chance?
(Figure II.19 repeated.)
From Economic Control of Quality of Manufactured Product, p. 13. Copyright © 1931, 1980 by ASQC Quality Press. Used by permission of the
publisher.
The answer to the question "should these variations be left to chance?" can only be obtained through the use of statistical methods. Figure IV.6 illustrates the basic concept.
Figure IV.6. Types of variation.
In short, variation between the two "control limits" designated by the dashed lines will be deemed as variation from the common-cause system. Any variability beyond these fixed limits will be assumed to have come from special causes of variation. We will call any system exhibiting only common-cause variation, "statistically controlled." It must be noted that the control limits are not simply pulled out of the air, they are calculated from actual process data using valid statistical methods. Figure IV.5 is shown below as Figure IV.7, only with the control limits drawn on it, notice that process (a) is exhibiting variations from special causes, while process (b) is not. This implies that the type of action needed to reduce the variability in each case are of a different nature. Without statistical guidance there could be endless debate over whether special or common causes were to blame for variability.
Figure IV.7. Charts from Figure IV.5 with control limits shown.
16. Explain with an example the “Testing of Hypothesis”. What do you mean by “Type I” and
“Type II” error with respect to “Hypothesis Testing”?
17. (a) Explain in brief the different Control charts for Attributes.
(b) The following figure gives number of defectives in 20 samples containing 2000 items.
425, 430, 216, 341, 225, 322, 280, 306, 337, 305, 356, 402, 216, 264, 126, 409, 193, 280, 389, 326
Calculate the values for central line and control limits for P chart.18. Explain “Cp” and “Cpk”Index. Differentiate between Process Stability and Process
Capability.Six Sigma process performance is reported in terms of Sigma. But the statistical measurements of Cp, Cpk, Pp, and Ppk may provide more insight into the process. Learn the definitions, interpretations and calculations for Cp, Cpk, Pp and Ppk.
In the Six Sigma quality methodology, process performance is reported to the organization as a sigma level. The higher the sigma level, the better the process is performing.
Another way to report process capability and process performance is through the statistical measurements of Cp, Cpk, Pp, and Ppk. This article will present definitions, interpretations and calculations for Cpk and Ppk though the use of forum quotations. Thanks to everyone below that helped contributed to this excellent reference.
Jump To The Following Sections:
Definitions Interpreting Cp, Cpk Interpreting Pp, Ppk Differences Between Cpk and Ppk Calculating Cpk and Ppk
DefinitionsCp = Process Capability. A simple and straightforward indicator of process capability.Cpk = Process Capability Index. Adjustment of Cp for the effect of non-centered distribution.Pp = Process Performance. A simple and straightforward indicator of process performance.Ppk = Process Performance Index. Adjustment of Pp for the effect of non-centered distribution.
Interpreting Cp, Cpk"Cpk is an index (a simple number) which measures how close a process is running to its specification limits, relative to the natural variability of the process. The larger the index, the less likely it is that any item will be outside the specs." Neil Polhemus
"If you hunt our shoot targets with bow, darts, or gun try this analogy. If your shots are falling in the same spot forming a good group this is a high cP, and when the sighting is adjusted so this tight group of shots is landing on the bullseye, you now have a high cpK." Tommy
"Cpk measures how close you are to your target and how consistent you are to around your average performance. A person may be performing with minimum variation, but he can be away from his target towards one of the specification limit, which indicates lower Cpk, whereas Cp will be high. On the other hand, a person may be on average exactly at the target, but the variation in performance is high (but still lower than the tolerance band (i.e. specification interval). In such case also Cpk will be lower, but Cp will be high. Cpk will be higher only when you r meeting the target consistently with minimum variation." Ajit
"You must have a Cpk of 1.33 [4 sigma] or higher to satisfy most customers." Joe Perito
"Consider a car and a garage. The garage defines the specification limits; the car defines the output of the process. If the car is only a little bit smaller than the garage, you had better park it right in the middle of the garage (center of the specification) if you want to get all of the car in the garage. If the car is wider than the garage, it does not matter if you have it centered; it will not fit. If the car is a lot smaller than the garage (six sigma process), it doesn't matter if you park it exactly in the middle; it will fit and you have plenty of room on either side. If you have a process that is in control and with little variation, you should be able to park the car easily within the garage and thus meet customer requirements. Cpk tells you the relationship between the size of the car, the size of the garage and how far away from the middle of the garage you parked the car." Ben
"The value itself can be thought of as the amount the process (car) can widen before hitting the nearest spec limit (garage door edge).Cpk=1/2 means you've crunched nearest the door edge (ouch!) Cpk=1 means you're just touching the nearest edge Cpk=2 means your width can grow 2 times before touching Cpk=3 means your width can grow 3 times before touching" Larry Seibel
Interpreting Pp, Ppk"Process Performance Index basically tries to verify if the sample that you have generated from the process is
capable to meet Customer CTQs (requirements). It differs from Process Capability in that Process Performance only applies to a specific batch of material. Samples from the batch may need to be quite large to be representative of the variation in the batch. Process Performance is only used when process control cannot be evaluated. An example of this is for a short pre-production run. Process Performance generally uses sample sigma in its calculation; Process capability uses the process sigma value determined from either the Moving Range, Range, or Sigma control charts." Praneet
Differences Between Cpk and Ppk"Cpk is for short term, Ppk is for long term." Sundeep Singh
"Ppk produces an index number (like 1.33) for the process variation. Cpk references the variation to your specification limits. If you just want to know how much variation the process exhibits, a Ppk measurement is fine. If you want to know how that variation will affect the ability of your process to meet customer requirements (CTQ's), you should use Cpk." Michael Whaley
"It could be argued that the use of Ppk and Cpk (with sufficient sample size) are far more valid estimates of long and short term capability of processes since the 1.5 sigma shift has a shaky statistical foundation." Eoin
"Cpk tells you what the process is CAPABLE of doing in future, assuming it remains in a state of statistical control. Ppk tells you how the process has performed in the past. You cannot use it predict the future, like with Cpk, because the process is not in a state of control. The values for Cpk and Ppk will converge to almost the same value when the process is in statistical control. that is because Sigma and the sample standard deviation will be identical (at least as can be distinguished by an F-test). When out of control, the values will be distinctly different, perhaps by a very wide margin." Jim Parnella
"Cp and Cpk are for computing the index with respect to the subgrouping of your data (different shifts, machines, operators, etc.), while Pp and Ppk are for the whole process (no subgrouping). For both Ppk and Cpk the 'k' stands for 'centralizing facteur'- it assumes the index takes into consideration the fact that your data is maybe not centered (and hence, your index shall be smaller). It is more realistic to use Pp & Ppk than Cp or Cpk as the process variation cannot be tempered with by inappropriate subgrouping. However, Cp and Cpk can be very useful in order to know if, under the best conditions, the process is capable of fitting into the specs or not.It basically gives you the best case scenario for the existing process." Chantal
"Cp should always be greater than 2.0 for a good process which is under statistical control. For a good process under statistical control, Cpk should be greater than 1.5." Ranganadha Kumar
"As for Ppk/Cpk, they mean one or the other and you will find people confusing the definitions and you WILL find books defining them versa and vice versa. You will have to ask the definition the person is using that you are talking to." Joe Perito
"I just finished up a meeting with a vendor and we had a nice discussion of Cpk vs PPk. We had the definitions exactly reversed between us. The outcome was to standardize on definitions and move forward from there. My suggestion to others is that each company have a procedure or document (we do not) which has the definitions of Cpk and Ppk in it. This provides everyone a standard to refer to for WHEN we forgot or get confused." John Adamo
"The Six Sigma community standardized on definitions of Cp, Cpk, Pp, and Ppk from AIAG SPC manual page 80. You can get the manual for about $7." Gary
Calculating Cpk and Ppk"Cp = (USL - LSL)/6*Std.DevCpl = (Mean - LSL)/3*Std.devCpu = (USL-Mean)/3*Std.devCpk = Min(Cpl,Cpu)" Ranganadha Kumar
"Cpk is calculated using an estimate of the standard deviation calculated using R-bar/d2. Ppk uses the usual form of the standard deviation ie the root of the variance or the square root of the sum of squares divided by n-1. The R-bar/D2 estimation of the standard deviation has a smoothing effect and the Cpk statistic is less sensitive to points which are further away from the mean than is Ppk." Eoin
"Cpk is calculated using RBar/d2 or SBar/c4 for Sigma in the denominator of you equation. This calculation for Sigma REQUIRES the process to be in a state of statistical control. If not in control, your calculation of Sigma (and hence Cpk) is useless - it is only valid when in-control." Jim Parnella
"You can have a 'good' Cpk yet still have data outside the specification, and the process needs to be in control before evaluating Cpk." Matt
QM0013 – Quality Management Tools – 4 Credits
Assignment Set-1 (60 Marks)
Note: Each question carries 10 Marks. Answer all the questions
1.Define “Quality Management System (QMS)”. What are the benefits of QMS?
1. What is meant by Voice of Customer? How do you capture Voice of the Customer?
2. What is meant by Quality Function Deployment? Explain Quality Function Deployment Process.
3. Give the definition of FMEA. Describe FMEA Implementation. Mention the Uses of FMEA
4. Write a note on ISO Family of Standards.5. What is Process Mapping? How do you create a process
map?
QM0012 – Statistical Process Control and Process Capability – 4 Credits
Assignment Set-2 (60 Marks)
Note: Each question carries 10 Marks. Answer all the questions
19. Describe the Methods and Tools for Gathering Information.
20. Illustrate with an example, the construction of House of Quality.21. Define Reliability. Explain “Reliability Modelling”.
22. Explain the need for Robust Design.
23. Write a brief note on Seven Statistical Control Tools
24. Take an example of an Organization of your choice which uses Statistical methods to improve Quality of their products and services. Describe brieflythe usage of control charts in that Organization and how they have benefited from using control charts.