Maynard HPP Update 2021
79
Maynard HPP Update 2021 1
Transcript of Maynard HPP Update 2021
Maynard HPP Update 2021 1
Maynard HPP Update 2021 1
ACKNOWLEDGEMENTS
Prepared for Prepared by
Town of Maynard Metropolitan Area Planning Council
195 Main Street, 60 Temple Place
Maynard, MA 01754 Boston, MA 02111
https://www.townofmaynard-ma.gov/ www.mapc.org
Contact: Bill Nemser, AICP, LEED AP, Planning Director, Town of Maynard
This plan was created for, and in large part by, the people of Maynard. Developing the plan
would not have been possible without the support and leadership of Planning Director Bill
Nemser, Assistant Town Planner/Conservation Agent Kaitlin Young, Town Administrator
Gregory Johnson, Assistant Town Administrator Megan Zammuto, RHSO Manager Elizabeth
Rust, and the members of the HPP Working Group, who contributed their time and vital
knowledge of Maynard and its housing needs:
Maynard HPP Working Group Members:
• Armand Diarbekirian, Select Board
• Christopher Arsenault, Planning Board
• Donna Dodson, Affordable Housing Trust
• Leslie Knight, Maynard School
Committee
• Roz Greenstein, Maynard Economic
Development Committee
• John Cramer
• Sue Grolnic
• Walter Erikson
Thanks also to the Maynard Select Board
and Maynard Planning Board for their input,
participation, and support in this planning
process. Appreciation is also due to the
Maynard community, who participated in
focus groups and public forums and provided
the perspective and ideas that grounded this
plan.
Funding was provided by the Executive Office
of Energy and Environmental Affairs (EEA),
the Town of Maynard, and the Metropolitan
Area Planning Council (MAPC)’s District Local
Technical Assistance Program (DLTA).
MAPC Staff: Professional support from MAPC staff was
provided by:
• Alex Koppelman, AICP: Regional Housing
and Land Use Planner II
• Josh Fiala, AICP: Principal Planner
• Christian Brandt, AICP: Planner &
Community Engagement Specialist I
• Iolando Spinola: Community Engagement
Specialist
• Elise Harmon-Freeman: Communications
Manager
Metropolitan Area Planning Council Officers: • President: Erin Wortman, Town of
Stoneham
• Vice President: Adam Chapdelaine,
Town of Arlington
• Secretary: Sandra Hackman, Town of
Bedford
• Treasurer: Sam Seidel, Gubernatorial
Maynard HPP Update 2021 2
TABLE OF CONTENTS
Acknowledgements ...................................................................................................................................... 1
Table of Contents ......................................................................................................................................... 2
List of Figures and Tables............................................................................................................................ 3
Introduction .................................................................................................................................................. 6
Housing Terms and Concepts ..................................................................................................................... 9
Maynard Today .......................................................................................................................................... 12
Housing Needs Assessment ..................................................................................................................... 14
Public Engagement and Plan Input .......................................................................................................... 33
Updated Housing Development Constraints ........................................................................................... 35
Housing Development Opportunities ....................................................................................................... 42
Plan Recommendations: Goals, Strategies, and Best Practices .......................................................... 61
Appendix A ................................................................................................................................................. 77
Appendix B ................................................................................................................................................. 78

Maynard HPP Update 2021 3
LIST OF FIGURES AND TABLES
Figures
Figure 1: Map of Maynard and the MAGIC Subregion ............................................................................... 6
Figure 2: List of HPP Working Group Members .......................................................................................... 7
Figure 3: HPP Update Project Timeline ....................................................................................................... 7
Figure 4: Household Size, Maynard and Context Communities (2010-2018) ...................................... 16
Figure 5: Maynard Population by Age (2018) ......................................................................................... 17
Figure 6: Maynard Percent Population Change by Age (2010-2018) ................................................... 17
Figure 7: Maynard Household Tenure by Age (2018) ............................................................................. 18
Figure 8: Maynard Household Income, 2012 and 2018 ....................................................................... 19
Figure 9: Median Household Income, Family Versus Non-Family Households, Maynard and Context
Communities ............................................................................................................................................. 19
Figure 10: Percent White and Non-white Residents, Maynard and Context Communities .................. 20
Figure 11: Maynard Housing Radar Chart on the Greater Boston Housing Report Card ..................... 20
Figure 12: Maynard School Enrollment, 2006-2020 ............................................................................. 21
Figure 13: Percent Single-family Versus Multifamily Housing Units, Maynard and Context
Communities ............................................................................................................................................. 22
Figure 14: Maynard Housing Units by Building Type, 2018 ................................................................... 23
Figure 15: Maynard Housing Units Occupied by Owner Versus Renter, 2012 and 2018 ................... 23
Figure 16: Median Rent by Bedroom Type, Maynard + Context Communities, 2018 .......................... 24
Figure 17: Frequency of Online Rental Listings, Maynard, 2017 and 2018 ........................................ 24
Figure 18: Median Home Sales Price, Maynard, 2010-2019 ................................................................ 25
Figure 19: Median Home Sales Price, Maynard, and Context Communities, 2019 ............................. 25
Figure 20: : Housing Types by Tenure and Age, Maynard ...................................................................... 26
Figure 21: Maynard Housing Cost Burdens by Tenure, 2018................................................................ 28
Figure 22: Maynard Cost Burdened Households by Age, 2018............................................................. 28
Figure 23: Maynard Housing Cost Burdens by Income, 2015 ............................................................... 29
Figure 24: FY 2020 Income Limits for Affordable Housing .................................................................... 29
Figure 25: Household Income by Household Type, Maynard 2015 ...................................................... 30
Figure 26: Households eligible for Affordable Housing, Maynard 2015 ............................................... 30
Figure 27: Districts Included in the Development Opportunities Analysis ............................................ 43
Figure 28: Enlarged map of districts included in Development Opportunity Analysis .......................... 44
Figure 29: Potential unconstrained development opportunities ........................................................... 45
Figure 30: Development opportunities by site type ................................................................................ 47

Maynard HPP Update 2021 4
Figure 31: Appropriate housing types suggested for Site Type 1. ......................................................... 51
Figure 32: Location of properties classified as Site Type 1. .................................................................. 51
Figure 33: Appropriate housing types suggested for Site Type 2. ......................................................... 52
Figure 34: Location of properties classified as Site Type 2. .................................................................. 52
Figure 35: Appropriate housing types suggested for Site Type 3. ......................................................... 53
Figure 36: Location of properties classified as Site Type 3. .................................................................. 53
Figure 37: Appropriate housing types suggested for Site Type 4. ......................................................... 54
Figure 38: Location of properties classified as Site Type 4. .................................................................. 54
Figure 39: Appropriate housing types suggested for Site Type 5. ......................................................... 55
Figure 40: Location of properties classified as Site Type 5. .................................................................. 55
Figure 41: Appropriate housing types suggested for Site Type 6. ......................................................... 56
Figure 42: Location of properties classified as Site Type 6. .................................................................. 56
Tables Table 1: HPP Update Public Engagement Events ................................................................................... 33
Table 2: Maynard Residential Zoning Districts ....................................................................................... 39
Table 3: 2021 HPP Goals and Strategies Implementation Chart .......................................................... 71
Table 4: 2021 Housing Best Practices .................................................................................................... 73
Maynard HPP Update 2021 5

Maynard HPP Update 2021 6
INTRODUCTION
he 2021 Maynard Housing Production Plan (HPP) is an update of the HPP that was
adopted by the Town in 2015. This updated plan offers a new set of strategic
recommendations for Maynard to continue its progress in meeting housing need and
preparing for new challenges that threaten to make it difficult for Maynard’s residents to
achieve their housing goals. Although housing in Maynard is relatively more affordable than
other communities with similar characteristics, rapidly rising home prices across the region
and a limited supply of diverse housing options threatens to limit housing choice for
Maynard residents and those that seek to settle in town.
Home values continue to rise in
Maynard, like they do in the
other communities that make
up the Minuteman Advisory
Group on Interlocal
Coordination (MAGIC)
subregion—and in Greater
Boston as a whole. The
increase in home prices is
exacerbated by land use
regulations that restrict the
ability to create a range of
housing options for households
of all ages and socio-economic
backgrounds. The HPP update
documents current housing
challenges facing Maynard and
outlines strategies that the
Town should prioritize.
The Town of Maynard implemented many of the key recommendations made in the 2015
HPP and expanded its capacity for meeting housing need.
Some of the major accomplishments since adoption of the 2015 plan include adopting an
Inclusionary Zoning Bylaw (2018), establishing an Affordable Housing Trust (2018), and
joining a Regional Housing Services Office (RHSO). Membership with the RHSO, an inter-
municipal collaboration between Maynard and eight other nearby towns, gives Maynard
greater staff capacity for housing planning and administration.
The leadership of the Maynard Affordable Housing Trust (AHT), Maynard Select Board,
Maynard Planning Board, and Maynard Community Preservation Committee was
instrumental to these accomplishments. The Town appointed representatives from each of
these bodies to the Maynard HPP Working Group, which oversaw the HPP update planning
process.
T
Figure 1: Map of Maynard and the MAGIC Subregion

Maynard HPP Update 2021 7
MAPC began assisting the Town with the HPP update starting in October 2021. The following
plan was informed by five working group meetings, two focus group meetings, and two
public forum events—all hosted online via Zoom due to public health safety conditions
caused by the COVID-19 pandemic.
Working Group Members:
• Armand Diarbekirian, Select Board
• Christopher Arsenault, Planning Board
• Donna Dodson, Affordable Housing Trust
• Leslie Knight, Maynard School Committee
• Roz Greenstein, Maynard Economic Development Committee
• John Cramer
• Sue Grolnic
• Walter Erikson
Figure 2: List of HPP Working Group Members
Figure 3: HPP Update Project Timeline

Maynard HPP Update 2021 8
Maynard HPP Update 2021 9
HOUSING TERMS AND CONCEPTS
This glossary briefly defines housing terms and concepts that are used in this plan to
describe Maynard’s housing need.
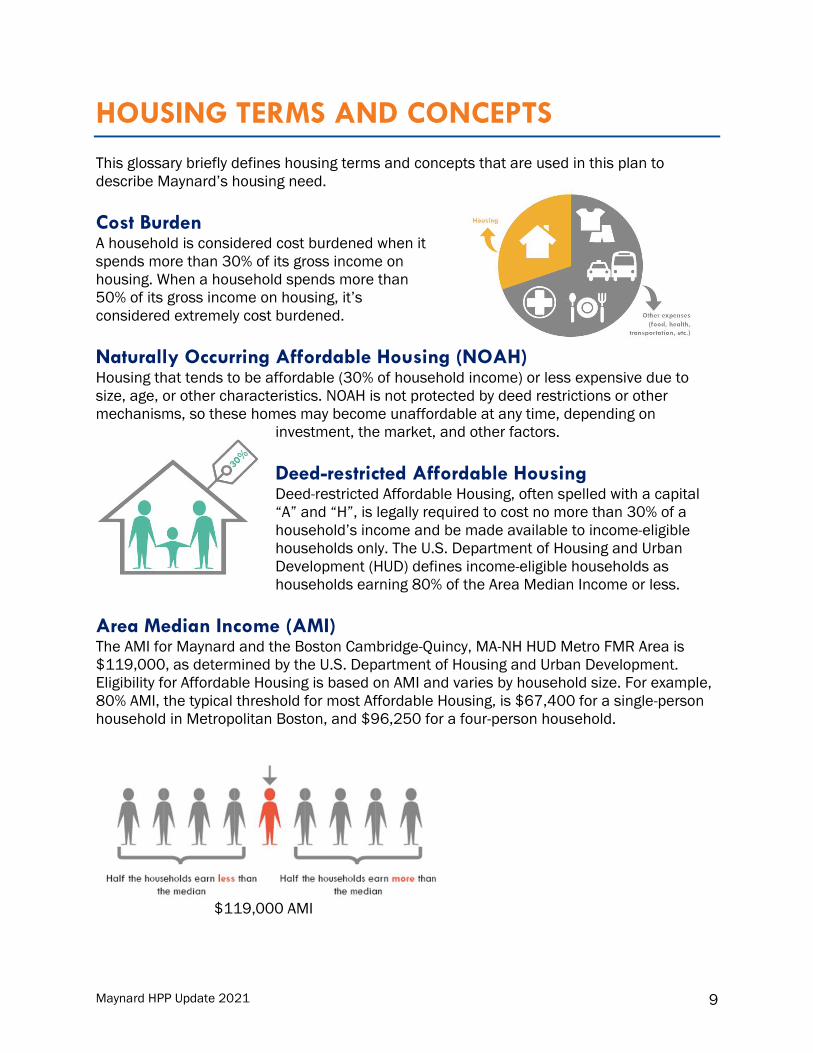
Cost Burden A household is considered cost burdened when it
spends more than 30% of its gross income on
housing. When a household spends more than
50% of its gross income on housing, it’s
considered extremely cost burdened.
Naturally Occurring Affordable Housing (NOAH) Housing that tends to be affordable (30% of household income) or less expensive due to
size, age, or other characteristics. NOAH is not protected by deed restrictions or other
mechanisms, so these homes may become unaffordable at any time, depending on
investment, the market, and other factors.
Deed-restricted Affordable Housing Deed-restricted Affordable Housing, often spelled with a capital
“A” and “H”, is legally required to cost no more than 30% of a
household’s income and be made available to income-eligible
households only. The U.S. Department of Housing and Urban
Development (HUD) defines income-eligible households as
households earning 80% of the Area Median Income or less.
Area Median Income (AMI) The AMI for Maynard and the Boston Cambridge-Quincy, MA-NH HUD Metro FMR Area is
$119,000, as determined by the U.S. Department of Housing and Urban Development.
Eligibility for Affordable Housing is based on AMI and varies by household size. For example,
80% AMI, the typical threshold for most Affordable Housing, is $67,400 for a single-person
household in Metropolitan Boston, and $96,250 for a four-person household.
$119,000 AMI
Maynard HPP Update 2021 10
Context Communities Context communities provide a frame of reference to compare data, showing the
significance of housing trends observed in Maynard. The following communities with
demographic characteristics similar to Maynard were used as context communities: Acton,
Bedford, Dedham, Hudson, Lancaster, Reading, Stoneham, and Wakefield. MAPC’s
Minuteman Advisory Group on Interlocal Coordination (MAGIC) subregion, Essex County, and
the State of Massachusetts were also used to contextualize data findings and trends in
Maynard. Context communities were approved by the Maynard HPP update Working Group.
M.G.L. Chapter 40B By state statute M.G.L. Chapter 40B, cities and towns are encouraged to provide 10% of
their total year-round housing units as deed-restricted Affordable Housing. If a municipality is
not at the 10% threshold, a developer can use a special Comprehensive Permit Process to
build developments with Affordable Housing, as an alternative to local zoning regulations.
Municipalities seeking to encourage more Affordable Housing development can also choose
to use 40B regulations to facilitate development through the Local Initiative Program, which
offers state technical assistance for this development.
M.G.L. Chapter 40R M.G.L. Chapter 40R, § 1-14, provides for smart growth overlay districts with increased
densities for residential development and multifamily housing by right (subject to site plan
review). At least 25% of the units in a Chapter 40R district must be affordable to low- or
moderate-income people. Municipalities that adopt a 40R Smart Growth Overlay District
(SGOD) can receive $10,000 to $600,000 in state funding, as well as $3,000 for every new
housing unit created in the district. Communities can also receive state assistance to write
40R zoning and adopt design standards.
Subsidized Housing Inventory (SHI) In Massachusetts, the SHI is maintained by the MA Department of Housing and Community
Development (DHCD) and used to measure each municipality’s supply of Affordable Housing
for the purposes of Chapter 40B. The SHI includes all housing developed under Chapter
40B, including both Affordable Housing and market-rate units in rental developments, and
other deed-restricted Affordable Housing, such as public housing, project-based vouchers,
federal Low-Income Housing Tax Credit (LIHTC) projects, and many others.
Maynard HPP Update 2021 11
When the 2015 HPP was drafted, Maynard’s population and number of households had
been decreasing. However, the population count has risen in recent years, surpassing 1990
levels to 10,600 (ACS, 2014-2018). MAPC projects these trends will continue. Maynard’s
Maynard HPP Update 2021 12
MAYNARD TODAY
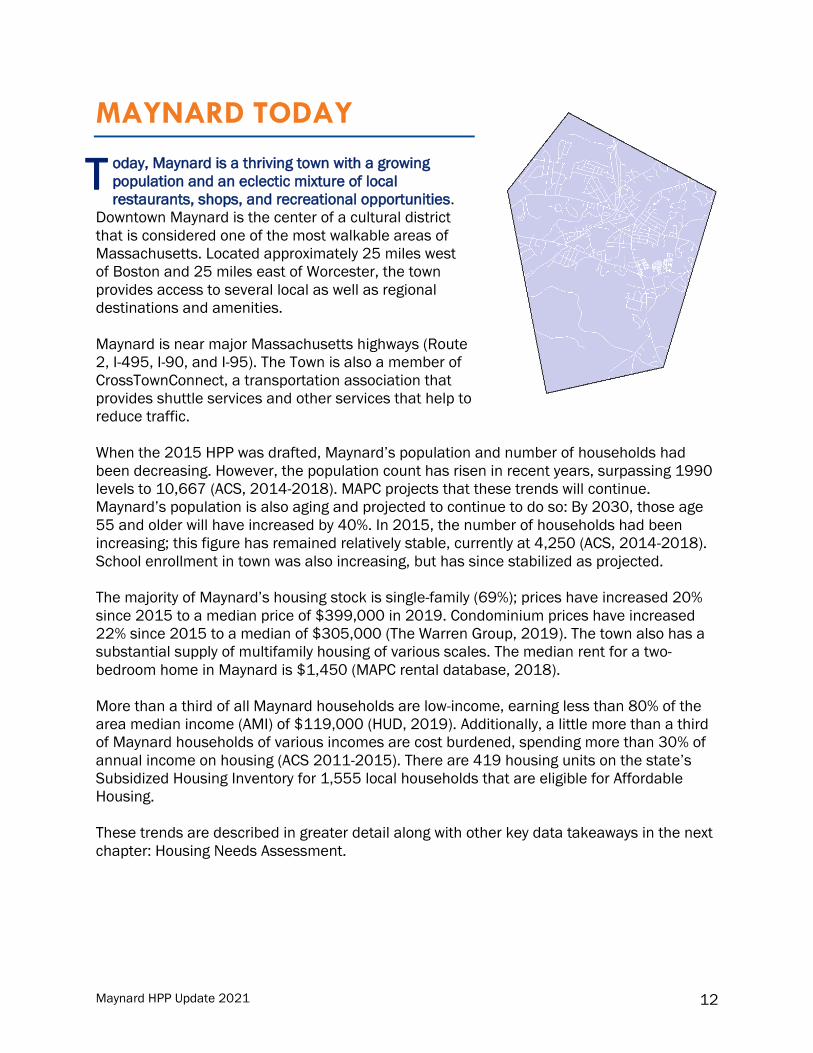
oday, Maynard is a thriving town with a growing
population and an eclectic mixture of local
restaurants, shops, and recreational opportunities.
Downtown Maynard is the center of a cultural district
that is considered one of the most walkable areas of
Massachusetts. Located approximately 25 miles west
of Boston and 25 miles east of Worcester, the town
provides access to several local as well as regional
destinations and amenities.
Maynard is near major Massachusetts highways (Route
2, I-495, I-90, and I-95). The Town is also a member of
CrossTownConnect, a transportation association that
provides shuttle services and other services that help to
reduce traffic.
When the 2015 HPP was drafted, Maynard’s population and number of households had
been decreasing. However, the population count has risen in recent years, surpassing 1990
levels to 10,667 (ACS, 2014-2018). MAPC projects that these trends will continue.
Maynard’s population is also aging and projected to continue to do so: By 2030, those age
55 and older will have increased by 40%. In 2015, the number of households had been
increasing; this figure has remained relatively stable, currently at 4,250 (ACS, 2014-2018).
School enrollment in town was also increasing, but has since stabilized as projected.
The majority of Maynard’s housing stock is single-family (69%); prices have increased 20%
since 2015 to a median price of $399,000 in 2019. Condominium prices have increased
22% since 2015 to a median of $305,000 (The Warren Group, 2019). The town also has a
substantial supply of multifamily housing of various scales. The median rent for a two-
bedroom home in Maynard is $1,450 (MAPC rental database, 2018).
More than a third of all Maynard households are low-income, earning less than 80% of the
area median income (AMI) of $119,000 (HUD, 2019). Additionally, a little more than a third
of Maynard households of various incomes are cost burdened, spending more than 30% of
annual income on housing (ACS 2011-2015). There are 419 housing units on the state’s
Subsidized Housing Inventory for 1,555 local households that are eligible for Affordable
Housing.
These trends are described in greater detail along with other key data takeaways in the next
chapter: Housing Needs Assessment.
T
Maynard HPP Update 2021 13

Maynard HPP Update 2021 14
HOUSING NEEDS ASSESSMENT
he updated housing needs assessment was completed over the summer of 2020 and
includes the most recent data available at that time. To support and inform the
updated HPP recommendations, the analysis of the town’s housing needs focused on
key data findings and trends. This data was shared with public participants at forums and
focus group meetings and these participants also shared their experiences and local
knowledge which guided continued data exploration. Key findings and trends regarding the
town’s demographic makeup, housing stock, and housing affordability have been
summarized below and are described in further detail throughout this chapter.
Key Findings and Trends
Demographics
1. Maynard’s population is no longer declining and has exceeded population growth
projections, showing a need for new housing that can accommodate all age groups.
Maynard has eclipsed its 2030 population projection of 10,309 and has 10,600
residents today. The growth of two age cohorts—residents aged 55 or older and
those aged 20 to 34—points to a need for smaller housing types for first-time
homebuyers and those looking to downsize.
2. The overall income of Maynard residents has increased, but there are large income
disparities that call attention to the housing needs of singles and renters. In
Maynard, family households and owners earn approximately three times more than
non-family households and renters.
3. Maynard has become more racially diverse over the decade, but the town still lacks
this diversity. With a non-white population under 10%, Maynard is less diverse than
almost all the context communities, the MAGIC subregion (22%), and the
Commonwealth (28%).
Housing Stock
4. Maynard needs a greater variety of housing types and tenures. While Maynard has
a decent supply of small multifamily homes, most of the housing stock is single-
family (69%). Given demographic shifts, the town will need additional housing units
of varying sizes to improve the likelihood that residents of all incomes and ages can
afford housing in the marketplace that meets their needs.
5. Since the last HPP was adopted, Maynard has lost a considerable share of rental
housing units, and rental housing units make up a small percentage of housing in
town. From 2012 to 2018, the share of renter-occupied housing units declined
from 35% to 23%. While the Town has permitted new multifamily housing since
T

Maynard HPP Update 2021 15
2018 (see building permits and development pipeline section) this trend is still
concerning. Renting is the only option for households that can’t afford the large
down payment needed to purchase a home, so many households cannot stay or
settle in Maynard without additional opportunities to rent.
6. Maynard’s homes are more affordable to buy than communities with similar
characteristics; however, homeownership is still difficult to attain. Since 2015, the
median price of a single-family home in Maynard increased by 20% to a median
price of $399,000 in 2019. A similar increase was observed in the price of
Maynard condominiums, which went up by 22% in four years, now at a median
price of $305,000.
Housing Affordability
7. Increasing housing costs in Maynard are contributing to continued local housing
cost burdens, especially for renters. Nearly half of renters in Maynard spend more
than 30% of their income on housing costs, making it more difficult to pay for other
necessities or support the local economy with discretionary spending. Although not
as severe, about a quarter of owners in Maynard are cost burdened.
8. Among income-eligible households already living in Maynard, the housing needs of
seniors and single-person households is particularly great. More than half of elderly
households are low-income or below and nearly 50% of those that live alone are
also eligible for Affordable Housing.
9. The greatest share of income-eligible households (more than 70%) is very low-
income or extremely low-income. The Town needs to expand its supply of deed-
restricted Affordable Housing units that can reach deeper levels of affordability.
Demographics
Maynard’s population has grown from 10,106 total residents in 2010 to 10,667 today
(Decennial Census 2010, ACS 2014-2018). This growth is encouraging, considering that the
town’s population declined between 2000 and 2010. The 2015 HPP included population
projections that showed an expected reversal of this trend; however, Maynard’s actual
population growth exceeds the projections made for 2020 (10,193) and even 2030
(10,309). The increased number of Maynard residents indicates a need for additional
housing of all types and tenures. Taking a closer look at the changes in the age, income, and
race/ethnicity of Maynard residents provides insight into the housing needs of specific
segments of Maynard’s population and how to create opportunities for those that wish to
settle in Maynard.

Maynard HPP Update 2021 16
Households and Household Size While Maynard’s population has increased, the number of households in town has
decreased from 4,301 in 2012 to 4,250 in 2018, according to American Community Survey
estimates (ACS, 2008-2012 and 2014-2018). This trend could suggest that household sizes
in Maynard have gotten larger: there is evidence of a slight increase in household sizes,
going up from 2.36 in 2012 to 2.49 today (ACS, 2008-2012 and 2014-2018). Still, Maynard
has a relatively small household size when compared with the context communities (See
Figure 4 below). With relatively smaller household sizes, the Town should focus on
encouraging housing production that expands smaller housing options for empty-nesters,
seniors, young professionals, and those living alone or with roommates.
Figure 4: Household Size, Maynard and Context Communities (2010-2018)
Maynard HPP Update 2021 17
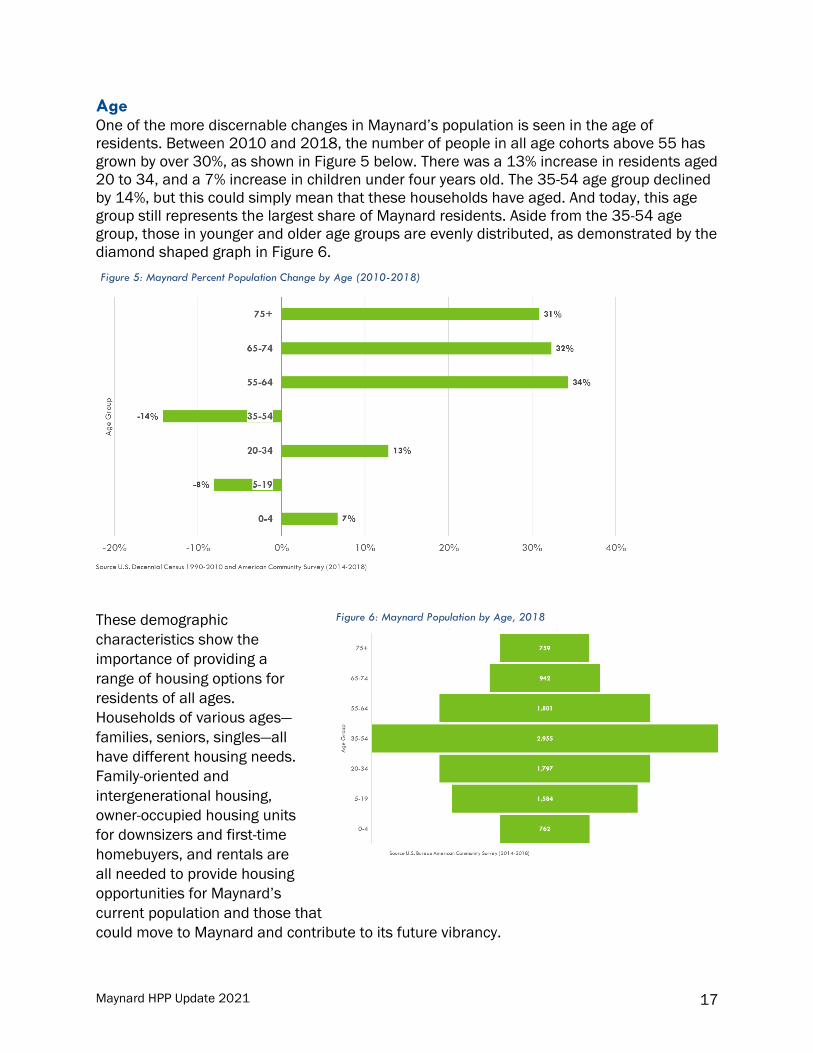
Age One of the more discernable changes in Maynard’s population is seen in the age of
residents. Between 2010 and 2018, the number of people in all age cohorts above 55 has
grown by over 30%, as shown in Figure 5 below. There was a 13% increase in residents aged
20 to 34, and a 7% increase in children under four years old. The 35-54 age group declined
by 14%, but this could simply mean that these households have aged. And today, this age
group still represents the largest share of Maynard residents. Aside from the 35-54 age
group, those in younger and older age groups are evenly distributed, as demonstrated by the
diamond shaped graph in Figure 6.
These demographic
characteristics show the
importance of providing a
range of housing options for
residents of all ages.
Households of various ages—
families, seniors, singles—all
have different housing needs.
Family-oriented and
intergenerational housing,
owner-occupied housing units
for downsizers and first-time
homebuyers, and rentals are
all needed to provide housing
opportunities for Maynard’s
current population and those that
could move to Maynard and contribute to its future vibrancy.
Figure 5: Maynard Percent Population Change by Age (2010-2018)
Figure 6: Maynard Population by Age, 2018

Maynard HPP Update 2021 18
Tenure Of the 4,250 households in Maynard, 3,262 (77%) own their home and 988 rent (23%). This
large share of owner-occupied households is related to the town’s housing stock: 69% of
housing units in town are single-family homes, which are typically owner-occupied, and 31%
are multifamily, which typically offer more opportunities to rent.
Although the overall share of renters in town is low, these households are evenly distributed
across age groups, indicating that young, middle-aged, and older residents all rent homes in
Maynard, and demonstrating that adding to the stock of rental housing units would benefit
all age groups.
Income Since 2012, there has been a sizable increase in the median income of Maynard residents.
Maynard’s median household income in 2018 was $101,324, up from $79,441 in 2012
(ACS, 2008-2012 and 2014-2018). This trend could be related to improved employment
opportunities as well as an increase in higher-income residents that have settled in
Maynard. While an overall increase in the median income of Maynard residents is
encouraging, a more nuanced analysis of income is needed to better understand local
housing needs.
As Figure 8 below shows, there’s been a 26% increase in the number of residents earning
over $100,000. These high-earning households now represent about half of the town’s
population.
Figure 7: Maynard Household Tenure by Age (2018)
Maynard HPP Update 2021 19
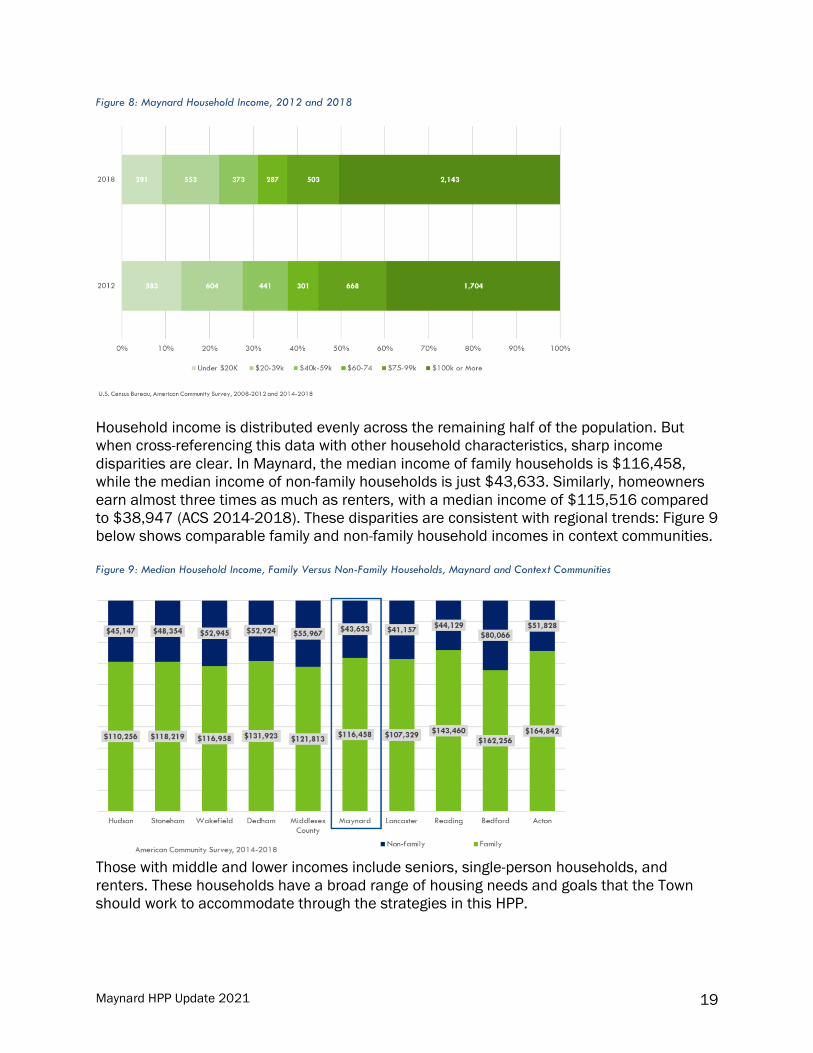
Figure 8: Maynard Household Income, 2012 and 2018
Household income is distributed evenly across the remaining half of the population. But
when cross-referencing this data with other household characteristics, sharp income
disparities are clear. In Maynard, the median income of family households is $116,458,
while the median income of non-family households is just $43,633. Similarly, homeowners
earn almost three times as much as renters, with a median income of $115,516 compared
to $38,947 (ACS 2014-2018). These disparities are consistent with regional trends: Figure 9
below shows comparable family and non-family household incomes in context communities.
Figure 9: Median Household Income, Family Versus Non-Family Households, Maynard and Context Communities
Those with middle and lower incomes include seniors, single-person households, and
renters. These households have a broad range of housing needs and goals that the Town
should work to accommodate through the strategies in this HPP.

Maynard HPP Update 2021 20
Race/Ethnicity Racial composition in Maynard and suburban communities across the United States is
connected to a history of federal, state, and local housing policies that caused segregation.
One of the most impactful policies was redlining, a discriminatory housing practice
supported by the federal government that limited where people of color could access loans
to purchase a home. The consequences of redlining are still with us today, and the
settlement patterns it created have been perpetuated by zoning’s proliferation of single-
family housing and the separation of land uses.
Since 2000, Maynard’s population has become more
diverse, with a 4% increase in African American
residents, a 49% increase in Asian residents, and a 6%
increase in Latinx residents. However, the share of non-
white residents in Maynard (9%) is the second-lowest of
all context communities and substantially lower than the
MAGIC subregion (22%), Middlesex County (27%), and
the Commonwealth (28%).
The Greater Boston Housing Report Card is published by
the Dukakis Center for Urban and Regional Policy and
the Boston Foundation to score communities across the
region on how their housing conditions relate to
opportunity, affordability, and racial diversity. The scoring
is represented on a radar chart (see Figure 11), which
indicates how the community is performing in these
areas.
Maynard scores high in best practices: the Town was
designated as a Housing Choice Community in 2021 for
applying housing best practices, including having an
Figure 10: Percent White and Non-white Residents, Maynard and Context Communities
Figure 11: Maynard Housing Radar Chart on the Greater Boston Housing Report Card
Maynard HPP Update 2021 21
Affordable Housing Trust (AHT) and adopting the Community Preservation Act (CPA).
Maynard ranks low in the areas of racial composition, housing diversity, and production, but
the Dukakis Center may be missing new production permit data from the Town. When
Maynard was designated as a Housing Choice Community in 2021, it had shown an
increase in housing production from 2015-2019 that was over 8%. Still, producing more
types of housing options in Maynard will create more opportunities for the Town to continue
to improve its racial diversity and meet the broad array of local housing needs.
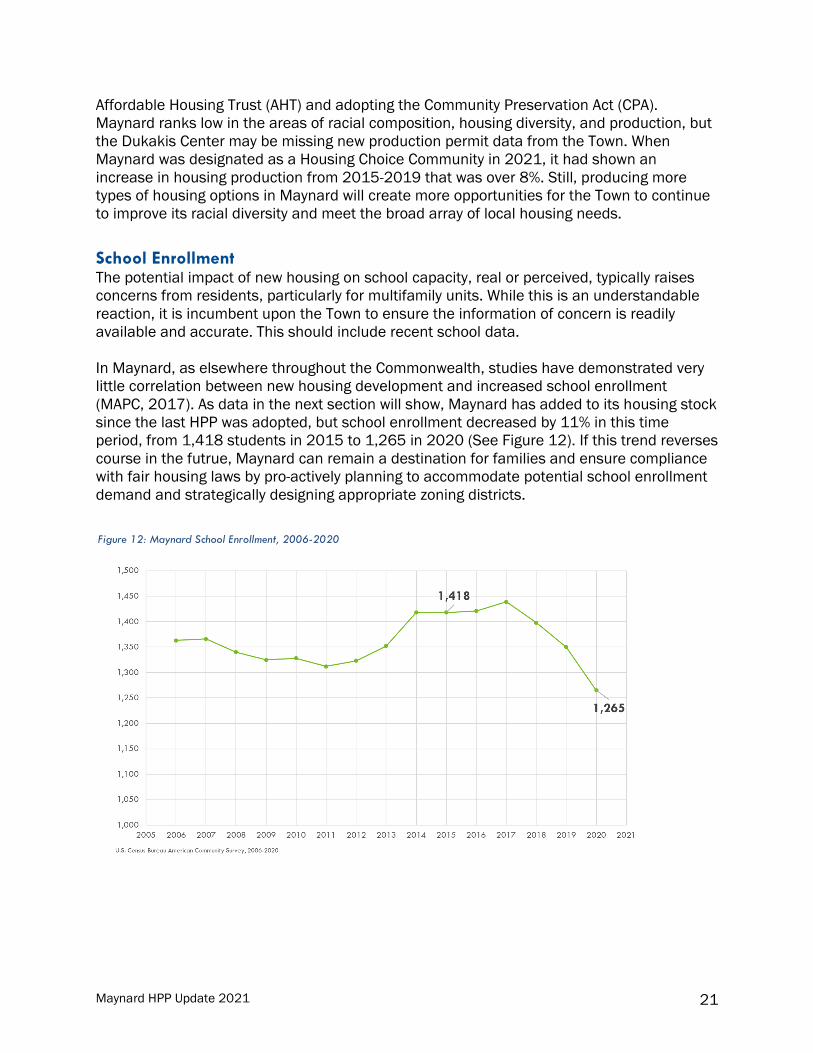
School Enrollment The potential impact of new housing on school capacity, real or perceived, typically raises
concerns from residents, particularly for multifamily units. While this is an understandable
reaction, it is incumbent upon the Town to ensure the information of concern is readily
available and accurate. This should include recent school data.
In Maynard, as elsewhere throughout the Commonwealth, studies have demonstrated very
little correlation between new housing development and increased school enrollment
(MAPC, 2017). As data in the next section will show, Maynard has added to its housing stock
since the last HPP was adopted, but school enrollment decreased by 11% in this time
period, from 1,418 students in 2015 to 1,265 in 2020 (See Figure 12). If this trend reverses
course in the futrue, Maynard can remain a destination for families and ensure compliance
with fair housing laws by pro-actively planning to accommodate potential school enrollment
demand and strategically designing appropriate zoning districts.
Figure 12: Maynard School Enrollment, 2006-2020
Maynard HPP Update 2021 22
Housing Stock
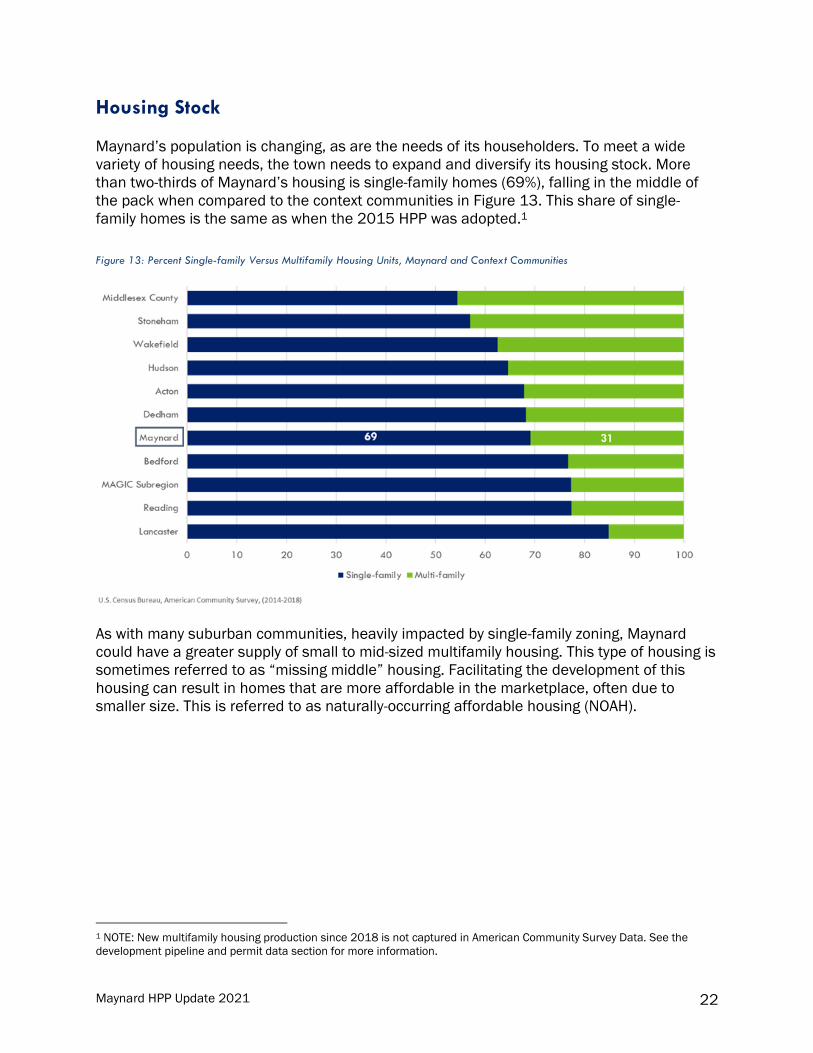
Maynard’s population is changing, as are the needs of its householders. To meet a wide
variety of housing needs, the town needs to expand and diversify its housing stock. More
than two-thirds of Maynard’s housing is single-family homes (69%), falling in the middle of
the pack when compared to the context communities in Figure 13. This share of single-
family homes is the same as when the 2015 HPP was adopted.1
Figure 13: Percent Single-family Versus Multifamily Housing Units, Maynard and Context Communities
As with many suburban communities, heavily impacted by single-family zoning, Maynard
could have a greater supply of small to mid-sized multifamily housing. This type of housing is
sometimes referred to as “missing middle” housing. Facilitating the development of this
housing can result in homes that are more affordable in the marketplace, often due to
smaller size. This is referred to as naturally-occurring affordable housing (NOAH).
1 NOTE: New multifamily housing production since 2018 is not captured in American Community Survey Data. See the
development pipeline and permit data section for more information.
Maynard HPP Update 2021 23
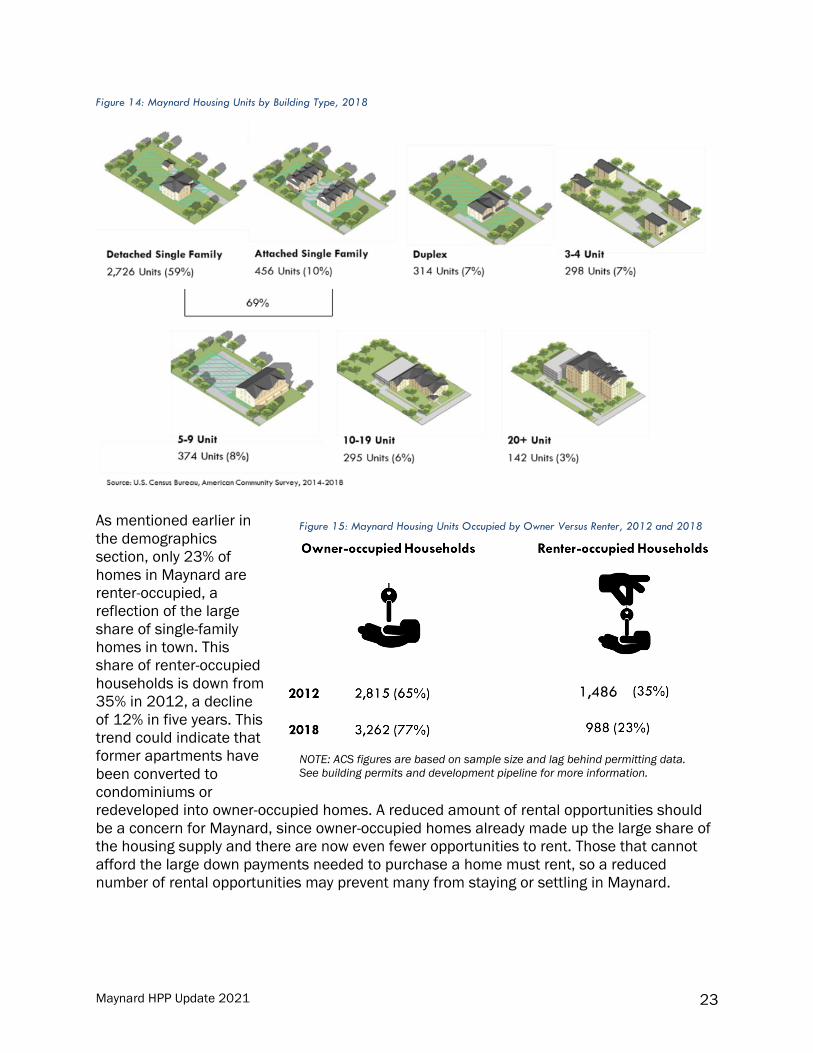
Figure 14: Maynard Housing Units by Building Type, 2018
As mentioned earlier in
the demographics
section, only 23% of
homes in Maynard are
renter-occupied, a
reflection of the large
share of single-family
homes in town. This
share of renter-occupied
households is down from
35% in 2012, a decline
of 12% in five years. This
trend could indicate that
former apartments have
been converted to
condominiums or
redeveloped into owner-occupied homes. A reduced amount of rental opportunities should
be a concern for Maynard, since owner-occupied homes already made up the large share of
the housing supply and there are now even fewer opportunities to rent. Those that cannot
afford the large down payments needed to purchase a home must rent, so a reduced
number of rental opportunities may prevent many from staying or settling in Maynard.
NOTE: ACS figures are based on sample size and lag behind permitting data.
See building permits and development pipeline for more information.
1,486
Figure 15: Maynard Housing Units Occupied by Owner Versus Renter, 2012 and 2018

Maynard HPP Update 2021 24
Maynard’s current stock of rental housing is generally more affordable in the marketplace
compared with other communities. According to online rental listings gathered by MAPC in
2018, a two-bedroom apartment in Maynard was $1,450, the lowest cost of all the context
communities.
However, it is difficult to draw definitive conclusions from this data since it is based off a
small sample size of rental listings. The low frequency of online rental listings confirms the
concern that there are limited opportunities to rent in Maynard. For instance, between 2017
and 2018, there were only 17 two-bedroom apartments listed for rent, demonstrating the
difficulty one would have in finding an apartment in town.
Figure 17: Frequency of Online Rental Listings, Maynard, 2017 and 2018
Figure 16: Median Rent by Bedroom Type, Maynard + Context Communities, 2018
Maynard HPP Update 2021 25
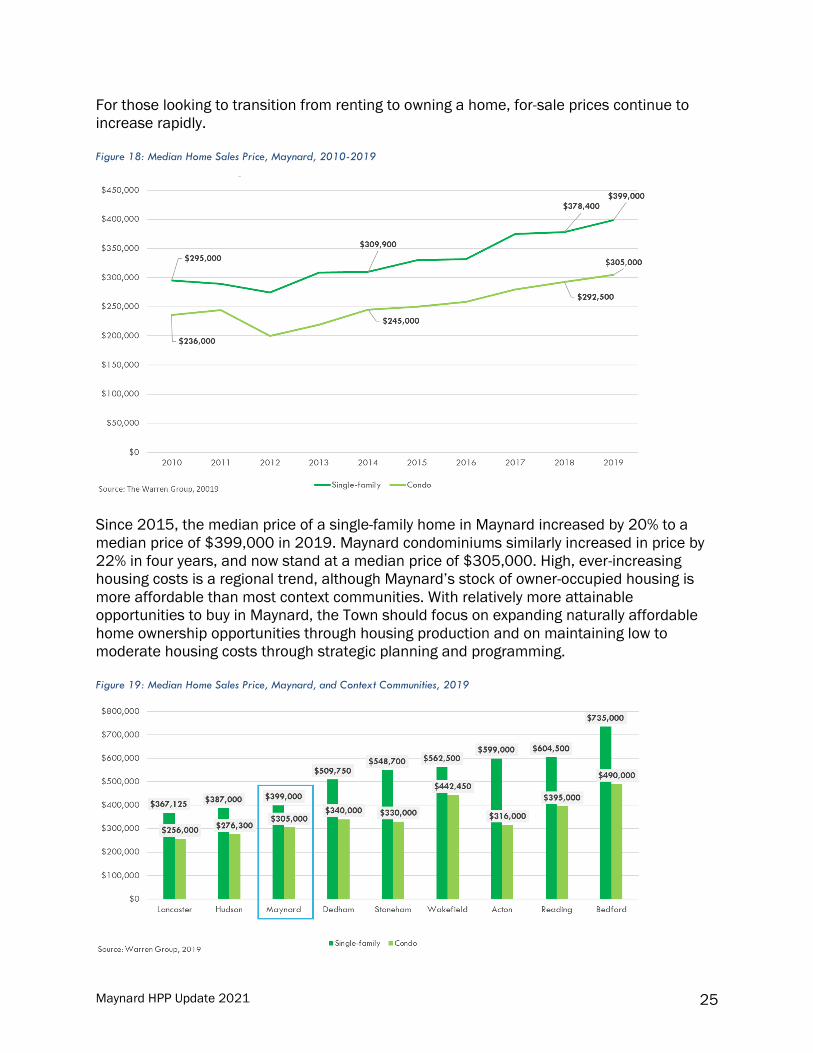
For those looking to transition from renting to owning a home, for-sale prices continue to
increase rapidly.
Figure 18: Median Home Sales Price, Maynard, 2010-2019
Since 2015, the median price of a single-family home in Maynard increased by 20% to a
median price of $399,000 in 2019. Maynard condominiums similarly increased in price by
22% in four years, and now stand at a median price of $305,000. High, ever-increasing
housing costs is a regional trend, although Maynard’s stock of owner-occupied housing is
more affordable than most context communities. With relatively more attainable
opportunities to buy in Maynard, the Town should focus on expanding naturally affordable
home ownership opportunities through housing production and on maintaining low to
moderate housing costs through strategic planning and programming.
Figure 19: Median Home Sales Price, Maynard, and Context Communities, 2019
Maynard HPP Update 2021 26
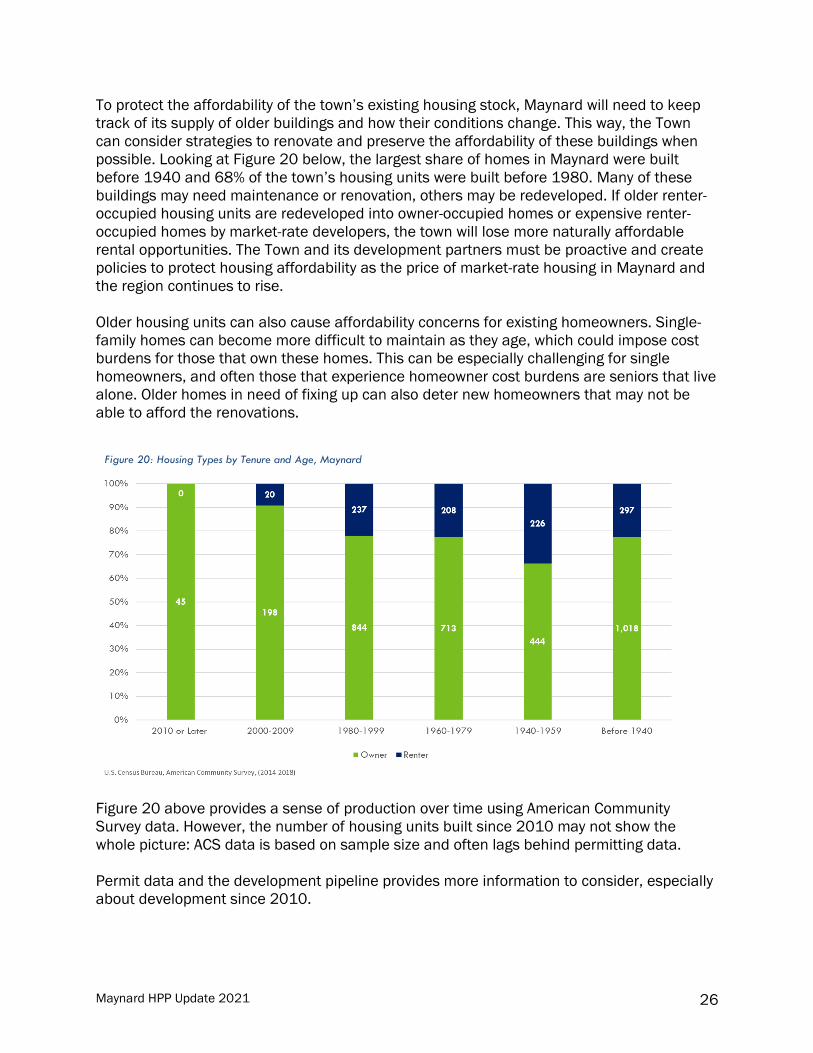
To protect the affordability of the town’s existing housing stock, Maynard will need to keep
track of its supply of older buildings and how their conditions change. This way, the Town
can consider strategies to renovate and preserve the affordability of these buildings when
possible. Looking at Figure 20 below, the largest share of homes in Maynard were built
before 1940 and 68% of the town’s housing units were built before 1980. Many of these
buildings may need maintenance or renovation, others may be redeveloped. If older renter-
occupied housing units are redeveloped into owner-occupied homes or expensive renter-
occupied homes by market-rate developers, the town will lose more naturally affordable
rental opportunities. The Town and its development partners must be proactive and create
policies to protect housing affordability as the price of market-rate housing in Maynard and
the region continues to rise.
Older housing units can also cause affordability concerns for existing homeowners. Single-
family homes can become more difficult to maintain as they age, which could impose cost
burdens for those that own these homes. This can be especially challenging for single
homeowners, and often those that experience homeowner cost burdens are seniors that live
alone. Older homes in need of fixing up can also deter new homeowners that may not be
able to afford the renovations.
Figure 20 above provides a sense of production over time using American Community
Survey data. However, the number of housing units built since 2010 may not show the
whole picture: ACS data is based on sample size and often lags behind permitting data.
Permit data and the development pipeline provides more information to consider, especially
about development since 2010.
Figure 20: Housing Types by Tenure and Age, Maynard

Maynard HPP Update 2021 27
Building Permits and Development Pipeline Maynard has seen a notable amount of housing production since the last HPP was adopted.
Between 2015 and 2020, 411 residential permits were issued. It’s important to note that,
permits do not always result in housing construction. Developments permitted from 2018 to
2020 that the Town can confirm resulted in construction are detailed below:
2018
• Eight single-family housing units including five attached townhouses and three
detached single-family houses
• 143 senior independent living units (C. Gardens)
• 180 multifamily apartment units (The Vue)
2019
• 5 multifamily housing units (31 Main Street)
• 24 multifamily housing units (42 Summer Street)
2020
• 3 single-family detached houses
The Town is also expecting two new residential developments in the coming years. These
include the Bancroft Civico Development and a development at 115 Main Street. Available
information about each development was provided by the Town and detailed here below:
• 12 Bancroft Civico Development
o 12 total housing units including three deed-restricted Affordable Housing
units.
o Two studio units, six one-bedroom units, and four two-bedroom units.
• 115 Main Street
o Mixed-use rental housing.
o 26 total housing units including seven deed-restricted Affordable Housing
units.
Housing Affordability Increasing housing costs impact current Maynard residents by making it more difficult for
them to afford other necessities, such as food, healthcare, and transportation. Nearly one-
third (31%) of Maynard households are cost burdened (ACS, 2014-2018), meaning they
spend too much on housing costs (30% of their income or more).
Cost burden rates are considerably higher for renters, with almost half (47%) experiencing
cost burdens. About one-quarter (24%) of renters are severely cost-burdened, spending 50%
of their income or more on housing. Homeowners are also experiencing cost burden,
although to a lesser extent: 26% are cost-burdened and 9% are severely cost-burdened.

Maynard HPP Update 2021 28
While this is the most current data on cost burden, it was collected prior to the COVID-19
pandemic. It is reasonable to assume that cost burdens documented before the pandemic
have likely worsened and additional households may have become cost burdened because
of the inability to work.
Cost burden rates are similar across all age groups. As Figure 22 shows, both older, middle-
aged, and younger households are experiencing cost burden. Reducing housing cost
burdens will benefit everyone: more Maynard residents will be able to accomplish their
financial goals and have more discretionary income to support the local economy.
Figure 21: Maynard Housing Cost Burdens by Tenure, 2018
Figure 22: Maynard Cost Burdened Households by Age, 2018
Maynard HPP Update 2021 29
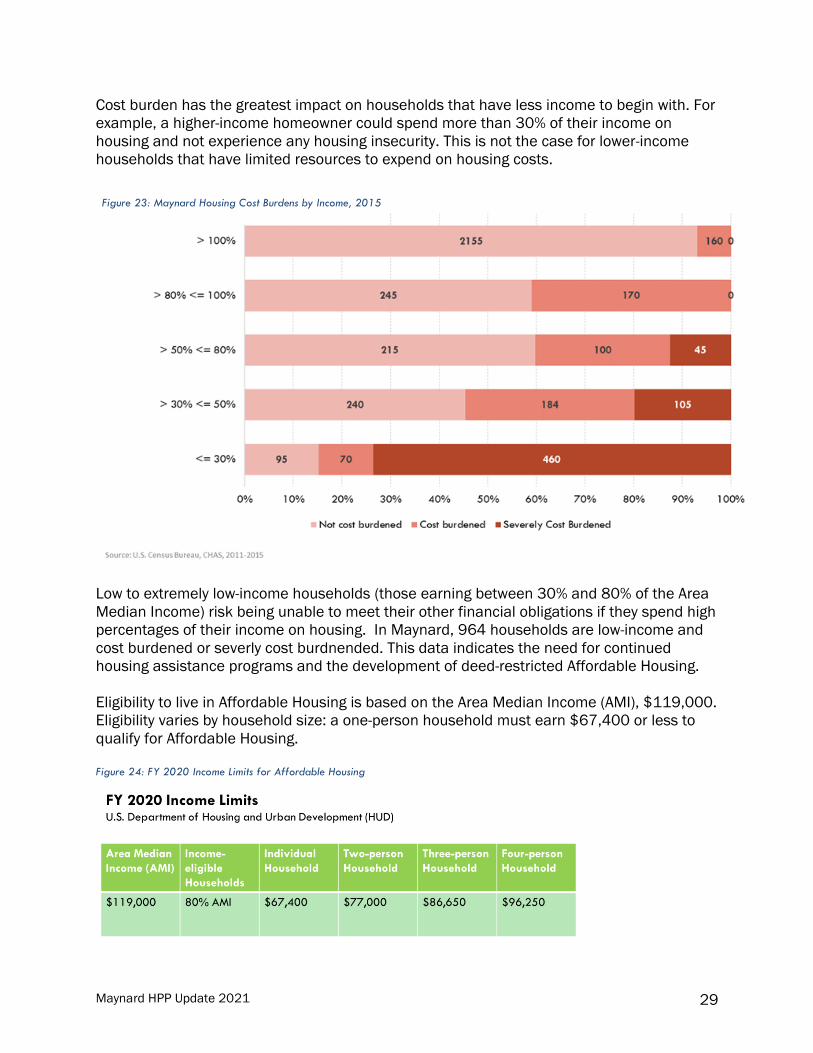
Cost burden has the greatest impact on households that have less income to begin with. For
example, a higher-income homeowner could spend more than 30% of their income on
housing and not experience any housing insecurity. This is not the case for lower-income
households that have limited resources to expend on housing costs.
Low to extremely low-income households (those earning between 30% and 80% of the Area
Median Income) risk being unable to meet their other financial obligations if they spend high
percentages of their income on housing. In Maynard, 964 households are low-income and
cost burdened or severly cost burdnended. This data indicates the need for continued
housing assistance programs and the development of deed-restricted Affordable Housing.
Eligibility to live in Affordable Housing is based on the Area Median Income (AMI), $119,000.
Eligibility varies by household size: a one-person household must earn $67,400 or less to
qualify for Affordable Housing.
Figure 23: Maynard Housing Cost Burdens by Income, 2015
Figure 24: FY 2020 Income Limits for Affordable Housing
Maynard HPP Update 2021 30
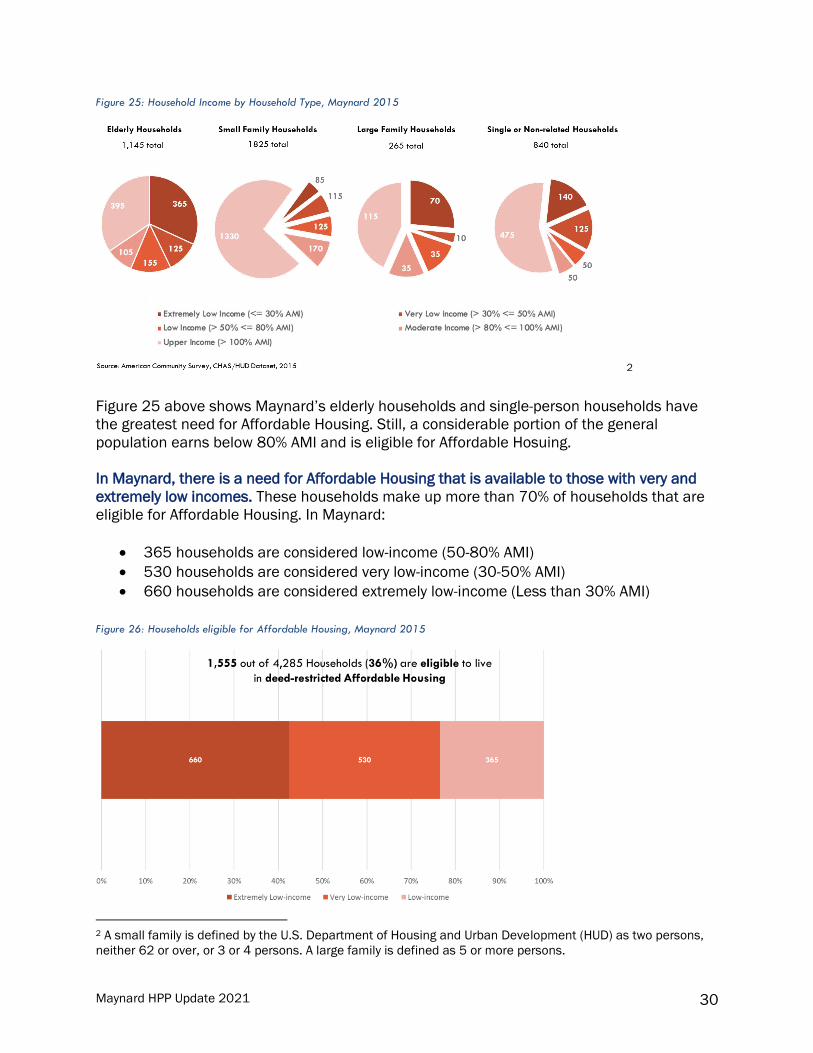
Figure 25: Household Income by Household Type, Maynard 2015
2
Figure 25 above shows Maynard’s elderly households and single-person households have
the greatest need for Affordable Housing. Still, a considerable portion of the general
population earns below 80% AMI and is eligible for Affordable Hosuing.
In Maynard, there is a need for Affordable Housing that is available to those with very and
extremely low incomes. These households make up more than 70% of households that are
eligible for Affordable Housing. In Maynard:
• 365 households are considered low-income (50-80% AMI)
• 530 households are considered very low-income (30-50% AMI)
• 660 households are considered extremely low-income (Less than 30% AMI)
2 A small family is defined by the U.S. Department of Housing and Urban Development (HUD) as two persons,
neither 62 or over, or 3 or 4 persons. A large family is defined as 5 or more persons.
Figure 26: Households eligible for Affordable Housing, Maynard 2015
Maynard HPP Update 2021 31
Given this data, the Town should focus on meeting housing needs for very low-income and
extremely low-income households.
Since the 2015 HPP was adopted, Maynard has increased its Subsidized Housing Inventory
(SHI) (see housing terms on Page 8 for SHI definition), albeit slightly, from 8.33% to 8.58%.
The Town should be commended for this progress, but more deed-restricted Affordable
Housing units are still needed. For the 1,555 income-eligible households in Maynard, there
are 419 housing units on the SHI—a ratio of one unit for every four eligible households
(DHCD, 2021). But since a share of SHI units developed through 40B are market-rate
rentals, the need is even greater.
Maynard HPP Update 2021 32

Maynard HPP Update 2021 33
PUBLIC ENGAGEMENT AND PLAN INPUT
ublic input on housing needs and plan recommendations was a major addition to the
HPP update. The project team presented data and recommendations for updated HPP
goals, priority strategies, best practices, and development opportunities at two public
forums. Qualitative information gathered from a housing need focus group illuminated key
data findings and helped to personalize housing issues. Additionally, insights about the
town’s land use regulations and development opportunities were gathered from local board
members and the development community during a housing development focus group
meeting. All this input strengthened the plan’s analysis and informed recommendations.
Information gathered from the public is summarized in Table 1 below and referenced
throughout the report where applicable. In general, public input supports the plan
recommendations and the Town’s efforts to expand housing opportunity.
Table 1: HPP Update Public Engagement Events
Event Date Number of
Participants Engagement activities
Public Forum I December
9, 2020 43
Input on updated data and live polls ranking 2015
HPP goals for importance/relevance.
Housing Need
Focus Group
December
12, 2021 13
Group discussion and share of personal housing
challenges and goals.
Housing
Development
Focus Group
February 8,
2021 8
Group discussion of the town’s housing challenges,
goals, and possible solutions.
Public Forum II June 23,
2021 32
Main room and breakout room discussions of draft
HPP priority strategies and best practices.
Live polls ranking importance of proposed HPP
priority strategies and housing
opportunities/recommended housing types
Five working
group meetings
October
2020 –
August
2021
6 Discussion of data, public input, and plan
recommendations.
TOTAL: Nine
meetings
Seven
months
102
participants
NOTE: Takeaways from public discussions and polling results are described throughout the report to
show how they influenced and informed the HPP update recommendations.
P
Maynard HPP Update 2021 34

Maynard HPP Update 2021 35
HOUSING DEVELOPMENT CONSTRAINTS
he 2015 HPP included a detailed assessment of constraints on housing development.
This documented natural constraints such as protected open space, wetlands and
sewer; an evaluation of the Town’s capacity to address housing needs; and a zoning audit.
Zoning and natural constraints have remained mostly the same since 2015, but constraints
on water and sewer capacity have become more significant. Upgrading this infrastructure is
critical to developing additional housing options in town. Maynard’s administrative capacity
has increased considerably and the Town has a more expansive toolkit after implementing
the majority of recommendations made in 2015. One of the strategies implemented was the
adoption of inclusionary zoning. Aside from this, there haven’t been other zoning changes
since the 2015 HPP was adopted. Updates to housing development constraints are
summarized below.
Updates to Development Constraints
Water Capacity Maynard’s ability to accommodate new development is severely limited by its current water
infrastructure. Two of the Town’s wells have been abandoned, and the remaining active
wells are limited in their pumping capacity due to poor water quality. The Town is struggling
to meet existing maximum daily demand. If additional capacity is lost, particularly at the
Rockland Avenue treatment system, the Town may be unable to meet the existing average
day demand. Without providing greater capacity, the Town runs the risk of a moratorium on
new development.
Sewer Capacity The Town’s sewer system, which serves over 95% of Maynard residents, is mostly comprised
of pipes from the early- to mid-20th century and has experienced numerous failures. Overall,
the Town’s wastewater treatment capacity needs to increase to serve future community
needs and pipes require replacement and other upgrades. Maynard’s Department of Public
Works (DPW) has indicated that continued growth is likely to overburden the already
compromised infrastructure, leading to failures greater in number and scale.
Limited Developable Land More than half of Maynard’s roughly 111 acres of vacant land is comprised of
“undevelopable land” as defined in the Assessors’ database. Land is partially made
undevelopable by topographic limitations and the need to preserve natural resources such
as floodplains, wetlands, and wellhead zones.
While redevelopment of the Town’s vacant land inventory may be a viable option for housing
production, certain opportunities for redevelopment are limited due to 21E Brownfields Use
Limitations. One of the largest by-right opportunities for future housing in Maynard is at Mill
T

Maynard HPP Update 2021 36
& Main, which currently has a use limitation that prohibits residential uses until further
environmental remediation is completed (in addition to water/sewer capacity issues).
Public Perception A segment of Maynard residents has expressed concern that further residential
development, or the development of specific types of housing units, will negatively impact
the Town and its community character. There is ongoing concern that new residential units
would strain existing services, such as schools, police, and fire.
Updates to Maynard’s Housing Toolkit In some communities, a lack of capacity and tools can be a constraint on development.
Since the adoption of the 2015 HPP, Maynard has significantly expanded its capacity by
implementing many of the recommendations made in the plan. This expansion of the Town’s
toolkit positions Maynard to continue to make progress towards meeting housing need.
Updates to the Town’s housing toolkit since 2015 are summarized here below.
Maynard Housing Authority As documented in the 2015 HPP, the Maynard Housing Authority (MHA) manages 56 1-
bedroom units under the Chapter 667-1 program, which is state-aided elderly housing. It
also manages 56 Section 8 project-based new construction units under Chapter 667-2, an
elderly/handicapped housing program administered by the Department of Housing and
Community Development (DHCD). Lastly, MHA’s inventory includes 32 2-4-bedroom units
under Massachusetts 137 federal family public housing. In addition, the MHA administers
25 Massachusetts Rental Voucher Program (MRVP) mobile vouchers.
Regional Housing Services Office Membership In 2020, the Town of Maynard joined the Regional Housing Services Office (RHSO), a
collaboration between the member towns of Acton, Bedford, Concord, Lexington, Lincoln,
Maynard, Sudbury, Wayland, and Weston. The RHSO assists with the municipal function of
Affordable Housing, including proactive monitoring, program administration, project
development, and resident assistance.
Affordable Housing Trust In 2018, the Maynard Affordable Housing Trust was formed, creating a separate fund for
local initiatives to create and preserve Affordable Housing, such as providing financial
support for affordable housing development, rehabilitation, conversion, recertification, or
creating low-income homeownership or rehabilitation programs.
Adoption of an Inclusionary Zoning Bylaw An Inclusionary Zoning Bylaw was adopted in May 2018, with the purpose of leveraging the
creation of market-rate housing to advance Affordable Housing objectives through new
development while also meeting the needs and expectations of residents.

Maynard HPP Update 2021 37
The Community Preservation Act and Committee In 2006, Maynard voters adopted the Community Preservation Act (CPA). The Town funds its
CPA account though a 1.5% surcharge on all real estate property tax bills (with a few
exemptions). One allowed use of the funds, which are controlled by the Community
Preservation Committee (CPC), is addressing housing needs by recommending housing
projects, including acquiring and developing community housing, for funding.
Today, the CPC annually funds the Maynard Affordable Housing Trust and the Town’s RHSO
membership.
Adoption of the 2020 Master Plan and creation of the Master Plan Implementation Committee
The 2020 Maynard Master Plan was formally adopted by the Town, and lays out specific
housing goals:
• “Maintain and encourage a range of housing options, including those that are
accessible to persons and households of various ages, abilities, and economic
means.”
• “Pursue housing development strategies that balance growth with Town services and
infrastructure, consumable resources, natural resources, open space, and energy
supply.”
• “Support mixed-use housing in downtown, as appropriate to the area’s scale, density,
and aesthetic character, in a manner that does not detract from its economic and
cultural functions.”
In 2021, the Town formed the Master Plan Implementation Committee, an advisory body
charged with monitoring and supporting Town departments and committees as they carry
out the tasks set forth in the Master Plan. The Committee’s mission is to oversee progress
and confirm Maynard’s development in accordance with the Master Plan, including those
goals related to housing.
Powder Mill Road Zoning Study In 2019, Maynard began working with MAPC to conduct a zoning study along the Powder
Mill Road Corridor. This study includes several recommendations for zoning changes in this
area that would create a more bike- and pedestrian-friendly environment and provide
greater access to the Assabet River.
Housing Choice Designation In March 2021, the Town applied for Housing Choice Community designation, which is a
state designation for communities with at least 3% growth in residential units within a five-
year period. Maynard received Housing Choice designation, as the Town had a residential
growth rate of over 8% in the last five years and holds best practices such as having an
Affordable Housing Trust (AHT) and passing the Community Preservation Act (CPA).
The designation will help the Town acquire grants for projects related to housing as well as
infrastructure that may forward housing production.
Maynard HPP Update 2021 38
Adoption of Off-site Stormwater Mitigation for Redevelopment Projects In Fall 2020, the Town amended its Stormwater Management Bylaws to allow off-site
stormwater mitigation for redevelopment projects. This allows redevelopment projects that
otherwise would not be able to achieve required stormwater standards to provide mitigation
off-site to meet state and local requirements. This is especially important for housing and
mixed-use redevelopment within the downtown area.
The Coolidge School Redevelopment Project The Town, through a working group and request for proposals, was able to successfully
negotiate the sale and redevelopment of the long-vacant Coolidge School. The planned
housing development includes Affordable units above the requirements of the Inclusionary
Zoning Bylaw. This is the first time that the Town has repurposed municipal facilities into
new housing.
Maynard HPP Zoning Audit Summary
With the exception of adopting an Inclusionary Zoning Bylaw, the Town has not had any
other zoning changes since the 2015 HPP was adopted. The zoning audit from the 2015
HPP is summarized below for reference. The updated HPP includes several
recommendations for changes and updates to Maynard’s zoning.
Residential Zoning Zoning bylaws regulate the type and location of development within a community under
M.G.L. Chapter 40A. For the purposes of a HPP, zoning can be considered a constraint if the
bylaw significantly limits expanding the housing supply to meet demand. While Maynard’s
zoning bylaw has many positive attributes—including a definition and use for alternatives to
single-family housing, such as multifamily development and live/workspace, other aspects
serve as barriers to housing diversity. In Maynard, it is possible to achieve some housing
diversity given the zoning bylaw, but housing that is not of a single-family typology tends to
be largely confined to a particular district and/or require special permitting.

Maynard HPP Update 2021 39
Table 2: Maynard Residential Zoning Districts
In Maynard, multifamily housing is permitted by special permit from the Planning Board in
the General Residence, Business, Neighborhood Business Overlay, and Downtown Mixed-
Use Overlay districts. Mixed-use development is allowed by right in the latter two overlays.
The Neighborhood Business Overlay District is designed to encourage and authorize
developments with a mix of uses and building types. Developments are limited to no more
than five dwelling units, and the maximum number of dwelling units in the overlay cannot
exceed 100.
The Downtown Mixed-Use Overlay is designed to enable a mix of retail, commercial, and
residential uses, and a modest increase in density. Mixed-use development with six or fewer
dwelling units is allowed by right; a higher number of units requires a special permit. The
minimum lot requirement of 1,500 square feet per residential unit can be reduced to a
minimum of 800 square feet pending a development agreement that includes, among other
requirements, a minimum of 15% affordable units or a donation to the Maynard Affordable
Housing Trust or Community Preservation Fund. Parking minimums are reduced from the
typical two spaces to 1.5 spaces per dwelling unit. This inclusionary housing provision is
positive, but applicable nowhere else in Maynard. The lack of a town-wide inclusionary
housing policy means that opportunities to leverage market-rate housing for affordable units
are missed.
In Maynard, a garden apartment is defined as a building or series of buildings, each
containing not less than three full family units, located on a fully landscaped building lot and
used exclusively for dwelling purposes. Off-street parking is required. It is clear that building
height is not desirable in the Garden Apartment District, given the maximum of 40 feet. But
landscape requirements could be applied to other housing typologies, such as townhomes
Table 14: Maynard Residential Zoning Bylaw
Sin
gle
Re
sid
en
ce
Sin
ge R
esi
de
nce
Ge
ne
ral R
esi
de
nce
Bu
sin
ess
Ce
ntr
al B
usi
ne
ss D
istr
ict
Ind
ust
rial
Gar
de
n A
par
tme
nt
Ne
igh
bo
rho
od
Bu
sin
ess
Ove
rlay
Do
wn
tow
n M
ixe
d-U
se O
verl
ay
He
alth
Car
e In
du
stri
al
S-1 S-2 GR B CB I GA NBOD DOD HCID
Single-family (SF) Y Y Y Y N N N N
Two-family N N Y Y N N N N
Multifamily N N PB PB N N N PB PB Y
Garden apartment N N N N N N Y Y
Healthcare/edlerly housing, assisted living BA BA BA N N N N Y
Nursing and convalescent home BA BA BA BA N N N Y
Live/work dwelling unit N N N Y Y N N Y
Accessory apartment BA BA BA BA N N N N
Mixed-use Y* Y**
Source: Town of Maynard Zoning Bylaw. *With fewer than 5 DU; **With 6 or fewer DU, otherwise by SP.
Districts
Residential Uses

Maynard HPP Update 2021 40
or cottage-style housing, in order to more efficiently utilize land and encourage greater
density.
Accessory Family Dwelling Units are allowed in Maynard by special permit from the Zoning
Board of Appeals (ZBA) in single-family residential and business districts. In this case,
“family” is defined as being related by blood, marriage, or adoption. No more than three
people can occupy an accessory family dwelling unit. Floor area may not exceed 600 square
feet. In other Mature Suburbs, 750 square feet is more typical. Off-street parking is required.
The only area of town where the height needed for multifamily development is allowed is the
Health Care Industrial District, where buildings can rise as high as 70 feet. However,
multifamily development is also permitted in the following districts where the height
maximum discourages this land use: General Residence, Business, NBOD, and DOD. In the
NBOD, for example, the building height maximum is 45 feet. This generally allows for three
stories, whereas four-to-five stories are typically needed to facilitate new multifamily
development.
Maynard’s zoning bylaw does not permit single- to multifamily housing conversion. This is a
good strategy to increase the housing supply by creating smaller units within existing stock.
It is particularly appropriate for empty nesters with large homes.
Generally, two parking spaces per dwelling unit are required throughout town, regardless of
housing type. This makes multifamily housing development a challenge. There may be
areas, such as the Downtown Mixed-Use Overlay District, where a parking maximum, rather
than minimum, would allow developers greater flexibility to meet housing need. The market,
then, would determine how much parking is appropriate. Alternatively, parking could be
reduced to 1.5 or even one space per multifamily dwelling unit in certain areas of Town, or
tied to bedroom mix.
Maynard’s special permit and site plan review processes are not always clear to developers.
There may be opportunity to make these processes more transparent and streamlined so
that developers know what to expect and that they can expect efficiency.
Based on this understanding of existing zoning and other development constraints, as well
as analysis of housing needs and demand, this plan offers recommendations for specific
zoning amendments in order to facilitate greater housing diversity and affordability in
Maynard.

Maynard HPP Update 2021 41

Maynard HPP Update 2021 42
HOUSING DEVELOPMENT OPPORTUNITIES
Introduction
The Maynard HPP defines housing affordability strategies that will complement the market-
rate residential development that will occur in the town. This development opportunities
analysis was undertaken to better understand the potential impacts of private residential
development and determine how best to align that development with the Town’s affordable
housing goals. It identifies potential residential development opportunities based on a
Geographic Information Systems (GIS) analysis, distinguishes sites with similar
characteristics, and groups these as site types. Based on the characteristics of each site
type and the surrounding context, this analysis also considers where new housing may be
located and the suitability of different housing types. The analysis focused on the most
centrally located and dense districts in Maynard as the most appropriate locations to
consider denser residential redevelopment.
The Development Constraints Chapter describes the constraints on new housing
development and redevelopment in Maynard and the Town’s capacity to implement housing
strategies. Since the 2015 HPP, the Town has made considerable progress to expand its
housing toolkit, build public support for addressing local housing needs, and implement
mechanisms to produce Affordable Housing (such as the Town’s Inclusionary Zoning Bylaw
that was adopted in May 2018). In March 2021, Maynard was designated as a Housing
Choice Community for the progress the Town has made to grow its housing stock and for
implementing several housing best practices, such as establishing an Affordable Housing
Trust (AHT) in 2018. But even with these advancements, barriers to housing development
remain: limited open space, conservation regulations that limit development potential, and
most significantly, a lack of water and sewer capacity combined with outdated
infrastructure.
The following development opportunity analysis considered these constraints and identified
several opportunities to expand the housing stock. Additionally, the analysis includes a
projection of new housing units that could be produced from identified development
opportunities. To realize this development potential, the Town will need to significantly
upgrade its water and sewer capacity. The Town should use the projections contained in this
plan to ascertain infrastructure requirements to support future housing
development/redevelopment. The projections can also support the Town as it seeks funding
for infrastructure upgrades through financing like the MassWorks Grant program, which
assists in funding infrastructure upgrades to attract and accommodate private development.
This analysis indicates there are still opportunities to support additional residential units in
Maynard. However, the bulk of identified opportunities involve redevelopment rather than
new development, largely due to limited developable land and regulatory constraints. The
analysis did not result in the identification of vacant parcels that are available to support
new larger-scale development. The opportunities that do exist primarily consist of
redevelopment of existing parcels (infill) or renovations/modifications to existing structures.
As with many city and town centers throughout the region, many development opportunities

Maynard HPP Update 2021 43
Figure 27: Districts Included in the Development Opportunities Analysis
may not be obvious at first glance, but this analysis shows that redevelopment is possible on
a range of parcel sizes and locations throughout the area of Maynard that was analyzed. The
opportunities represent undervalued or underused parcels that could contribute more
positively to their neighborhoods and the town at large. This potential, along with increased
demand to live in Maynard, is attracting developer interest and outside investment, and it is
crucial to establish priorities for new development and ensure a regulatory framework that
advances the Town’s housing goals.
Opportunities for Potential Residential Development
The development opportunities analysis focused on the most centrally located and dense
districts in Maynard. These include the Central Business District, Downtown Overlay District,
Business District, Powder Mill Road Study Area, and Health Care Industrial District. The
opportunity analysis examined individual parcels that were located in these districts of the
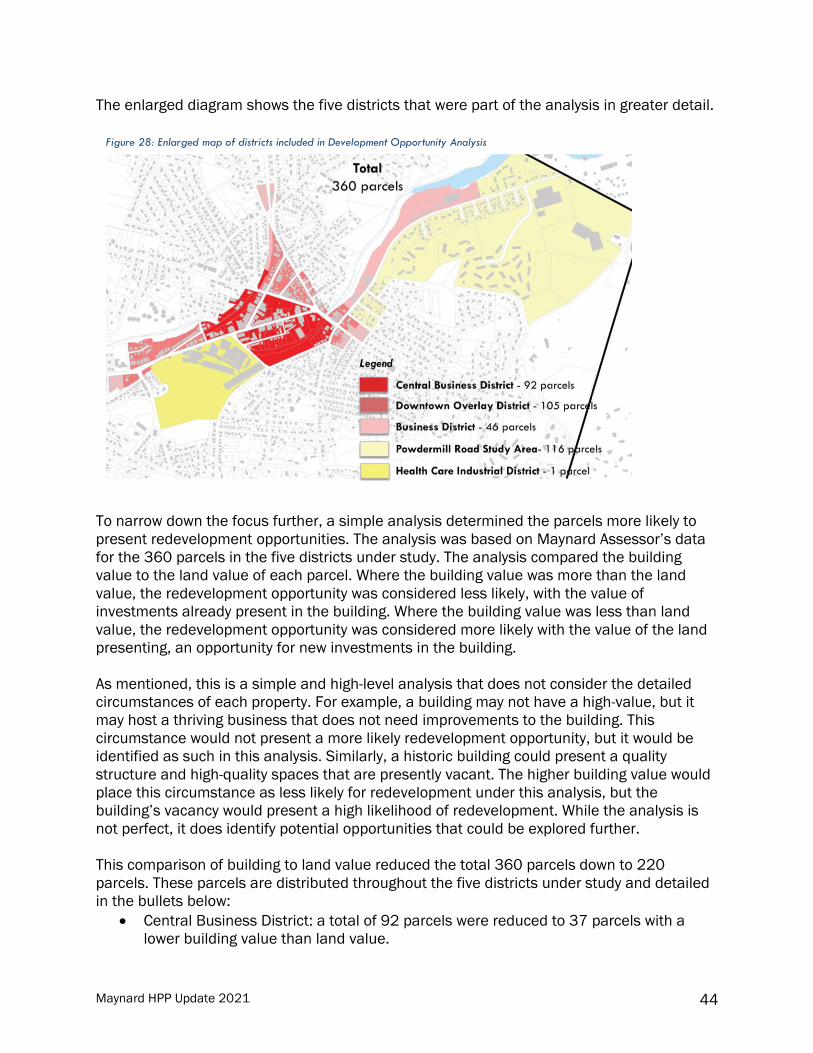
town. The Central Business District includes 92 parcels. The Downtown Overlay District
includes 105 parcels. The Business District includes 46 parcels. The Powder Mill Road Study
Area includes 116 parcels. The Health Care Industrial District includes one (1) parcel. A total
of 360 parcels were included in the development opportunities analysis across these
districts. These districts are clustered in the northern center and northeast corner of the
town. The illustration below shows the districts that were part of the analysis.
Maynard HPP Update 2021 44
The enlarged diagram shows the five districts that were part of the analysis in greater detail.
To narrow down the focus further, a simple analysis determined the parcels more likely to
present redevelopment opportunities. The analysis was based on Maynard Assessor’s data
for the 360 parcels in the five districts under study. The analysis compared the building
value to the land value of each parcel. Where the building value was more than the land
value, the redevelopment opportunity was considered less likely, with the value of
investments already present in the building. Where the building value was less than land
value, the redevelopment opportunity was considered more likely with the value of the land
presenting, an opportunity for new investments in the building.
As mentioned, this is a simple and high-level analysis that does not consider the detailed
circumstances of each property. For example, a building may not have a high-value, but it
may host a thriving business that does not need improvements to the building. This
circumstance would not present a more likely redevelopment opportunity, but it would be
identified as such in this analysis. Similarly, a historic building could present a quality
structure and high-quality spaces that are presently vacant. The higher building value would
place this circumstance as less likely for redevelopment under this analysis, but the
building’s vacancy would present a high likelihood of redevelopment. While the analysis is
not perfect, it does identify potential opportunities that could be explored further.
This comparison of building to land value reduced the total 360 parcels down to 220
parcels. These parcels are distributed throughout the five districts under study and detailed
in the bullets below:
• Central Business District: a total of 92 parcels were reduced to 37 parcels with a
lower building value than land value.
Figure 28: Enlarged map of districts included in Development Opportunity Analysis
Maynard HPP Update 2021 45
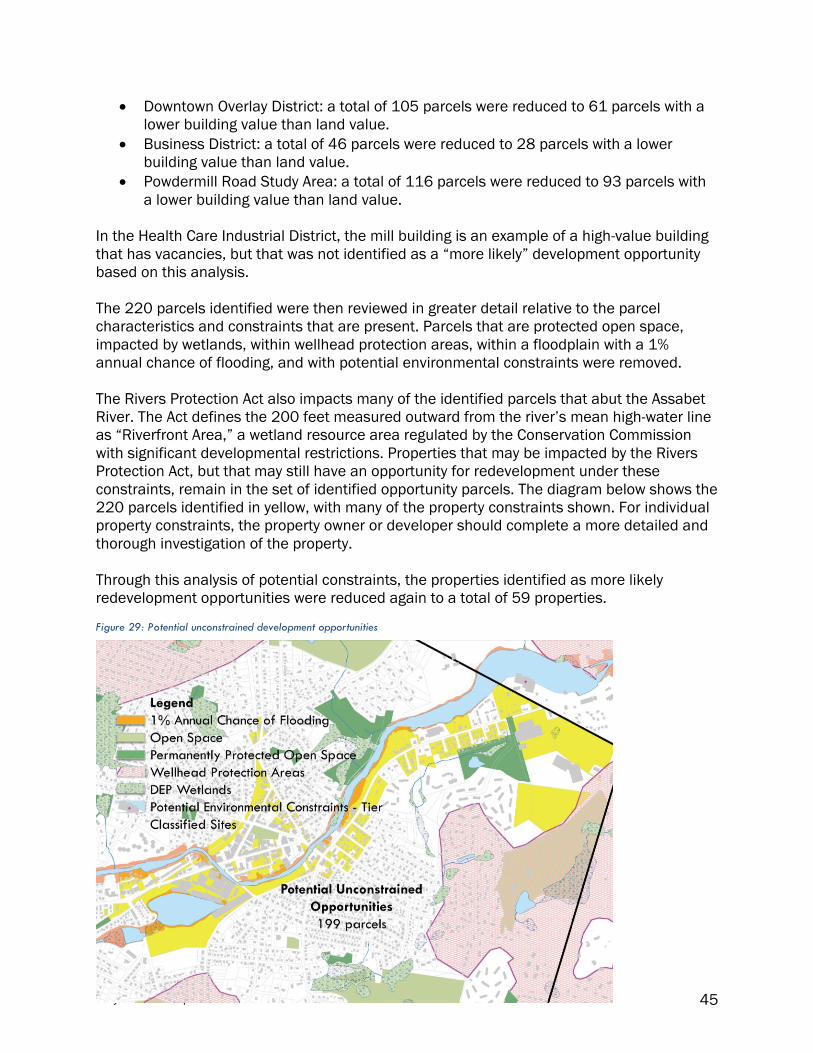
Figure 29: Potential unconstrained development opportunities
• Downtown Overlay District: a total of 105 parcels were reduced to 61 parcels with a
lower building value than land value.
• Business District: a total of 46 parcels were reduced to 28 parcels with a lower
building value than land value.
• Powdermill Road Study Area: a total of 116 parcels were reduced to 93 parcels with
a lower building value than land value.
In the Health Care Industrial District, the mill building is an example of a high-value building
that has vacancies, but that was not identified as a “more likely” development opportunity
based on this analysis.
The 220 parcels identified were then reviewed in greater detail relative to the parcel
characteristics and constraints that are present. Parcels that are protected open space,
impacted by wetlands, within wellhead protection areas, within a floodplain with a 1%
annual chance of flooding, and with potential environmental constraints were removed.
The Rivers Protection Act also impacts many of the identified parcels that abut the Assabet
River. The Act defines the 200 feet measured outward from the river’s mean high-water line
as “Riverfront Area,” a wetland resource area regulated by the Conservation Commission
with significant developmental restrictions. Properties that may be impacted by the Rivers
Protection Act, but that may still have an opportunity for redevelopment under these
constraints, remain in the set of identified opportunity parcels. The diagram below shows the
220 parcels identified in yellow, with many of the property constraints shown. For individual
property constraints, the property owner or developer should complete a more detailed and
thorough investigation of the property.
Through this analysis of potential constraints, the properties identified as more likely
redevelopment opportunities were reduced again to a total of 59 properties.
Maynard HPP Update 2021 46
The characteristics of the 59 potential opportunity sites were examined to group similar
sites and establish site types. Establishing site types generalizes the types of redevelopment
opportunities that may be present in these areas of Maynard and helps to consider different
redevelopment guidance that could be established for each site type.
The characteristics that were most consequential in the definition of site types were the size
of the site and the context of its location, such as land use, built environment, and roadway
type. Based on these features, the 59 potential opportunity sites were classified into six site
types:
Type 1: Small size (<1 acre) in the Central Business District. Type 1 includes small parcels under one acre located in the Central Business District
downtown area. There are at least 29 sites of this type in this area of the town, representing
a combined total of 5.9 acres of redevelopment opportunity.
Type 2: Large (36 acres) size in the Central Business District. Type 2 includes large parcels over 36 acres in size located in the Central Business District
downtown area. There is one site of this type in this area of the town, representing a
combined total of 36.0 acres of redevelopment opportunity. This is a unique opportunity site
that is difficult to group with any of the other types of sites that have been identified.
Type 3: Small size (<1 acre) outside of the Central Business District. Type 3 includes small parcels under one acre located outside of the Central Business
District downtown area. There are at least 17 sites of this type in this area of the town,
representing a combined total of 4.5 acres of redevelopment opportunity.
Type 4: Small size (1 acre) in the Powder Mill Road Study Area. Type 4 includes small parcels about one acre located in the Powdermill Road Study Area.
There are at least three sites of this type in this area of the town, representing a combined
total of 2.1 acres of redevelopment opportunity.
Type 5: Medium size (1 to 4 acres) in the Powder Mill Road Study Area. Type 5 includes medium parcels of about one to four acres size located in the Powdermill
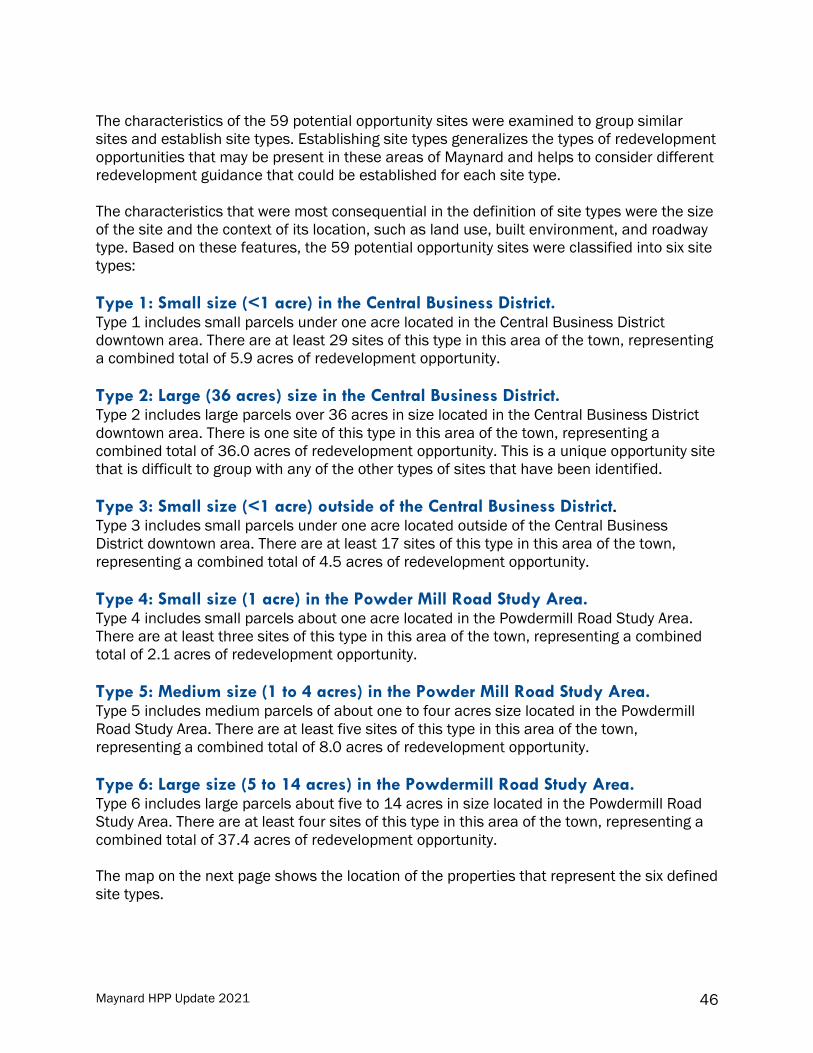
Road Study Area. There are at least five sites of this type in this area of the town,
representing a combined total of 8.0 acres of redevelopment opportunity.
Type 6: Large size (5 to 14 acres) in the Powdermill Road Study Area. Type 6 includes large parcels about five to 14 acres in size located in the Powdermill Road
Study Area. There are at least four sites of this type in this area of the town, representing a
combined total of 37.4 acres of redevelopment opportunity.
The map on the next page shows the location of the properties that represent the six defined
site types.
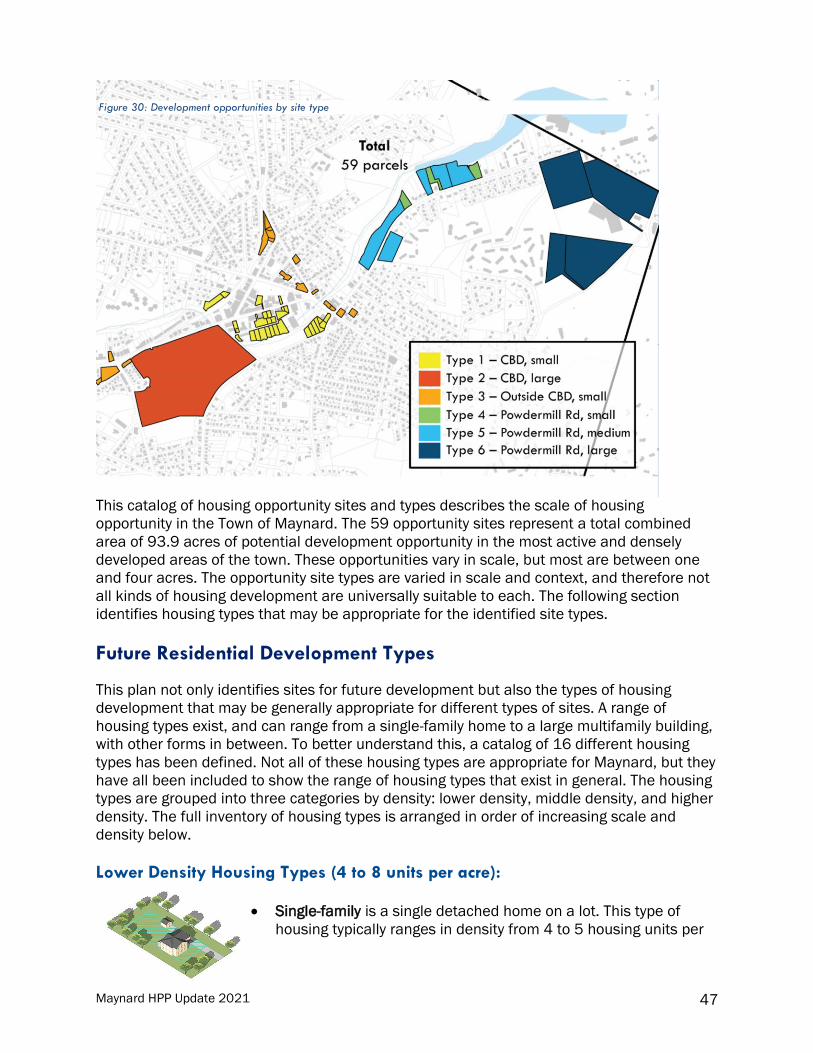
Maynard HPP Update 2021 47
Figure 30: Development opportunities by site type
This catalog of housing opportunity sites and types describes the scale of housing
opportunity in the Town of Maynard. The 59 opportunity sites represent a total combined
area of 93.9 acres of potential development opportunity in the most active and densely
developed areas of the town. These opportunities vary in scale, but most are between one
and four acres. The opportunity site types are varied in scale and context, and therefore not
all kinds of housing development are universally suitable to each. The following section
identifies housing types that may be appropriate for the identified site types.
Future Residential Development Types
This plan not only identifies sites for future development but also the types of housing
development that may be generally appropriate for different types of sites. A range of
housing types exist, and can range from a single-family home to a large multifamily building,
with other forms in between. To better understand this, a catalog of 16 different housing
types has been defined. Not all of these housing types are appropriate for Maynard, but they
have all been included to show the range of housing types that exist in general. The housing
types are grouped into three categories by density: lower density, middle density, and higher
density. The full inventory of housing types is arranged in order of increasing scale and
density below.
Lower Density Housing Types (4 to 8 units per acre):
• Single-family is a single detached home on a lot. This type of
housing typically ranges in density from 4 to 5 housing units per
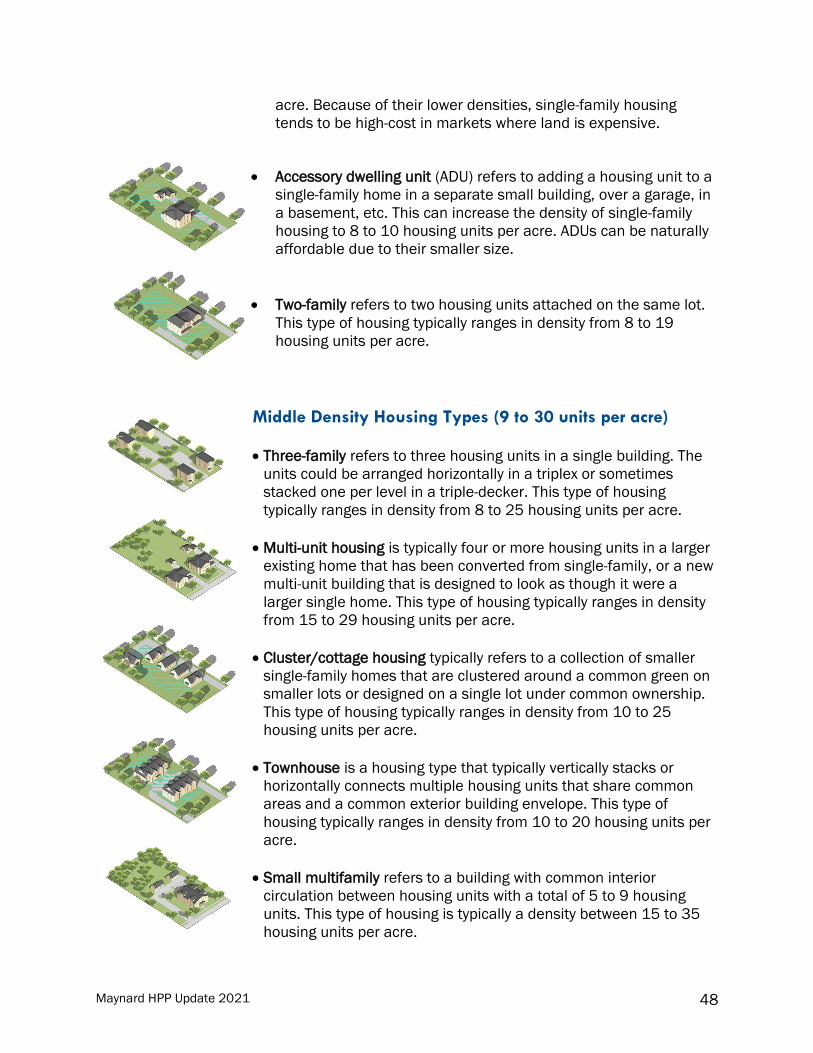
Maynard HPP Update 2021 48
acre. Because of their lower densities, single-family housing
tends to be high-cost in markets where land is expensive.
• Accessory dwelling unit (ADU) refers to adding a housing unit to a
single-family home in a separate small building, over a garage, in
a basement, etc. This can increase the density of single-family
housing to 8 to 10 housing units per acre. ADUs can be naturally
affordable due to their smaller size.
• Two-family refers to two housing units attached on the same lot.
This type of housing typically ranges in density from 8 to 19
housing units per acre.
Middle Density Housing Types (9 to 30 units per acre)
• Three-family refers to three housing units in a single building. The
units could be arranged horizontally in a triplex or sometimes
stacked one per level in a triple-decker. This type of housing
typically ranges in density from 8 to 25 housing units per acre.
• Multi-unit housing is typically four or more housing units in a larger
existing home that has been converted from single-family, or a new
multi-unit building that is designed to look as though it were a
larger single home. This type of housing typically ranges in density
from 15 to 29 housing units per acre.
• Cluster/cottage housing typically refers to a collection of smaller
single-family homes that are clustered around a common green on
smaller lots or designed on a single lot under common ownership.
This type of housing typically ranges in density from 10 to 25
housing units per acre.
• Townhouse is a housing type that typically vertically stacks or
horizontally connects multiple housing units that share common
areas and a common exterior building envelope. This type of
housing typically ranges in density from 10 to 20 housing units per
acre.
• Small multifamily refers to a building with common interior
circulation between housing units with a total of 5 to 9 housing
units. This type of housing is typically a density between 15 to 35
housing units per acre.
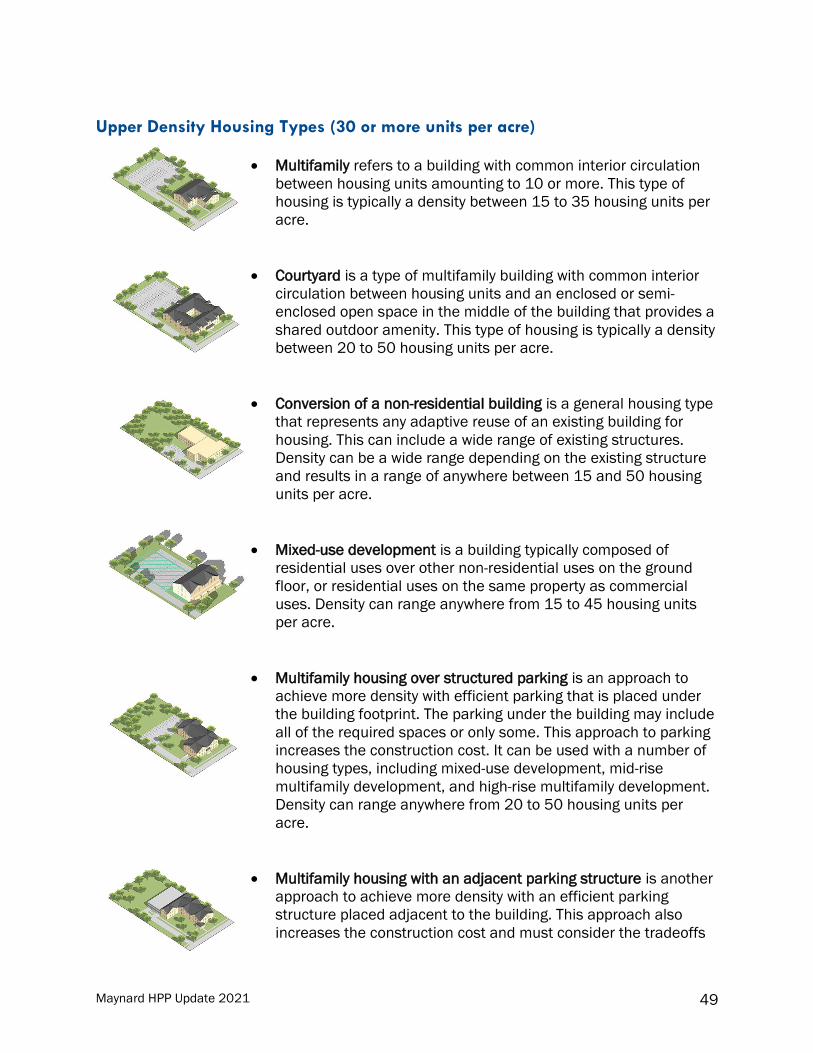
Maynard HPP Update 2021 49
Upper Density Housing Types (30 or more units per acre)
• Multifamily refers to a building with common interior circulation
between housing units amounting to 10 or more. This type of
housing is typically a density between 15 to 35 housing units per
acre.
• Courtyard is a type of multifamily building with common interior
circulation between housing units and an enclosed or semi-
enclosed open space in the middle of the building that provides a
shared outdoor amenity. This type of housing is typically a density
between 20 to 50 housing units per acre.
• Conversion of a non-residential building is a general housing type
that represents any adaptive reuse of an existing building for
housing. This can include a wide range of existing structures.
Density can be a wide range depending on the existing structure
and results in a range of anywhere between 15 and 50 housing
units per acre.
• Mixed-use development is a building typically composed of
residential uses over other non-residential uses on the ground
floor, or residential uses on the same property as commercial
uses. Density can range anywhere from 15 to 45 housing units
per acre.
• Multifamily housing over structured parking is an approach to
achieve more density with efficient parking that is placed under
the building footprint. The parking under the building may include
all of the required spaces or only some. This approach to parking
increases the construction cost. It can be used with a number of
housing types, including mixed-use development, mid-rise
multifamily development, and high-rise multifamily development.
Density can range anywhere from 20 to 50 housing units per
acre.
• Multifamily housing with an adjacent parking structure is another
approach to achieve more density with an efficient parking
structure placed adjacent to the building. This approach also
increases the construction cost and must consider the tradeoffs

Maynard HPP Update 2021 50
that come with a parking structure. It can be used with a number
of housing types including mixed-use development, mid-rise
multifamily development, or high-rise multifamily development.
Density can range from 20 to 50 housing units per acre.
• Mid-rise multifamily development up to 6-stories in height is a
multifamily structure that is maximizing wood frame construction
to reach six or seven stories. Density can range anywhere from
20 to 50 housing units per acre.
• High-rise multifamily development up to 10-stories in height is a
multifamily structure that is optimizing steel construction to reach
10 or more stories. Density can range anywhere from 50 to 100
housing units per acre.
These different housing types provide different levels of housing density, different kinds of
building character, and different opportunities for the inclusion of affordable housing.
Generally speaking, new single-family housing tends to be high cost due to its low density
compared to high land values. As the density of and the number of units in a housing
development increases, so too does the financial viability of including Affordable Housing
units, the viability of including improvements to the surrounding public realm, and the ability
to address other community needs through the development. Meanwhile, smaller size
homes, be they in small-scale or large-scale buildings, tend to be more naturally affordable
than large single-family homes or large units in multifamily buildings. For these reasons, as
well as the nature of the development opportunities available in Maynard, the lower density
housing types are not the focus of the housing types recommended as appropriate.
Matching Site and Housing Types
While each specific project proposed in Maynard should be designed for its specific site,
context, and circumstances, general guidance for site and housing type suitability will help
align future housing development with the goals of this housing plan. Appropriate matches
between housing types and the site types established above are based on the size of the
parcel relative to the general scale of a given housing type, financial feasibility of
development based on the value of the land and potential housing density, the scale of
surrounding buildings, walkability of the surrounding area, and the general market context.
There are potentially multiple appropriate housing types for each site type, illustrating the
variety of housing solutions that may occur on opportunity sites throughout these areas of
the town. Matches are not intended to offer specific housing proposals for a specific
property, but to propose the general scale and density appropriate on different kinds of sites
and in different areas of the town. A summary of appropriate matches and public input
provided at the second HPP public forum in June 2021 is below for each of the six site types.
Overall, community feedback indicates support for many of the matches this analysis
identifies as appropriate.

Maynard HPP Update 2021 51
Figure 32: Location of properties classified as Site Type 1.
Type 1: Small size (<1 acre) in the Central Business District. Appropriate housing types were selected based on the small scale of the properties, central
downtown location, surrounding higher-density context, and access to amenities provided by
the downtown location.
Middle density and upper density housing types are suggested as appropriate for Site Type
1, including small multifamily, multifamily, conversion of an existing structure to residential,
mixed-use with residential, and multifamily housing over structured parking.
Regardless of the housing type, new development on this site type should define the street
edges of the block and contribute to a streetscape that is pedestrian-oriented. Parking
should be minimized in order to maximize building density and it should be located behind
the building and concealed from view. Each of these housing types provides enough
potential for density to efficiently use sites of this scale and afford the opportunity to include
Affordable Housing units and/or create mixed-income buildings.
When asked to react to these housing types for Site Type 1, community members supported
all suggested types, with the most support expressed for multifamily, conversion of an
existing structure to residential, and mixed-use with residential.
Figure 31: Appropriate housing types suggested for Site Type 1.
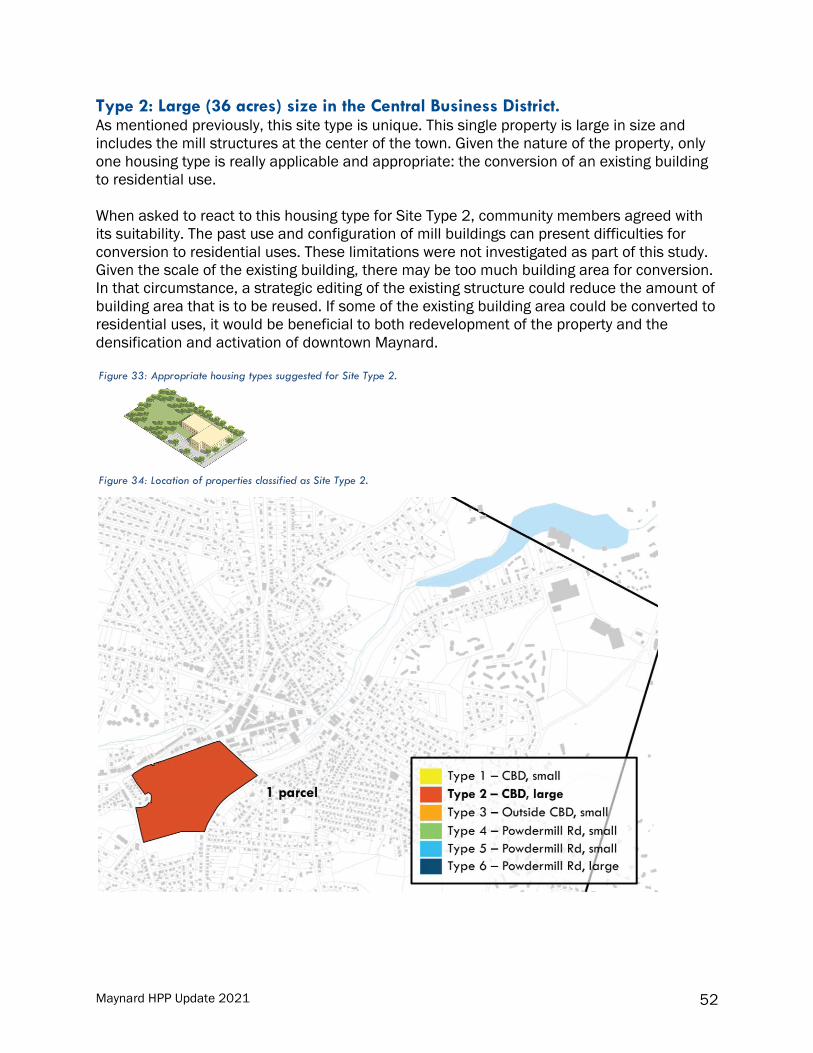
Maynard HPP Update 2021 52
Figure 34: Location of properties classified as Site Type 2.
Type 2: Large (36 acres) size in the Central Business District. As mentioned previously, this site type is unique. This single property is large in size and
includes the mill structures at the center of the town. Given the nature of the property, only
one housing type is really applicable and appropriate: the conversion of an existing building
to residential use.
When asked to react to this housing type for Site Type 2, community members agreed with
its suitability. The past use and configuration of mill buildings can present difficulties for
conversion to residential uses. These limitations were not investigated as part of this study.
Given the scale of the existing building, there may be too much building area for conversion.
In that circumstance, a strategic editing of the existing structure could reduce the amount of
building area that is to be reused. If some of the existing building area could be converted to
residential uses, it would be beneficial to both redevelopment of the property and the
densification and activation of downtown Maynard.
Figure 33: Appropriate housing types suggested for Site Type 2.

Maynard HPP Update 2021 53
Figure 36: Location of properties classified as Site Type 3.
Type 3: Small size (<1 acre) outside of the Central Business District. The small scale of the properties, central downtown adjacent location, higher-density
surroundings, and access to downtown amenities informed the choice of appropriate
housing types. These properties should contribute to a higher residential density associated
with downtown, but do not need to contribute directly to the mixed-use activity.
Lower density and middle density housing types are suggested as appropriate for Site Type
3, including two family, townhouse, and small multifamily.
Regardless of the housing type, new development on Site Type 3 should define the street
edges of the block and contribute to a streetscape that is pedestrian-oriented. Parking
should be minimized to maximize building density, and it should be located behind the
building and concealed from view. Each of these housing types provides enough potential
for density to include Affordable Housing units and/or create mixed-income buildings.
When asked to react to these housing types for Site Type 3, community members were
equally supportive of two family, townhouse, and small multifamily.
Figure 35: Appropriate housing types suggested for Site Type 3.

Maynard HPP Update 2021 54
Figure 38: Location of properties classified as Site Type 4.
Type 4: Small size (1 acre) in the Powdermill Road Study Area. Appropriate housing types were selected based on the small scale of the properties, location
on the Powdermill Road corridor, and surrounding context. These properties should be
contributing to a higher residential density along the important Powdermill Road corridor
and may contribute directly to the diversity of uses and activity in the corridor.
Middle density and upper density housing types are suggested as appropriate for Site Type
4, including small multifamily, multifamily, and mixed-use with residential.
Regardless of the housing type, new development on this site type should define street
frontage on Powdermill Road and contribute to a streetscape that is pedestrian-oriented.
Parking should be minimized in order to maximize building density, and it should be located
behind the building and concealed from view. Each of these housing types provides enough
potential for density to include Affordable Housing units and/or create mixed-income
buildings.
When asked to react to these housing types for Site Type 4, community members were
equally supportive of small multifamily and multifamily, with a small preference expressed
for mixed-use with residential.
Figure 37: Appropriate housing types suggested for Site Type 4.
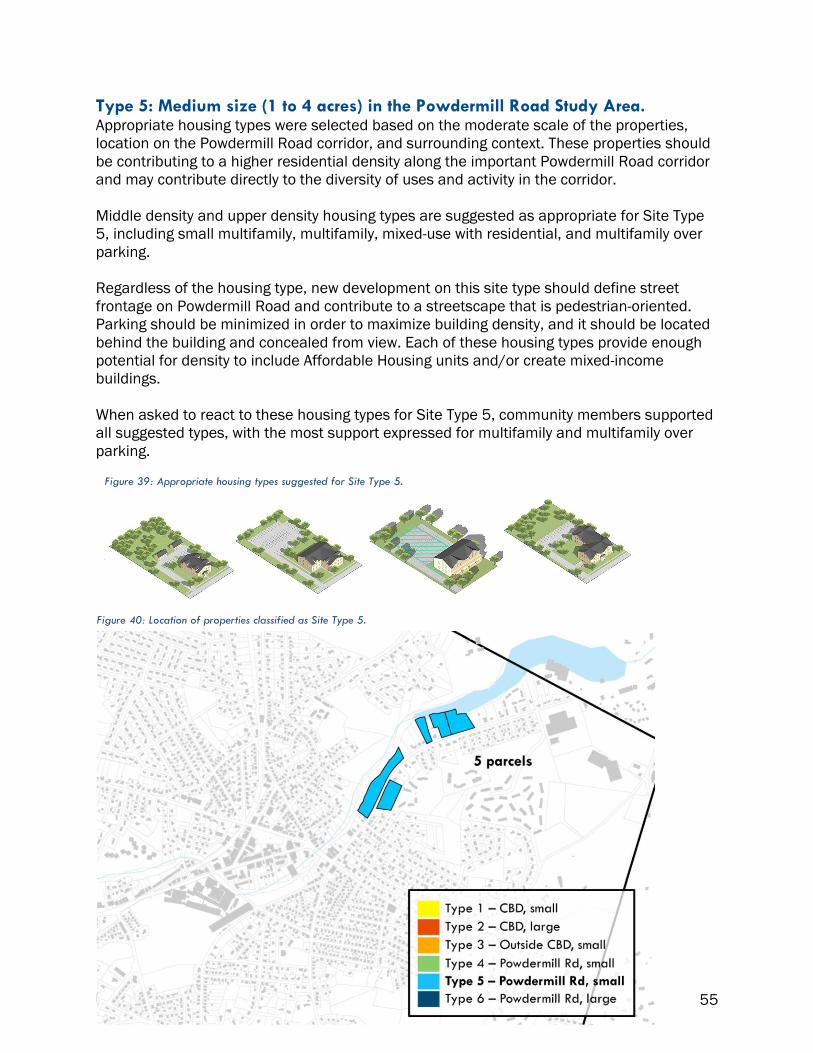
Maynard HPP Update 2021 55
Figure 40: Location of properties classified as Site Type 5.
Type 5: Medium size (1 to 4 acres) in the Powdermill Road Study Area. Appropriate housing types were selected based on the moderate scale of the properties,
location on the Powdermill Road corridor, and surrounding context. These properties should
be contributing to a higher residential density along the important Powdermill Road corridor
and may contribute directly to the diversity of uses and activity in the corridor.
Middle density and upper density housing types are suggested as appropriate for Site Type
5, including small multifamily, multifamily, mixed-use with residential, and multifamily over
parking.
Regardless of the housing type, new development on this site type should define street
frontage on Powdermill Road and contribute to a streetscape that is pedestrian-oriented.
Parking should be minimized in order to maximize building density, and it should be located
behind the building and concealed from view. Each of these housing types provide enough
potential for density to include Affordable Housing units and/or create mixed-income
buildings.
When asked to react to these housing types for Site Type 5, community members supported
all suggested types, with the most support expressed for multifamily and multifamily over
parking.
Figure 39: Appropriate housing types suggested for Site Type 5.

Maynard HPP Update 2021 56
Figure 42: Location of properties classified as Site Type 6.
Type 6: Large size (5 to 14 acres) in the Powdermill Road Study Area. Appropriate housing types were selected based on the large scale of the properties, location
on or near the Powdermill Road corridor, and surrounding context. These properties should
be contributing to a higher residential density along the important Powdermill Road corridor.
Suggested appropriate housing types for Site Type 6 are cluster/cottage residential,
townhouse, small multifamily, multifamily, courtyard, multifamily over parking, and
multifamily with a parking structure.
The properties are large enough that they may be able to support more than one housing
type in a redevelopment plan. Regardless of the housing type, new development on this site
type should define street frontage on Powdermill Road and contribute to a streetscape that
is pedestrian-oriented. Parking should be minimized in order to maximize building density,
and it should be located behind the building and concealed from view. Each of these
housing types provides enough potential for density to include Affordable Housing units
and/or create mixed-income buildings.
When asked to react to these housing types for Site Type 6, community members supported
all suggested types, with the most support expressed for cluster/cottage residential,
multifamily, courtyard, and multifamily over parking.
Figure 41: Appropriate housing types suggested for Site Type 6.
Maynard HPP Update 2021 57
These matches establish three primary development objectives: First, future housing
development should seek to expand the housing supply and the diversity of the housing
available in an area. Second, future housing development should take advantage of
appropriate opportunities for higher density, such as larger parcels or areas of concentrated
density and activity, to achieve economies of scale and provide Affordable Housing. Third,
future housing development should respect and respond to the surrounding context without
having to match the surrounding buildings and miss opportunities for relatively higher-
density development. Education is needed to build support for developments that advance
these objectives, especially on the benefits of density and the challenges of creating lower-
cost housing through low-density development. Even with public support, even a modest
increase of denser housing development will not be possible without upgrades to the town’s
water and sewer infrastructure.
Housing Production Projections
Matching opportunity site types with appropriate housing types provides a framework to
estimate the potential housing production yields for these central districts in the Maynard.
The following calculations are broad and general in nature but grounded in the development
opportunity analysis. Each appropriate housing type is associated with a general density
range, a number of units per acre that typically results from that type of residential
development. The development opportunity analysis identified the number of acres to which
each of the appropriate housing types may apply, so each of the opportunity and housing
types can be added up for a total housing yield.
This total housing yield would need to be supported by the appropriate water and
wastewater infrastructure. The current water and sewer infrastructure is likely inadequate to
support this scale of development, so these calculations should be used to inform plans for
future infrastructure investments and to help the town seek funding to make these
improvements.
Type 1: Small size (<1 acre) in the Central Business District. As described above, community members were most supportive of multifamily, conversion
of an existing structure to residential, and mixed-use with residential.
• The typical density for multifamily housing in this context is estimated at about 16
units per acre.
• The typical density of conversion of an existing structure is more difficult to estimate.
• The typical density for mixed-use with residential in this context is estimated at about
14 units per acre.
The combined total area of the 29 parcels classified as Site Type 1 is 5.9 acres. If you apply
the residential density range of 14 to 16 units per acre to this total area, it could yield
between 82 and 94 housing units. This range is a rough estimate and would depend on
individual site and building characteristics, financial feasibility, permitting approvals, and
other considerations.

Maynard HPP Update 2021 58
Type 2: Large (36 acres) size in the Central Business District. As described above, community members agreed with the suitability of the conversion of an
existing building housing type. This is a unique property occupied by the Mill and Main
building. The Maynard Assessor’s data lists the gross building area as 1,069,232 square
feet and the finished floor area as 826,774.
No additional study of this building or of its ability to support the conversion of some space
to residential use has been performed as part of this study. In order to illustrate the
potential unit yield that could occur, a basic calculation of residential units follows, based on
the conversion of one-quarter of the finished floor area to residential use. One quarter of the
finished floor area is 206,693 square feet. This area would not all be used for residential
units: about 15% of the area would be devoted to building circulation, utilities, or other
common features and areas. This would retain about 175,000 square feet to divide into
residential units. If an average unit size of 1,200 square feet were used, it would yield about
145 housing units.
Type 3: Small size (<1 acre) outside of the Central Business District. As described above, community members were equally supportive of two family, townhouse,
and small multifamily.
• The typical density for two family housing in this context is estimated at about 8 units
per acre.
• The typical density for townhouses in this context is estimated at about 9 units per
acre.
• The typical density for small multifamily housing in this context is estimated at about
9 units per acre.
The combined total area of the 17 parcels classified as Site Type 3 is 4.5 acres. If you apply
the residential density range of 8 to 9 units per acre to this total area, it could yield between
36 and 41 housing units. This range is a rough estimate and would depend on individual
site and building characteristics, financial feasibility, permitting approvals, and other
considerations.
Type 4: Small size (1 acre) in the Powdermill Road Study Area. As described above, community members were equally supportive of small multifamily,
multifamily, with a small preference expressed for mixed-use with residential.
• The typical density for small multifamily housing in this context is estimated at about
9 units per acre.
• The typical density for multifamily housing in this context is estimated at about 16
units per acre.
• The typical density for mixed-use with residential in this context is estimated at about
14 units per acre.
The combined total area of the three parcels classified as Site Type 4 is 2.1 acres. If you
apply the residential density range of 9 to 16 units per acre to this total area, it could yield

Maynard HPP Update 2021 59
between 19 and 34 housing units. This range is a rough estimate and would depend on
individual site and building characteristics, financial feasibility, permitting approvals, and
other considerations.
Type 5: Medium size (1 to 4 acres) in the Powdermill Road Study Area. As described above, community members supported all suggested types, with the most
support expressed for multifamily and multifamily over parking.
• The typical density for multifamily housing in this context is estimated at about 16
units per acre.
• The typical density for multifamily housing over parking in this context is estimated at
about 20 units per acre.
The combined total area of the five parcels classified as Site Type 5 is 8.0 acres. If you apply
the residential density range of 16 to 20 units per acre to this total area, it could yield
between 128 and 160 housing units. This range is a rough estimate and would depend on
individual site and building characteristics, financial feasibility, permitting approvals, and
other considerations.
Type 6: Large size (5 to 14 acres) in the Powdermill Road Study Area. As described above, community members supported all suggested types with the most
support expressed for cluster/cottage residential, multifamily, courtyard, and multifamily
over parking.
• The typical density cluster/cottage housing in this context is estimated at about 14
units per acre.
• The typical density for multifamily housing in this context is estimated at about 16
units per acre.
• The typical density for multifamily courtyard housing in this context is estimated at
about 18 units per acre.
• The typical density for multifamily housing over parking in this context is estimated at
about 20 units per acre.
The combined total area of the four parcels classified as Site Type 6 is 37.4 acres. If you
apply the residential density range of 14 to 20 units per acre to this total area, it could yield
between 523 and 748 housing units. This range is a rough estimate and would depend on
individual site and building characteristics, financial feasibility, permitting approvals, and
other considerations.
If you combine all of these total housing projections, the low end of the range is 933 housing
units and the high end is 1,222 housing units. While these totals provide an overall order of
magnitude of the opportunity on all of these properties, it is highly unlikely that all properties
identified would be redeveloped to maximize residential development. This range describes
that outcome. A more realistic assumption may be to assume that only half of the properties
identified would be redeveloped in this manner. If that were the case, the potential yield
range would be from 466 to 611 housing units.
Maynard HPP Update 2021 60

Maynard HPP Update 2021 61
Plan Recommendations:
Goals, Strategies, and Best Practices
Five years ago, the community of Maynard adopted a series of HPP goals through an
extensive public planning process. This update to those goals was informed by the latest
available data and public input.
At the first public forum for the HPP update on December 9, 2020, participants heard key
findings from the updated housing needs assessment before ranking the relevance of the
2015 HPP goals, which all received public support. Most input centered on a desire to work
toward greater diversity and racial equity through the HPP update. Based on this input and
supporting data, the working group decided to add a goal on advancing racial equity by
ensuring equal access to housing opportunities for people of color. Input gathered
throughout the planning process also showed the public would like new housing to support
the Town’s culture and vibrancy, and the working group decided to add this as an updated
goal.
Additionally, key findings from the housing needs assessment and the housing need focus
group demonstrate the importance of creating housing that can accommodate needs across
incomes and ages, so Goal 1 was revised to emphasize this need. The working group
determined that the 2015 HPP’s Goal 3, which focuses on housing programs, should be an
implementation type that applies across all plan goals, rather than a standalone goal. A
description and basis for each goal is detailed below.
Updated HPP Goals 2021
Goal 1: Preserve and advance housing affordability for all incomes and ages to reduce the number of local cost burdened households.
The Town should work to ensure its stock of deed-restricted Affordable Housing remains
accessible and to protect its stock of housing that’s currently affordable in the
marketplace—also known as naturally occurring affordable housing (NOAH). Additionally, the
Town needs to add to its supply of Affordable Housing and NOAH by using regulatory tools,
leveraging town assets, forming new partnerships with developers, and implementing
programs that work towards this goal. Doing so will give Maynard residents access to a
range of housing options in town and enable them to make choices based on their changing
housing needs. Increased housing choice and housing affordability will also reduce the
number and severity of local cost burdened households. Additionally, the Town should
continue to work to meet the state goal of 10% Subsidized Housing Inventory (SHI).
Basis for Goal
• For every four households in Maynard that are eligible to live in a deed-restricted
Affordable Housing unit, there is one unit on the Town’s subsidized housing inventory

Maynard HPP Update 2021 62
(SHI). There are 1,555 income-eligible households in Maynard, and 419 units on the
SHI.
• While Maynard has a decent supply of small multifamily homes, most of the housing
stock is single-family (69%). Given demographic shifts showing both an increase in
householders aged over 55 and householders aged 20-34, additional housing units
of varying sizes are needed to improve the likelihood that residents of all incomes
and ages can afford housing in the marketplace that meets their needs.
• Since the last HPP was adopted, Maynard has lost a considerable share of rental
housing units and these housing units make up a small percentage of housing in
town. From 2012 to 2018, the share of renter-occupied housing units declined from
35% to 23% (ACS 2008-2012 and 2014-2018).3 Many households lack the
resources for a down payment needed to purchase a home and consequently rely on
rental opportunities to remain or settle in town.
• Public input gathered at the housing need focus group and public forums supports
the need for a greater variety of housing options to facilitate home ownership, renting
opportunities, and downsizing.
Goal 2: Create diverse housing opportunities to support the Town’s culture and vibrancy.
Housing opportunities can help build the Town’s cultural assets. As Maynard expands its
supply of housing and creates a greater diversity of housing options, the Town should focus
on encouraging new development in areas where it can support community development.
Downtown Maynard, the center of Maynard’s cultural district, has an eclectic set of
restaurants, stores, and other businesses. The architectural style of buildings in this area
are also unique and attractive to both locals and visitors. The Town can encourage housing
types in this area that build on historical and cultural assets, such as vertical mixed-use,
townhouses, adaptive reuse, and other housing types that promote walkability and help to
further activate downtown. Intentional programming and flexible zoning regulations can also
support the growth of the downtown art community while addressing housing demand—by
creating artist lofts, for example.
Strategic housing development and programming can also help transform other areas of
importance, such as the Powder Mill Road corridor. The Town should work to ensure that
development and redevelopment of the corridor produces community benefits, such as
expanding access to the Assabet River and creating a bike and pedestrian connection into
downtown Maynard. Downtown and Powder Mill Road are discussed further in the
Development Opportunities Chapter on Page 32.
Basis for Goal
• As mentioned earlier, only 988 housing units in town are renter-occupied (23%),
down from 1,486 (35%) in 2012. Additional rentals will allow more single-person
households or those without the large savings needed to purchase a home to stay or
3 Note: these figures do not include new rental housing permitted and constructed since 2018.

Maynard HPP Update 2021 63
settle in Maynard. Residents of all ages rent in Maynard, and they are a vital part of
the community that contribute to the town’s culture. They include artists, young
professionals, long-time residents, and seniors. Creating additional opportunities for
renters will help support the town’s culture and vibrancy.
• In Maynard, the median income of family households is $116,458 while the median
income of non-family households is just $43,633. Similarly, homeowners earn almost
three times as much as renters, with a median income of $115,516 compared to
$38,947 (ACS 2014-2018). Improving the ability of renters and non-family
households to afford housing will better position them to make community
contributions and foster greater social capital.
• Conversations with the HPP working group and public input gathered throughout the
planning process showed strong interest in housing that supports the town’s culture
and vibrancy.
Goal 3: Advance racial equity by ensuring equal access to housing opportunities for people of color.
Maynard is working toward greater diversity and inclusivity and should make this a focus of
its housing initiatives. The racial composition in town is connected to a broad history of
housing discrimination that has defined settlement patterns throughout suburban
communities in Greater Boston. Creating more housing options in Maynard of various
tenures, sizes, and price points, and facilitating Affordable Housing development, will put the
town on a path toward greater racial diversity. Additionally, Maynard should establish
programs and policies to ensure housing discrimination does not occur today. Preventing
discrimination is only one part of the solution, however: the Town should also ensure new
development includes community benefits and advances housing opportunity for all.
Basis for Goal
• Since 2000, Maynard’s population has become more diverse, with a 4% increase in
African American residents, a 49% increase in Asian residents, and a 6% increase in
Latinx residents. However, the share of non-white residents in Maynard (9%) is the
second-lowest of all context communities and substantially lower than the MAGIC
subregion (22%), Middlesex County (27%), and the Commonwealth (28%).
• Advancing racial equity in town was a resounding theme of public input during public
forums, focus groups, and other engagement activities.
Goal 4: Adopt local zoning changes to allow for housing choices & flexible approaches to achieve housing affordability.
The Town should adjust its land use regulations to facilitate diverse and affordable housing
development and adopt or expand zoning that results in these housing opportunities. The
Town adopted an inclusionary zoning policy in May 2018 requiring a certain percentage of
housing units in new developments to be affordable and is considering updating this policy

Maynard HPP Update 2021 64
so that it results in more deeply affordable housing. Additionally, the Town should work to
make other zoning changes that promote equitable development. These zoning changes
should align with the Town’s inclusionary zoning policy and the zoning recommendations of
the Powder Mill Road Corridor Study (conducted with assistance from MAPC at the time of
the HPP update).
Basis for Goal
• 69% of the homes in town are single-family. As with many suburban communities
heavily impacted by single-family zoning, Maynard could increase its supply of small
to mid-sized multifamily housing. This type of housing is sometimes referred to as
“missing middle” housing. Facilitating the development of this housing can result in
homes that are more affordable in the marketplace, often due to smaller size. This is
referred to as naturally-occurring affordable housing (NOAH).
• Maynard’s current stock of rental housing is generally more affordable in the
marketplace compared with other communities. According to online rental listings
gathered by MAPC in 2018, a two-bedroom apartment in Maynard was $1,450, the
lowest cost of all the context communities. However, few of these opportunities exist.
Between 2017 and 2018, there were only 17 two-bedroom apartments listed for
rent, demonstrating the difficulty one would have in finding an apartment in town.
• Since 2015, the median price of a single-family home in Maynard increased by 20%
to a median price of $399,000 in 2019. Maynard condominiums similarly increased
in value by 22% in four years, now at a median price of $305,000.
Goal 5: Build town awareness of housing demand, issues, & activities.
The Town and the HPP working group have each noted the importance of the 2015 HPP in
creating greater awareness and understanding of the town’s housing needs. The Town
should continue this good work and dispel any misconceptions about Affordable Housing
and NOAH to avoid public opposition to housing developments in the future. Engagement
activities should be strategically planned for times when public support is needed before a
zoning change or town meeting vote.
Basis for Goal
• Members of the public commented that a better understanding of housing terms was
helpful to understanding the town’s housing needs and the actions that need to be
taken to address them. It was also suggested that new terms which speak to specific
housing issues are needed to overcome negative perceptions of Affordable Housing.
• The Town will need public support to accomplish several of the recommendations of
this plan, including an update to the Town’s inclusionary zoning bylaws and other
zoning changes. The Town will need both internal and external funding to address
local housing need and prioritize public assets such as land owned by the Town to
produce additional housing options that more residents can access.
Maynard HPP Update 2021 65
• Additional public outreach will be necessary to promote new programs as the Town
implements recommendations such as establishing a first-time home buying program
and connecting seniors to housing resources.
2021 HPP Goals
Goal 1: Preserve and advance housing affordability for all incomes and ages to reduce the
number of local cost-burdened households.
Goal 2: Create diverse housing opportunities to support the Town’s culture and vibrancy.
Goal 3: Advance racial equity by ensuring equal access to housing opportunities for people
of color.
Goal 4: Adopt local zoning changes to allow for housing choices & flexible approaches to
achieve housing affordability.
Goal 5: Build town awareness of housing demand, issues, & activities
PRIORITY POLICY STRATEGIES
To build on the foundation of the 2015 HPP and to establish strategies that can advance the
Town’s good work and increased capacity, this update recommends nine priority strategies
that will have the greatest impact. The priority strategies have been organized so that they
correspond to one or more goals, an update from the 2015 HPP.
The project team presented the draft priority strategies at the second public forum on June
23, 2021 and gathered input on the proposed recommendations via Zoom breakout rooms.
Generally, public input showed support for the recommended priority strategies and none
were opposed. The HPP update priority strategies are described below with corresponding
action steps the Town can take to implement them. Further guidance for implementation is
described in the chart on Page 68. This chart also shows how the priority strategies relate to
each of the HPP goals.
1. Explore Updates to the Inclusionary Zoning Bylaw
Use the updated housing needs assessment and additional technical analysis to explore
potential updates to the inclusionary zoning bylaw so it results in the creation of more
deeply Affordable Housing units. The Town should consider hiring a consultant to explore
possible updates based on local market data and development financing to ensure
potential updates do not inadvertently deter new development.

Maynard HPP Update 2021 66
Action Steps
a. Evaluate the impact of the existing inclusionary zoning policy on new development in
Maynard by interviewing developers that have met inclusionary requirements.
Engage these developers and others in the process of updating the policy to gather
input and create buy-in.
b. Utilize the housing needs assessment data from the HPP to identify areas where the
policy can better meet housing needs.
c. Consider additional inclusionary zoning incentives in exchange for more Affordable
Housing units or more deeply affordable units. Incentives should balance
development costs with inclusionary requirements and may include an increased
density bonus, reduction of parking requirements, an expedited permitting process,
and waiving permitting fees.
d. Consider hiring a consultant to study the impacts of policy updates on financial
feasibility and draft changes to the bylaw.
e. Offer public educational opportunities and address any community concerns ahead
of town meeting.
2. Explore Updates to the Accessory Dwelling Unit (ADU) Bylaw
Explore public interest in developing ADUs and ways to improve the flexibility of the
Town’s ADU bylaw to facilitate intergenerational living and reduce local cost burdens.
Action Steps
a. Host public workshops to promote the benefits of ADUs.
b. Distribute a public survey with informational material to better understand local
interest in ADU development and how households would use ADUs.
c. Establish clear goals for the updated ADU bylaw based on public input and data from
the updated HPP housing needs assessment.
d. Use MAPC’s forthcoming living little toolkit to review successful ADU bylaws from
other communities.
e. Consider hiring a consultant to draft the updated ADU bylaw based on all information
gathered to date.

Maynard HPP Update 2021 67
3. Revitalize the Powder Mill Road Corridor
Utilize the development opportunity analysis and zoning analysis to inform the adoption of
zoning changes in the Powder Mill Road Corridor that facilitate mixed-use housing and a
variety of other housing options that help provide greater public access to the Assabet
River, promote walkability, and support economic development.
Action Steps
a. Use the Powder Mill Road Study to evaluate zoning changes along the corridor that
create a better sense of place and prioritize vertical mixed-use housing development,
and implement the other recommendations of this study.
b. Engage with property owners and hold open office hours to learn more about the
goals of property owners in this area and how they align with study recommendations
c. Apply for state grants and use federal funding to improve bike and pedestrian
infrastructure and expand recreational access to the Assabet River.
4. Establish a First-time Homebuyer Program
Establish a first-time homebuyer program that uses local and federal funding to augment
and leverage existing state first-time homebuyer programs.
Action Steps
a. Set aside funding from the American Rescue Plan Act (ARPA) into the Maynard
Affordable Housing Trust (AHT) and obligate these funds for a first-time homebuying
program within the next three years.
b. Establish a long-term funding source for the program and consider dedicating a
portion of town revolving funds.
c. Produce and distribute printed and digital materials to promote existing state
programs that help reduce private mortgage assistance costs and offer down
payment assistance.
Maynard HPP Update 2021 68
5. Support Housing Choice for Seniors
Maximize existing community resources to enable seniors to continue living in the housing
of their choice and provide education about a range of housing options.
Action Steps
a. Incorporate the Town’s partnership with AARP into Town leadership and government.
Work with AARP to host informational events to help seniors make a plan for aging in
place and staying in Maynard.
b. Work with habitat for humanity to assist senior homeowners with making
modifications to their home to help them age in place.
c. Produce and distribute informational materials about accessory dwelling units, home
modification loans, and other ways seniors can downsize and receive support from
family members.
d. Use the HPP to expand the range of housing options that seniors can downsize into
such as condominiums, duplexes, townhouses, accessory dwelling units, and rental
housing units.
6. Expand Sewer and Water Capacity
Identify incoming private development that would be supported by increased sewer and
water capacity and use the HPP update to apply for a MassWorks grant to provide funds
for sewer and other capital infrastructure upgrades.
Action Steps
a. Use the development opportunities analysis to identify a specific private development
that will help meet the town’s housing needs, that requires the support of expanded
water and sewer infrastructure. Include this development as a part of a MassWorks
application.
b. Use the development opportunity analysis and HPP takeaways to communicate to the
state the importance of upgrading the Town’s Water and Sewer Infrastructure overall.
c. When financially feasible, evaluate possibilities to gather developer contributions
that can assist with water and sewer upgrades. Contributions should be directly
related and proportional to new development.

Maynard HPP Update 2021 69
7. Deepen Housing Affordability
Continue to use the Maynard Affordable Housing Trust (AHT) and Community Preservation
Committee funds to deepen the affordability of incoming Affordable Housing units to meet
community needs. Federal dollars from the American Rescue Plan Act (ARPA) can also be
used to supplement incoming Affordable Housing so that it reaches deeper levels of
affordability. When financially feasible, consider using federal, state, and local funds to
acquire housing that is naturally affordable in the marketplace and put deed-restrictions
on these housing units to ensure they remain affordable.
Action Steps
a. Evaluate successes and challenges of the Maynard AHT’s previous efforts to buy-
down Affordable Housing units.
b. Identify other funding sources such as American Rescue Plan Act (ARPA) to
supplement incoming Affordable Housing.
c. Consider the extent that supplemental funds can be used to deepen the affordability
of Affordable Housing created through inclusionary zoning when updating this bylaw
(see priority strategy 1).
8. Long-term Rental Assistance
Assess the existing local emergency rental assistance program with the goal of
establishing a permanent program offering broader assistance based on changing
demand. Funding should be flexible and easy for the Town and Affordable Housing Trust
(AHT) to access as needs arise.
Action Steps
a. Review documentation of households that have utilized the Town’s emergency rental
assistance program. Reach out to these households to see if they need continued
assistance. Households may not of used this program because of the state or federal
eviction moratorium but may be in need after these moratoriums expire.
b. Obligate American Rescue Plan Act (ARPA) funds to finance this program in the next
three years.
c. Identify a long-term funding source for the program and consider dedicating a portion
of town revolving funds.
Maynard HPP Update 2021 70
9. Research Ways to Set Limitations on Condominium Conversions
Explore ways to set reasonable limitations on the number of rental housing units that can
be converted to condominiums.
Action Steps
a. Consider asking Town counsel to review M.G.L. Ch. 527. An Act Enabling Cities and
Towns to Regulate the Conversion of Residential Property to the Condominium Forms
of Ownership and relevant amended state legislation.
b. Review recent condominium conversion policies by other municipalities such as the
City of Somerville’s condominium conversion ordinance, enacted in 2019, to identify
emerging trends and best practices. Somerville’s policy established a board of
community members to oversee and permit conversions based on specific
circumstances.
10. Create Artist Lofts
Create artist lofts, sometimes referred to as live-work spaces, that provide low-cost
housing and venues to musicians, craftspeople, performers, and other artists to facilitate
cultural activities and events in the downtown and nearby areas.
Action Steps
a. Establish an overlay district to allow artist lofts in the downtown and throughout
areas of Maynard where live-work spaces and artist venues can further enhance the
town’s culture. The overlay district should provide flexible regulations that encourage
the development of artist lofts in these areas.
b. Consider ways to incentivize the creation of artist lofts when updating the Town’s
inclusionary zoning bylaw. For example, a density bonus allowing for additional
housing units at smaller scales could be provided in exchange for the provision of
shared open spaces that can be used as studios or venues for artists.
Promote the idea of artist lofts to current and future owners of Mill and Main.

Maynard HPP Update 2021 71
Table 3: 2021 HPP Goals and Strategies Implementation Chart
2021 HPP Goals and Priority Policy
Strategies
Implementation Chart
1.
Pro
vid
e H
ou
sin
g f
or
All
Inco
me
s a
nd
Age
s
2. S
up
po
rt t
he
To
wn
Cu
ltu
re
an
d V
ibra
ncy
3
. A
dva
nce
Ra
cia
l E
qu
ity
4. A
do
pt
Fle
xib
le Z
on
ing
regu
lati
on
s
5. B
uild
Aw
are
ne
ss
1
Explore Updates to the Inclusionary Zoning Bylaw
X X X X Timeframe: Near-term
Implementation Lead: Town Staff
Implementation Support: Regional Housing Service
Office (RHSO), Select Board, and Planning Board
2
Explore Updates to the Accessory Dwelling Unit (ADU)
Bylaw
X X X Timeframe: Mid-term
Implementation Lead: Town Staff
Implementation Support: RHSO, Planning Board
3
Revitalize the Powder Mill Road Corridor
X X Timeframe: Long-term
Implementation Lead: Town Staff
Implementation Support: RHSO, Planning Board
4
Establish a First-time Homebuyer Program
X X X X Timeframe: Near-term
Implementation Lead: Affordable Housing Trust (AHT)
Implementation Support: Town Staff, RHSO
5
Support Housing Choice for Seniors
X X Timeframe: Near to mid-term
Implementation Lead: Council on Aging
Implementation Support: Town Staff
6
Expand Sewer and Water Capacity
X Timeframe: Near-term
Implementation Lead: Town Staff
Implementation Support: Maynard DPW
7 Deepen Housing Affordability
X X X Timeframe: Near-term

Maynard HPP Update 2021 72
2021 HPP Goals and Priority Policy
Strategies
Implementation Chart
1.
Pro
vid
e H
ou
sin
g f
or
All
Inco
me
s a
nd
Age
s
2. S
up
po
rt t
he
To
wn
Cu
ltu
re
an
d V
ibra
ncy
3
. A
dva
nce
Ra
cia
l E
qu
ity
4. A
do
pt
Fle
xib
le Z
on
ing
regu
lati
on
s
5. B
uild
Aw
are
ne
ss
Implementation Lead: AHT
Implementation Support: RHSO
8
Long-term Rental Assistance
X X X Timeframe: Near-term
Implementation Lead: AHT
Implementation Support: RHSO
9
Research Ways to Set Limitations on Condominium
Conversions
X X Timeframe: Near-term
Implementation Lead: Town Staff
Implementation Support: RHSO
10
Create Artist Lofts
X X X Timeframe: Near-term
Implementation Lead: AHT
Implementation Support: Town Staff

Maynard HPP Update 2021 73
HPP BEST PRACTICES
The following is a list of regulatory, programming, and funding best practices for housing
that were included based on the 2015 HPP recommendations and analysis and input
gathered during the HPP update. These housing best practices are not recommendations
the Town should focus on implementing in the immediate future, but rather a list of options
the Town might consider as situations and opportunities arise. The list was presented at the
second public forum and received supportive input.
Table 4: 2021 Housing Best Practices
2021 Housing Best Practices
1. P
rovi
de
Ho
usin
g f
or
All
inco
me
s a
nd
Age
s
2. S
up
po
rt t
he
To
wn
Cu
ltu
re a
nd
Vib
ran
cy
3. A
dva
nce
Ra
cia
l E
qu
ity
4. A
do
pt
Fle
xib
le Z
on
ing
regu
lati
on
s
5. B
uild
Aw
are
ne
ss
REGULATORY BEST PRACTICES
1
Streamline local permitting process for Affordable
Housing and accompanying Affordable Housing
requirements.
X X
2
Amend residential zones to incentivize
redevelopment of vacant structures and encourage
development of small, affordable single-family
homes on substandard vacant or underutilized
properties. Consider changes in these zones that
will allow for the creation of more housing options
that have minimal impact on the built environment,
such as accessory dwelling units, duplexes,
triplexes, and single-family to multifamily home
conversions.
X X X X
3
Consider adopting a 40R Mixed Use Overlay District
and/or a 40R Starter Home Overlay District in
areas identified in this plan’s development
opportunity parcel analysis.
X X
4
Allow artist lofts that provide low-cost housing and
venues to musicians, craftspeople, performers, and
other artists to facilitate cultural activities and
events in the downtown and nearby areas.
X X X

Maynard HPP Update 2021 74
2021 Housing Best Practices
1. P
rovi
de
Ho
usin
g f
or
All
inco
me
s a
nd
Age
s
2. S
up
po
rt t
he
To
wn
Cu
ltu
re a
nd
Vib
ran
cy
3. A
dva
nce
Ra
cia
l E
qu
ity
4. A
do
pt
Fle
xib
le Z
on
ing
regu
lati
on
s
5. B
uild
Aw
are
ne
ss
5
Help reduce housing cost burdens incurred by
utility expenses by promoting state energy
efficiency programs such as Mass Save, and
encourage homeowners and multifamily owners to
add energy upgrades such as solar panels and
efficient HVAC systems.
X X X
6
Comply with new TOD MBTA legislation that
requires by-right multifamily zoning near transit
stations.
X X
7
Remove regulatory barriers to creating community
land trusts and limited equity co-ops. Provide
technical assistance and possibly publicly-owned
land to support these initiatives.
X X
PROGRAMMING BEST PRACTICES
8
Continue the Town’s membership in the Regional
Housing Service Office (RHSO) to support the
implementation of this HPP and other housing
needs and initiatives.
X X X
9
Work toward meeting or exceeding the
Commonwealth’s 10% goal on the Subsidized
Housing Inventory.
X
10
Advance projects under the Local Initiative Program
to create housing affordable to low- and moderate-
income households.
X X
11
Engage the local real estate community and
property owners to increase understanding of and
foster development/redevelopment opportunities.
X X
12
Work collaboratively with non-profit housing
developers and other entities to advance housing
production.
X X
13 Monitor and preserve affordability restrictions on
existing units for as long as possible. X
14 Provide incentives to include accessible and
adaptable housing units in new developments. X X

Maynard HPP Update 2021 75
2021 Housing Best Practices
1. P
rovi
de
Ho
usin
g f
or
All
inco
me
s a
nd
Age
s
2. S
up
po
rt t
he
To
wn
Cu
ltu
re a
nd
Vib
ran
cy
3. A
dva
nce
Ra
cia
l E
qu
ity
4. A
do
pt
Fle
xib
le Z
on
ing
regu
lati
on
s
5. B
uild
Aw
are
ne
ss
15
Connect homeowners and renters to energy
efficiency/renewable energy programs and
incentives.
X X X
FUNDING BEST PRACTICES
16
Provide technical assistance and local resources
for tenants that would like pool their resources and
purchase their building.
X X X
17 Adopt the updated HPP to ensure the Town is
eligible for existing and new grant opportunities. X X X X X

Maynard HPP Update 2021 76

Maynard HPP Update 2021 77
APPENDIX A

Maynard HPP Update 2021 78
APPENDIX B