
Maymorn Structure Plan: Infrastructure Costs Estimate · Figure 3: Potential Water Supply...
72
Report Maymorn Structure Plan: Infrastructure Costs Estimate Prepared for Upper Hutt City Council (Client) By Beca Carter Hollings & Ferner Ltd (Beca) 22 June 2010 © Beca 2012 (unless Beca has expressly agreed otherwise with the Client in writing). This report has been prepared by Beca on the specific instructions of our Client. It is solely for our Client’s use for the purpose for which it is intended in accordance with the agreed scope of work. Any use or reliance by any person contrary to the above, to which Beca has not given its prior written consent, is at that person's own risk.
-
Upload
dinhkhuong -
Category
Documents
-
view
216 -
download
0
Transcript of Maymorn Structure Plan: Infrastructure Costs Estimate · Figure 3: Potential Water Supply...

Report
Maymorn Structure Plan: Infrastructure Costs Estimate Prepared for Upper Hutt City Council (Client)
By Beca Carter Hollings & Ferner Ltd (Beca)
22 June 2010
© Beca 2012 (unless Beca has expressly agreed otherwise with the Client in writing).
This report has been prepared by Beca on the specific instructions of our Client. It is solely for our Client’s use for the purpose for which it is intended in accordance with the agreed scope of work. Any use or reliance by any person contrary to the above, to which Beca has not given its prior written consent, is at that person's own risk.

Beca // 22 June 2010
4260341 // NZ1-2964852-14 0.14
Revision History
Revision Nº Prepared By Description Date
A Greg Lee
Document Acceptance
Action Name Signed Date
Prepared by Greg Lee
Reviewed by Lucie Desrosiers
Approved by Greg Pollock
on behalf of Beca Carter Hollings & Ferner Ltd

Maymorn Structure Plan: Infrastructure Costs Estimate
Beca // 22 June 2010 // Page 1
4260341 // NZ1-2964852-14 0.14
Table of Contents 1 Introduction .......................................................................................................... 2
1.1 Limitations.................................................................................................................... 2 2 Method .................................................................................................................. 2 3 Urban Design Concepts Review ......................................................................... 3 4 Infrastructure Development and Triggers .......................................................... 5
4.1 Water Supply and Waste Water .................................................................................. 5 4.2 Road Network .............................................................................................................. 9 4.3 Open Space, Reserves and Public Art ...................................................................... 12
5 Cost Estimates for Proposed Works ................................................................ 12 5.1 Roads ........................................................................................................................ 12 5.2 Water and Waste Water Utilities Infrastructure ......................................................... 13 5.3 Parks, Reserves and Play Grounds .......................................................................... 15 5.4 Summary ................................................................................................................... 18
6 Phasing and Development Cost Model ............................................................ 18 7 Delivery Issues .................................................................................................. 22
7.1 Case Study ................................................................................................................ 22 7.2 Lots and development areas analysis ....................................................................... 22
8 Conclusions ....................................................................................................... 23
Appendices Appendix 1: Road Enhancement Cost Estimate Appendix 2: Staging of Development and Implementation Costs Detail Appendix 3: Proportion of Residential Development per Lot

Maymorn Structure Plan: Infrastructure Costs Estimate
Beca // 22 June 2010 // Page 2
4260341 // NZ1-2964852-14 0.14
1 Introduction
This report provides advice on infrastructure likely to be required in order to support the development of the Maymorn Structure Plan area. This report focuses on the infrastructure that is to be provided by the public sector, identify when it will be required and how much it will cost (indicative and at present day values).
The advice is based on the Maymorn Structure Plan, which provides a framework for development, identifying broad locations for future land uses and infrastructure. It is expected that developers will provide onsite infrastructure, including roads and utilities reticulation, as it traverses their land holdings.
1.1 Limitations
It is understood that this report will be used by the Councils’ financial advisors. Whilst this report provides a breakdown of development triggers and costing, advice is provided on a strategic basis and no detailed design or modelling having been undertaken. Infrastructure triggers and costing may change if the development of the Maymorn Structure Plan is adjusted or is brought about in an different sequence or time frame to that shown in this report.
2 Method
This study followed the steps detailed below:
Develop a GIS based spatial model which breaks down all infrastructure and land to be developed into individual parcels, to allow for scenario testing to improve staging and cash flow forecasts.
Identify trigger points for when upgrades to trunk water supply, trunk waste water, trunk stormwater and roading infrastructure is required, based on the ultimate scale of development envisaged.
Identify interim infrastructure enhancements that could accommodate smaller scales of development if sensible.
Provide a schedule for the delivery of trunk infrastructure enhancements needed relative to development and provide cost estimates (present day values) for its development, including interim enhancements where applicable.
Identify the opportunity to maximise development ahead of infrastructure triggers. Prepare an annualised schedule showing housing development rates, contributions collected
and infrastructure investment required. Provide drawings showing where development and infrastructure enhancement needed are
located. The drawings will identify larger than annualised development areas providing flexibility in terms of how development of individual land areas are brought forward.
Assess the urban design layout, land use mix and density assumptions for the Structure Plan area and reconfigure phases shown in Draft Structure Plan, as appropriate.
Reviewing the planning implications of each decision re staging and the degree of incentive to be provided in terms of increasing density or achieving specific Structure Plan outcomes.
Approximate the costs to service new lots created by estimating development contributions required based on cost estimates to provide infrastructure (stormwater, water supply, waste water and reserves).
Comment on commercial viability based on likely land values (provided by others).

Maymorn Structure Plan: Infrastructure Costs Estimate
Beca // 22 June 2010 // Page 3
4260341 // NZ1-2964852-14 0.14
Undertake a review of urban design concepts for small staged areas (part of the Gabites land area and roading specification) to ensure that these can be self contained while also supporting the long-term vision for Maymorn.
3 Urban Design Concepts Review
A detailed examination of the northern most part of the Gabites land was undertake to ensure efficiency in the use of land, given the site’s location near the train station and proposed neighbourhood centre, and the site’s ability to deliver the vision for Maymorn at an early stage. This assessment provides the basis for the site’s potential development yield.
The review entailed preparing a more detailed layout for the area. As per the Draft Structure Plan, the layout retains the steeper part of the site undeveloped and vegetated (revegetation by native bush should be encouraged) to create a landscape buffer between the flatter lower and upper parts of the site and in doing so, retain a green backdrop for the Mangaroa Valley and the Maymorn area. The review determined that subdivision should include a mix of 400m2 and 800m2 lots with the smaller lots fronting the streets and the larger lots located behind and including more pronounced slopes than the relatively flat smaller lots. The road layout was also extended slightly to achieve more development in the northern corner of the site. The proposed subdivision layout is shown below.
Figure 1: Illustrative Subdivision of the Upper Gabites Area
As part of the urban design review, the road cross-sections were also revisited. Road corridors are proposed to be made slightly narrower than originally shown in the Structure Plan which provides the twin benefits of reducing costs for their construction, and providing designed-in speed

Maymorn Structure Plan: Infrastructure Costs Estimate
Beca // 22 June 2010 // Page 4
4260341 // NZ1-2964852-14 0.14
management measures as narrower carriageways lead to slower speeds and higher pedestrian and cycle safety.
The revised designs for all road types are provided below.
Figure 2: Revised Road Typology
The changes to the road layouts can be summarised as follows:
Primary Main Roads
Reduce carriageway from 9m to 7m Decrease width of cycle path from 4m to 3.5m Overall road corridor reduced from 21m to 18.3m.
Secondary Connector Road
Reduce carriageway from 8m to 6m

Maymorn Structure Plan: Infrastructure Costs Estimate
Beca // 22 June 2010 // Page 5
4260341 // NZ1-2964852-14 0.14
Increase width of footpath (on one side of road) from 2.5m to 3.5m so that can be shared with cyclists
Reduces width of footpath (on other side of road from 2.5m to 1.8m) Retain intermittent on-street parking in 2.5m wide berm, in-between street trees. Parking could
be provided on both sides of the street or alternate side Overall road corridor reduced from 20m to 18.3m.
Tertiary Residential Lanes
Reduce berm from 2.75m to 2.5m Remove verges from both sides of road Reduce footpaths on both sides of road from 2.5m to 1.8m Retain 2.5m wide berm to accommodate intermittent on-street parking in-between street trees Overall road corridor reduced from 18m to 14.1m.
Tertiary Shared Streets*
Increase width of landscaping area from 0.4m to 3m Remove footpaths from both sides of road Maintain width of shared space at 5m as opposed to variation between 3.5m to 5m Overall road corridor reduced from 18.2m to 11m.
*Note the Shared Street concept sits at the bottom of the road hierarchy and is designed to accommodate the least amount of traffic. Shared Streets should be located where they will only be used by people who live on that particular street and are unlikely to accommodate any through vehicular movements due to their location and the provision of more convenient, higher ranking streets nearby.
The Draft Structure Plan erroneously showed a Shared Street next to the neighbourhood centre. Within the neighbourhood centre the road design should incorporate on-street car parking and frequent pedestrian crossings. A Connector Road should be used in lieu of a Shared Street in this location.
4 Infrastructure Development and Triggers
4.1 Water Supply and Waste Water
An indicative wastewater and water supply network for the entire subdivision was prepared on the basis of the Structure Plan and the known location and limitations of existing utilities infrastructure. The design is indicative only as no modelling has been undertaken. Infrastructure has been designed to be laid out along the existing and proposed road network. Specific design assumptions are set out below in respect to each type of infrastructure.
4.1.1 Water Supply
The Structure Plan area is currently served by a water main which runs along Maymorn Road (comprising both a 150mm and a 225mm diameter pipe) and a Parkes Line Road (150mm diameter pipe). A pump station is located on Maymorn Road which boosts pressure. There is limited capacity for additional development to be adequately supplied with water.
A new water reservoir will be needed to serve the ultimate scale of development and located on higher grounds located to north east of the site, north of the railway line. Water would be pumped

Maymorn Structure Plan: Infrastructure Costs Estimate
Beca // 22 June 2010 // Page 6
4260341 // NZ1-2964852-14 0.14
along Maymorn Road via a 150mm diameter pipe to the reservoir. Water supply to new homes (lots) would be from the new reservoir and via a 225mm diameter pipe that runs from the reservoir down to and along Maymorn Road and along Parkes Line. 150mm diameter pipes would run off this network and provide supply to residential streets. A pumped rising main would be needed to supply water to lots located immediately north of the reservoir because that land is at a higher elevation than the reservoir. Figure 3 below shows a proposed layout of the water network.
Figure 3: Potential Water Supply Reticulation Layout
Overall, approximately 19,800 metres of 225mm diameter and 1,000 metres of 225mm diameter pipe are anticipated to be needed in order to serve the whole site. Detailed design would however be required to confirm the design of the water supply network as shown.
Implementation
In order to deliver the above water network system the following is assumed:
New reservoir to be located in northern part of the development, west of the rail way line Existing 225mm pipe along Maymorn Road can be used to supply the network from the reservoir Existing 150mm diameter pipes along Maymorn Road can be used to supply the reservoir Pump station to supply the proposed new reservoir is needed to be upgraded All other pipes shown in the network are new, including new 225mm diameter pipe along Parkes
Line and pumped rising main.

Maymorn Structure Plan: Infrastructure Costs Estimate
Beca // 22 June 2010 // Page 7
4260341 // NZ1-2964852-14 0.14
Triggers
It is assumed that Council would only be responsible for implementing the trunk main and reservoir to supply the development areas. Individual site developers will need to provide local reticulation as part of their development proposals.
Triggers for implementation of the public water supply network are, as follows:
Table 1: Development Triggers for Water Supply Network
Description Specification Development Trigger
1. Piped main network - trunk only (main and connector roads)
Replacement of existing 150mm Φ pipes along Parkes Line
225mm Φ Needed to serve development along Parkes Line Road and east of railway line. Develop as part of Parkes Line Road upgrade works (see section 3.2)
Existing pipes along Maymorn Road assumed to be in place and operational
150mm Φ 225mm Φ
None – pipes already in place.
2. Minor modifications to existing pump station
Needed to serve new reservoir. Estimate work completed by the second year of development
3. Reservoir Additional water capacity needed to serve entire development. Assume commence development in year 0 with reservoir operational in year 2 of development
Water supply to reservoir 150mm Φ Needed as part of reservoir.
Water supply from reservoir 225mm Φ Needed as part of reservoir.
4.1.2 Stormwater
The stormwater system is to be provided as part of the roading network as a kerb and channel system, with pipes located underground. Stormwater will be directed to stormwater detention ponds or swales in order to reduce contaminants from the Maymorn development area and to provide attenuation of storm flows for the discharge to the Mangaroa River so that flows are similar to current conditions.
The size of the detention ponds has not been calculated but it is proposed that all swales and ponds be located within the proposed network of green spaces. It is estimated that up to 5 detention ponds will be required and that these should be provided at intervals in the development process to match the rate of residential development.
4.1.3 Waste Water
The Structure Plan area is connected to the district sewage reticulation system by a 150mm diameter gravity sewer that runs along Parkes Line Road and then to a 225mm diameter sewer along Maymorn Road via a pump station (known as Maymorn Valley Pump Station) located west of the railway line close to the train station. Sewage gravity flows to the Maymorn Plateau Pump Station and then to SH2 Pump Station.
Upgrades to all of the existing pump stations and existing pipe network will be required in order to serve the proposed development. Wastewater west of the railway line will be gravity fed from

Maymorn Structure Plan: Infrastructure Costs Estimate
Beca // 22 June 2010 // Page 8
4260341 // NZ1-2964852-14 0.14
individual lots via a 150mm diameter piped network which will connect to a new 300mm diameter pipe along Maymorn Road. Wastewater will be gravity fed to the upgraded Plateau Pump Station and then to SH2 Pump Station.
Wastewater east of the railway line will be gravity fed from lots via 150mm diameter pipes to a 225mm diameter pipe along Parkes Line Road. This will feed into the Maymorn Valley Pump Station located north of the railway line (it will cross the railway line at the proposed pedestrian underpass). Wastewater will then be pumped into the Maymorn Road gravity main comprising a 300mm diameter pipe.
It is noted that an upgrade to the Sewage Treatment Works that serves Upper Hutt will in time be needed. This upgrade is needed to support development in the district and not just development proposed at Maymorn. Consequently, for the purpose of this report, no assessment has been made in this regard. Figure 4 below shows a proposed layout of the waste water network.
Figure 4: Potential Waste Water Reticulation Layout
Implementation
In order to deliver the above waste water network the following is assumed:
All pump stations will need to be upgraded All existing main pipes will need to be upgraded 150mm diameter rising main needed between Valley Pump Station and Maymorn Road gravity
main 225mm diameter pipes needed along Parkes Line Road 300mm diameter pipes needed along Maymorn Road 150mm diameter pipes needed along all other roads.

Maymorn Structure Plan: Infrastructure Costs Estimate
Beca // 22 June 2010 // Page 9
4260341 // NZ1-2964852-14 0.14
Triggers
It is assumed that Council would only be responsible for development of the trunk main (along Parkes Line and Maymorn Road), upgrades to pump stations and provision of the rising main. Individual site developers will need to provide the local waste water reticulation network as part of their development proposals.
Triggers for implementation of the public water supply network are, as follows:
Table 2: Development Triggers for Waste Water Network
Description Specification
Development Trigger
Piped main network - trunk only (along main roads)
Replacement of existing gravity pipes along Parkes Line
225mm Φ Required when development commences east of railway line relative to Parkes Line Road.
Replacement of existing gravity pipes along Maymorn Road
300mm Φ Upgrade required when approximately 1,250 dwellings have been developed.
Installation of new rising main 150mm Φ Linked to upgrade of Maymorn Valley Pump Station.
Upgrades to pump stations
Plateau Pump Station - Needed to be upgraded in year 1.
Maymorn Valley Pump Station - Needed in order to serve development along Parks Line Rd (east of railway). Capacity for approximately 500 dwellings.
SH2 Pump Station - Sufficient capacity for 1,000 dwellings.
4.2 Road Network
In order to serve the Maymorn Structure Plan area, upgrades are needed to the roading connections to the strategic road network. In addition the existing road network within the Structure Plan area will also need to be enhanced. Anticipated works are described below.
4.2.1 Connections to the Strategic Road Network
A transport model will need to be used to confirm the location and nature of roading enhancements needed. The scale of upgrade works to the Plateau Road junction with SH2 will need to be agreed with NZTA.
The following road improvements are anticipated to be required:
Parkes Line Road and Mangaroa Hill Road to the Mangaroa Bridge – the road outside the Structure Plan area will need to be widened in order to accommodate expected levels of traffic. The roads are proposed to be enhanced as follows: – 7 metre carriageway. – Place stormwater pipe in ditch along length of road and fill as needed. Build 2.5 meter wide
cycleway (gravel finish) above. Mangaroa Bridge – widen to provide a 7 metre carriageway.

Maymorn Structure Plan: Infrastructure Costs Estimate
Beca // 22 June 2010 // Page 10
4260341 // NZ1-2964852-14 0.14
Maymorn Road and Plateau Road– Within the Structure Plan area Maymorn Road needs to be upgraded by providing pedestrian footpaths only. The road between the edge of the Structure Plan area the junction of Plateau Road with SH2 is assumed to be suitable, ie 7 metre carriageway.
SH2 junction – it is assumed that additional safety and capacity is need to be provided at the junction of Plateau Road with SH2. These are likely to entail a seagull junction providing right turn off and right turn on to SH2.
4.2.2 Connections within Maymorn Structure Plan Area
A network of roads is shown in the Structure Plan and is assumed to be provided as follows:
Parkes Line Road and Maymorn Road to be upgraded to become Primary Main Roads with the following specification: – Kerb and channel – Trees located on each side every 15 to 32.5 metres – No on-street parking – 7 metre carriageway with centre line – 3.5 metre pedestrian and cycleway on one side and 1.8 metre pedestrian path on other side.
Bitumen finish – 1 metre grass verge either side – Street lighting
Secondary Connector Roads which provide main circulation within the urban areas and connections to the Primary Roads: – Kerb and channel – Trees located on each side at 32.5 metre centres – On-street parking both side and in blocks of 5 spaces (30 metres) separated by build outs
2.5 metre x 2.5 metre which accommodate trees. – 6 metre carriageway with centre line – 3.5 metre pedestrian and cycleway on one side and 1.8 metre pedestrian path on other side.
Bitumen finish – 1 metre grass verge either side – Street lighting
Tertiary Residential Lanes which provide local access: – Kerb and channel – Trees located on each side at 32.5 metre centres – On-street parking both side and in blocks of 5 spaces (30 metres) separated by build outs
2.5 metre x 2.5 metre which accommodate trees. – 5.5 metre carriageway with centre line – 1.8 metre pedestrian footpath on both sides of road. Bitumen finish. – Street lighting
Shared Street to provided in discrete locations where pedestrian friendly, low speed environments are desirable: – On-street parking on one side in blocks of five spaces (30 metres) separated by trees and
swale – 5 metre carriageway – 3 metre landscaped swale

Maymorn Structure Plan: Infrastructure Costs Estimate
Beca // 22 June 2010 // Page 11
4260341 // NZ1-2964852-14 0.14
– Streetlighting Pedestrian connection under railway line to train station Road connection under railway line Maymorn Road and Parkes Line junction improvements (underpass improvements).
Triggers
It is assumed that Council would only be responsible for development of the main roads and upgrading connections to the strategic road network. Individual site developers will need to provide the local (secondary and tertiary) roads (connector roads, residential lanes and shared surfaces).
Triggers for implementation of the public component of the transport network are, as follows:
Table 3: Development Triggers for Transport Infrastructure Network
Roading/Rail Development Trigger
Parkes Line from McLaren to Mangaroa Bridge (outside of Structure Plan area)
In place by 1,100 dwellings. Upgrade could be undertaken as part of programme of works to upgrade of Parkes Line Road within the Structure Plan area.
Mangaroa Bridge Linked to upgrade of Parkes Line Road from McLaren. Upgrade needed by 850 dwellings in place.
SH2/Plateau Road intersection upgrade
Estimating as being 800 dwellings (not possible to check with NZTA at this time).
Maymorn Rd upgrade to Maymorn Station (within Structure Plan area but also beyond)
Delivered by time 500 dwellings constructed.
Parkes Line Road within Structure Plan area
In place by 1,100 dwellings. Upgrade work could be linked on a pro rata basis to urban development east of railway line.
New pedestrian footpath along Maymorn Road from northern edge of development to train station
Develop as part of Maymorn Road upgrade (trigger is 500 dwellings).
Upgrade of the existing road underpass (under rail track)
Not needed from a traffic perspective so long as pedestrian access to station is provided elsewhere. Assume provided as part of Parkes Line upgrade programme but before development occurs east of rail way line, ie at approximately 1,000 dwellings.
New pedestrian underpass (under track)
Not required from a traffic perspective, but provides for better community and urban design outcomes. Trigger to be development east of railway line to provide safe pedestrian connection if existing underpass has not been enhanced (see above).
New road underpass (under track) Not required from a traffic perspective but provides better connectivity and, hence, better urban design outcome. Trigger and could be when adjacent urban areas west and east of railway are developed.
Railway Station upgrade and access works
Not required from a traffic perspective. Should be brought forward as part of adjacent urban development.
Park & Ride car parking area Not required from a traffic perspective. Should be brought forward as part of adjacent urban development.
Upgrade at McLaren St - flood protection works
Not required from a traffic perspective. Brought forward as part of urban development at south eastern edge of Structure Plan area.

Maymorn Structure Plan: Infrastructure Costs Estimate
Beca // 22 June 2010 // Page 12
4260341 // NZ1-2964852-14 0.14
4.3 Open Space, Reserves and Public Art
Open spaces and reserves will comprise the retention of existing riparian areas, provision of open space areas for informal recreation and children’s playgrounds. Some parts of the existing riparian areas may be enhanced through planting and provision of walkways. The playgrounds will be co-located with open spaces for informal recreation and are shown in the Structure Plan.
Triggers
There are no firm standards as to when public open space needs to be provided. However, in order to provide a range of facilities that can meet the demands of a growing community and to establish robust patterns of land use and social networking, it is propose that active recreation areas are provided earlier rather than later. Therefore, it is proposed that children’s playgrounds and associated public open spaces are implemented in tandem with the development of the adjacent residential land.
However the acquisition and enhancement of riparian areas along the Mangaora River and its main tributaries are proposed to be delayed towards the end of the Structure Plan implementation period. In this way the community could be involved in the design and layout of these areas, thus enhancing the sense of custodianship by the community.
5 Cost Estimates for Proposed Works
In order to develop cost estimates, infrastructure lengths were measured using GIS. Whilst the lengths of infrastructure are measured accurately, some variation might occur when detailed site subdivision layouts are produced, taking into consideration the detailed topography and exact alignment of resultant lots.
5.1 Roads
Cost rates for infrastructure were developed for roads on the basis of the design specification provided in section 3 and assuming that street lighting and stormwater services are provided at the same time. These workings, prepared by our quantity surveying team, are provided at Appendix 1 and can be summarised, as follows:
Table 4: Cost per Linear Metre of Road Main Road Connector
Road Residential Lane
Shared Street
Parkes Line to Mangaroa Bridge
Maymorn Footpath upgrade
Road construction $2,800 $3,100 $2,100 $1,700 $2,300 $380
Stormwater (component)* $2,200 $1,200 $700 $650 $2,200 n/a
Total $5,000 $4,300 $2,800 $2,350 $4,500 $380 * costs for stormwater assume constructed at same time as the road.
As indicated above it is assumed that individual developers will provide internal roads (connector roads, residential lanes and shared streets) as part of their site development, ie a condition of any land development will be that roads (and utilities) are provided in accordance with the Structure Plan. The Council will be responsible for improving Maymorn Road and Parkes Line Road within the study area and for implementing identified improvements to the wider network.

Maymorn Structure Plan: Infrastructure Costs Estimate
Beca // 22 June 2010 // Page 13
4260341 // NZ1-2964852-14 0.14
Therefore, the costs associated with public road enhancement and related works are estimated, as follows:
Table 5: Cost Estimates for Roads (assumes that no land is needed to be acquired)
Road Enhancement Units Cost per unit Costs
Primary / main roads
Plateau Rd / Maymorn Rd upgrade between SH2 and Maymorn Station
1,266m $5,000 $6,368,000
Parkes Line to McLaren 531m $4,500 $2,391,795
New pedestrian footpath along Maymorn Road 100m $380 $38,000
Parkes Line Road through to Mangaroa Bridge (assume Mangaroa Hill Road excluded)
2,580m $2,300 $5,934,000
Streetscape associated with Neighbourhood centre
200m $3,925 $785,000
SH2 / Maymorn road intersection upgrade (assumed that a seagull type junction improvement needed)*
1 $1,500,000* $1,500,000*
Mangaroa Bridge upgrade* 1 $2,000,000* $2,000,000*
Upgrade of existing road underpass (under track) 1 $1,500,000* $1,500,000*
New road underpass (under track)* 1 $1,500,000* $1,500,000*
New pedestrian underpass (under track)* 1 $600,000* $600,000*
Railway Station upgrade and access works* 1 $150,000* $150,000*
Park & Ride carparking area** 3700m2 $60* $222,000*
Upgrade at McLaren St - flood protection works* 1 $800,000* $800,000* * costs estimates for major works are based on experience of projects undertaken of a similar nature. No allowance is provided for land acquisition. Providing more reliable estimates will require preliminary design work and discussions with relevant stakeholders. ** area allocated for car parking is as shown on the Structure Plan and costs shown allow for space for accommodate approximately 150 car parking spaces.
Total costs for road enhancements is estimated to be approximately $22.9 million (including stormwater and flood protection works).
5.2 Water and Waste Water Utilities Infrastructure
The following rates have been provided by Upper Hutt City Council in respect of costs rates for utilities pipes. The costs associated with reservoir construction, pump stations and rising main are based on recently completed project work by Beca. The costs associated with detention ponds are based on costs of development of a detention pond at Aotea, Porirua and in Manukau. The costs of detention ponds depend on their size and on site conditions including topography.

Maymorn Structure Plan: Infrastructure Costs Estimate
Beca // 22 June 2010 // Page 14
4260341 // NZ1-2964852-14 0.14
Table 6: Cost per Linear Metre of Water and Waste Water Utilities
Infrastructure Type Specification Cost
Water
Piped main network - trunk only (main and connector roads)
Replacement of existing pipes 150mm Φ $360 per metre
Replacement of existing pipes 225mm Φ $460 per metre
Installation of new pipes 150mm Φ $360 per metre
Water supply from reservoir 225mm Φ $460 per metre
Water supply to reservoir 150mm Φ $360 per metre
Minor modifications to existing pump station - $100,000
Reservoir (x1) 2,200m3 $1,430,00
Water booster pump station (x1) - $250,000
Wastewater
Piped main network - trunk only (main and connector roads)
a Replacement of existing gravity pipes 225mm Φ $730 per metre
Replacement of existing gravity pipes 300mm Φ $890 per metre
b Installation of new gravity pipes 150mm Φ $600 per metre
c Installation of new rising main 150mm Φ $600 per metre
Upgrades to pump stations (x1) $250,000
Stormwater*
Detention Pond (x1) $600,000 * reticulation network costs contained in road network upgrade and development costs.
As indicated above it is assumed that individual developers will provide utilities within individual lot areas (along internal roads comprising connector roads, residential lanes and shared streets) as part of their site development, ie a condition of any land development will be that utilities are provided in accordance with the Structure Plan. Utilities required to service individual development will be provided by the developer. The Council will be responsible for providing trunk mains which are largely along Maymorn Road and Parkes Line Road, but also include water reservoirs, pump stations and waste water rising main.

Maymorn Structure Plan: Infrastructure Costs Estimate
Beca // 22 June 2010 // Page 15
4260341 // NZ1-2964852-14 0.14
Therefore, the costs associated with water and waste water utilities is estimated, as follows:
Table 7: Cost Estimates for Water and Waste Water Utilities
Specification Units Cost per unit
Cost
Water
Piped main network - trunk only (main and connector roads)
a Installation of new pipes
Water supply from reservoir 225mm Φ 325m $460 $149,500
Water supply to reservoir 150mm Φ 325m $360 $117,000
Minor modifications to existing pump station
1 $100,000 $100,000
Reservoir 2,200m3 - $1,430,000
Wastewater
Piped main network - trunk only (main and connector road)
a Replacement of existing gravity pipes
225mm Φ 929m $730 $678,170
300mm Φ 1580m $890 $1,406,200
c Installation of new rising main 150mm Φ 283m $600 $169,800
Upgrades to pump stations x3 $250,000 $750,000
Stormwater*
Detention Pond x5 $600,000 $3,000,000 * reticulation network costs contained in road network upgrade and development costs.
Overall, costs for all water, waste water and the detention ponds component of the stormwater utilities infrastructure is estimated to be $7.8 million. Note stormwater reticulation system has been costed as part of the road network.
5.3 Parks, Reserves and Play Grounds
The Structure Plan proposes that open space be provided in the form of reserves, parks and play grounds. These are to be used as community facilities and as such they are an important component of the Maymorn Structure Plan.
Steep land located in the north (part of the Gabites block) comprises a large area of regenerating bush and is not intended to be for public use. It is instead proposed to be retained to play a key role in the integration of new land uses into the landscape. Subdivision of this land should only be allowed with suitable provisions for its long term protection from development ie any dwelling should be located outside of the protected area which could form part of the dwelling curtillage and be part of the private land titles. This could be achieved by means of covenant on the area to be protected from development.
Thus, the total amount public open space that is proposed to be provided is 34.29ha as shown on drawing contained in the SP (estimate provided below). The table below provides cost rates and total cost for upgrading and enhancing undeveloped areas to provide reserves, playgrounds, footpaths and public artworks.

Maymorn Structure Plan: Infrastructure Costs Estimate
Beca // 22 June 2010 // Page 16
4260341 // NZ1-2964852-14 0.14
Table 8: Estimated Costs to Create Parks and Reserves
Open Space Units Cost per Unit Cost
Reserves (general)* 193,852m2 $30 $5,815,568
Riparian revegetation 100,000m2 $10 $1,000,000
Neighbourhood Playground 1 $350,000 $350,000
Pocket park Playground 2 $80,000 $160,000
Pathway along historic railway alignment 1,600m (length) $45 $72,000
Public Artworks* 1 $100,000 $100,000
Total $7.5m
* assumes significant proportion of floodplain area is upgraded, but not. Notably only 1/3 of land adjacent to Mangora River is upgraded.
The above costs are based on previous project experience, and using typical examples to form a m2 rate that could then be applied across the Maymorn area, taking into consideration, the following:
Reserves (General) A typical 10,000m2 reserve project was analysed / broken down to amount of site preparation,
pathways, planting, grassing, lighting, etc., Thus, in terms of works, site was developed in the following approximate proportions: 13% shrub and groundcover planting; 79% open grass area with trees; and, 8% paved areas comprising paths, etc. Total cost for this type of project is $300,000 which equates to a $30 per m2. Note this allows for a fairly complete redevelopment of identified reserve areas. Therefore, it could be argued that the existing rural areas within Maymorn already provides significant amenity and therefore less expenditure is required with change and modifications occurring in focussed nodes and the existing rural pasture land left as is / or with minimal additional work required, eg additional tree planting, pathway through existing pasture grassland. Exclusions on the cost schedule do not for allow for formation of sportsfields, hardcourts, etc (active recreation facilities).
Riparian Revegetation Allow for native revegetation of riparian corridor strips. The cost rate is based on native
revegetation costs, plant supply and install costs.
Neighbourhood Playground Creation of a 'destination' playground in the area. Lump sum based on previous project
experience – eg Wanaka Roys Bay playground. Sum allows for playground items (including 1-2 larger iconic items, eg ‘space-net’ plus associated seating, paving, soft-fall and planting.
Pocket Park Playground Small playgrounds to service surrounding residential area. Lump sum based on providing a
small number of playground items and associated seating, paving, soft-fall and planting.
Pathway Along Historic Railway Alignment Supply and install of a 2m wide gravel path.

Maymorn Structure Plan: Infrastructure Costs Estimate
Beca // 22 June 2010 // Page 17
4260341 // NZ1-2964852-14 0.14
Public Artworks Lump sum for several artworks to allow for commissioning, design and installation. May need to
be supplemented by other art funding.
Open space will need to be acquired (or in lieu of development contributions) and the value of land has been estimated based on the value of adjacent land following adoption of the Structure Plan into the District Plan (by means of plan change or otherwise), as follows:
Table 9: Estimated Costs to Acquire Land Needed to Parks and Reserves
Location by Stage
Value per hectare***
Density of adjacent land* (area in hectares)
Acquisition cost estimate
26dph 20dph 10dph 4dph Flood plain/ river
$1,666,500 $1,562,500 $843,750 $380,000 $35,000
1 1.34 $2,233,110
2 0.42 $656,250
6 1.01 $1,683,165
Between 6,7,13
0.4 0.4 0.72** $843,800
Between 9,10
West of Parkes Line Road 0.1 0.1 0.2** $329,900
East of Parkes Line Road 0.1 2.1 0 2.1** $3,521,400
Between 11, 10, 14
West of Parkes Line Road 0.1 0.1 1** $229,250
East of Parkes Line Road 1.25 1.05 0.1 2.4** $2,961,063
Between 12,13
All land adjacent to River 17.7 $619,500
Pathway along historic railway alignment
1.6 $608,000
Total Hectares 2.95 3.97 1.05 2.2 24.12 34.29
Acquisition costs $4,916,175 $6,203,125 $885,938 $836,000 $57,888 $13,685,438
* assumes land is split evenly between where open space located between 2 density types
** assumes that half of land located between proposed urban areas is undevelopable because comprises riparian environment and flood plain.
*** Land value based on following assumptions: Density of between 20 and 26 dwellings per hectare (DPH): 50% of serviced land value; 10dph: 45% of service land value; 4dph: 40% of serviced land value where values are sourced from Colin Jenkins (correspondence dated 6 April 2010 and 19 June 2009). Percentages based on assumption that average cost of creating a service lot is $40k and developer profit equals 20%.
The total amount of investment anticipated to be required to enhance open space is approximately $7.5 million + land acquisition costs of $13.7 million, equals $21.2 million.

Maymorn Structure Plan: Infrastructure Costs Estimate
Beca // 22 June 2010 // Page 18
4260341 // NZ1-2964852-14 0.14
5.4 Summary
The above sections summarise costs associated with providing roading, water supply, stormwater and foul water utilities needed to serve the entire Maymorn Structure Plan development. Excluding costs associated with individual land development where it is assumed that infrastructure needed to service individual land development parcels (and lots) will be provided by developers, the total outlay by the public is estimated as follows:
Road enhancements and upgrades: $22.9 million* Water and foul water: $7.8 million Open space, reserves and parks: $21.2 million TOTAL $51.9 million (note due to rounding does not add up
to above) * includes stormwater
Thus overall costs are approximately $51.9 million. The total cost of infrastructure provides a robust basis for establishment of a development contribution levy for the Maymorn Structure Plan area, ie the development pays for the infrastructure needed. It is assumed that the Structure Plan area could achieve 1,717 dwellings and therefore the development contribution on a per dwelling basis is $30,227 per dwelling. Parks and reserves land acquisition equates to 26% of the total development contribution payable.
It is noted that the Council’s current contribution levies are provided on an area by area basis. Whilst capital works equate to between $2,000 and $50,000 per additional lot created, levies are in some areas heavily subsidised and so range between $2,000 and $19,300, (LTCCP 2009 - 2019). The Maymorn Structure Plan area would be the second highest development contribution rate on a per dwelling basis.
6 Phasing and Development Cost Model
The above section identifies the infrastructure that is anticipated to be needed to support the Maymorn Structure Plan development and its staging. The development triggers provided show when infrastructure can be phased to occur relative to completion of new homes. This section shows how year by year costs of development could be matched by development contributions based on an even rate of development and a progressive sequence. This provides a basis for managing the development so it occurs in serviced areas only rather than across the entire Structure Plan area.
The following sequence of phasing was chosen with land areas brought forward for development programmed to achieve an even rate over time. This means that as one development area is being completed the next one begins.

Maymorn Structure Plan: Infrastructure Costs Estimate
Beca // 22 June 2010 // Page 19
4260341 // NZ1-2964852-14 0.14
Figure 5: Proposed Staging Plan
Below is a summary of infrastructure provided per stage:
Stage Infrastructure
Stage 1 Reservoir (including connections and pump station)
Upgrade Waste water pump station
Reserve
Stage 2 Detention pond No 1
Reserve and pocket playground
Stage 3
Stage 4 Maymorn Road upgrade to SH2
Stage 5 Reserves
Stage 6 Railway station upgrade and park and ride
Detention pond No 2
Neighbourhood playground
Stage 7 SH2 / Plateau Road upgrade
Stage 8 Mangaroa Bridge Upgrade
Parkes Line Road (within Structure Plan)
Upgrade existing road underpass (under track)
Stage 9 Parkes Line Road from McLaren to Mangaroa Bridge

Maymorn Structure Plan: Infrastructure Costs Estimate
Beca // 22 June 2010 // Page 20
4260341 // NZ1-2964852-14 0.14
Stage Infrastructure
Detention Pond No 3
Replace wastewater gravity pipes 225mm
Upgrade Waste water pump station x2
Install new rising main
New pedestrian underpass (under track)
Replace wastewater gravity pipes 300mm
Stage 10 New pedestrian underpass
Reserves
Stage 11 Reserves and pocket playground
Detention Pond No 4
Stage 12 Reserves
Stage 13 Reserves
Detention Pond No 5
Stage 14 Riparian planting
Pathway along historic railway alignment
Public artworks
Flood protection at McLaren
New road underpass (under track)
Development scenarios were developed on the basis of 50 and 75 dwellings per annum and infrastructure introduced to match that development. This approach means that development contributions collected can be compared with public sector investment (in infrastructure) in order to establish the likely extent for a public sector loan.
The tables provided in Appendix 2 provide details of phasing of development and delivery of infrastructure. Infrastructure is proposed to be provided ‘just in time’ as opposed to in advance of being required. This means that development needs to be managed and monitored to ensure that infrastructure is planned for and provided when it is needed to service the level of development. It also means that development contributions are being collected in advance of public sector investment as much as is practicable. This reduces the level of council borrowing and minimises risk.
The graph below shows council spend against development contributions collected (in present day values and not allowing for any costs of borrowing).

Maymorn Structure Plan: Infrastructure Costs Estimate
Beca // 22 June 2010 // Page 21
4260341 // NZ1-2964852-14 0.14
Figure 6: Development Contributions Compared with Public Sector Investment (50 dwellings per annum) (present day values and with no consideration of loan
costs)
-$10,000,000
$0
$10,000,000
$20,000,000
$30,000,000
$40,000,000
$50,000,000
$60,000,000
1 2 3 4 5 6 7 8 9 10 11 12 13 14 15 16 17 18 19 20 21 22 23 24 25 26 27 28 29 30 31 32 33 34 35 36
Years
Running total implementation costs Development contributions accumulation Surplus / Deficit
Figure 7: Development Contributions Compared with Public Sector Investment (75 dwellings
per annum) (present day values and with no consideration of loan costs)
-$10,000,000
$0
$10,000,000
$20,000,000
$30,000,000
$40,000,000
$50,000,000
$60,000,000
1 2 3 4 5 6 7 8 9 10 11 12 13 14 15 16 17 18 19 20 21 22 23 24 25 26
Years
Running Total Public implementation costs Development contributions accumulation Surplus / Deficit
The above graphs show that assuming an even rate of development, sufficient development contributions are generally able to be collected in advance of infrastructure investment. In general the slower the development rate the greater is council’s financial exposure. This can be reduced by

Maymorn Structure Plan: Infrastructure Costs Estimate
Beca // 22 June 2010 // Page 22
4260341 // NZ1-2964852-14 0.14
managing development so that there is an acceleration in applications (and contributions collected) over periods when large investment is required.
The charts show public investment exceeds contribution in one instance in both scenarios shown above, by between $17k (75dph scenario) and $300k (50dph scenario). This debt is best managed by ensuring high rates of ‘lot’ development around periods of high expenditure by Council, i.e. the faster the rate of development the less that Council is exposed to debt.
Overall, the graphs show that in general terms council investment can be balanced against development contributions accumulated.
7 Delivery Issues
The above sections have focussed on public sector costs and the degree to which the public sector is likely to become exposed financially. This section examines the commercial viability for developers given likely overall development costs.
7.1 Case Study
The table below is a case study of stages 1 and 2 only, and shows likely development costs (associated with providing roads and utilities) plus development contribution and compares this with land value.
Total infrastructure costs $18,984,202
Total development contribution (293 dwellings) $8,780,425
Land value $31,856,210*
Difference between improvement costs and land value $4,091,583
* Land values provided by Colin Jenkins (correspondence dated 6 April 2010 and 19 June 2009)
The above table shows that the capital investment required to enable the development equates to a land value uplift of $4m. Not all of this figure will constitute profit because no allowance has been made in our calculation for financing, professional fees or holding costs.
Based on a rule of thumb, the creation of dwellings would appear to be viable as the value of the home created will be roughly twice construction cost.
The table above would indicate that the development contribution can be afforded by the land developer who creates the lots. However, given that the level of development contribution suggested is relatively high for the district this may require further consideration. Council could consider either subsidising the infrastructure or reducing costs further, for example through a reduction of the amount of public open space and equivalent increase in development area in the Structure Plan area. There may also be opportunities for reserve land to be vested in lieu of payment. This report has not considered the implication of either approaches.
7.2 Lots and Development Areas Analysis
The table provided in Appendix 3 compares land development (as shown in the Structure Plan) against Certificate of Title in order to identify whether any lots have a high proportion of non-commercial development.

Maymorn Structure Plan: Infrastructure Costs Estimate
Beca // 22 June 2010 // Page 23
4260341 // NZ1-2964852-14 0.14
The table shows that most lots have in excess of 80% of their area used for residential land use and hence individual lot deliverability issues are unlikely to arise. There are approximately 13 lots which have less than 50% of their land allocated for residential development as indicated in the current Structure Plan. These lots will need to be considered as part of detailed site design and staging process and monies allowed for acquisition (of reserves) to enable land development to occur. Where a very high proportion (or all) of a site is allocated for reserve then Council may want to consider site acquisition earlier.
8 Conclusions
The triggers provided in this report comprise a mixture of (i) essential infrastructure that must be provided in order to properly service the development’ and, (ii) non-essential infrastructure that is nevertheless needed to support the creation of a sustainable community. The staging of the latter form of infrastructure affords some flexibility. The staging advice provided in this report has assumed that essential infrastructure is provided when required (‘just-in-time’) and has delayed other non time critical items.
On this basis this report has shown that it is possible to phase infrastructure provision so that Council’s exposure to borrowing can be minimised. The Councils exposure to debt risk can be reduced by increasing the rate of development during periods when public sector investment is high.
Based on land value assumptions and given servicing and development contribution costs the increase in land value following subdivision results in some degree of profit (approximately 15%). Development contributions (approximately $30k) equate to some 30% of total costs and of that, land acquisition costs for reserves and open space is 25%. Thus, a more detailed assessment of commercial viability may be required. This may lead to some refinement of parts of the Structure Plan to, for example, reduce the area of proposed reserves in order to reduce development contributions and hence ensure commercial viability for individual lots.

Report
Maymorn Structure Plan: Infrastructure Costs Estimate Prepared for Upper Hutt City Council (Client)
By Beca Carter Hollings & Ferner Ltd (Beca)
22 June 2010
© Beca 2010 (unless Beca has expressly agreed otherwise with the Client in writing).
This report has been prepared by Beca on the specific instructions of our Client. It is solely for our Client’s use for the purpose for which it is intended in accordance with the agreed scope of work. Any use or reliance by any person contrary to the above, to which Beca has not given its prior written consent, is at that person's own risk.

Beca // 22 June 2010
4260341 // NZ1-2964852-12 0.12
Revision History
Revision Nº Prepared By Description Date
A Greg Lee
Document Acceptance
Action Name Signed Date
Prepared by Greg Lee
Reviewed by Lucie Desrosiers
Approved by Greg Pollock
on behalf of Beca Carter Hollings & Ferner Ltd

Maymorn Structure Plan: Infrastructure Costs Estimate
Beca // 22 June 2010 // Page 1
4260341 // NZ1-2964852-12 0.12
Table of Contents 1 Introduction.............................................................................................................2
1.1 Limitations ................................................................................................................... 2 2 Method.....................................................................................................................2 3 Urban Design Concepts Review............................................................................3 4 Infrastructure Development and Triggers ............................................................5
4.1 Water Supply and Waste Water .................................................................................. 5 4.2 Road Network.............................................................................................................. 9 4.3 Open Space, Reserves and Public Art...................................................................... 12
5 Cost Estimates for Proposed Works ..................................................................12 5.1 Roads ........................................................................................................................ 12 5.2 Water and Waste Water Utilities Infrastructure ......................................................... 13 5.3 Parks, Reserves and Play Grounds .......................................................................... 15 5.4 Summary ................................................................................................................... 18
6 Phasing and Development Cost Model ..............................................................18 7 Delivery Issues .....................................................................................................22
7.1 Case Study ................................................................................................................ 22 7.2 Lots and development areas analysis ....................................................................... 22
8 Conclusions ..........................................................................................................23
Appendices Appendix 1: Road Enhancement Cost Estimate Appendix 2: Staging of Development and Implementation Costs Detail Appendix 3: Proportion of Residential Development per Lot

Maymorn Structure Plan: Infrastructure Costs Estimate
Beca // 22 June 2010 // Page 2
4260341 // NZ1-2964852-12 0.12
1 Introduction
This report provides advice on infrastructure likely to be required in order to support the development of the Maymorn Structure Plan area. This report focuses on the infrastructure that is to be provided by the public sector, identify when it will be required and how much it will cost (indicative and at present day values).
The advice is based on the Maymorn Structure Plan, which provides a framework for development, identifying broad locations for future land uses and infrastructure. It is expected that developers will provide onsite infrastructure, including roads and utilities reticulation, as it traverses their land holdings.
1.1 Limitations
It is understood that this report will be used by the Councils’ financial advisors. Whilst this report provides a breakdown of development triggers and costing, advice is provided on a strategic basis and no detailed design or modelling having been undertaken. Infrastructure triggers and costing may change if the development of the Maymorn Structure Plan is adjusted or is brought about in an different sequence or time frame to that shown in this report.
2 Method
This study followed the steps detailed below:
Develop a GIS based spatial model which breaks down all infrastructure and land to be developed into individual parcels, to allow for scenario testing to improve staging and cash flow forecasts.
Identify trigger points for when upgrades to trunk water supply, trunk waste water, trunk stormwater and roading infrastructure is required, based on the ultimate scale of development envisaged.
Identify interim infrastructure enhancements that could accommodate smaller scales of development if sensible.
Provide a schedule for the delivery of trunk infrastructure enhancements needed relative to development and provide cost estimates (present day values) for its development, including interim enhancements where applicable.
Identify the opportunity to maximise development ahead of infrastructure triggers. Prepare an annualised schedule showing housing development rates, contributions collected
and infrastructure investment required. Provide drawings showing where development and infrastructure enhancement needed are
located. The drawings will identify larger than annualised development areas providing flexibility in terms of how development of individual land areas are brought forward.
Assess the urban design layout, land use mix and density assumptions for the Structure Plan area and reconfigure phases shown in Draft Structure Plan, as appropriate.
Reviewing the planning implications of each decision re staging and the degree of incentive to be provided in terms of increasing density or achieving specific Structure Plan outcomes.
Approximate the costs to service new lots created by estimating development contributions required based on cost estimates to provide infrastructure (stormwater, water supply, waste water and reserves).
Comment on commercial viability based on likely land values (provided by others).

Maymorn Structure Plan: Infrastructure Costs Estimate
Beca // 22 June 2010 // Page 3
4260341 // NZ1-2964852-12 0.12
Undertake a review of urban design concepts for small staged areas (part of the Gabites land area and roading specification) to ensure that these can be self contained while also supporting the long-term vision for Maymorn.
3 Urban Design Concepts Review
A detailed examination of the northern most part of the Gabites land was undertake to ensure efficiency in the use of land, given the site’s location near the train station and proposed neighbourhood centre, and the site’s ability to deliver the vision for Maymorn at an early stage. This assessment provides the basis for the site’s potential development yield.
The review entailed preparing a more detailed layout for the area. As per the Draft Structure Plan, the layout retains the steeper part of the site undeveloped and vegetated (revegetation by native bush should be encouraged) to create a landscape buffer between the flatter lower and upper parts of the site and in doing so, retain a green backdrop for the Mangaroa Valley and the Maymorn area. The review determined that subdivision should include a mix of 400m2 and 800m2 lots with the smaller lots fronting the streets and the larger lots located behind and including more pronounced slopes than the relatively flat smaller lots. The road layout was also extended slightly to achieve more development in the northern corner of the site. The proposed subdivision layout is shown below.
Figure 1: Illustrative Subdivision of the Upper Gabites Area
As part of the urban design review, the road cross-sections were also revisited. Road corridors are proposed to be made slightly narrower than originally shown in the Structure Plan which provides the twin benefits of reducing costs for their construction, and providing designed-in speed

Maymorn Structure Plan: Infrastructure Costs Estimate
Beca // 22 June 2010 // Page 4
4260341 // NZ1-2964852-12 0.12
management measures as narrower carriageways lead to slower speeds and higher pedestrian and cycle safety.
The revised designs for all road types are provided below.
Figure 2: Revised Road Typology
The changes to the road layouts can be summarised as follows:
Primary Main Roads
Reduce carriageway from 9m to 7m Decrease width of cycle path from 4m to 3.5m Overall road corridor reduced from 21m to 18.3m.
Secondary Connector Road
Reduce carriageway from 8m to 6m

Maymorn Structure Plan: Infrastructure Costs Estimate
Beca // 22 June 2010 // Page 5
4260341 // NZ1-2964852-12 0.12
Increase width of footpath (on one side of road) from 2.5m to 3.5m so that can be shared with cyclists
Reduces width of footpath (on other side of road from 2.5m to 1.8m) Retain intermittent on-street parking in 2.5m wide berm, in-between street trees. Parking could
be provided on both sides of the street or alternate side Overall road corridor reduced from 20m to 18.3m.
Tertiary Residential Lanes
Reduce berm from 2.75m to 2.5m Remove verges from both sides of road Reduce footpaths on both sides of road from 2.5m to 1.8m Retain 2.5m wide berm to accommodate intermittent on-street parking in-between street trees Overall road corridor reduced from 18m to 14.1m.
Tertiary Shared Streets*
Increase width of landscaping area from 0.4m to 3m Remove footpaths from both sides of road Maintain width of shared space at 5m as opposed to variation between 3.5m to 5m Overall road corridor reduced from 18.2m to 11m.
*Note the Shared Street concept sits at the bottom of the road hierarchy and is designed to accommodate the least amount of traffic. Shared Streets should be located where they will only be used by people who live on that particular street and are unlikely to accommodate any through vehicular movements due to their location and the provision of more convenient, higher ranking streets nearby.
The Draft Structure Plan erroneously showed a Shared Street next to the neighbourhood centre. Within the neighbourhood centre the road design should incorporate on-street car parking and frequent pedestrian crossings. A Connector Road should be used in lieu of a Shared Street in this location.
4 Infrastructure Development and Triggers
4.1 Water Supply and Waste Water
An indicative wastewater and water supply network for the entire subdivision was prepared on the basis of the Structure Plan and the known location and limitations of existing utilities infrastructure. The design is indicative only as no modelling has been undertaken. Infrastructure has been designed to be laid out along the existing and proposed road network. Specific design assumptions are set out below in respect to each type of infrastructure.
4.1.1 Water Supply
The Structure Plan area is currently served by a water main which runs along Maymorn Road (comprising both a 150mm and a 225mm diameter pipe) and a Parkes Line Road (150mm diameter pipe). A pump station is located on Maymorn Road which boosts pressure. There is limited capacity for additional development to be adequately supplied with water.
A new water reservoir will be needed to serve the ultimate scale of development and located on higher grounds located to north east of the site, north of the railway line. Water would be pumped

Maymorn Structure Plan: Infrastructure Costs Estimate
Beca // 22 June 2010 // Page 6
4260341 // NZ1-2964852-12 0.12
along Maymorn Road via a 150mm diameter pipe to the reservoir. Water supply to new homes (lots) would be from the new reservoir and via a 225mm diameter pipe that runs from the reservoir down to and along Maymorn Road and along Parkes Line. 150mm diameter pipes would run off this network and provide supply to residential streets. A pumped rising main would be needed to supply water to lots located immediately north of the reservoir because that land is at a higher elevation than the reservoir. Figure 3 below shows a proposed layout of the water network.
Figure 3: Potential Water Supply Reticulation Layout
Overall, approximately 19,800 metres of 225mm diameter and 1,000 metres of 225mm diameter pipe are anticipated to be needed in order to serve the whole site. Detailed design would however be required to confirm the design of the water supply network as shown.
Implementation
In order to deliver the above water network system the following is assumed:
New reservoir to be located in northern part of the development, west of the rail way line Existing 225mm pipe along Maymorn Road can be used to supply the network from the reservoir Existing 150mm diameter pipes along Maymorn Road can be used to supply the reservoir Pump station to supply the proposed new reservoir is needed to be upgraded All other pipes shown in the network are new, including new 225mm diameter pipe along Parkes
Line and pumped rising main.

Maymorn Structure Plan: Infrastructure Costs Estimate
Beca // 22 June 2010 // Page 7
4260341 // NZ1-2964852-12 0.12
Triggers
It is assumed that Council would only be responsible for implementing the trunk main and reservoir to supply the development areas. Individual site developers will need to provide local reticulation as part of their development proposals.
Triggers for implementation of the public water supply network are, as follows:
Table 1: Development Triggers for Water Supply Network
Description Specification Development Trigger
1. Piped main network - trunk only (main and connector roads)
Replacement of existing 150mm Φ pipes along Parkes Line
225mm Φ Needed to serve development along Parkes Line Road and east of railway line. Develop as part of Parkes Line Road upgrade works (see section 3.2)
Existing pipes along Maymorn Road assumed to be in place and operational
150mm Φ 225mm Φ
None – pipes already in place.
2. Minor modifications to existing pump station
Needed to serve new reservoir. Estimate work completed by the second year of development
3. Reservoir Additional water capacity needed to serve entire development. Assume commence development in year 0 with reservoir operational in year 2 of development
Water supply to reservoir 150mm Φ Needed as part of reservoir.
Water supply from reservoir 225mm Φ Needed as part of reservoir.
4.1.2 Stormwater
The stormwater system is to be provided as part of the roading network as a kerb and channel system, with pipes located underground. Stormwater will be directed to stormwater detention ponds or swales in order to reduce contaminants from the Maymorn development area and to provide attenuation of storm flows for the discharge to the Mangaroa River so that flows are similar to current conditions.
The size of the detention ponds has not been calculated but it is proposed that all swales and ponds be located within the proposed network of green spaces. It is estimated that up to 5 detention ponds will be required and that these should be provided at intervals in the development process to match the rate of residential development.
4.1.3 Waste Water
The Structure Plan area is connected to the district sewage reticulation system by a 150mm diameter gravity sewer that runs along Parkes Line Road and then to a 225mm diameter sewer along Maymorn Road via a pump station (known as Maymorn Valley Pump Station) located west of the railway line close to the train station. Sewage gravity flows to the Maymorn Plateau Pump Station and then to SH2 Pump Station.
Upgrades to all of the existing pump stations and existing pipe network will be required in order to serve the proposed development. Wastewater west of the railway line will be gravity fed from

Maymorn Structure Plan: Infrastructure Costs Estimate
Beca // 22 June 2010 // Page 8
4260341 // NZ1-2964852-12 0.12
individual lots via a 150mm diameter piped network which will connect to a new 300mm diameter pipe along Maymorn Road. Wastewater will be gravity fed to the upgraded Plateau Pump Station and then to SH2 Pump Station.
Wastewater east of the railway line will be gravity fed from lots via 150mm diameter pipes to a 225mm diameter pipe along Parkes Line Road. This will feed into the Maymorn Valley Pump Station located north of the railway line (it will cross the railway line at the proposed pedestrian underpass). Wastewater will then be pumped into the Maymorn Road gravity main comprising a 300mm diameter pipe.
It is noted that an upgrade to the Sewage Treatment Works that serves Upper Hutt will in time be needed. This upgrade is needed to support development in the district and not just development proposed at Maymorn. Consequently, for the purpose of this report, no assessment has been made in this regard. Figure 4 below shows a proposed layout of the waste water network.
Figure 4: Potential Waste Water Reticulation Layout
Implementation
In order to deliver the above waste water network the following is assumed:
All pump stations will need to be upgraded All existing main pipes will need to be upgraded 150mm diameter rising main needed between Valley Pump Station and Maymorn Road gravity
main 225mm diameter pipes needed along Parkes Line Road 300mm diameter pipes needed along Maymorn Road 150mm diameter pipes needed along all other roads.

Maymorn Structure Plan: Infrastructure Costs Estimate
Beca // 22 June 2010 // Page 9
4260341 // NZ1-2964852-12 0.12
Triggers
It is assumed that Council would only be responsible for development of the trunk main (along Parkes Line and Maymorn Road), upgrades to pump stations and provision of the rising main. Individual site developers will need to provide the local waste water reticulation network as part of their development proposals.
Triggers for implementation of the public water supply network are, as follows:
Table 2: Development Triggers for Waste Water Network
Description Specification
Development Trigger
Piped main network - trunk only (along main roads)
Replacement of existing gravity pipes along Parkes Line
225mm Φ Required when development commences east of railway line relative to Parkes Line Road.
Replacement of existing gravity pipes along Maymorn Road
300mm Φ Upgrade required when approximately 1,250 dwellings have been developed.
Installation of new rising main 150mm Φ Linked to upgrade of Maymorn Valley Pump Station.
Upgrades to pump stations
Plateau Pump Station - Needed to be upgraded in year 1.
Maymorn Valley Pump Station - Needed in order to serve development along Parks Line Rd (east of railway). Capacity for approximately 500 dwellings.
SH2 Pump Station - Sufficient capacity for 1,000 dwellings.
4.2 Road Network
In order to serve the Maymorn Structure Plan area, upgrades are needed to the roading connections to the strategic road network. In addition the existing road network within the Structure Plan area will also need to be enhanced. Anticipated works are described below.
4.2.1 Connections to the Strategic Road Network
A transport model will need to be used to confirm the location and nature of roading enhancements needed. The scale of upgrade works to the Plateau Road junction with SH2 will need to be agreed with NZTA.
The following road improvements are anticipated to be required:
Parkes Line Road and Mangaroa Hill Road to the Mangaroa Bridge – the road outside the Structure Plan area will need to be widened in order to accommodate expected levels of traffic. The roads are proposed to be enhanced as follows: – 7 metre carriageway. – Place stormwater pipe in ditch along length of road and fill as needed. Build 2.5 meter wide
cycleway (gravel finish) above. Mangaroa Bridge – widen to provide a 7 metre carriageway.

Maymorn Structure Plan: Infrastructure Costs Estimate
Beca // 22 June 2010 // Page 10
4260341 // NZ1-2964852-12 0.12
Maymorn Road and Plateau Road– Within the Structure Plan area Maymorn Road needs to be upgraded by providing pedestrian footpaths only. The road between the edge of the Structure Plan area the junction of Plateau Road with SH2 is assumed to be suitable, ie 7 metre carriageway.
SH2 junction – it is assumed that additional safety and capacity is need to be provided at the junction of Plateau Road with SH2. These are likely to entail a seagull junction providing right turn off and right turn on to SH2.
4.2.2 Connections within Maymorn Structure Plan Area
A network of roads is shown in the Structure Plan and is assumed to be provided as follows:
Parkes Line Road and Maymorn Road to be upgraded to become Primary Main Roads with the following specification: – Kerb and channel – Trees located on each side every 15 to 32.5 metres – No on-street parking – 7 metre carriageway with centre line – 3.5 metre pedestrian and cycleway on one side and 1.8 metre pedestrian path on other side.
Bitumen finish – 1 metre grass verge either side – Street lighting
Secondary Connector Roads which provide main circulation within the urban areas and connections to the Primary Roads: – Kerb and channel – Trees located on each side at 32.5 metre centres – On-street parking both side and in blocks of 5 spaces (30 metres) separated by build outs
2.5 metre x 2.5 metre which accommodate trees. – 6 metre carriageway with centre line – 3.5 metre pedestrian and cycleway on one side and 1.8 metre pedestrian path on other side.
Bitumen finish – 1 metre grass verge either side – Street lighting
Tertiary Residential Lanes which provide local access: – Kerb and channel – Trees located on each side at 32.5 metre centres – On-street parking both side and in blocks of 5 spaces (30 metres) separated by build outs
2.5 metre x 2.5 metre which accommodate trees. – 5.5 metre carriageway with centre line – 1.8 metre pedestrian footpath on both sides of road. Bitumen finish. – Street lighting
Shared Street to provided in discrete locations where pedestrian friendly, low speed environments are desirable: – On-street parking on one side in blocks of five spaces (30 metres) separated by trees and
swale – 5 metre carriageway – 3 metre landscaped swale

Maymorn Structure Plan: Infrastructure Costs Estimate
Beca // 22 June 2010 // Page 11
4260341 // NZ1-2964852-12 0.12
– Streetlighting Pedestrian connection under railway line to train station Road connection under railway line Maymorn Road and Parkes Line junction improvements (underpass improvements).
Triggers
It is assumed that Council would only be responsible for development of the main roads and upgrading connections to the strategic road network. Individual site developers will need to provide the local (secondary and tertiary) roads (connector roads, residential lanes and shared surfaces).
Triggers for implementation of the public component of the transport network are, as follows:
Table 3: Development Triggers for Transport Infrastructure Network
Roading/Rail Development Trigger
Parkes Line from McLaren to Mangaroa Bridge (outside of Structure Plan area)
In place by 1,100 dwellings. Upgrade could be undertaken as part of programme of works to upgrade of Parkes Line Road within the Structure Plan area.
Mangaroa Bridge Linked to upgrade of Parkes Line Road from McLaren. Upgrade needed by 850 dwellings in place.
SH2/Plateau Road intersection upgrade
Estimating as being 800 dwellings (not possible to check with NZTA at this time).
Maymorn Rd upgrade to Maymorn Station (within Structure Plan area but also beyond)
Delivered by time 500 dwellings constructed.
Parkes Line Road within Structure Plan area
In place by 1,100 dwellings. Upgrade work could be linked on a pro rata basis to urban development east of railway line.
New pedestrian footpath along Maymorn Road from northern edge of development to train station
Develop as part of Maymorn Road upgrade (trigger is 500 dwellings).
Upgrade of the existing road underpass (under rail track)
Not needed from a traffic perspective so long as pedestrian access to station is provided elsewhere. Assume provided as part of Parkes Line upgrade programme but before development occurs east of rail way line, ie at approximately 1,000 dwellings.
New pedestrian underpass (under track)
Not required from a traffic perspective, but provides for better community and urban design outcomes. Trigger to be development east of railway line to provide safe pedestrian connection if existing underpass has not been enhanced (see above).
New road underpass (under track) Not required from a traffic perspective but provides better connectivity and, hence, better urban design outcome. Trigger and could be when adjacent urban areas west and east of railway are developed.
Railway Station upgrade and access works
Not required from a traffic perspective. Should be brought forward as part of adjacent urban development.
Park & Ride car parking area Not required from a traffic perspective. Should be brought forward as part of adjacent urban development.
Upgrade at McLaren St - flood protection works
Not required from a traffic perspective. Brought forward as part of urban development at south eastern edge of Structure Plan area.

Maymorn Structure Plan: Infrastructure Costs Estimate
Beca // 22 June 2010 // Page 12
4260341 // NZ1-2964852-12 0.12
4.3 Open Space, Reserves and Public Art
Open spaces and reserves will comprise the retention of existing riparian areas, provision of open space areas for informal recreation and children’s playgrounds. Some parts of the existing riparian areas may be enhanced through planting and provision of walkways. The playgrounds will be co-located with open spaces for informal recreation and are shown in the Structure Plan.
Triggers
There are no firm standards as to when public open space needs to be provided. However, in order to provide a range of facilities that can meet the demands of a growing community and to establish robust patterns of land use and social networking, it is propose that active recreation areas are provided earlier rather than later. Therefore, it is proposed that children’s playgrounds and associated public open spaces are implemented in tandem with the development of the adjacent residential land.
However the acquisition and enhancement of riparian areas along the Mangaora River and its main tributaries are proposed to be delayed towards the end of the Structure Plan implementation period. In this way the community could be involved in the design and layout of these areas, thus enhancing the sense of custodianship by the community.
5 Cost Estimates for Proposed Works
In order to develop cost estimates, infrastructure lengths were measured using GIS. Whilst the lengths of infrastructure are measured accurately, some variation might occur when detailed site subdivision layouts are produced, taking into consideration the detailed topography and exact alignment of resultant lots.
5.1 Roads
Cost rates for infrastructure were developed for roads on the basis of the design specification provided in section 3 and assuming that street lighting and stormwater services are provided at the same time. These workings, prepared by our quantity surveying team, are provided at Appendix 1 and can be summarised, as follows:
Table 4: Cost per Linear Metre of Road Main Road Connector
Road Residential Lane
Shared Street
Parkes Line to Mangaroa Bridge
Maymorn Footpath upgrade
Road construction $2,800 $3,100 $2,100 $1,700 $2,300 $380
Stormwater (component)* $2,200 $1,200 $700 $650 $2,200 n/a
Total $5,000 $4,300 $2,800 $2,350 $4,500 $380 * costs for stormwater assume constructed at same time as the road.
As indicated above it is assumed that individual developers will provide internal roads (connector roads, residential lanes and shared streets) as part of their site development, ie a condition of any land development will be that roads (and utilities) are provided in accordance with the Structure Plan. The Council will be responsible for improving Maymorn Road and Parkes Line Road within the study area and for implementing identified improvements to the wider network.

Maymorn Structure Plan: Infrastructure Costs Estimate
Beca // 22 June 2010 // Page 13
4260341 // NZ1-2964852-12 0.12
Therefore, the costs associated with public road enhancement and related works are estimated, as follows:
Table 5: Cost Estimates for Roads (assumes that no land is needed to be acquired)
Road Enhancement Units Cost per unit Costs
Primary / main roads
Plateau Rd / Maymorn Rd upgrade between SH2 and Maymorn Station
1,266m $5,000 $6,368,000
Parkes Line to McLaren 531m $4,500 $2,391,795
New pedestrian footpath along Maymorn Road 100m $380 $38,000
Parkes Line Road through to Mangaroa Bridge (assume Mangaroa Hill Road excluded)
2,580m $2,300 $5,934,000
Streetscape associated with Neighbourhood centre
200m $3,925 $785,000
SH2 / Maymorn road intersection upgrade (assumed that a seagull type junction improvement needed)*
1 $1,500,000* $1,500,000*
Mangaroa Bridge upgrade* 1 $2,000,000* $2,000,000*
Upgrade of existing road underpass (under track) 1 $1,500,000* $1,500,000*
New road underpass (under track)* 1 $1,500,000* $1,500,000*
New pedestrian underpass (under track)* 1 $600,000* $600,000*
Railway Station upgrade and access works* 1 $150,000* $150,000*
Park & Ride carparking area** 3700m2 $60* $222,000*
Upgrade at McLaren St - flood protection works* 1 $800,000* $800,000* * costs estimates for major works are based on experience of projects undertaken of a similar nature. No allowance is provided for land acquisition. Providing more reliable estimates will require preliminary design work and discussions with relevant stakeholders. ** area allocated for car parking is as shown on the Structure Plan and costs shown allow for space for accommodate approximately 150 car parking spaces.
Total costs for road enhancements is estimated to be approximately $22.9 million (including stormwater and flood protection works).
5.2 Water and Waste Water Utilities Infrastructure
The following rates have been provided by Upper Hutt City Council in respect of costs rates for utilities pipes. The costs associated with reservoir construction, pump stations and rising main are based on recently completed project work by Beca. The costs associated with detention ponds are based on costs of development of a detention pond at Aotea, Porirua and in Manukau. The costs of detention ponds depend on their size and on site conditions including topography.

Maymorn Structure Plan: Infrastructure Costs Estimate
Beca // 22 June 2010 // Page 14
4260341 // NZ1-2964852-12 0.12
Table 6: Cost per Linear Metre of Water and Waste Water Utilities
Infrastructure Type Specification Cost
Water
Piped main network - trunk only (main and connector roads)
Replacement of existing pipes 150mm Φ $360 per metre
Replacement of existing pipes 225mm Φ $460 per metre
Installation of new pipes 150mm Φ $360 per metre
Water supply from reservoir 225mm Φ $460 per metre
Water supply to reservoir 150mm Φ $360 per metre
Minor modifications to existing pump station - $100,000
Reservoir (x1) 2,200m3 $1,430,00
Water booster pump station (x1) - $250,000
Wastewater
Piped main network - trunk only (main and connector roads)
a Replacement of existing gravity pipes 225mm Φ $730 per metre
Replacement of existing gravity pipes 300mm Φ $890 per metre
b Installation of new gravity pipes 150mm Φ $600 per metre
c Installation of new rising main 150mm Φ $600 per metre
Upgrades to pump stations (x1) $250,000
Stormwater*
Detention Pond (x1) $600,000 * reticulation network costs contained in road network upgrade and development costs.
As indicated above it is assumed that individual developers will provide utilities within individual lot areas (along internal roads comprising connector roads, residential lanes and shared streets) as part of their site development, ie a condition of any land development will be that utilities are provided in accordance with the Structure Plan. Utilities required to service individual development will be provided by the developer. The Council will be responsible for providing trunk mains which are largely along Maymorn Road and Parkes Line Road, but also include water reservoirs, pump stations and waste water rising main.

Maymorn Structure Plan: Infrastructure Costs Estimate
Beca // 22 June 2010 // Page 15
4260341 // NZ1-2964852-12 0.12
Therefore, the costs associated with water and waste water utilities is estimated, as follows:
Table 7: Cost Estimates for Water and Waste Water Utilities
Specification Units Cost per unit
Cost
Water
Piped main network - trunk only (main and connector roads)
a Installation of new pipes
Water supply from reservoir 225mm Φ 325m $460 $149,500
Water supply to reservoir 150mm Φ 325m $360 $117,000
Minor modifications to existing pump station
1 $100,000 $100,000
Reservoir 2,200m3 - $1,430,000
Wastewater
Piped main network - trunk only (main and connector road)
a Replacement of existing gravity pipes
225mm Φ 929m $730 $678,170
300mm Φ 1580m $890 $1,406,200
c Installation of new rising main 150mm Φ 283m $600 $169,800
Upgrades to pump stations x3 $250,000 $750,000
Stormwater*
Detention Pond x5 $600,000 $3,000,000 * reticulation network costs contained in road network upgrade and development costs.
Overall, costs for all water, waste water and the detention ponds component of the stormwater utilities infrastructure is estimated to be $7.8 million. Note stormwater reticulation system has been costed as part of the road network.
5.3 Parks, Reserves and Play Grounds
The Structure Plan proposes that open space be provided in the form of reserves, parks and play grounds. These are to be used as community facilities and as such they are an important component of the Maymorn Structure Plan.
Steep land located in the north (part of the Gabites block) comprises a large area of regenerating bush and is not intended to be for public use. It is instead proposed to be retained to play a key role in the integration of new land uses into the landscape. Subdivision of this land should only be allowed with suitable provisions for its long term protection from development ie any dwelling should be located outside of the protected area which could form part of the dwelling curtillage and be part of the private land titles. This could be achieved by means of covenant on the area to be protected from development.
Thus, the total amount public open space that is proposed to be provided is 34.29ha as shown on drawing contained in the SP (estimate provided below). The table below provides cost rates and total cost for upgrading and enhancing undeveloped areas to provide reserves, playgrounds, footpaths and public artworks.

Maymorn Structure Plan: Infrastructure Costs Estimate
Beca // 22 June 2010 // Page 16
4260341 // NZ1-2964852-12 0.12
Table 8: Estimated Costs to Create Parks and Reserves
Open Space Units Cost per Unit Cost
Reserves (general)* 193,852m2 $30 $5,815,568
Riparian revegetation 100,000m2 $10 $1,000,000
Neighbourhood Playground 1 $350,000 $350,000
Pocket park Playground 2 $80,000 $160,000
Pathway along historic railway alignment 1,600m (length) $45 $72,000
Public Artworks* 1 $100,000 $100,000
Total $7.5m
* assumes significant proportion of floodplain area is upgraded, but not. Notably only 1/3 of land adjacent to Mangora River is upgraded.
The above costs are based on previous project experience, and using typical examples to form a m2 rate that could then be applied across the Maymorn area, taking into consideration, the following:
Reserves (General) A typical 10,000m2 reserve project was analysed / broken down to amount of site preparation,
pathways, planting, grassing, lighting, etc., Thus, in terms of works, site was developed in the following approximate proportions: 13% shrub and groundcover planting; 79% open grass area with trees; and, 8% paved areas comprising paths, etc. Total cost for this type of project is $300,000 which equates to a $30 per m2. Note this allows for a fairly complete redevelopment of identified reserve areas. Therefore, it could be argued that the existing rural areas within Maymorn already provides significant amenity and therefore less expenditure is required with change and modifications occurring in focussed nodes and the existing rural pasture land left as is / or with minimal additional work required, eg additional tree planting, pathway through existing pasture grassland. Exclusions on the cost schedule do not for allow for formation of sportsfields, hardcourts, etc (active recreation facilities).
Riparian Revegetation Allow for native revegetation of riparian corridor strips. The cost rate is based on native
revegetation costs, plant supply and install costs.
Neighbourhood Playground Creation of a 'destination' playground in the area. Lump sum based on previous project
experience – eg Wanaka Roys Bay playground. Sum allows for playground items (including 1-2 larger iconic items, eg ‘space-net’ plus associated seating, paving, soft-fall and planting.
Pocket Park Playground Small playgrounds to service surrounding residential area. Lump sum based on providing a
small number of playground items and associated seating, paving, soft-fall and planting.
Pathway Along Historic Railway Alignment Supply and install of a 2m wide gravel path.

Maymorn Structure Plan: Infrastructure Costs Estimate
Beca // 22 June 2010 // Page 17
4260341 // NZ1-2964852-12 0.12
Public Artworks Lump sum for several artworks to allow for commissioning, design and installation. May need to
be supplemented by other art funding.
Open space will need to be acquired (or in lieu of development contributions) and the value of land has been estimated based on the value of adjacent land following adoption of the Structure Plan into the District Plan (by means of plan change or otherwise), as follows:
Table 9: Estimated Costs to Acquire Land Needed to Parks and Reserves Density of adjacent land* (area in hectares)
26dph 20dph 10dph 4dph Flood plain/ river
Location by Stage
Value per hectare***
$1,666,500 $1,562,500 $843,750 $380,000 $35,000
Acquisition cost estimate
1 1.34 $2,233,110
2 0.42 $656,250
6 1.01 $1,683,165
Between 6,7,13
0.4 0.4 0.72** $843,800
Between 9,10
West of Parkes Line Road 0.1 0.1 0.2** $329,900
East of Parkes Line Road 0.1 2.1 0 2.1** $3,521,400
Between 11, 10, 14
West of Parkes Line Road 0.1 0.1 1** $229,250
East of Parkes Line Road 1.25 1.05 0.1 2.4** $2,961,063
Between 12,13
All land adjacent to River 17.7 $619,500
Pathway along historic railway alignment
1.6 $608,000
Total Hectares 2.95 3.97 1.05 2.2 24.12 34.29
Acquisition costs $4,916,175 $6,203,125 $885,938 $836,000 $57,888 $13,685,438
* assumes land is split evenly between where open space located between 2 density types
** assumes that half of land located between proposed urban areas is undevelopable because comprises riparian environment and flood plain.
*** Land value based on following assumptions: Density of between 20 and 26 dwellings per hectare (DPH): 50% of serviced land value; 10dph: 45% of service land value; 4dph: 40% of serviced land value where values are sourced from Colin Jenkins (correspondence dated 6 April 2010 and 19 June 2009). Percentages based on assumption that average cost of creating a service lot is $40k and developer profit equals 20%.
The total amount of investment anticipated to be required to enhance open space is approximately $7.5 million + land acquisition costs of $13.7 million, equals $21.2 million.

Maymorn Structure Plan: Infrastructure Costs Estimate
Beca // 22 June 2010 // Page 18
4260341 // NZ1-2964852-12 0.12
5.4 Summary
The above sections summarise costs associated with providing roading, water supply, stormwater and foul water utilities needed to serve the entire Maymorn Structure Plan development. Excluding costs associated with individual land development where it is assumed that infrastructure needed to service individual land development parcels (and lots) will be provided by developers, the total outlay by the public is estimated as follows:
Road enhancements and upgrades: $22.9 million* Water and foul water: $7.8 million Open space, reserves and parks: $21.2 million TOTAL $42.5 million (note due to rounding does not add up
to above) * includes stormwater
Thus overall costs are approximately $51.9 million. The total cost of infrastructure provides a robust basis for establishment of a development contribution levy for the Maymorn Structure Plan area, ie the development pays for the infrastructure needed. It is assumed that the Structure Plan area could achieve 1,717 dwellings and therefore the development contribution on a per dwelling basis is $30,227 per dwelling. Parks and reserves land acquisition equates to 26% of the total development contribution payable.
It is noted that the Council’s current contribution levies are provided on an area by area basis. Whilst capital works equate to between $2,000 and $50,000 per additional lot created, levies are in some areas heavily subsidised and so range between $2,000 and $19,300, (LTCCP 2009 - 2019). The Maymorn Structure Plan area would be the second highest development contribution rate on a per dwelling basis.
6 Phasing and Development Cost Model
The above section identifies the infrastructure that is anticipated to be needed to support the Maymorn Structure Plan development and its staging. The development triggers provided show when infrastructure can be phased to occur relative to completion of new homes. This section shows how year by year costs of development could be matched by development contributions based on an even rate of development and a progressive sequence. This provides a basis for managing the development so it occurs in serviced areas only rather than across the entire Structure Plan area.
The following sequence of phasing was chosen with land areas brought forward for development programmed to achieve an even rate over time. This means that as one development area is being completed the next one begins.

Maymorn Structure Plan: Infrastructure Costs Estimate
Beca // 22 June 2010 // Page 19
4260341 // NZ1-2964852-12 0.12
Figure 5: Proposed Staging Plan
Below is a summary of infrastructure provided per stage:
Stage Infrastructure
Stage 1 Reservoir (including connections and pump station)
Upgrade Waste water pump station
Reserve
Stage 2 Detention pond No 1
Reserve and pocket playground
Stage 3
Stage 4 Maymorn Road upgrade to SH2
Stage 5 Reserves
Stage 6 Railway station upgrade and park and ride
Detention pond No 2
Neighbourhood playground
Stage 7 SH2 / Plateau Road upgrade
Stage 8 Mangaroa Bridge Upgrade
Parkes Line Road (within Structure Plan)
Upgrade existing road underpass (under track)
Stage 9 Parkes Line Road from McLaren to Mangaroa Bridge
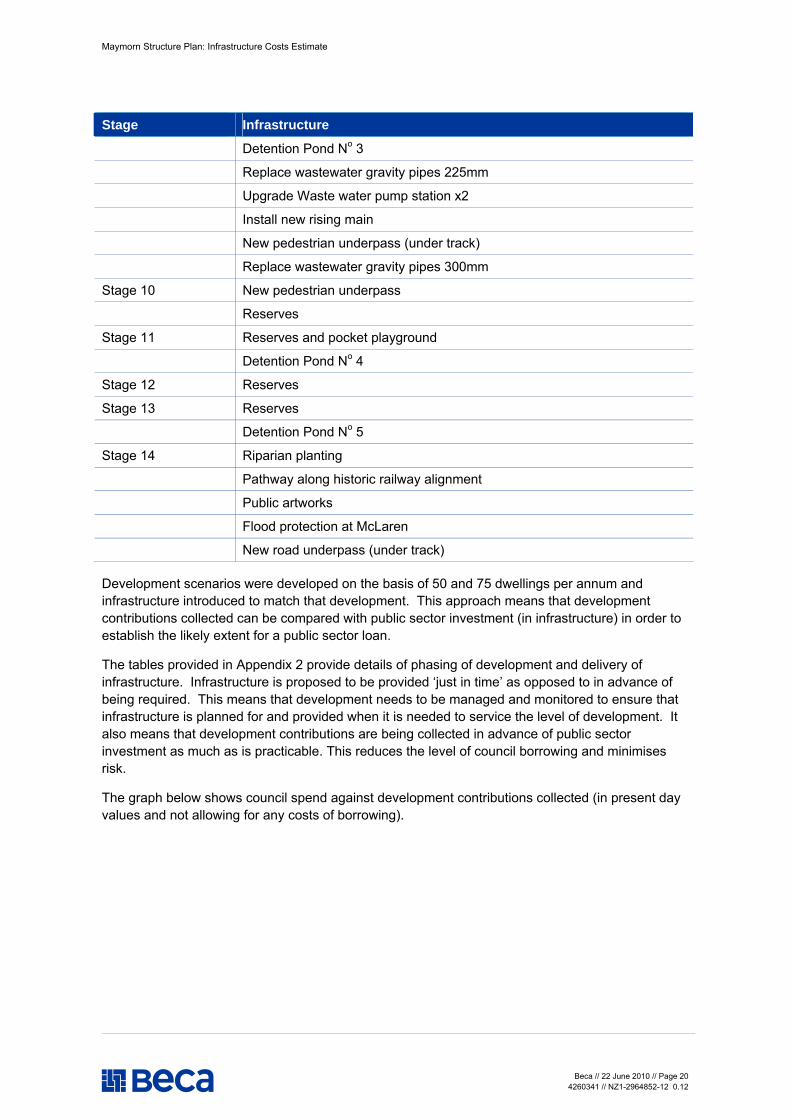
Maymorn Structure Plan: Infrastructure Costs Estimate
Beca // 22 June 2010 // Page 20
4260341 // NZ1-2964852-12 0.12
Stage Infrastructure
Detention Pond No 3
Replace wastewater gravity pipes 225mm
Upgrade Waste water pump station x2
Install new rising main
New pedestrian underpass (under track)
Replace wastewater gravity pipes 300mm
Stage 10 New pedestrian underpass
Reserves
Stage 11 Reserves and pocket playground
Detention Pond No 4
Stage 12 Reserves
Stage 13 Reserves
Detention Pond No 5
Stage 14 Riparian planting
Pathway along historic railway alignment
Public artworks
Flood protection at McLaren
New road underpass (under track)
Development scenarios were developed on the basis of 50 and 75 dwellings per annum and infrastructure introduced to match that development. This approach means that development contributions collected can be compared with public sector investment (in infrastructure) in order to establish the likely extent for a public sector loan.
The tables provided in Appendix 2 provide details of phasing of development and delivery of infrastructure. Infrastructure is proposed to be provided ‘just in time’ as opposed to in advance of being required. This means that development needs to be managed and monitored to ensure that infrastructure is planned for and provided when it is needed to service the level of development. It also means that development contributions are being collected in advance of public sector investment as much as is practicable. This reduces the level of council borrowing and minimises risk.
The graph below shows council spend against development contributions collected (in present day values and not allowing for any costs of borrowing).

Maymorn Structure Plan: Infrastructure Costs Estimate
Beca // 22 June 2010 // Page 21
4260341 // NZ1-2964852-12 0.12
Figure 6: Development Contributions Compared with Public Sector Investment (50 dwellings per annum) (present day values and with no consideration of loan
costs)
-$10,000,000
$0
$10,000,000
$20,000,000
$30,000,000
$40,000,000
$50,000,000
$60,000,000
1 2 3 4 5 6 7 8 9 10 11 12 13 14 15 16 17 18 19 20 21 22 23 24 25 26 27 28 29 30 31 32 33 34 35 36
Years
Running total implementation costs Development contributions accumulation Surplus / Deficit
Figure 7: Development Contributions Compared with Public Sector Investment (75 dwellings
per annum) (present day values and with no consideration of loan costs)
-$10,000,000
$0
$10,000,000
$20,000,000
$30,000,000
$40,000,000
$50,000,000
$60,000,000
1 2 3 4 5 6 7 8 9 10 11 12 13 14 15 16 17 18 19 20 21 22 23 24 25 26
Years
Running Total Public implementation costs Development contributions accumulation Surplus / Deficit
The above graphs show that assuming an even rate of development, sufficient development contributions are generally able to be collected in advance of infrastructure investment. In general the slower the development rate the greater is council’s financial exposure. This can be reduced by

Maymorn Structure Plan: Infrastructure Costs Estimate
Beca // 22 June 2010 // Page 22
4260341 // NZ1-2964852-12 0.12
managing development so that there is an acceleration in applications (and contributions collected) over periods when large investment is required.
The charts show public investment exceeds contribution in one instance in both scenarios shown above, by between $17k (75dph scenario) and $300k (50dph scenario). This debt is best managed by ensuring high rates of ‘lot’ development around periods of high expenditure by Council, i.e. the faster the rate of development the less that Council is exposed to debt.
Overall, the graphs show that in general terms council investment can be balanced against development contributions accumulated.
7 Delivery Issues
The above sections have focussed on public sector costs and the degree to which the public sector is likely to become exposed financially. This section examines the commercial viability for developers given likely overall development costs.
7.1 Case Study
The table below is a case study of stages 1 and 2 only, and shows likely development costs (associated with providing roads and utilities) plus development contribution and compares this with land value.
Total infrastructure costs $18,984,202
Total development contribution (293 dwellings) $8,780,425
Land value $31,856,210*
Difference between improvement costs and land value $4,091,583
* Land values provided by Colin Jenkins (correspondence dated 6 April 2010 and 19 June 2009)
The above table shows that the capital investment required to enable the development equates to a land value uplift of $4m. Not all of this figure will constitute profit because no allowance has been made in our calculation for financing, professional fees or holding costs.
Based on a rule of thumb, the creation of dwellings would appear to be viable as the value of the home created will be roughly twice construction cost.
The table above would indicate that the development contribution can be afforded by the land developer who creates the lots. However, given that the level of development contribution suggested is relatively high for the district this may require further consideration. Council could consider either subsidising the infrastructure or reducing costs further, for example through a reduction of the amount of public open space and equivalent increase in development area in the Structure Plan area. There may also be opportunities for reserve land to be vested in lieu of payment. This report has not considered the implication of either approaches.
7.2 Lots and Development Areas Analysis
The table provided in Appendix 3 compares land development (as shown in the Structure Plan) against Certificate of Title in order to identify whether any lots have a high proportion of non-commercial development.

Maymorn Structure Plan: Infrastructure Costs Estimate
Beca // 22 June 2010 // Page 23
4260341 // NZ1-2964852-12 0.12
The table shows that most lots have in excess of 80% of their area used for residential land use and hence individual lot deliverability issues are unlikely to arise. There are approximately 13 lots which have less than 50% of their land allocated for residential development as indicated in the current Structure Plan. These lots will need to be considered as part of detailed site design and staging process and monies allowed for acquisition (of reserves) to enable land development to occur. Where a very high proportion (or all) of a site is allocated for reserve then Council may want to consider site acquisition earlier.
8 Conclusions
The triggers provided in this report comprise a mixture of (i) essential infrastructure that must be provided in order to properly service the development’ and, (ii) non-essential infrastructure that is nevertheless needed to support the creation of a sustainable community. The staging of the latter form of infrastructure affords some flexibility. The staging advice provided in this report has assumed that essential infrastructure is provided when required (‘just-in-time’) and has delayed other non time critical items.
On this basis this report has shown that it is possible to phase infrastructure provision so that Council’s exposure to borrowing can be minimised. The Councils exposure to debt risk can be reduced by increasing the rate of development during periods when public sector investment is high.
Based on land value assumptions and given servicing and development contribution costs the increase in land value following subdivision results in some degree of profit (approximately 15%). Development contributions (approximately $30k) equate to some 30% of total costs and of that, land acquisition costs for reserves and open space is 25%. Thus, a more detailed assessment of commercial viability may be required. This may lead to some refinement of parts of the Structure Plan to, for example, reduce the area of proposed reserves in order to reduce development contributions and hence ensure commercial viability for individual lots.

Appendix 1
Road Enhancement Cost Estimate

GENERAL SUMMARY
PROJECT : Maymorn Structural Plan Concept Estimate
SubTitle :
COMPANY : Beca
DATE : Wed 03 Mar 2010 11:35am
Bid Currency : New Zealand
CO SECTION NAME UNIT QUANTITY RATE COST
01
02
03
04
05
06
ROADING AND PAVING
Main Roads - 100m
Connector Roads - 100m
Residential Lane - 100m
Shared Street Slow Zone -100m
Parks Line to Mangoroa Bridge - 100m
Maymorn Road Sidewalk upgrade - 100m
Assumptions & Exclusions
STORMWATER
TOTALS OF SELECTED SECTIONS
280,000.40
310,000.15
210,000.05
170,000.70
230,000.20
38,000.80
1,238,002.30
4260341 MAYMORN CONCEPT GS/1

Section '01'-'Main Roads - 100m'
PROJECT : Maymorn Structural Plan Concept Estimate
SubTitle :
COMPANY : Beca
DATE : Wed 03 Mar 2010 11:35am
Bid Currency : New Zealand
BQREF DESCRIPTION UNIT QTY RATE COST
Note
1.00
1.01
2.00
2.01
2.02
2.03
2.04
2.05
2.06
2.07
2.08
2.09
2.10
2.11
2.12
2.13
2.14
3.00
3.01
4.00
4.01
All area and quantities are based on 100mof road
SITE CLEARANCE AND DEMOLITION
Allow to clear any existing trees shrubsand fences from site
ROADS AND PAVING
Remove all topsoil to a depth of 150mmmaximum allowing to stockpile on site forreuse
Excavate down a maximum of 500mm for roadformation allowing to cut to fill
Excavate down a maximum of 200mm for cycleand pedestrian formation allowing to cut tofill
Subgrade preparation and testing
Form sub-basescourse layers of 500mm withAP65 allowing for compaction and levelling
150mm thick TNZM4 basecourse includingall necessary compaction
50mm thick Mix 15 asphaltic concretesurfacing
150mm thick concrete pedestrian and cyclefoot paths
Road lane markings
Road eyelets
Allow to cast in-situ a standard kerb andchannel 250 x 300mm
Allow to cast in-situ a standard kerb 150 x250mm
Allow to infill beams and verge withstockpiled topsoil
Allow to spread remaining topsoil overexisting site
LIGHTING
Install street lighting to both sides ofroad allowing lights to be at a maximum of50m centres
LANDSCAPING
Hydro mulch verge and beam to side of road
m2
m3
m3
m3
m2
m3
m2
m2
m2
m
m
m
m
m3
m3
No
m2
1,830
275
350
106
1,230
350
215
700
530
300
100
200
200
200
75
4
600
5.00
10.00
10.00
10.00
2.00
70.00
110.00
28.00
65.00
3.00
120.00
50.00
40.00
10.00
12.00
6,000.00
2.00
9,150.00
2,750.00
3,500.00
1,060.00
2,460.00
24,500.00
23,650.00
19,600.00
34,450.00
900.00
12,000.00
10,000.00
8,000.00
2,000.00
900.00
24,000.00
1,200.00
4260341 MAYMORN CONCEPT 01/1

Section '01'-'Main Roads - 100m'
PROJECT : Maymorn Structural Plan Concept Estimate
SubTitle :
COMPANY : Beca
DATE : Wed 03 Mar 2010 11:35am
Bid Currency : New Zealand
BQREF DESCRIPTION UNIT QTY RATE COST
4.02
5.00
6.00
7.00
Allow to supply and install 1.5 - 2.0m treeevery 15m to beams, allowing for timberwind supports and ties
Subtotal
PRELIMINARY AND GENERAL
CONTINGENCY
ROUNDING
Totals for Section '01'-'Main Roads - 100m'
No
*
LS
LS
LS
14
184,320
211,968
4,442
300.00
0.15
0.30
1.00
4,200.00
184,320.00
27,648.00
63,590.40
4,442.00
280,000.40
4260341 MAYMORN CONCEPT 01/2

Section '02'-'Connector Roads - 100m'
PROJECT : Maymorn Structural Plan Concept Estimate
SubTitle :
COMPANY : Beca
DATE : Wed 03 Mar 2010 11:35am
Bid Currency : New Zealand
BQREF DESCRIPTION UNIT QTY RATE COST
Note
1.00
1.01
2.00
2.01
2.02
2.03
2.04
2.05
2.06
2.07
2.08
2.09
2.10
2.11
2.12
2.13
3.00
3.01
4.00
4.01
4.02
All area and quantities are based on 100mof road
SITE CLEARANCE AND DEMOLITION
Allow to clear any existing trees shrubsand fences from site
ROADS AND PAVING
Remove all topsoil to a depth of 150mmmaximum allowing to stockpile on site forreuse
Excavate down a maximum of 500mm for roadformation allowing to cut to fill
Excavate down a maximum of 200mm for cycleand pedestrian formation allowing to cut tofill
Subgrade preparation and testing
Form sub-basescourse layer of 500mm withAP65 allowing for compaction and levelling
150mm thick TNZM4 basecourse includingall necessary compaction
50mm thick Mix 15 asphaltic concretesurfacing
35mm thick asphalt to pedestrian and cyclefoot paths
Road and carpark markings
Allow to cast in-situ a standard kerb andchannel 250 x 300mm
Allow to cast in-situ a standard kerb 150 x250mm
Allow to infill trees and verge withstockpiled topsoil
Allow to spread remaining topsoil overexisting site
LIGHTING
Install street lighting to both sides ofroad allowing lights to be at a maximum of50m centres
LANDSCAPING
Hydro mulch verge and trees to side of road
Allow to supply and install 1.5 - 2.0m treeevery 32.5m to side of road , allowing for
m2
m3
m3
m3
m2
m3
m3
m2
m2
m
m
m
m3
m3
No
m2
1,830
275
550
106
750
550
245
1,059
630
193
231
200
56
220
4
239
20.00
10.00
10.00
10.00
2.00
70.00
110.00
28.00
22.00
3.00
50.00
40.00
10.00
12.00
6,000.00
2.00
36,600.00
2,750.00
5,500.00
1,060.00
1,500.00
38,500.00
26,950.00
29,652.00
13,860.00
579.00
11,550.00
8,000.00
560.00
2,640.00
24,000.00
478.00
4260341 MAYMORN CONCEPT 02/1

Section '02'-'Connector Roads - 100m'
PROJECT : Maymorn Structural Plan Concept Estimate
SubTitle :
COMPANY : Beca
DATE : Wed 03 Mar 2010 11:35am
Bid Currency : New Zealand
BQREF DESCRIPTION UNIT QTY RATE COST
5.00
6.00
7.00
timber wind supports and ties
Subtotal
PRELIMINARY AND GENERAL
CONTINGENCY
ROUNDING
Totals for Section '02'-'Connector Roads - 100m'
No
*
LS
LS
LS
7
206,279
237,221
1,613
300.00
0.15
0.30
1.00
2,100.00
206,279.00
30,941.85
71,166.30
1,613.00
310,000.15
4260341 MAYMORN CONCEPT 02/2

Section '03'-'Residential Lane - 100m'
PROJECT : Maymorn Structural Plan Concept Estimate
SubTitle :
COMPANY : Beca
DATE : Wed 03 Mar 2010 11:35am
Bid Currency : New Zealand
BQREF DESCRIPTION UNIT QTY RATE COST
Note
1.00
1.01
2.00
2.01
2.02
2.03
2.04
2.05
2.06
2.07
2.08
2.09
2.10
2.11
2.12
2.13
3.00
3.01
4.00
4.01
4.02
All area and quantities are based on 100mof road
SITE CLEARANCE AND DEMOLITION
Allow to clear any existing trees shrubsand fences from site
ROADS AND PAVING
Remove all topsoil to a depth of 150mmmaximum allowing to stockpile on site forreuse
Excavate down a maximum of 500mm for roadformation allowing to cut to fill
Excavate down a maximum of 200mm for cycleand pedestrian formation allowing to cut tofill
Subgrade preparation and testing
Form sub-basescourse layer of 500mm withAP65 allowing for compaction and levelling
150mm thick TNZM4 basecourse includingall necessary compaction
50mm thick Mix 15 asphaltic concretesurfacing
35mm thick asphalt to pedestrian and cyclefoot paths
Road and carpark markings
Allowance for road signs and posts
Allow to cast in-situ a standard kerb andchannel 250 x 300mm
Allow to infill trees area with stockpiledtopsoil
Allow to spread remaining topsoil overexisting site
LIGHTING
Install street lighting to both sides ofroad allowing lights to be at a maximum of50m centres
LANDSCAPING
Hydro mulch around trees to side of road
Allow to supply and install 1.5 - 2.0m treeevery 32.5m to side of road , allowing fortimber wind supports and ties
m2
m3
m3
m3
m2
m3
m3
m2
m2
m
LS
m
m3
m3
No
m2
No
1,410
212
525
36
246
525
212
1,012
360
193
1
231
16
197
4
39
7
5.00
10.00
10.00
10.00
2.00
70.00
110.00
28.00
22.00
3.00
1,500.00
50.00
10.00
12.00
6,000.00
2.00
300.00
7,050.00
2,120.00
5,250.00
360.00
492.00
36,750.00
23,320.00
28,336.00
7,920.00
579.00
1,500.00
11,550.00
160.00
2,364.00
24,000.00
78.00
2,100.00
4260341 MAYMORN CONCEPT 03/1

Section '03'-'Residential Lane - 100m'
PROJECT : Maymorn Structural Plan Concept Estimate
SubTitle :
COMPANY : Beca
DATE : Wed 03 Mar 2010 11:35am
Bid Currency : New Zealand
BQREF DESCRIPTION UNIT QTY RATE COST
5.00
6.00
7.00
Subtotal
PRELIMINARY AND GENERAL
CONTINGENCY
ROUNDING
Totals for Section '03'-'Residential Lane - 100m'
*
LS
LS
LS
153,929
117,019
-2,124
0.15
0.30
1.00
153,929.00
23,089.35
35,105.70
-2,124.00
210,000.05
4260341 MAYMORN CONCEPT 03/2

Section '04'-'Shared Street Slow Zone -100m'
PROJECT : Maymorn Structural Plan Concept Estimate
SubTitle :
COMPANY : Beca
DATE : Wed 03 Mar 2010 11:35am
Bid Currency : New Zealand
BQREF DESCRIPTION UNIT QTY RATE COST
Note
1.00
1.01
2.00
2.01
2.02
2.03
2.04
2.05
2.06
2.07
2.09
2.10
2.11
2.12
2.13
3.00
3.01
3.02
4.00
5.00
All area and quantities are based on 100m
SITE CLEARANCE AND DEMOLITION
Allow to clear any existing trees shrubsand fences from site
ROADS AND PAVING
Remove all topsoil to a depth of 150mmmaximum allowing to stockpile on site forreuse
Excavate down a maximum of 500mm for roadformation allowing to cut to fill
Excavate down a maximum of 200mm for cycleand pedestrian formation allowing to cut tofill
Subgrade preparation and testing
Form sub-basescourse layer of 500mm withAP65 allowing for compaction and levelling
150mm thick TNZM4 basecourse includingall necessary compaction
50mm thick Mix 15 asphaltic concretesurfacing
Allow to cast in-situ a standard kerb andchannel 250 x 300mm
Allow to cast in-situ a standard 300mm widedish channel
Allow to construct swale to side of road.
Allow to infill tree and swale area withstockpiled topsoil
Allow to spread remaining topsoil overexisting site
LANDSCAPING
Allow to supply and install 1.5 - 2.0m treeevery 32.5m to side of road , allowing fortimber wind supports and ties
Allow to plant in-between trees withvarious vegetation
Subtotal
PRELIMINARY AND GENERAL
CONTINGENCY
m2
m3
m3
m3
m2
m3
m3
m2
m
m
m
m2
m3
No
m2
*
LS
LS
1,100
165
300
30
800
400
120
781
100
100
100
320
102
7
300
110,642
127,238
5.00
10.00
10.00
10.00
2.00
70.00
110.00
28.00
50.00
80.00
100.00
10.00
12.00
300.00
20.00
0.15
0.30
5,500.00
1,650.00
3,000.00
300.00
1,600.00
28,000.00
13,200.00
21,868.00
5,000.00
8,000.00
10,000.00
3,200.00
1,224.00
2,100.00
6,000.00
110,642.00
16,596.30
38,171.40
4260341 MAYMORN CONCEPT 04/1

Section '04'-'Shared Street Slow Zone -100m'
PROJECT : Maymorn Structural Plan Concept Estimate
SubTitle :
COMPANY : Beca
DATE : Wed 03 Mar 2010 11:35am
Bid Currency : New Zealand
BQREF DESCRIPTION UNIT QTY RATE COST
7.00 ROUNDING
Totals for Section '04'-'Shared Street Slow Zone -100m'
LS 4,591 1.00 4,591.00
170,000.70
4260341 MAYMORN CONCEPT 04/2

Section '05'-'Parks Line to Mangoroa Bridge - 100m'
PROJECT : Maymorn Structural Plan Concept Estimate
SubTitle :
COMPANY : Beca
DATE : Wed 03 Mar 2010 11:35am
Bid Currency : New Zealand
BQREF DESCRIPTION UNIT QTY RATE COST
Note
1.00
1.01
2.00
2.01
2.02
2.03
2.04
2.05
2.06
2.07
2.08
2.09
2.10
3.00
3.01
4.00
5.00
6.00
7.00
Allow to extended existing road to 7.0mwide, Install 2.5m wide cycleway/ path toexisting stormwater ditch
SITE CLEARANCE AND DEMOLITION
Allow to clear any existing trees shrubsand fences from site
ROADS AND PAVING
Demolish and remove 3.0m of roading toallow for new to tie in.
Remove all topsoil to a depth of 150mmmaximum allowing to stockpile on site forreuse
Excavate down a maximum of 500mm for roadformation allowing to dispose over site
Subgrade preparation and testing
Form sub-basescourse layer of 500mm withAP65 allowing for compaction and levelling
150mm thick TNZM4 basecourse includingall necessary compaction
50mm thick Mix 15 asphaltic concretesurfacing
Allow to cast in-situ a standard kerb andchannel 250 x 300mm
Fill in existing culvert with AP65
150mm Thick crushed lime to top of AP65
LIGHTING
Install street lighting to one sides ofroad allowing lights to be at a maximum of50m centres
STORMWATER
Install 250mm dia field drain to existingculvert including filter sock
Subtotal
PRELIMINARY AND GENERAL
CONTINGENCY
ROUNDING
Totals for Section '05'-'Parks Line to Mangoroa Bridge - 100m'
m2
m2
m3
m3
m2
m3
m3
m2
m
m3
m2
No
m
*
LS
LS
LS
450
300
68
250
500
250
75
700
100
313
38
2
100
153,130
176,099
1,071
5.00
25.00
10.00
10.00
2.00
70.00
110.00
28.00
50.00
70.00
130.00
6,000.00
500.00
0.15
0.30
1.00
2,250.00
7,500.00
680.00
2,500.00
1,000.00
17,500.00
8,250.00
19,600.00
5,000.00
21,910.00
4,940.00
12,000.00
50,000.00
153,130.00
22,969.50
52,829.70
1,071.00
230,000.20
4260341 MAYMORN CONCEPT 05/1

Section '06'-'Maymorn Road Sidewalk upgrade - 100m'
PROJECT : Maymorn Structural Plan Concept Estimate
SubTitle :
COMPANY : Beca
DATE : Wed 03 Mar 2010 11:35am
Bid Currency : New Zealand
BQREF DESCRIPTION UNIT QTY RATE COST
1.00
1.01
2.00
2.01
2.03
2.04
2.05
2.06
2.07
2.08
2.09
3.00
4.00
5.00
Allow to provide 1.8m wide additionalsidewalk to side of road.
SITE CLEARANCE AND DEMOLITION
Allow to clear any existing trees shrubsand fences from site
ROADS AND PAVING
Remove all topsoil to a depth of 150mmmaximum allowing to stockpile on site forreuse
Excavate down a maximum of 200mm for cycleand pedestrian formation allowing to cut tofill
Subgrade preparation and testing
Form sub-basescourse layer of 200mm withAP65 allowing for compaction and levelling
150mm thick TNZM4 basecourse includingall necessary compaction
Allow to cast in-situ a standard kerb andchannel 250 x 300mm
150mm thick concrete pedestrian and cyclefoot paths
Allow to spread remaining topsoil overexisting site
PRELIMINARY AND GENERAL
CONTINGENCY
ROUNDING
Totals for Section '06'-'Maymorn Road Sidewalk upgrade - 100m'
m2
m2
m3
m2
m3
m3
m
m2
m3
LS
LS
LS
180
27
36
180
36
27
100
180
27
24,404
28,064
1,517
5.00
10.00
10.00
2.00
70.00
110.00
50.00
65.00
12.00
0.15
0.30
1.00
900.00
270.00
360.00
360.00
2,520.00
2,970.00
5,000.00
11,700.00
324.00
3,660.60
8,419.20
1,517.00
38,000.80
4260341 MAYMORN CONCEPT 06/1

Section ''-'Assumptions & Exclusions'
PROJECT : Maymorn Structural Plan Concept Estimate
SubTitle :
COMPANY : Beca
DATE : Wed 03 Mar 2010 11:35am
Bid Currency : New Zealand
BQREF DESCRIPTION UNIT QTY RATE COST
1
2
3
4
5
6
7
8
9
10
11
12
13
14
15
16
17
18
19
20
- Allowed to clear farmland of any small shrubs or fences from roadway
- Primary Road allowed to construct to a maximum width of 18.3m
- Connector Road allowed to construct to a maximum width of 18.3m
- Residential Lane allowed to construct to a maximum of 14.1m
- Shard Street/ Slowzone allowed to construct to a maximum of 11.0m
- Allow to extend existing cariageway by 2.0m including resurfacing of existing with asphalt
- Allowed to excavate down to a maximum of of 500mm below topsoil for sub-basecourse material
- No allowance for bulk earthworks to form road levels or stabilisation of ground
- All excess fill material to cut to fill or be deposited over site.
- Allow to form sub-basecourse with 500mm AP65
- Allowed for 150mm of basecourse
- All road to be constructed of 50mm Mix 15 Asphalt
- Allowed to paint centre line of road to Main, Connector and Residential roads only
- 35mm thick asphalt to pedestrian and cycle foot paths
- Shared Street to be constructed of 50mm Mix 15 Asphalt
- No allowance for any street signage
- All beans, verges and tree areas are allowed to be filled with stockpiled topsoil
- Allowed to hydro seed beams, verges and tree areas
- Allowed to install 1.5-2.0m feature trees with wind supports ($300 per tree). No allowance for tree pits
- No allowance for any pedestrian refuges, driveway vehicle crossings to individual sites and noise controls and bunds
Note
Note
Note
Note
Note
Note
Note
Note
Note
Note
Note
Note
Note
Note
Note
Note
Note
Note
Note
Note
4260341 MAYMORN CONCEPT /1

Section ''-'Assumptions & Exclusions'
PROJECT : Maymorn Structural Plan Concept Estimate
SubTitle :
COMPANY : Beca
DATE : Wed 03 Mar 2010 11:35am
Bid Currency : New Zealand
BQREF DESCRIPTION UNIT QTY RATE COST
21
22
23
24
25
26
27
28
29
- No allowance for any lights, roundabouts, and intersections
- Street lighting. Allowed to install 70W sodium discharge lanterns on 8m high tapered octagonal columns at 50m centres
- No allowance for any Zebra crossing of judder bars or fences to side of road
- No allowance for any disposal of any contaminated material
- No allowance for Electrical supply, Telephone, Gas, Cable TV Network, Water supply and Sewerage system.
- No allowance for relocation of existing services
- No allowance for any Geotechinacal investigation, Land purchases and holding costs, Financing costs, Traffic management Escalation, Construction contingency and GST
- No allowance for any Survey fees, Legal costs, Professional design fees and construction monitoring, Resources consent fees and Developer management fees, Client management.
- Estimate carriers a level of accuracy of +-30%
Totals for Section ''-'Assumptions & Exclusions'
Note
Note
Note
Note
Note
Note
Note
Note
Note
4260341 MAYMORN CONCEPT /2

Section ''-'STORMWATER'
PROJECT : Maymorn Structural Plan Concept Estimate
SubTitle :
COMPANY : Beca
DATE : Wed 03 Mar 2010 11:35am
Bid Currency : New Zealand
BQREF DESCRIPTION UNIT QTY RATE COST
1
2
3
4
5
6
7
1.00
1.01
1.02
1.03
1.04
1.05
- No details or plans have been provided to assess the requirements of the catchment area.
- A basic assumption that the Main road will carry the outflow of catchment area. Therefore it will requiring a lager diameter pipe to cope with this.
- On this bases the Main Road will require 900mm dia pipe, Connector Road 600mm dia pipe, Residential Lane 375mm and Shared Street of 225mm dia.
- Detension Ponds are require to help take some of the loads during peak during ran. As previous estimate 5No will be required
- Rates for Main and Connector Road allow to be at a depth greater than 1.5 but not more than 3.0m
- Rates for Residential lane and Shared Street allow to be at a depth no greater than 1.5m
- Allowed to install concrete cesspit at 80.0m centres
STORMWATER
Main Road Stormwater
Connector Road Stormwater
Residential Lane
Shared Street
Detention Pond
Totals for Section ''-'STORMWATER'
Note
Note
Note
Note
Note
Note
Note
m
m
m
m
Each
2,200.00
1,200.00
700.00
650.00
600,000.00
4260341 MAYMORN CONCEPT /1

Appendix 2
Staging of Development and Implementation Costs Detail

MaymornPhasing and Costing Plan10 March 2010
75 Dwellings per annum
Area under development 1c 1c 1c 1c/1b 1b 1b/1a 1a/2b 2b 2b/2a 2a 2a 2a 2a/3 3 3/4 4 4/7 7 7 7/8 8 8 8 8 8 8/9 9 9 9 9/10 10 10/6 6/5 5/11 11 11Year
1 2 3 4 5 6 7 8 9 10 11 12 13 14 15 16 17 18 19 20 21 22 23 24 25 26 27 28 29 30 31 32 33 34 35 36 37 38Dwellings total 50 100 150 200 250 300 350 400 450 500 550 600 650 700 750 800 850 900 950 1000 1050 1100 1150 1200 1250 1300 1350 1400 1450 1500 1550 1600 1650 1700 1717 1717 1717 1717Annual Rate 50 50 50 50 50 50 50 50 50 50 50 50 50 50 50 50 50 50 50 50 50 50 50 50 50 50 50 50 50 50 50 50 50 50 17Area 1a 8 36Area 1b 29 50 42Area 1c 50 50 50 21Area 2b 14 50 48Area 2a 2 50 50 50 50 20Area 3 30 50 1Area 4 16Area 5 6 22Area 6 32 44Area 7 33 50 50 34Area 8 16 50 50 50 50 50 32Area 9 18 50 50 50 15Area 10 35 50 18Area 11 28 50 17
Infrastructure Costs ($)Implemented as part of house building
Roads $1,685,591 $1,685,591 $1,685,591 $2,009,378 $2,243,845 $2,049,089 $1,262,133 $1,867,735 $1,832,222 $979,919 $979,919 $979,919 $979,919 $1,972,553 $2,634,309 $3,436,549 $1,240,008 $1,240,008 $1,220,513 $1,179,086 $1,179,086 $1,179,086 $1,179,086 $1,179,086 $1,277,579 1452678 1452678 1452678 1613597 1682562 1855618 2438613 4862201 3968172 1349178 0 0 0Water Supply And Waste $478,060 $478,060 $478,060 $599,842 $688,029 $634,262 $384,102 $466,689 $461,460 $335,972 $335,972 $335,972 $335,972 $652,911 $864,204 $1,014,942 $429,860 $429,860 $426,398 $419,042 $419,042 $419,042 $419,042 $419,042 $459,462 531319.2 531319.2 531319.2 578489.1 598704.8 585447.6 733455.4 1561067 1315560 447290.3 0 0 0Water booster pump station (provide after new reservoir built) $250,000
Off site and Major worksRoads
Maymorn Rd upgrade to SH2 $2,122,667 $2,122,667 $2,122,667SH2 / Maymorn road intersection upgrade $1,500,000Parkes Line (within structure plan area) $1,195,898 $1,195,898Parkes Line (from McLaren) to Mangaroa Bridge $1,978,000 $1,978,000 $1,978,000Mangaroa Bridge upgrade $2,000,000Upgrade of existing road underpass (under track) $1,500,000New road underpass (under track) $1,500,000New pedestrian underpass (under track) $600,000Railway Station upgrade and access works $150,000Park & Ride carparking area $222,000Upgrade at McLaren St - flood protection works $800,000
WaterPiped main network - trunk only (main and connector roads)a Replacement of existing pipes: 150mm Φ included in development costsa Replacement of existing pipes: 225mm Φ Parkes Line component included in develoment costs otherwise provide as part of Parkes Line road upgrade worksb Installation of new pipes: 150mm Φ included in development costsb Installation of new pipes: 300mm Φ $191,750 $191,750Minor modifications to existing pump station $50,000 $50,000Reservoir $715,000 $715,000
Wastewatera Replacement of existing gravity pipes 225mm Φ $339,085 $339,085a Replacement of existing gravity pipes 300mm Φ $1,406,200c. Installation of new rising main $169,800Upgrades to pump stations x3 $250,000 $250,000 $250,000
StormwaterProvisional sum for swale connectionsDetention Pond (x5) $600,000 $600,000 $600,000 $600,000 $600,000
Open SpaceReserves (general) $401,605 $126,444 $303,434 $1,681,024 $1,947,956 $899,000 $456,105Land acquisition costs $2,233,110 $656,250 $1,683,165 $3,851,300 $3,190,313 $619,500 $843,800Riparian revegetation $1,000,000Neighbourhood Playground $350,000Pocket park Playground $80,000 $80,000Pathway along historic railway alignment $72,000Public Artworks $100,000
PUBLIC COSTS Private costs $2,163,651 $2,163,651 $2,163,651 $2,609,221 $2,931,875 $2,683,352 $1,646,235 $2,334,424 $2,293,682 $1,315,891 $1,315,891 $1,315,891 $1,315,891 $2,625,465 $3,498,514 $4,451,491 $1,669,867 $1,669,867 $1,646,911 $1,598,128 $1,598,128 $1,598,128 $1,598,128 $1,598,128 $1,737,041 $1,983,997 $1,983,997 $1,983,997 $2,192,086 $2,281,267 $2,441,066 $3,172,069 $6,423,268 $5,283,732 $1,796,469 $0Public costs $1,206,750 $956,750 $2,634,715 $600,000 $862,694 $0 $2,122,667 $2,122,667 $2,122,667 $1,986,599 $0 $0 $0 $1,322,000 $0 $1,500,000 $2,000,000 $0 $3,034,983 $1,784,983 $2,578,000 $2,397,800 $1,978,000 $0 $1,406,200 $6,132,324 $0 $0 $0 $5,218,269 $600,000 $1,518,500 $1,899,905 $0 $3,472,000 $0Running total implementation costs $1,206,750 $2,163,500 $4,798,215 $5,398,215 $6,260,909 $6,260,909 $8,383,576 $10,506,243 $12,628,909 $14,615,508 $14,615,508 $14,615,508 $14,615,508 $15,937,508 $15,937,508 $17,437,508 $19,437,508 $19,437,508 $22,472,491 $24,257,473 $26,835,473 $29,233,273 $31,211,273 $31,211,273 $32,617,473 $38,749,797 $38,749,797 $38,749,797 $38,749,797 $43,968,066 $44,568,066 $46,086,566 $47,986,471 $47,986,471 $51,458,471 $51,458,471Development contributions accumulation $1,498,366 $2,996,732 $4,495,098 $5,993,464 $7,491,830 $8,990,196 $10,488,562 $11,986,928 $13,485,294 $14,983,661 $16,482,027 $17,980,393 $19,478,759 $20,977,125 $22,475,491 $23,973,857 $25,472,223 $26,970,589 $28,468,955 $29,967,321 $31,465,687 $32,964,053 $34,462,419 $35,960,785 $37,459,151 $38,957,517 $40,455,883 $41,954,249 $43,452,615 $44,950,982 $46,449,348 $47,947,714 $49,446,080 $50,944,446 $51,453,890 $51,453,890Surplus / Deficit $291,616 $833,232 -$303,117 $595,249 $1,230,921 $2,729,287 $2,104,986 $1,480,686 $856,385 $368,152 $1,866,518 $3,364,884 $4,863,251 $5,039,617 $6,537,983 $6,536,349 $6,034,715 $7,533,081 $5,996,464 $5,709,848 $4,630,214 $3,730,780 $3,251,146 $4,749,512 $4,841,678 $207,720 $1,706,086 $3,204,453 $4,702,819 $982,916 $1,881,282 $1,861,148 $1,459,609 $2,957,975 -$4,580 -$4,580

MaymornPhasing and Costing Plan23 April 2010
75 Dwellings per annum
Area under development 1c 1c 1c/1b 1b 1b/1a/2b 2b 2b/2a 2a 2a/3 3 3/4 4/7 7 7/8 8 8 8 8/9 9 9 9/10 10/6 6/5/11 11 11Year
1 2 3 4 5 6 7 8 9 10 11 12 13 14 15 16 17 18 19 20 21 22 23 24 25 26Dwellings total 50 125 200 275 350 425 500 575 650 725 800 875 950 1025 1100 1175 1250 1325 1400 1475 1550 1625 1700 1717 1717 1717Annual Rate 50 75 75 75 75 75 75 75 75 75 75 75 75 75 75 75 75 75 75 75 75 75 75 17 0 0Area 1a 44Area 1b 29 75 17Area 1c 50 75 46Area 2b 14 75 23Area 2a 52 75 75 20Area 3 55 26Area 4 16Area 5 28Area 6 32 44Area 7 33 75 59Area 8 16 75 75 75 57Area 9 18 75 75 15Area 10 60 43Area 11 3 75 17
Infrastructure Costs ($)Implemented as part of house building
Roads $1,685,591 $2,528,386 $2,852,174 $3,365,768 $2,189,300 $2,801,603 $1,878,274 $1,469,879 $1,469,879 $3,289,708 $4,753,704 $1,860,012 $1,840,517 $1,768,629 $1,768,629 $1,768,629 $1,867,122 $2,179,017 $2,179,017 $2,454,878 $2,696,899 $5,316,728 $5,952,258 $1,349,178 $0 0Water Supply And Waste $478,060 $717,090 $838,872 $1,032,044 $674,349 $700,033 $564,088 $503,958 $503,958 $1,085,014 $1,447,044 $644,789 $641,328 $628,563 $628,563 $628,563 $668,983 $796,979 $796,979 $877,842 $884,800 $1,636,743 $1,973,340 $447,290 $0 0Water booster pump station (provide to serve area 2) $250,000
Off site and Major worksRoads
Maymorn Rd upgrade to SH2 $2,122,667 $2,122,667 $2,122,667SH2 / Maymorn road intersection upgrade $1,500,000Parkes Line (within structure plan area) $1,195,898 $1,195,898Parkes Line (from McLaren) to Mangaroa Bridge $1,978,000 $1,978,000 $1,978,000Mangaroa Bridge upgrade $2,000,000Upgrade of existing road underpass (under track) $1,500,000New road underpass (under track) $1,500,000New pedestrian underpass (under track) $600,000Railway Station upgrade and access works $150,000Park & Ride carparking area $222,000Upgrade at McLaren St - flood protection works $800,000
WaterPiped main network - trunk only (main and connector roads)a Replacement of existing pipes: 150mm Φ included in development costsa Replacement of existing pipes: 225mm Φ Parkes Line component included in develoment costs otherwise provide as part of Parkes Line road upgrade worksb Installation of new pipes: 150mm Φ included in development costsb Installation of new pipes to & from reservoir: 300&150mm Φ $191,750 $191,750Minor modifications to existing pump station $50,000 $50,000Reservoir $715,000 $715,000
Wastewatera Replacement of existing gravity pipes 225mm Φ $339,085 $339,085a Replacement of existing gravity pipes 300mm Φ $1,406,200c. Installation of new rising main for Valley PS $169,800Upgrades to pump stations x3 $250,000 $250,000 $250,000
StormwaterProvisional sum for swale connectionsDetention Pond (x5) $600,000 $600,000 $600,000 $600,000 $600,000
Open SpaceReserves (general) $401,605 $126,444 $303,434 $1,681,024 $1,947,956 $899,000 $456,105
$2,233,110 $656,250 $1,683,165 $3,851,300 $3,190,313 $619,500 $843,800Riparian revegetation $1,000,000Neighbourhood Playground $350,000Pocket park Playground $80,000 $80,000Pathway along historic railway alignment $72,000Public Artworks $100,000
PUBLIC COSTS Private costs $2,163,651 $3,245,476 $3,691,046 $4,397,812 $3,113,649 $3,501,636 $2,442,362 $1,973,837 $1,973,837 $4,374,722 $6,200,747 $2,504,801 $2,481,845 $2,397,192 $2,397,192 $2,397,192 $2,536,105 $2,975,996 $2,975,996 $3,332,719 $3,581,699 $6,953,471 $7,925,597 $1,796,469 $0 $0Public costs $1,206,750 $956,750 $3,234,715 $2,122,667 $2,985,361 $2,122,667 $0 $1,986,599 $0 $1,322,000 $1,500,000 $2,000,000 $3,034,983 $3,762,983 $2,578,000 $2,397,800 $2,006,200 $0 $5,532,324 $0 $5,138,269 $2,118,500 $1,979,905 $3,472,000 $0 $0Running Total Public implementation costs $1,206,750 $2,163,500 $5,398,215 $7,520,882 $10,506,243 $12,628,909 $12,628,909 $14,615,508 $14,615,508 $15,937,508 $17,437,508 $19,437,508 $22,472,491 $26,235,473 $28,813,473 $31,211,273 $33,217,473 $33,217,473 $38,749,797 $38,749,797 $43,888,066 $46,006,566 $47,986,471 $51,458,471 $51,458,471 $51,458,471Development contributions accumulation $1,498,366 $3,745,915 $5,993,464 $8,241,013 $10,488,562 $12,736,111 $14,983,661 $17,231,210 $19,478,759 $21,726,308 $23,973,857 $26,221,406 $28,468,955 $30,716,504 $32,964,053 $35,211,602 $37,459,151 $39,706,700 $41,954,249 $44,201,799 $46,449,348 $48,696,897 $50,944,446 $51,453,890 $51,453,890 $51,453,890Surplus / Deficit $291,616 $1,582,415 $595,249 $720,131 -$17,680 $107,202 $2,354,751 $2,615,701 $4,863,251 $5,788,800 $6,536,349 $6,783,898 $5,996,464 $4,481,031 $4,150,580 $4,000,329 $4,241,678 $6,489,227 $3,204,453 $5,452,002 $2,561,282 $2,690,331 $2,957,975 -$4,580 -$4,580 -$4,580
Development / Financial Contribution (All Public Costs)Total public infrastructure costs $51,458,471
Total dwellings 1717Proposed Contribution Levels $29,967

Appendix 3
Proportion of Residential Development per Lot

Table 10: Proportion of development land per lot (rough estimates) (low values highlighted) Land use (ha)
Residential Lot
26dw/ha 20dw/ha 10dw/ha 4dw/ha Park Primary
school Train
Station
Proportion of land
developed commercially
Lot 3 DP 44200 0.0 0.0 0.0 0.2 0.0 0.0 0.0 100%
Lot 1 DP 369486 0.1 0.0 0.0 2.3 0.6 0.0 0.0 79%
Lot 2 DP 74415 2.4 0.0 0.0 0.1 1.2 1.8 0.0 46%
Lot 2 DP 88968 0.1 0.0 0.0 0.0 0.0 0.0 0.2 27%
Lot 2 DP 89856 0.0 0.4 3.1 2.8 1.5 0.0 0.0 81%
Lot 3 DP 74415 3.1 0.0 0.0 0.0 1.1 0.0 0.0 73%
Lot 3 DP 88968 0.1 0.0 0.0 0.0 0.0 0.0 0.0 100%
Lot 4 DP 88968 0.2 0.0 0.0 0.0 0.2 0.0 0.1 32%
Lot 1 DP 21492 0.0 1.1 0.0 0.0 0.0 0.0 0.0 100%
Lot 1 DP 27917 0.0 0.1 0.0 0.0 0.0 0.0 0.0 100%
Lot 1 DP 304613 0.0 0.0 0.0 1.0 0.0 0.0 0.0 99%
Lot 1 DP 306509 0.0 0.8 0.0 0.7 4.0 0.0 0.0 26%
Lot 1 DP 329859 0.0 0.0 0.0 1.0 0.0 0.0 0.0 100%
Lot 1 DP 33009 0.0 0.0 0.0 0.0 0.0.1 0.0 0.0 0%
Lot 1 DP 60636 0.0 0.0 0.3 0.4 0.1 0.0 0.0 93%
Lot 1 DP 65963 0.0 0.3 0.0 0.0 0.0 0.0 0.0 100%
Lot 1 DP 79380 0.0 0.0 0.0 0.0 0.0 0.0 0.0 100%
Lot 2 DP 304613 0.0 0.0 0.0 1.1 0.1 0.0 0.0 94%
Lot 2 DP 329859 0.0 0.0 0.0 1.0 0.0 0.0 0.0 100%
Lot 2 DP 65963 0.0 0.7 0.0 0.1 0.0 0.0 0.0 100%
Lot 2 DP 90324 0.0 0.5 0.0 0.3 0.0 0.0 0.0 100%
Lot 3 DP 329859 0.0 0.0 0.0 1.0 0.0 0.0 0.0 100%
Lot 3 DP 65963 0.0 0.1 0.0 0.0 0.0 0.0 0.0 100%
Lot 4 DP 329859 0.0 0.0 0.0 0.6 0.4 0.0 0.0 63%
Lot 4 DP 356512 0.0 0.0 0.0 0.2 0.4 0.0 0.0 37%
Lot 4 DP 65963 0.0 0.0 0.0 0.0 0.0 0.0 0.0 100%
Lot 4 DP 90324 0.0 0.0 1.3 0.0 0.2 0.0 0.0 88%
Lot 1 DP 337554 0.0 0.3 1.6 0.3 0.0 0.0 0.0 100%
Lot 2 DP 369486 0.0 0.0 0.0 1.0 0.0 0.0 0.0 99%
Lot 3 DP 356512 0.0 0.0 0.0 0.9 0.1 0.0 0.0 91%
Lot 3 DP 356631 0.0 0.0 0.0 0.9 0.1 0.0 0.0 91%
Lot 4 DP 356631 0.0 0.0 0.0 0.5 0.0 0.0 0.0 100%
Lot 5 DP 356631 0.0 0.0 0.0 1.0 0.0 0.0 0.0 100%
Lot 6 DP 397907 0.0 0.1 0.3 1.8 0.7 0.0 0.0 77%
Lot 6 DP 74415 0.0 0.0 0.0 5.0 0.0 0.0 0.0 100%
Lot 7 DP 74415 0.0 0.0 0.0 0.8 0.0 0.0 0.0 100%

Land use (ha)
Residential Lot
26dw/ha 20dw/ha 10dw/ha 4dw/ha Park Primary
school Train
Station
Proportion of land
developed commercially
Pt Sec 298 Hutt DIST 0.0 0.0 0.0 0.4 0.0 0.0 0.0 100%
Lot 1 DP 356631 0.3 0.0 0.0 1.7 0.0 0.0 0.0 100%
Lot 1 DP 66647 0.0 0.1 0.0 0.0 0.0 0.0 0.0 100%
Lot 1 DP 77952 0.0 0.0 0.0 0.0 0.0 0.0 0.0 100%
Lot 17 DP 397907 0.0 0.5 0.9 0.8 12.0 0.0 0.0 16%
Lot 2 DP 397907 0.0 1.1 0.0 0.0 0.0 0.0 0.0 100%
Lot 3 DP 397907 0.0 0.7 0.0 0.0 0.0 0.0 0.0 100%
Lot 4 DP 397907 0.0 0.6 0.1 0.0 0.0 0.0 0.0 100%
Lot 5 DP 397907 0.0 0.1 0.5 0.2 0.0 0.0 0.0 100%
Lot 6 DP 66647 0.0 0.3 0.0 0.0 0.2 0.0 0.0 55%
Lot 7 DP 397907 0.0 0.0 0.2 0.0 0.7 0.0 0.0 22%
Pt Sec 543 Hutt DIST 0.0 1.9 0.0 0.0 1.1 0.0 0.0 64%
Lot 2 DP 63378 0.7 1.4 0.0 0.0 0.0 0.0 0.0 100%
Lot 3 DP 85312 0.0 2.6 0.0 0.0 0.0 0.0 0.0 100%
Pt Sec 1 SO 30094 0.0 0.0 0.0 0.0 0.0 0.0 0.0 100%
Pt Sec 787 Hutt DIST 0.0 0.0 0.0 0.0 0.0 0.0 0.0 100%
Sec 804 Hutt DIST 0.0 0.6 0.0 0.2 0.0 0.0 0.0 100%
Lot 1 DP 349733 0.0 0.9 0.0 0.0 0.0 0.0 0.0 100%
Lot 1 DP 356697 0.0 0.0 0.4 0.0 0.0 0.0 0.0 100%
Lot 1 DP 362345 0.0 0.0 2.7 0.9 0.2 0.0 0.0 95%
Lot 1 DP 85312 1.0 0.0 0.0 0.0 0.0 0.0 0.0 100%
Lot 1 DP 88968 0.0 0.0 0.0 0.0 0.0 0.0 0.1 2%
Lot 1 DP 89856 0.0 0.0 3.1 0.8 0.0 0.0 0.0 100%
Lot 2 DP 306509 0.1 2.4 0.0 0.0 0.8 0.0 0.0 76%
Lot 2 DP 66649 0.0 2.4 0.0 0.2 2.9 0.0 0.0 47%
Lot 2 DP 71236 0.0 3.9 0.0 3.0 0.0 0.0 0.0 100%
Lot 2 DP 75041 0.4 0.0 0.0 0.0 0.0 0.0 0.0 100%
Lot 2 DP 85312 0.0 2.2 0.0 0.0 0.0 0.0 0.0 100%
Lot 3 DP 66647 0.0 0.1 0.0 0.0 0.0 0.0 0.0 100%
Lot 4 DP 66647 0.0 0.1 0.0 0.0 0.0 0.0 0.0 100%
Lot 4 DP 75041 0.3 0.0 0.0 0.0 0.0 0.0 0.0 100%
Lot 4 DP 85312 2.3 0.8 0.0 0.0 0.0 0.0 0.0 98%
Lot 5 DP 66647 0.0 0.5 0.0 0.0 0.0 0.0 0.0 100%
Lot 7 DP 88968 0.1 0.0 0.0 0.0 0.0 0.0 0.0 100%
Sec 1 SO 23999 0.0 0.0 0.0 0.4 0.1 0.0 0.0 85%
Lot 1 DP 356512 0.0 0.0 0.0 0.5 0.0 0.0 0.0 94%
Lot 2 DP 349733 0.0 0.6 0.0 0.4 0.0 0.0 0.0 100%

Land use (ha)
Residential Lot
26dw/ha 20dw/ha 10dw/ha 4dw/ha Park Primary
school Train
Station
Proportion of land
developed commercially
Lot 2 DP 356512 0.0 0.0 0.0 0.5 0.0 0.0 0.0 97%
Lot 2 DP 397544 0.0 0.0 0.0 0.9 0.0 0.0 0.0 100%
Lot 3 DP 306509 0.0 5.6 0.0 1.3 0.0 0.0 0.0 100%
Lot 4 DP 397544 0.0 0.0 0.0 1.0 0.0 0.0 0.0 100%
Lot 4 DP 89856 0.0 0.0 0.0 0.5 0.3 0.0 0.0 64%
Lot 5 DP 397544 0.0 0.0 0.0 0.9 0.0 0.0 0.0 100%
Lot 7 DP 397544 0.0 0.0 0.0 0.6 0.0 0.0 0.0 100%
Lot 1 DP 397544 0.0 0.0 0.0 0.1 0.0 0.0 0.0 100%
Lot 1 DP 44200 0.0 0.5 0.0 0.5 0.0 0.0 0.0 100%
Lot 3 DP 397544 0.0 0.0 0.0 0.8 0.0 0.0 0.0 100%
Lot 6 DP 397544 0.0 0.0 0.0 0.5 0.0 0.0 0.0 100%
Lot 8 DP 397544 0.0 0.0 0.0 0.3 0.0 0.0 0.0 100%
Lot 8 DP 397907 0.0 0.0 0.2 0.0 0.7 0.0 0.0 20%
Lot 9 DP 397907 0.0 0.0 0.3 0.0 0.7 0.0 0.0 28%
Lot 1 DP 69860 0.0 0.5 0.0 0.0 0.0 0.0 0.0 100%
Lot 1 DP 75041 0.5 0.0 0.0 0.0 0.1 0.0 0.0 77%
Lot 2 DP 66647 0.0 0.1 0.0 0.0 0.0 0.0 0.0 100%
Lot 2 DP 77952 0.0 0.0 2.1 1.2 0.0 0.0 0.0 100%
Lot 3 DP 77952 0.0 0.0 2.6 0.9 0.5 0.0 0.0 87%
Lot 3 DP 89856 0.0 0.0 0.0 0.5 0.0 0.0 0.0 100%
Lot 3 DP 79380 0.0 0.0 0.0 0.0 0.0 0.0 0.0 90%
Pt Lot 1 DP 47840 0.0 0.0 0.1 0.0 0.2 0.0 0.0 48%
Lot 2 DP 356697 2.3 8.3 0.0 0.0 4.1 0.0 0.0 72%
Lot 2 DP 79380 0.0 0.0 0.0 0.0 0.0 0.0 0.0 100%
Pt Sec 299 Hutt DIST 3.5 26.8 11.7 0.2 0.7 0.0 0.0 98%