Maybank Indonesia · •Highest PATAMI for Maybank Indonesia in its ... statements is accordance...
52
Maybank Indonesia Financial Results Full Year 2016 ended 31 December 2016 Jakarta, 16 February 2017
Transcript of Maybank Indonesia · •Highest PATAMI for Maybank Indonesia in its ... statements is accordance...

Maybank Indonesia
Financial Results
Full Year 2016 ended 31 December 2016
Jakarta, 16 February 2017
Page 2
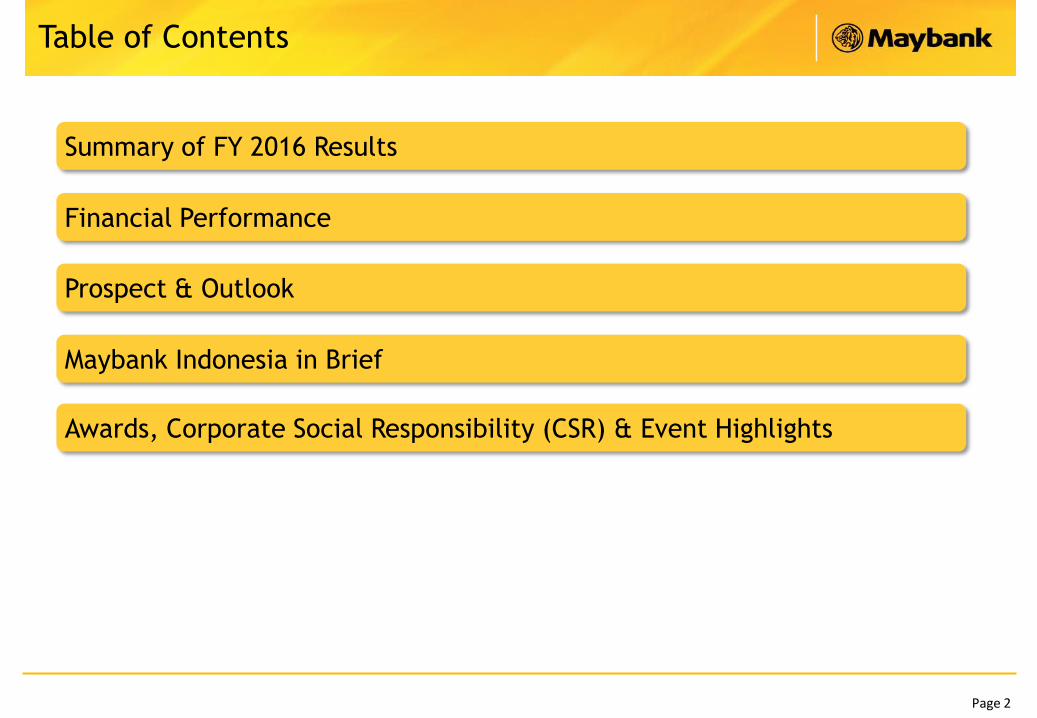
Financial Performance
Prospect & Outlook
Summary of FY 2016 Results
Table of Contents
Awards, Corporate Social Responsibility (CSR) & Event Highlights
Maybank Indonesia in Brief

Summary of FY 2016 Results(All numbers are consolidated and according to Bank Indonesia classification unless otherwise stated)

Page 4
Record FY2016 Financial Performance amidst Challenging Operating EnvironmentHigher Income, positive JAWS and improved cost to income & return ratio (1/2)
PATAMI
Rp 1.9 trillion
71.0%
• Significant increase in PATAMI by 71.0% (YoY) driven by robust income growth due mainly to
improvement in NIM (arising from close liquidity management) and continued control on
operating expenses.
• Highest PATAMI for Maybank Indonesia in its history
• The effective cost management efforts have resulted in limiting growth in operating expenses
to 1.7%
• Continued improvement of its Cost to Income ratio to 52.88% in 2016 from 55.06% in 2015 and
maintained positive JAWS
• ROE improved to 11.85% from 8.47% in 2015
• ROA improved to 1.60% from 1.08% in 2015
• Global Banking grew 20.0% (YoY) as the re-pofiling of the corporate customer base has started
to show results
• CFS (Community Financial Services) reduced slightly by 1.2%
Business Banking grew by 12.3% (YoY)
Retail portfolio decreased by 14.9% (YoY) in line with reduction in consumer spending
• Gross NPL improved to 3.42% in 2016 from 3.67% in 2015
• Total customer deposits stood at Rp118.9 trillion with 3.0% (YoY) growth
• Current Account grew 26.5% (YoY) from Rp16.2 trillion to Rp20.4 trillion
• CASA ratio reached 38.71% in 2016 from 36.16% in 2015
• Bank‟s Loan-to-Deposit Ratio (LDR – bank only) stood at a healthy 88.92%
• Loan-to-Funding Ratio (bank only) is at 88.24%
• LCR is at 149.62%
1
Loans
Rp 115.7 trillion
Deposits
Rp 118.9 trillion
3.0%
2
3
2.9%
Update

Page 5
• TOP among UUS and Rank 5 in Shariah Banking Industry (based on Nov 2016 industry data)
• Shariah Banking continued to demonstrate its strong performance throughout 2016:
Assets grew 45.3% (YoY) from Rp16.0 trillion to Rp23.2 trillion, contributed 13.9% to Bank‟s
assets
Financing increased by 61.2% (YoY) to Rp14.0 trillion, contributed 12.1% to Bank‟s loans
Deposit increased by 70.9% (YoY) to Rp10.9 trilion, contributed 9.2% to the Bank‟s deposits
Shariah Assets
Rp23.2 trillion
45.3%
4
• Total Assets increased by 5.7% (YoY) to Rp166.7 trillion
• Stronger capital position with CAR as per 31 December 2016 at 16.77% with CAR Tier1 at
13.27%.&
5
• On 11 January 2017, Maybank Indonesia has signed a Conditional Share Purchase Agreement
(CSPA) to divest the entire 68.55% stake in PT Wahana Ottomitra Multiartha Tbk (WOM
Finance) to PT Reliance Capital Management (RCM). Currently in the process of waiting for
completion of conditions precedent including regulatory approvals.
• The above corporate action is in line with streamlining our customer segment and optimizing
capital use in line with the renewed perspective of the Bank on its different customer
segments
Subsequent
Event
6
Record FY2016 Financial Performance amidst Challenging Operating EnvironmentHigher Income, positive JAWS and improved cost to income & return ratio (2/2)
Capital ( 20.8% )
Assets ( 5.7% )
Financial Performance
Subsequent event note:
Due to the proposed disposal of WOM (CSPA signed on 11 January 2017), the presentation of
the 2016 audited consolidated financial statements is accordance with PSAK 58 equivalent to
IFRS 5 : Non-current Assets Held for Sale and Discontinued Operations

Page 7
Stronger & More Efficient Balance Sheet
Data source : Published Report
Rp Billion a b (a/b)-1
Loans 115,736 112,529 2.9%
Other Earning Assets 26,333 26,567 -0.9%
Other Assets 18,188 18,523 -1.8%
Assets Classified as Held-for-Sale 6,423 0 N/A
Total Assets 166,679 157,619 5.7%
Deposits from Customer 118,932 115,486 3.0%
- Current Account 20,438 16,158 26.5%
- Saving Account 25,604 25,600 0.0%
- Time Deposit 72,889 73,729 -1.1%
Deposits from Other Banks 2,811 3,348 -16.1%
Borrowing 2,350 4,275 -45.0%
Securities Issued 5,337 7,133 -25.2%
Subordinated Debt 5,287 4,487 17.8%
Other Liabilities 6,954 7,145 -2.7%
Liabilities Classified as Held-for-Sale 5,735 0 N/A
Total Liabilities 147,406 141,876 3.9%
Reserve Classified as Held-for-Sale (5) 0 N/A
Equity (excl. Non-Controlling Interest) 19,016 15,506 22.6%
Non-Controlling Interest 256 238 7.9%
Total Equity 19,273 15,743 22.4%
Dec-16
(Published)
Dec-15
(Published)YoYFinancial Position - Consolidated

Page 8
Income Statement - ConsolidatedDec-16
(Published)
Dec-15
(Published)YoY
Rp Billion a b (a/b)-1
Interest Income 13,546 12,923 4.8%
Interest Expense (6,939) (6,962) -0.3%
Net Interest Income 6,608 5,961 10.8%
Non Interest Income 1,967 2,135 -7.9%
Gross Operating Income 8,575 8,097 5.9%
Personnel (2,039) (1,954) 4.3%
General & Administrative (2,493) (2,497) -0.2%
Other Operating Expenses (3) (7) -61.1%
Operating Expenses (excl. Provisions) (4,534) (4,458) 1.7%
Operating Income before Provisions 4,041 3,638 11.1%
Provisions (1,595) (1,979) -19.4%
Operating Income After Provision 2,446 1,659 47.4%
Non Operating Income / (Expenses) 165 (15) 1200.4%
Profit Before Tax & Minority Interest 2,611 1,644 58.8%
Income from discontinued operations 33 (102) 132.4%
Tax & Minority Interest (695) (403) 72.6%
Profit After Tax & Minority Interest (PATAMI) 1,948 1,139 71.0%
Robust Financial PerformanceOperating Income before provisions up by 11.1% driven by stronger balance sheet,
NIM improvement and cost management
Data source : Published Report
• The above are presented in accordance with OJK regulation No.32/POJK.03/2016
• Quarterly proforma, in accordance with the accounting classification is on next slide
Update
Page 9
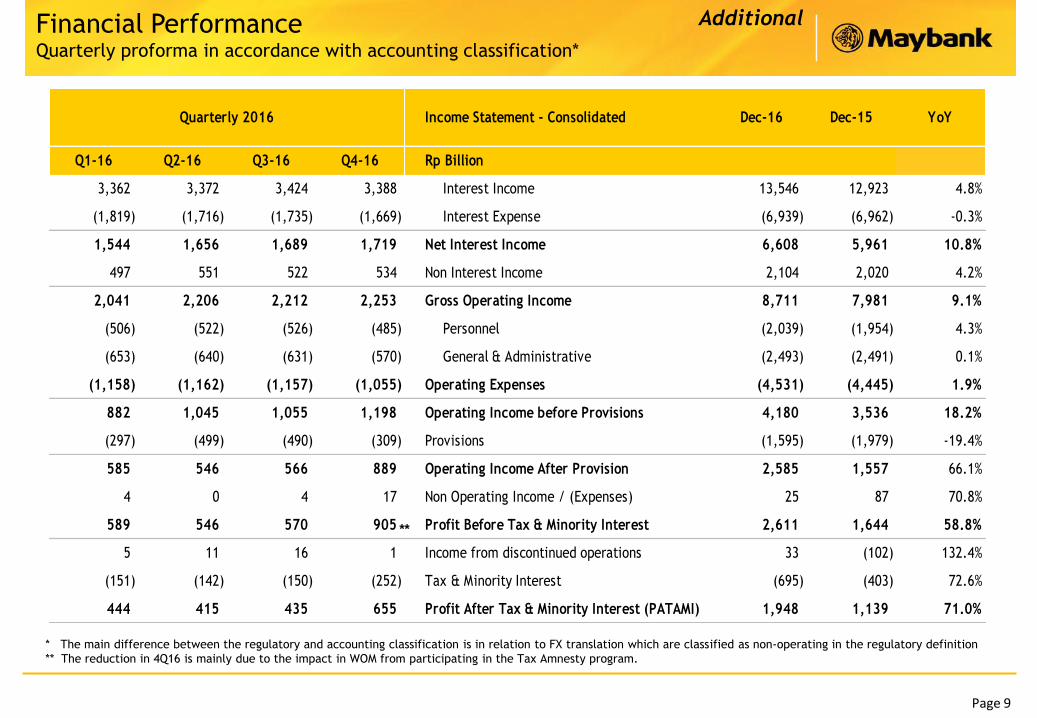
Income Statement - Consolidated Dec-16 Dec-15 YoY
Q1-16 Q2-16 Q3-16 Q4-16 Rp Billion
3,362 3,372 3,424 3,388 Interest Income 13,546 12,923 4.8%
(1,819) (1,716) (1,735) (1,669) Interest Expense (6,939) (6,962) -0.3%
1,544 1,656 1,689 1,719 Net Interest Income 6,608 5,961 10.8%
497 551 522 534 Non Interest Income 2,104 2,020 4.2%
2,041 2,206 2,212 2,253 Gross Operating Income 8,711 7,981 9.1%
(506) (522) (526) (485) Personnel (2,039) (1,954) 4.3%
(653) (640) (631) (570) General & Administrative (2,493) (2,491) 0.1%
(1,158) (1,162) (1,157) (1,055) Operating Expenses (4,531) (4,445) 1.9%
882 1,045 1,055 1,198 Operating Income before Provisions 4,180 3,536 18.2%
(297) (499) (490) (309) Provisions (1,595) (1,979) -19.4%
585 546 566 889 Operating Income After Provision 2,585 1,557 66.1%
4 0 4 17 Non Operating Income / (Expenses) 25 87 70.8%
589 546 570 905 Profit Before Tax & Minority Interest 2,611 1,644 58.8%
5 11 16 1 Income from discontinued operations 33 (102) 132.4%
(151) (142) (150) (252) Tax & Minority Interest (695) (403) 72.6%
444 415 435 655 Profit After Tax & Minority Interest (PATAMI) 1,948 1,139 71.0%
Quarterly 2016
Financial PerformanceQuarterly proforma in accordance with accounting classification*
* The main difference between the regulatory and accounting classification is in relation to FX translation which are classified as non-operating in the regulatory definition
** The reduction in 4Q16 is mainly due to the impact in WOM from participating in the Tax Amnesty program.
**
Additional

Page 10
Significant improvement in Key Financial Ratios
Data source : Published Report
Key Operating RatioDec-16
(Published)
Dec-15
(Published)Key Operating Ratio
Dec-16
(Published)
Dec-15
(Published)
Consolidated a b (a-b) Bank Only a b (a-b)
Profitability Profitability
Return On Assets 1.60% 1.08% 0.52% Return On Assets 1.48% 0.84% 0.64%
Return On Equities (Tier 1) 11.85% 8.47% 3.38% Return On Equities (Tier 1) 11.84% 7.52% 4.32%
Net Interest Margin 4.61% 4.45% 0.16% Net Interest Margin 4.59% 4.46% 0.13%0.00% 0.00% 0.00% 0.00%
Efficiency & Productivity Ratio Efficiency & Productivity Ratio
Cost to Income Ratio 52.88% 55.06% -2.18% Cost to Income Ratio 54.62% 58.19% -3.57%
BOPO 84.36% 89.18% -4.82% BOPO 85.81% 91.70% -5.89%0.00% 0.00% 0.00% 0.00%
Earning Asset Quality Earning Asset Quality
Impaired Loans - Gross 3.54% 3.83% -0.28% Impaired Loans - Gross 3.70% 3.98% -0.28%
Impaired Loans - Net 2.31% 2.59% -0.28% Impaired Loans - Net 2.40% 2.73% -0.33%
NPL - Gross 3.42% 3.67% -0.25% NPL - Gross 3.58% 3.81% -0.23%
NPL - Net 2.28% 2.42% -0.14% NPL - Net 2.37% 2.55% -0.18%
Balance Sheets Structure Balance Sheets Structure
LDR 94.14% 94.44% -0.30% LDR 88.92% 86.14% 2.78%
LFR *) 89.72% 90.60% -0.88% LFR *) 88.24% 85.13% 3.11%
LCR 144.33% 201.00% -56.67% LCR 149.62% 213.00% -63.38%
CASA to Total Funding 38.71% 36.16% 2.56% CASA to Total Funding 38.92% 36.51% 2.41%
CAR 16.77% 15.17% 1.60% CAR 16.98% 14.93% 2.05%
*) LFR calculation as per BI regulation No. 17/11/PBI/2015

Page 11
LFR & Total Loans (as reported)
Loans Composition by Business Segment
Loan Portfolio Breakdown
Loans Composition Based on Currency
Loans (1/2)Global Banking recorded strong loans growth as a result of re-aligning and re-profiling of
its portfolio that has been implemented by the Bank in the last two years.
Rp TrillionRp Trillion
Δ YoY : 2.9%
116.4112.5 115.7112.9 117.5
Rp Trillion Dec-16 Sep-16 Dec-15 YoY QoQ
Global Banking 25.7 21.9 21.5 20.0% 17.8%
Business Banking 51.5 49.7 45.9 12.3% 3.7%
Commercial 30.3 28.9 26.7 13.4% 4.9%
SME 20.3 19.8 17.8 14.1% 2.5%
Micro 0.9 1.0 1.4 -33.8% -9.6%
Retail Banking 38.4 44.8 45.2 -14.9% -14.3%
Auto Loan 17.1 22.8 23.0 -25.6% -25.0%
Mortgage 17.8 18.3 18.1 -1.9% -2.5%
CC + Personal Loan 3.1 3.3 3.5 -12.7% -6.7%
Other loan 0.5 0.5 0.5 -9.7% -2.1%
Total 115.7 116.4 112.5 2.9% -0.6%
Update
Page 12
21.5 21.5 22.9 21.9 25.7
91.1 91.3 94.6 94.5 96.0
112.5 112.9 117.5 116.4 121.8
Dec-15 Mar-16 Jun-16 Sep-16 Dec-16
Global Banking CFS
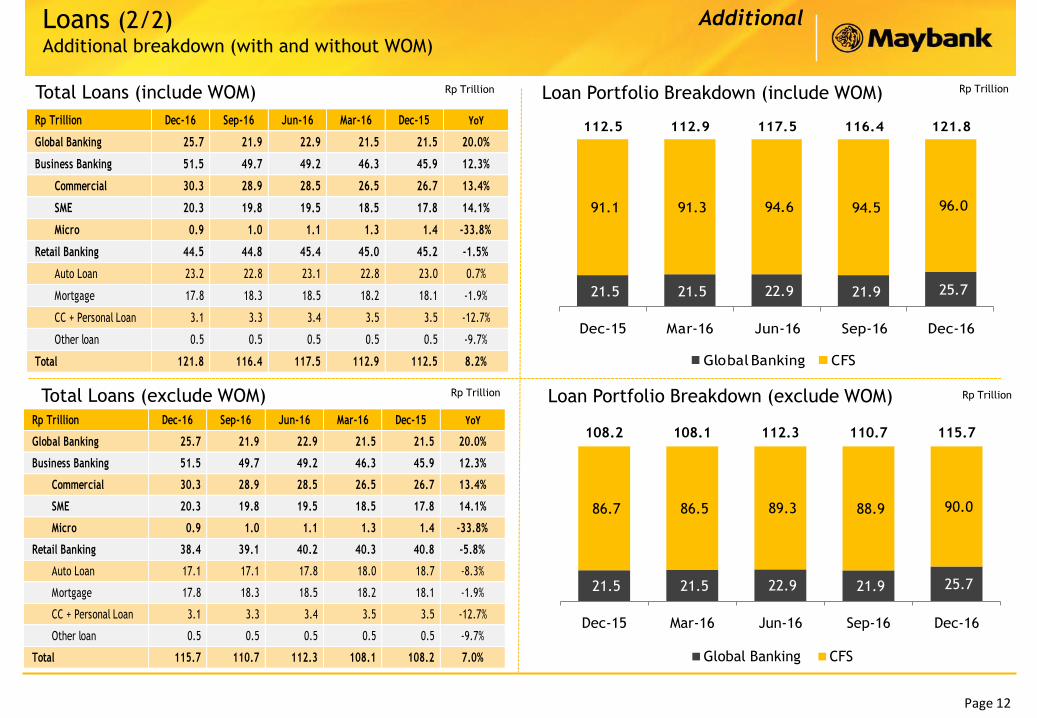
Total Loans (include WOM) Loan Portfolio Breakdown (include WOM)
Loans (2/2)Additional breakdown (with and without WOM)
Rp TrillionRp Trillion
Rp Trillion Dec-16 Sep-16 Jun-16 Mar-16 Dec-15 YoY
Global Banking 25.7 21.9 22.9 21.5 21.5 20.0%
Business Banking 51.5 49.7 49.2 46.3 45.9 12.3%
Commercial 30.3 28.9 28.5 26.5 26.7 13.4%
SME 20.3 19.8 19.5 18.5 17.8 14.1%
Micro 0.9 1.0 1.1 1.3 1.4 -33.8%
Retail Banking 44.5 44.8 45.4 45.0 45.2 -1.5%
Auto Loan 23.2 22.8 23.1 22.8 23.0 0.7%
Mortgage 17.8 18.3 18.5 18.2 18.1 -1.9%
CC + Personal Loan 3.1 3.3 3.4 3.5 3.5 -12.7%
Other loan 0.5 0.5 0.5 0.5 0.5 -9.7%
Total 121.8 116.4 117.5 112.9 112.5 8.2%
Total Loans (exclude WOM) Loan Portfolio Breakdown (exclude WOM) Rp TrillionRp Trillion
Rp Trillion Dec-16 Sep-16 Jun-16 Mar-16 Dec-15 YoY
Global Banking 25.7 21.9 22.9 21.5 21.5 20.0%
Business Banking 51.5 49.7 49.2 46.3 45.9 12.3%
Commercial 30.3 28.9 28.5 26.5 26.7 13.4%
SME 20.3 19.8 19.5 18.5 17.8 14.1%
Micro 0.9 1.0 1.1 1.3 1.4 -33.8%
Retail Banking 38.4 39.1 40.2 40.3 40.8 -5.8%
Auto Loan 17.1 17.1 17.8 18.0 18.7 -8.3%
Mortgage 17.8 18.3 18.5 18.2 18.1 -1.9%
CC + Personal Loan 3.1 3.3 3.4 3.5 3.5 -12.7%
Other loan 0.5 0.5 0.5 0.5 0.5 -9.7%
Total 115.7 110.7 112.3 108.1 108.2 7.0%
21.5 21.5 22.9 21.9 25.7
86.7 86.5 89.3 88.9 90.0
108.2 108.1 112.3 110.7 115.7
Dec-15 Mar-16 Jun-16 Sep-16 Dec-16
Global Banking CFS
Additional

Page 13
3.83% 3.82% 3.79% 3.90%3.54%
2.59% 2.56% 2.42% 2.32% 2.31%
Dec-15 Mar-16 Jun-16 Sep-16 Dec-16
Impaired Loans - Gross Impaired Loans - Net
Asset QualityOverall improvement in asset quality. However the Bank remains cautious over loan quality
as businesses are still impacted by the current economic slow down
Asset Quality – Maybank Indonesia Impaired Loans (consolidated)
The Bank‟s consolidated NPL level was lower at 3.42%
(gross) and 2.28% (net) in 2016 compared to 3.67% (NPL
gross) and 2.42% (NPL net) in the previous year.
The Bank continued to manage exposures from corporate
accounts that had led to the increase in Non-Performing
Loans (NPL) level and has actively carried out the
restructuring of those accounts.
Amidst challenging business conditions in the automotive
industry, Maybank Finance‟s gross NPL & net NPL
remained stable
0.29% 0.36% 0.36% 0.34% 0.32%
0.35%0.45% 0.44% 0.42%
0.39%
Dec-15 Mar-16 Jun-16 Sep-16 Dec-16
NPL Net NPL Gross
Asset Quality – Maybank Finance
3.67% 3.72% 3.68%3.97%
3.42%
2.42% 2.45% 2.33% 2.40%2.28%
Dec-15 Mar-16 Jun-16 Sep-16 Dec-16
NPL - Gross NPL - Net
Asset Quality – Maybank Indonesia NPL (consolidated)

Page 14
45.3% 47.1%51.4%
55.7%
48.9%
48.9% 49.9%54.7%
56.6%
52.3%
Loan loss coverage (LLC) - GIL
Loan loss coverage (LLC) - NPL
54.9%
1,864 1,940 2,181
2,404
1,985
Dec'15 Mar'16 Jun'16 Sep'16 Dec'16
Allowance for losses on loans
58.3%
Gross NPLLoan
IA+CA 100% of MarketValue(MV)
40% MVDiscount
Loan Loss Coverage
Gross Impaired
Loan
IA+CA 100% of MarketValue(MV)
40% MVDiscount
Collateral Coverage Dec’16 for Impaired Loan
Collateral Coverage Dec’16 for NPL Loan
49.9%
83.1%
48.9%
Covered byCollaterals}
52.3%
54.0%89.9%
Covered byCollaterals}1)
Allowance for losses on loans
• Collateral includes
Cash, Land & Building
(L&B), equipment,
vehicle and vessel.
• Market value of L&B,
equipment, and vehicle
are capped at the
outstanding amount.
• Typically, the L&B
values are far in excess
of the outstanding
amounts but these are
not taken into
consideration in these
charts.
• Based on experience,
the realizable value of
collateral (except cash)
is 60 – 70% from the
market value.
1) Impaired loan is computed based on local reporting purposes
2) Position before write-off of a few significant impaired accounts in 4Q2016
2)
2)

Page 15
Deposits from Customers by Business Segment Deposits from Customers by Type
Customer DepositsRobust funding position through increased customer deposits
Rp Trillion Dec-16 Sep-16 Dec-15 YoY QoQ
Current Account 20.4 18.8 16.2 26.5% 8.4%
Saving Account 25.6 25.3 25.6 0.0% 1.0%
Time Deposit 72.9 71.4 73.7 -1.1% 2.1%
Total 118.9 115.6 115.5 3.0% 2.9%
CASA Ratio 38.71% 38.22% 36.16% 2.6% 0.5%
Rp Trillion Dec-16 Sep-16 Dec-15 YoY QoQ
Global Banking 28.5 28.6 26.7 6.9% -0.2%
CFS 90.4 87.0 88.8 1.8% 3.9%
Total 118.9 115.6 115.5 3.0% 2.9%

Page 16
Fee Income
Rp Billion
1,967
2,135
Fee Based Income In Rp Million Dec-16 Dec-15
Consumer Financing 79 64
Retail Administration 148 215
Loan Administration 222 196
Collection of receivables previously written-off 63 36
Banking Services and Trade Finance 117 113
Treasury - Forex 90 300
Treasury - Fixed Income 110 15
Arranger & Syndication Fees 134 147
Other Fees & Commisions 1,005 1,049
Total Fee Income 1,967 2,135

Page 17
Strong Capital Position
• CAR as per 31 December 2016 at 16.77% with CAR Tier 1 at 13.27%.

Community Financial Services (CFS)
FY2016 Results

Page 19
18.1 17.8
23.0 17.1
4.0 3.5
Dec-15 Dec-16
Mortgage Auto Loan Others
45.9 51.5
Dec-15 Dec-16
Community Financial Services: Overview of Loans Portfolio
Business Banking loans grew by 12.3% YoY
Business Banking loans grew by 12.3% (2015: 12.5%) to
Rp51.5 trillion, with a slight drop in asset quality with GIL
at 1.77% (2015: 1.23%).
Small and Medium Enterprises (SME) / UKM sector recorded
strong loan growth of 14.1% (2015: 8.6%). Quality improved
with GIL at 1.57% (2015: 1.65%). As of Dec 2016, the
contributions of Small and Medium Enterprises reached
23.74% of the Bank‟s total loans, surpassing minimum
target set by the government of 20% by 2018.
However, Retail Banking loans decreased by 14.9% to
Rp38.4 trillion.
Rp Trillion
Retail Banking loans decreased by 14.9% YoY
-14.9%Rp Trillion
1.38%
1.58%1.23%
1.77%
Dec-15 Dec-16
Retail Banking Business Banking
Asset Quality
% Impaired Ratio
45.2 38.4
12.3%
Update

Page 20
Efficient Margin Management through Portfolio Control
Optimized portfolio management
Despite the tightening of liquidity condition in the market,
the bank has managed to improve the cost of funding by
reducing dependencies on expensive deposits, as reflected in
the NII growth YoY
Product/
Services
Coverage
PRO Well established customer, Businessman/woman
GOLD Business/Entrepreneur SA
WOMAN ONE Career Woman, Entrepreneur and Housewives
SUPER KIDZ Children/Students below 17 years old
REGULER General Customers
MYPLAN Monthly Saving for future plan
FCY SAVING Business & mass segment
Dec 2015 Dec 2016
826
950
15%
Net Interest Income (NII)
Rp Billion

Page 21
Continuous enhancement on e-banking features have increased both
users and number of transactions consistently
Maybank SMS+ Mobile Banking
Maybank M2U Internet Banking
Maybank consistently promote and enhance
its e-banking services to provide customer
transaction convenience, and migrate
customer transaction to digital channel.
39% 41%
12%35%
Number of Users
Number of Users

Page 22
“Leading in financial services
to communities’ ecosystem
holistically through multi
channels to build towards
sustainable economy”
Community Financial Services
Going Forward Strategy
Accelerate fee income growth through diversification revenue stream
Loan growth with capital efficient strategy and improving asset quality
Focus on Digital channel to activate and increase customers transaction activities through Maybank.

Global Banking
FY2016 Results

Page 24
14.9%10.5%
Dec 15 Dec 16
8.8 14.4
12.7
11.3
21.5
25.7
Dec 15 Dec 16
Global Banking
Loans(Rp Trillion)
FCY
LCY
20%
-4.4%
Continue scaling up the business - Drive quality growth
differentiated by “Shariah First” strategy and ASEAN theme
Build sustainable flow business to drive CASA and fee based
business to widen revenue base and to the increase the fee
ratio
Key Initiatives 2017
Improvement in productivity metrics especially PBT/staff
cost
Cultural change to deliver best in class client service
proposition
1
2
3
4
A number of key deals were successfully closed in 2016
resulting in an asset growth of 20% YoY more than twice the
industry growth of 7.6%
Succesfully added new corporates to the Bank‟s corporate
portfolio which is in line with our strategy on re-shifting the
portfolio towards top-tier clients
The CASA balance grew 41% YoY which led to an improvement
in the CASA ratio from 16% to 21%
GIL improved to 10.5% level, reduced significantly from 14.9%
level last year, due to restructuring efforts and write-offs of a
few Non-performing loans
Asset Quality
% Impaired Ratio
Update

Page 25
882 932
Dec 15 Dec 16
22,700
33,531
Dec 15 Dec 16
10,870
13,027
Dec 16 Dec 16
2,649
3,229
Dec 15 Dec 16
Transaction Banking
Electronic channels, such as Corporate Online
(CoOL) Banking, and M2E play significant role in
growing transaction volumes in Maybank. We will
continue our focus on increasing client activity.
Trade finance is still a key area for fee income
generator. Despite challenging economic
condition, trade active clients delivered a sound
improvement by 6% from the previous year.
Transaction Banking (TB) Channel activity
increased by 22%, aligned with TB focus to
increase channel utilization.
Securities Services (SS) business also showed
significant increase in fees, and Assets Under
Management (AUM) improved by 48% compared
to 2015.
Our key initiative in 2017 is to enhance the skills
and strengths of the TB sales team and capture
cross-sell opportunities in collaboration with the
Global Markets (GM) team
Corporate Online (CoOl)
Banking Customers# of clients
Channel ActivityNo of transactions („000)
Assets Under Management
Trade Active Clients# of clients
20%
6 %
22%
Rp Billion
48%
Page 26
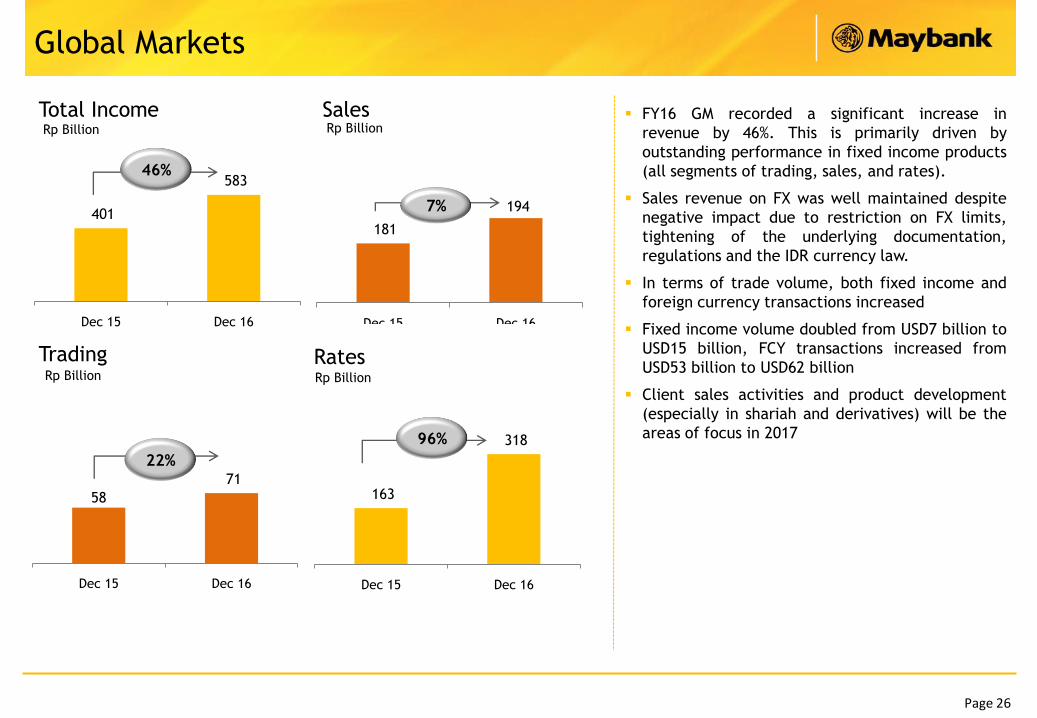
181
194
Dec 15 Dec 16
58
71
Dec 15 Dec 16
163
318
Dec 15 Dec 16
96%
7%
FY16 GM recorded a significant increase in
revenue by 46%. This is primarily driven by
outstanding performance in fixed income products
(all segments of trading, sales, and rates).
Sales revenue on FX was well maintained despite
negative impact due to restriction on FX limits,
tightening of the underlying documentation,
regulations and the IDR currency law.
In terms of trade volume, both fixed income and
foreign currency transactions increased
Fixed income volume doubled from USD7 billion to
USD15 billion, FCY transactions increased from
USD53 billion to USD62 billion
Client sales activities and product development
(especially in shariah and derivatives) will be the
areas of focus in 2017
Global Markets
401
583
Dec 15 Dec 16
Total Income
Trading Rates
Sales
46%
Rp Billion
Rp BillionRp Billion
Rp Billion
22%

Shariah Banking
FY2016 Results
Page 28
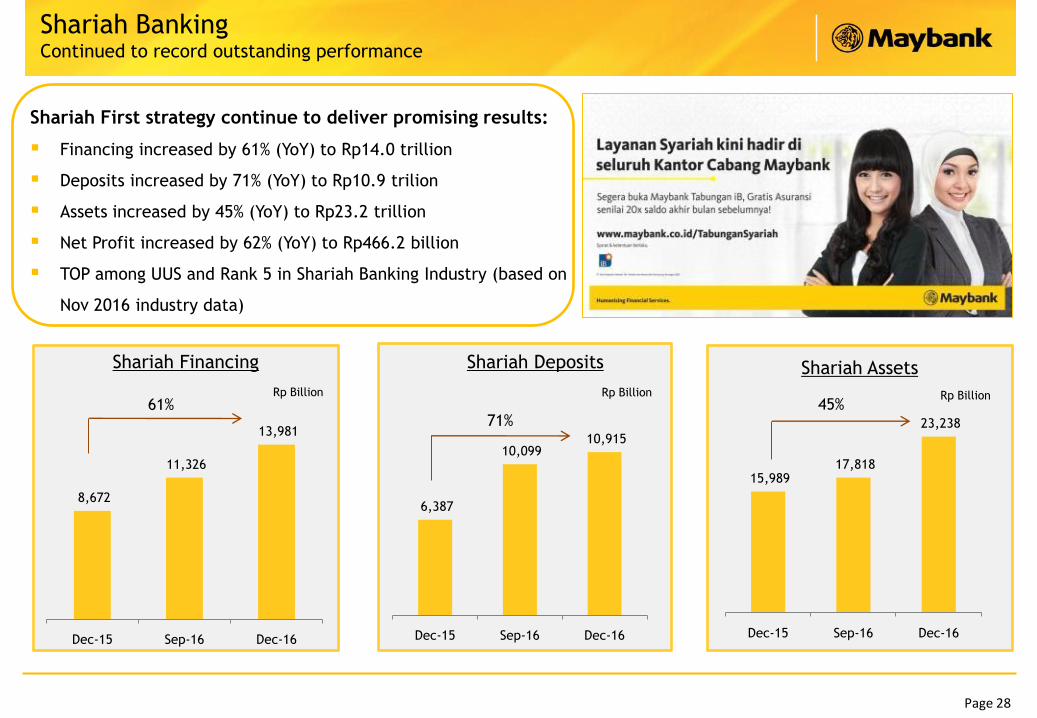
Shariah BankingContinued to record outstanding performance
Shariah Assets
Rp Billion45%
Shariah First strategy continue to deliver promising results:
Financing increased by 61% (YoY) to Rp14.0 trillion
Deposits increased by 71% (YoY) to Rp10.9 trilion
Assets increased by 45% (YoY) to Rp23.2 trillion
Net Profit increased by 62% (YoY) to Rp466.2 billion
TOP among UUS and Rank 5 in Shariah Banking Industry (based on
Nov 2016 industry data)
Rp Billion
Shariah Deposits
71%
Shariah Financing
61%Rp Billion
8,672
11,326
13,981
Dec-15 Sep-16 Dec-16
6,387
10,099 10,915
Dec-15 Sep-16 Dec-16
15,989 17,818
23,238
Dec-15 Sep-16 Dec-16

Maybank Indonesia Finance
FY2016 Results

Page 30
Maybank FinanceIncreased sales despite a reduction in the industry car sales.
Asset quality maintained at healthy level
Asset Quality
Revenue and Profit Before Tax IDR billion
FinancingIDR billion
Unit Financing (unit)
50,631
581
51,212 47,529
396
47,925
New Used Total
Dec-15 Dec-16
0.29% 0.36% 0.36% 0.34% 0.32%
0.35%0.45% 0.44%
0.42%0.39%
Dec-15 Mar-16 Jun-16 Sep-16 Dec-16
NPL Net NPL Gross
4,803
5,979
Dec-15 Dec-16
810947
332 334
Dec-15 Dec-16Revenue Profit Before Tax

Prospect & Outlook

Page 32
Market Outlook for 2017
Indonesia
Key Indicator
Outlook
• GDP (f) : 5.10% (2016: 5.02%)
• System Loan Growth (f): 10.17%
• System Deposit Growth (f): 9.50%
• 7-day Repo Rate (f) : 4.75% (2016 : 4.75%)
• USD/IDR average (f) : 13,440 (2016 : 13,330 )
• Inflation average (f): 4.32% (2016 : 3.53%)
• Indonesia‟s economy is expected to recover
slightly to 5.10% GDP growth in 2017 driven
by better exports performance and
multiplier effects from the government‟s
infrastructure spending.
• Inflation is expected to increase to 4.28% in
2017, in line with the government‟s decision
to remove the electricity subsidy. The
recent commodity prices rebound is also
expected to impact higher inflation this
year.
• BI 7-day reverse repo rate is expected to
stay 4.75%; supporting the domestic
economy and improving the national
financial sector during 2017.
* (f) = forecast

Page 33
Maybank Indonesia‟s Strategic Priorities and Guidance for 2017
ROE *)
Loans Growth
Deposits Growth
10.0% – 11.0%
10.0% - 12.0%
8.0% - 10.0%
Industry Loans
Growth10.0% - 12.0%
*) after planned Rights Issues in 2017
4Deepening Indonesia Regional Transformation
(IRT) Implementation to boost regional
penetration & productivity improvement
2Drive Cross Sell of products and services and
increase e-channel penetration
3 Maintain Margin & Segment Focus
1 Expand Fee Income Streams through product
diversification and transaction banking
5 Loan growth with Capital Allocation Strategy
while improving Assets Quality
Key Priorities in 2017
6 Digitalization for business efficiency & channel
efficiency

Maybank Indonesia in Brief

Page 35
Established : 15 May 1959
Total Assets : Rp166.7 Trillion
Total Equity : Rp19.3 Trillion
Market Capitalisation : Rp23.0 Trillion
Position in Indonesia
(as of Sep 2016)
: Rank #10 in terms of Assets
Rank #10 in terms of Loans
Rank # 9 in terms of Deposits
# of Branches : 460
428** (Maybank Indonesia)
32*** (Maybank Finance)
# of ATM & CDM : 1,633, including 96 CDMs that connected to
more than 20,000 ATM via ALTO, ATM
Bersama, PRIMA, MEPS, Cirrus and Plus
# of Employees : 7,303
6,908 (Maybank Indonesia)
395 (Maybank Finance)
# of Customers Lending
# of Cutomers Funding
:
:
0.6 million
1.4 million
Profile
Profile*
*) as of Dec 2016
**) Including 23 Micro Functional Offices
***) Including Sales Point Unit
Maybank Indonesia Head Office, Sentral Senayan 3
Jakarta, Indonesia

Page 36
Company Rating Shareholders
Company Rating and Shareholding
National Long-Term Rating AAA(idn), Outlook Stable
National Short-Term Rating F1+(idn)
Long Term Issuer Default Rating BBB, Outlook Stable
Short Term Issuer Default Rating F3
Viability Rating bb
Support Rating 2
Senior Bonds AAA (idn)
Subordinated Debt AA (idn)
Sukuk Mudharabah AAA (idn)
Corporate rating / Outlook idAAA, Outlook Stable
Bonds idAAA
Subordinated Bonds I/2011 & I/2012 idAA+
Subordinated Bonds II/2014 idAA
Sukuk Mudharabah idAAA(sy)
68.55%
78.98%
99.99%
PUBLIC
21.02%
Maybank Indonesia
*
* Conditional Sales & Purchase Agreement signed on 11 Jan 2017
Page 37
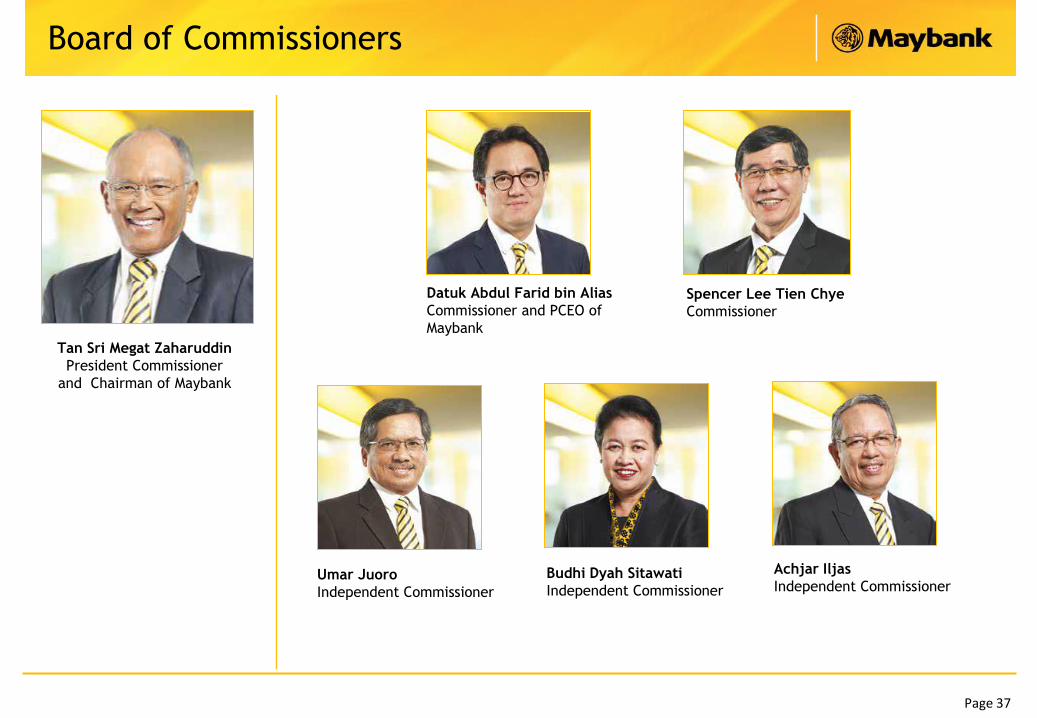
Board of Commissioners
Budhi Dyah Sitawati
Independent CommissionerUmar Juoro
Independent Commissioner
Achjar Iljas
Independent Commissioner
Spencer Lee Tien Chye
Commissioner
Tan Sri Megat Zaharuddin
President Commissioner
and Chairman of Maybank
Datuk Abdul Farid bin Alias
Commissioner and PCEO of
Maybank

Page 38
Jenny Wiriyanto
DirectorGhazali M. Rasad
Director
Thilagavathy Nadason
Director
Dhien Tjahajani
Director
Notes: Henky Sulistyo, former Risk Management Director of Maybank Indonesia, has resigned effective
since 31 December 2016. The EGMS approving his resignation was held on 23 December 2016.
Taswin Zakaria
President Director
Eri Budiono
Director
Board of Directors
Irvandi Ferizal
Director

Page 39
Building A Strong Network Footprint and Presence to Serve
the Communities across Indonesia
9 Shariah Branches 2 Overseas Branches393 Conventional
Branches
1 Micro Branch &
45 Micro Banking Services9 Regional Offices
26 Premier Wealth Center
and Lounge
1,633 ATM & CDM ; Access > 20.000 ATM
Bersama* & MEPS Malaysia network
19 Mobil Kas Keliling
(MKK)> 2 million Customers
* ATM that connected to network of ATM PRIMA, ATM BERSAMA, ALTO, MEPS, CIRRUS and Plus
Integrating Multi Customer Touch Points to Serve All Segments
Virtual Channel
Tele
Sales
Mobile
Banking
Internet
BankingCust Care
Centre
Key Alternate Channel
Premier
Wealth Sharia Micro MKK
Presence at the Heart of Community
ATMs CDMsSales personBranch and
Front Liners

Page 40
Providing banking and payment
solution to large local corporates
and State-Owned Enterprises (SOEs)
Providing banking and payment
solution to mid corporates,
communities and micro business
Providing banking and payment
solution to the retail customers
Global Banking
Large Local Corporates
State-Owned Enterprises
Financial Institution
Commercial segment
SME business
Micro business
High Net-Worth
Mass Affluent Customer
Employees
Objective
Product &
Services
Customer
Profile
Account
Planning
Global Market
Financial Supply Chain Management
Transaction BankingCustomer Financial Services
E-banking
Wealth
Management
Shariah First
Large
Corporates
Financing
Community and
micro- middle
corporates
Financing
Auto-loan
MortgageCredit Card
Personal Loan
Integrated One Stop Financial Services Provider
Highlight
Community Financial Services (CFS)
Consumer Financing

Vision & Mission

Page 42
Building Competitive AdvantageThrough four pillars of Maybank Indonesia
Community Distribution Compliance Human Capital Operations & IT Risk Finance
MKE MSI MGAM MIF
Global Banking Business Banking Retail Banking Shariah Banking
MKE = Maybank Kim Eng Indonesia MGAM = Maybank GMT Asset Management MIF = Maybank Finance (subsidiary of Maybank Indonesia)
MSI = Maybank Syariah Indonesia WOMF = Wahana Ottomitra Multiartha (Subsidiary of Maybank Indonesia)

Awards, Corporate Social Responsibility (CSR) &
Event Highlights
Page 44
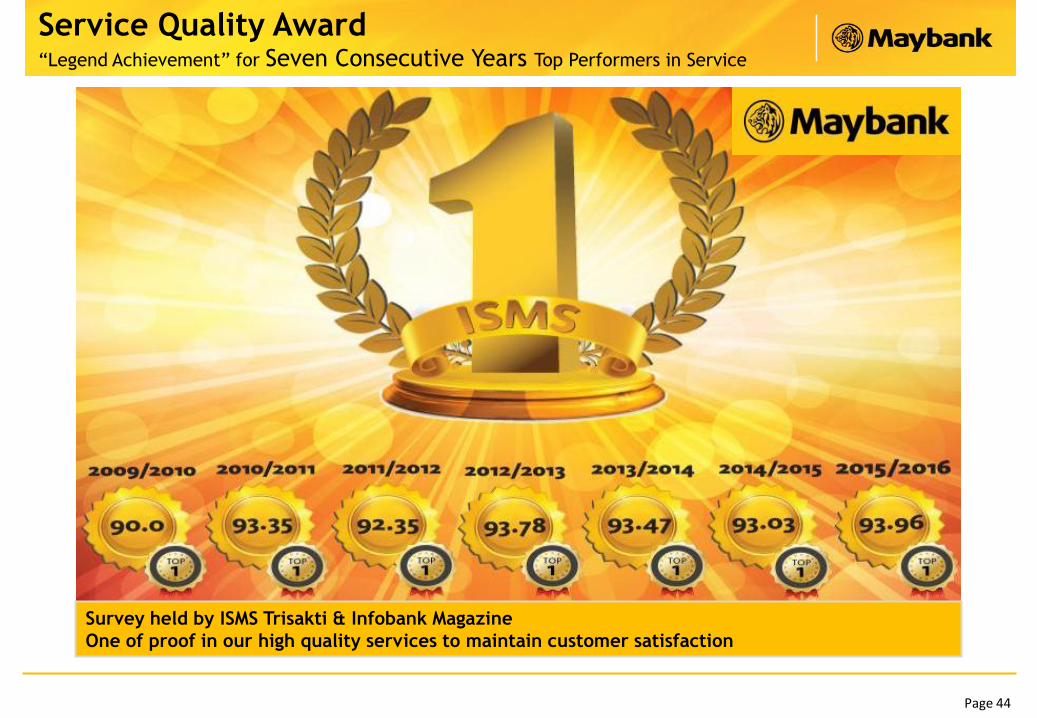
Service Quality Award“Legend Achievement” for Seven Consecutive Years Top Performers in Service
Survey held by ISMS Trisakti & Infobank Magazine
One of proof in our high quality services to maintain customer satisfaction
Page 45
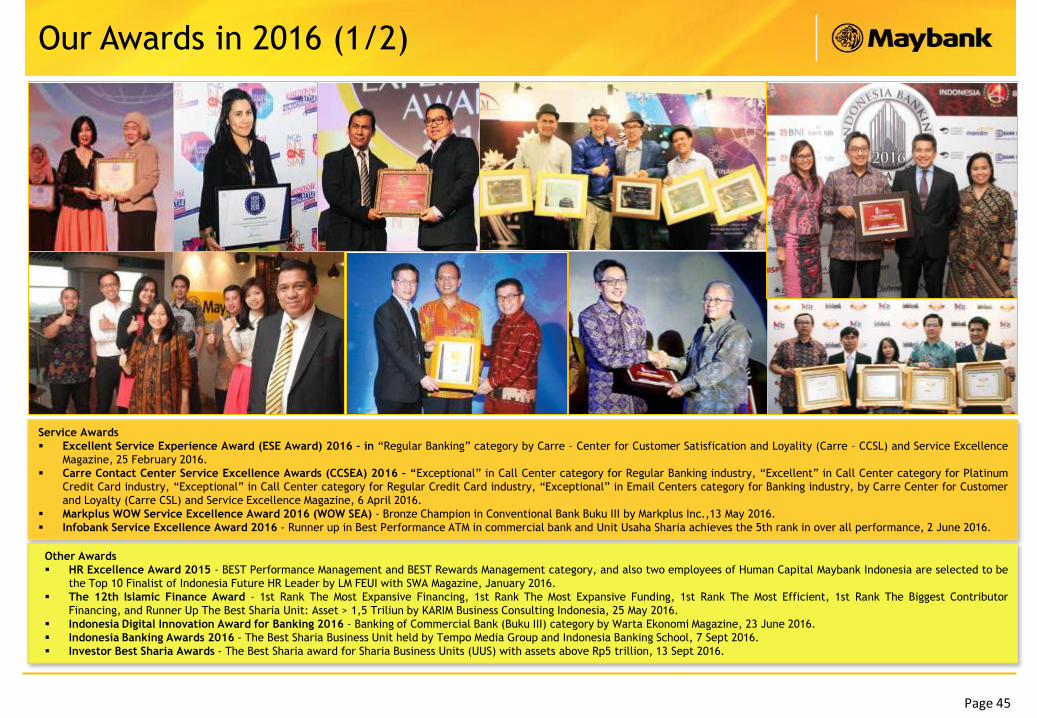
Our Awards in 2016 (1/2)
Service Awards
Excellent Service Experience Award (ESE Award) 2016 – in “Regular Banking” category by Carre – Center for Customer Satisfication and Loyality (Carre – CCSL) and Service Excellence
Magazine, 25 February 2016.
Carre Contact Center Service Excellence Awards (CCSEA) 2016 – “Exceptional” in Call Center category for Regular Banking industry, “Excellent” in Call Center category for Platinum
Credit Card industry, “Exceptional” in Call Center category for Regular Credit Card industry, “Exceptional” in Email Centers category for Banking industry, by Carre Center for Customer
and Loyalty (Carre CSL) and Service Excellence Magazine, 6 April 2016.
Markplus WOW Service Excellence Award 2016 (WOW SEA) - Bronze Champion in Conventional Bank Buku III by Markplus Inc.,13 May 2016.
Infobank Service Excellence Award 2016 - Runner up in Best Performance ATM in commercial bank and Unit Usaha Sharia achieves the 5th rank in over all performance, 2 June 2016.
Other Awards
HR Excellence Award 2015 - BEST Performance Management and BEST Rewards Management category, and also two employees of Human Capital Maybank Indonesia are selected to be
the Top 10 Finalist of Indonesia Future HR Leader by LM FEUI with SWA Magazine, January 2016.
The 12th Islamic Finance Award - 1st Rank The Most Expansive Financing, 1st Rank The Most Expansive Funding, 1st Rank The Most Efficient, 1st Rank The Biggest Contributor
Financing, and Runner Up The Best Sharia Unit: Asset > 1,5 Triliun by KARIM Business Consulting Indonesia, 25 May 2016.
Indonesia Digital Innovation Award for Banking 2016 - Banking of Commercial Bank (Buku III) category by Warta Ekonomi Magazine, 23 June 2016.
Indonesia Banking Awards 2016 - The Best Sharia Business Unit held by Tempo Media Group and Indonesia Banking School, 7 Sept 2016.
Investor Best Sharia Awards - The Best Sharia award for Sharia Business Units (UUS) with assets above Rp5 trillion, 13 Sept 2016.

Page 46
The President & CEO Maybank Indonesia
was awarded as “Indonesia Business
Leader of the Year” in CNBC’s 15th Asia
Business Leaders Awards 2016.
(23 November 2016)
Our Awards in 2016 (2/2)
CG Conference & Award 2016
The Best CG Financial Sector from The
Indonesian Institute for Corporate Directorship
(IICD). (7 November 2016)
Sustainability Reporting Award 2016
Maybank won as a “Commendation for Best
Practice in Micro Financing for Women” in
the Sustainability Report Award (SRA) 2016.
(14 December 2016)
Indonesia Best Banking Brand Award 2016
The Best Transparency Bank for Conventional,
The Best Service Bank for Shariah Unit and The
Best Performance for Shariah Unit by Warta
Ekonomi Magazine. (16 December 2016)
Bisnis Indonesia Banking Award 2016
The Best Performance Bank and The Best
Efficient Bank for Commercial Bank BUKU III
category. (19 October 2016)

Page 47
1. The Grand Launching of Maybank Indonesia, New Spirit to be Bigger, Better, Stronger
After obtaining approval from the regulator regarding the changing of company‟s name
from PT Bank Internasional Indonesia Tbk (BII) become PT Bank Maybank Indonesia Tbk
(Maybank Indonesia), The Grand Launching of Maybank Indonesia are held in 3 cities,
Jakarta, Medan, and Surabaya, involving all Maybankers, customers, and stakeholders.
(22, 27, and 29 January 2016)
2. Tax Amnesty Forum
Maybank Indonesia hosted Tax Amnesty Forum organized by the National Private Bank &
Foreign Bank (Gateway) in cooperation with FSA, INTRAC and Directorate General of
Taxation. Keynote speaker was Muliaman D. Hadad, Chief Commissioner of the FSA,
followed by explanation about tax amnesty by Sigit Priadi Pramudito and Agus Santoso.
(27 July 2016)
3. Strategic Partnership Maybank-Allianz
Maybank Indonesia signed a 10-year partnership with Allianz Life Indonesia as the life
insurance provider to the bank‟s customers. The three unit-linked products developed
were MyProtection Bijak, MyProtection Prima and MyProtection Investa. (23 August 2016)
Event Highlights – 2016
4. Strategic Partnership Maybank Indonesia – Jasa Marga
Maybank Indonesia provided financing facility under Musyarakah Line iB (Sharia)
scheme valuing Rp1.1 trillion to Jasa Marga. The commitment is claimed as the
biggest rupiah-denominated bilateral sharia financing facility in Indonesia for
infrastructure projects. This strategic partnership with Jasa Marga was the bank‟s
involvement to participate in infrastructure development as well as develop sharia
banking in Indonesia, 8 December.
5. Strategic Partnership Maybank Indonesia – PLN
State electricity company PLN gained Rp12 trillion worth of loans to finance the
development of an additional 35,000 MW power capacity. The loans were derived
from Bank Mandiri, Bank Central Asia (BCA), Bank Rakyat Indonesia (BRI), Maybank
Indonesia, Sarana Multi Infrastruktur, and Indonesia Eximbank that will due in 10
years. The loans will be used for investment in power plant, transmission,
distribution and facilities in Indonesia. (20 Desember 2016)
2 31
4 5
Page 48
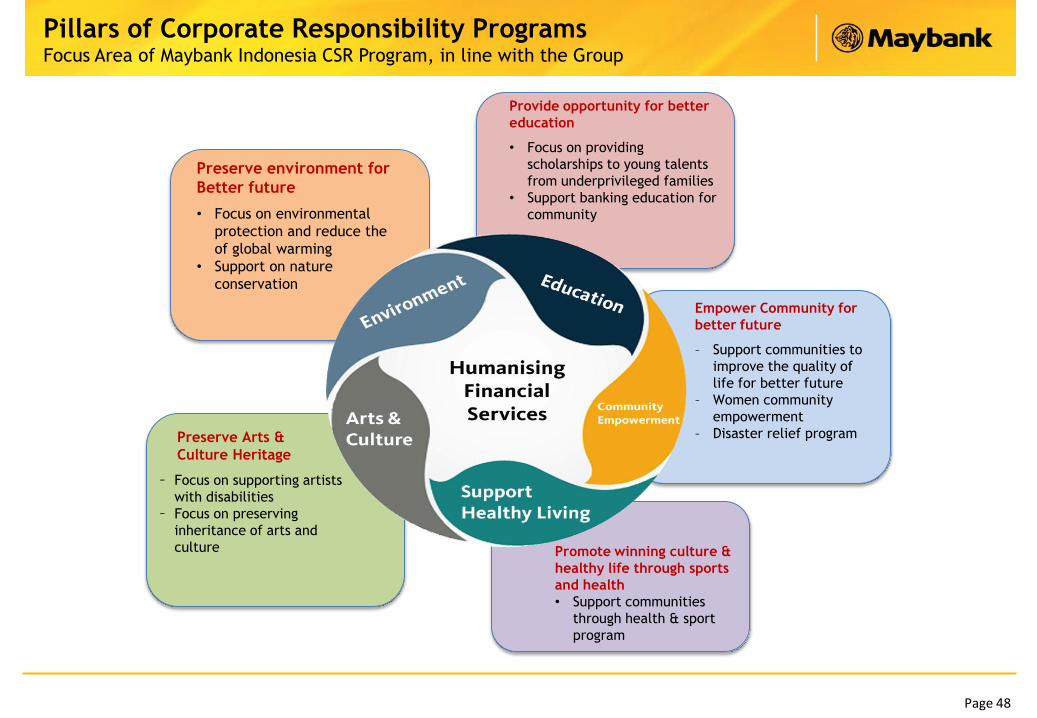
Provide opportunity for better
education
• Focus on providing
scholarships to young talents
from underprivileged families
• Support banking education for
community
Preserve environment for
Better future
• Focus on environmental
protection and reduce the
of global warming
• Support on nature
conservation
Empower Community for
better future
– Support communities to
improve the quality of
life for better future
– Women community
empowerment
– Disaster relief program
Promote winning culture &
healthy life through sports
and health
• Support communities
through health & sport
program
Pillars of Corporate Responsibility ProgramsFocus Area of Maybank Indonesia CSR Program, in line with the Group
– Focus on supporting artists
with disabilities
– Focus on preserving
inheritance of arts and
culture
Preserve Arts &
Culture Heritage

Page 49
Maybank Bali Marathon (MBM) 2016
Maybank Bali Marathon (MBM) 2016 was held for the fifth time. With total
number of participants more than 7,000, MBM is the only marathon race in Indonesia that
offers Balinese unique cultural experience while maintaining its international standard. Aside
from being included as the official race directory of Boston Marathon, MBM 2016 has been
selected by Indonesia Athletic Association (PASI) as the qualifying race for National Sport
event (PON).
As a series of Maybank Bali Marathon 2016, Maybank invited 50 wheelchair athletes from
PUSPADI Bali join the 10K category. The objective of this activity was to provide opportunity
for the disabled athletes to be part of Maybank Bali Marathon. (28 August 2016)
CSR for Gianyar Communities a Series of Maybank
Bali Marathon 2016
As part of international running competition Maybank
Bali Marathon (MBM) 2016, Maybank was also holding
corporate social responsibility (CSR) program in
Gianyar, Bali. Maybank Indonesia provided work
capital support grants to 10 best cooperatives. The
bank also donated funds from the Maybank
Foundation to the Center for Empowerment of the
Disabled (Puspadi) in Bali. (27 August 2016)

Page 50
CSR Highlights –2016
Reach Independent and Sustainable
Entrepreneurship (RISE) program
Maybank Indonesia together with Maybank
Foundation provide economic empowerment
program for disabled people through RISE
program at Disabled People Rehabilitation
Center (BPRTD) in Bantul, Yogyakarta. (11 – 13
August 2016)
Global CR Day 2016
The seventh Maybank Global CR Day was attended by
more than 18,000 bank‟s employees worldwide. In
Indonesia, 2,000 employees provided financial
education for several state-elementary schools (SDN)
namely SDN Tebet Barat 08 Pagi, SDN Tebet Barat 03
Pagi and SDN Tebet Timur 11 Pagi, Jakarta. (20
August 2016)
Pastoral Care Maybank Foundation Scholarship
As part of Maybank Foundation Scholarship Program,
Maybank Indonesia initiated to conduct Pastoral Care
workshop for 62 recipients of Maybank Scholarship
Foundation from Batch 1 and 2. This workshop
intended to encourage the recipients personality to be
talented in every aspect including sosial and
psychological aspects. (19 - 24 Sept 2016)
Maybank Women Eco Weavers
Maybank Group through Maybank Foundation launched “Maybank Women Eco Weaver”,
carried out a regional economic empowerment program for female eco weavers at
Lombok. This program is one of Maybank Foundation‟s flagship programs designed to
promote commonalities in ASEAN countries by enriching and promoting traditional
woven textiles in a sustainable manner for women to become economically
independent whilst advocating financial inclusion at the same time. In Indonesia,
Together with the Asosiasi Pendamping Perempuan Usaha Kecil (ASPPUK), the program
is carried out in four locations, namely East Lombok and Central Lombok in West Nusa
Tenggara, and Sawahlunto and Tanah Datar in West Sumatra

Page 51
MY BANK IS
MAYBANK!

Disclaimer : Please note that some of the statements in this document may constitute “forward-looking statements” that do not directly or
exclusively relate to historical facts. Some of the statements in this document (including but not limited to the forward-looking
statements) are derived from or are based upon information from public or external sources and/or reflect Maybank Indonesia’s own
internal projections, current intentions, plans, expectations, assumptions and beliefs about future events and are subject to risks and
uncertainties that may cause actual events and Maybank Indonesia’s future results to be materially different than expected or indicated by
such statements. To the extent that such statements in this document (including but not limited to the forward-looking statements) are
derived from or are based on public or external sources of information, Maybank Indonesia’s has not undertaken any independent
verification of such information. No assurance can be given that the results anticipated by Maybank Indonesia, or indicated by any such
statements in this document (including but not limited to the forward-looking statements), will be achieved. You are urged to view the
statements contained in this document (including but not limited to the forward-looking statements) with caution.
PT BANK MAYBANK INDONESIA TBK
Investor Relations
Sentral Senayan III
Jl. Asia Afrika No. 8, Gelora Bung Karno
Jakarta 10270, Indonesia
Tel : (62-21) 2922 8888
Fax : (62-21) 2922 8799
Email : [email protected]
www.maybank.co.id