May 3, 2015 with charts
23
Jeanette Schwarz Young, CFP ® , CMT, M.S. Jordan Young, CMT 83 Highwood Terrace Weehawken, New Jersey 07086 www.OptnQueen.com April 12, 2015 The Option Queen Letter By the Option Royal We are moving sometime this month and the preparations and work involved is massive therefor our letter will be sporadic until we settle down somewhere. “Sell in May and go away!” Well maybe, our suggestion is to use trailing stops or hard stops on your positions. We suggest that approach because the truth is that we do not know when the correction or plunge will occur, we only know that it will occur. Remember bull markets can last longer that you might ever have believed. The US market is a bit long in the tooth as a bull market and lasting advances might be harder to achieve thus we advise caution. We are not telling you to sell just to make sure that any long positions have stops in place. The rally that began in March of 2009 has proceeded higher with nothing more than a couple of hiccups along the way. The rally has been strong and predictable. The longer a trend lasts the stronger the reversal will be so with that in mind, don’t try to predict the end of the bull just keep your protection in place. The US market was the first global market to advance after the Financial Crash. It has been a solid leader in its advance since March of 2009. Now is the time when the tides will shift to other markets and away from our aging US bull market. The footnote on that is that other markets will advance so long as the US doesn’t crash. A crash will take down all ship in the sea even gold. Margin clerks do not care and sell anything they can when the order to sell is given. Remember also futures have a shorter payment time for margin and if a call is sent out cash or securities are due the next morning while with equities you do have several days, not many but more than for futures. The sentiment indicators are tipped to the bull side of the ship. Bears are at the lowest level seen in a long while and the spread between bulls and bears is the danger zone. Fence sitters have jumped to the bull camp. Too many bulls on the side of a ship will tip it eventually. Be prepared and stay alert. The S&P 500 rallied 23.25 handles (points) in the Friday session and printed a higher high and higher low then was seen in the Thursday session. Thursday’s down draft was not as awful as it felt. We remain above the horizontal line at 2064.50 which is a positive for this market. A longer uptrend line is at 2066.40 or so. The downtrend line is 2104.20. All the indicators that we follow are now pointing higher and the Friday rally was accompanied by heavy volume. These are positives for the market. We remain range-bound and likely will stay this way for a while longer. We are above the Ichimoku Clouds for all time-frames. The 5-period exponential moving average is 2098.40. The top of the narrowing Bollinger Band is 2117.81 and the lower
-
Upload
scutify -
Category
Economy & Finance
-
view
364 -
download
0
Transcript of May 3, 2015 with charts
Jeanette Schwarz Young, CFP®, CMT, M.S.
Jordan Young, CMT
83 Highwood Terrace
Weehawken, New Jersey 07086
www.OptnQueen.com
April 12, 2015
The Option Queen Letter
By the Option Royal
We are moving sometime this month and the preparations and work involved is massive therefor
our letter will be sporadic until we settle down somewhere.
“Sell in May and go away!” Well maybe, our suggestion is to use trailing stops or hard stops on
your positions. We suggest that approach because the truth is that we do not know when the
correction or plunge will occur, we only know that it will occur. Remember bull markets can
last longer that you might ever have believed. The US market is a bit long in the tooth as a bull
market and lasting advances might be harder to achieve thus we advise caution. We are not
telling you to sell just to make sure that any long positions have stops in place. The rally that
began in March of 2009 has proceeded higher with nothing more than a couple of hiccups along
the way. The rally has been strong and predictable. The longer a trend lasts the stronger the
reversal will be so with that in mind, don’t try to predict the end of the bull just keep your
protection in place.
The US market was the first global market to advance after the Financial Crash. It has been a
solid leader in its advance since March of 2009. Now is the time when the tides will shift to
other markets and away from our aging US bull market. The footnote on that is that other
markets will advance so long as the US doesn’t crash. A crash will take down all ship in the sea
even gold. Margin clerks do not care and sell anything they can when the order to sell is given.
Remember also futures have a shorter payment time for margin and if a call is sent out cash or
securities are due the next morning while with equities you do have several days, not many but
more than for futures.
The sentiment indicators are tipped to the bull side of the ship. Bears are at the lowest level seen
in a long while and the spread between bulls and bears is the danger zone. Fence sitters have
jumped to the bull camp. Too many bulls on the side of a ship will tip it eventually. Be prepared
and stay alert.
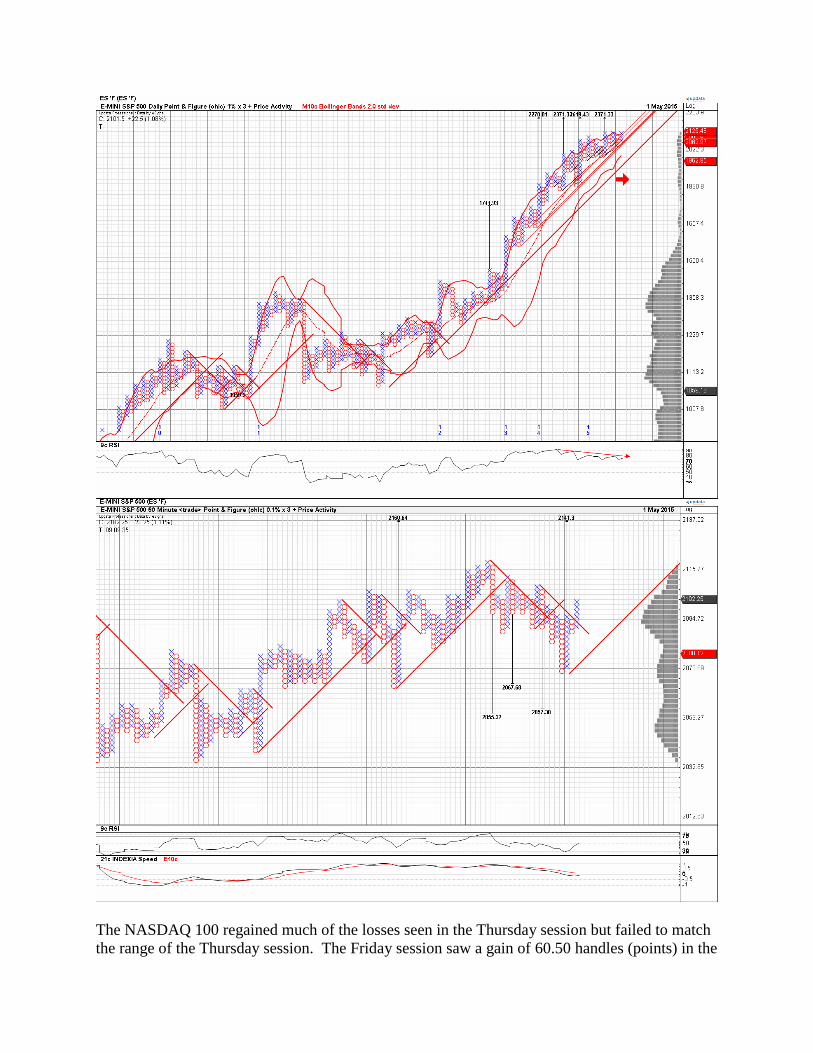
The S&P 500 rallied 23.25 handles (points) in the Friday session and printed a higher high and
higher low then was seen in the Thursday session. Thursday’s down draft was not as awful as it
felt. We remain above the horizontal line at 2064.50 which is a positive for this market. A
longer uptrend line is at 2066.40 or so. The downtrend line is 2104.20. All the indicators that
we follow are now pointing higher and the Friday rally was accompanied by heavy volume.
These are positives for the market. We remain range-bound and likely will stay this way for a
while longer. We are above the Ichimoku Clouds for all time-frames. The 5-period exponential
moving average is 2098.40. The top of the narrowing Bollinger Band is 2117.81 and the lower
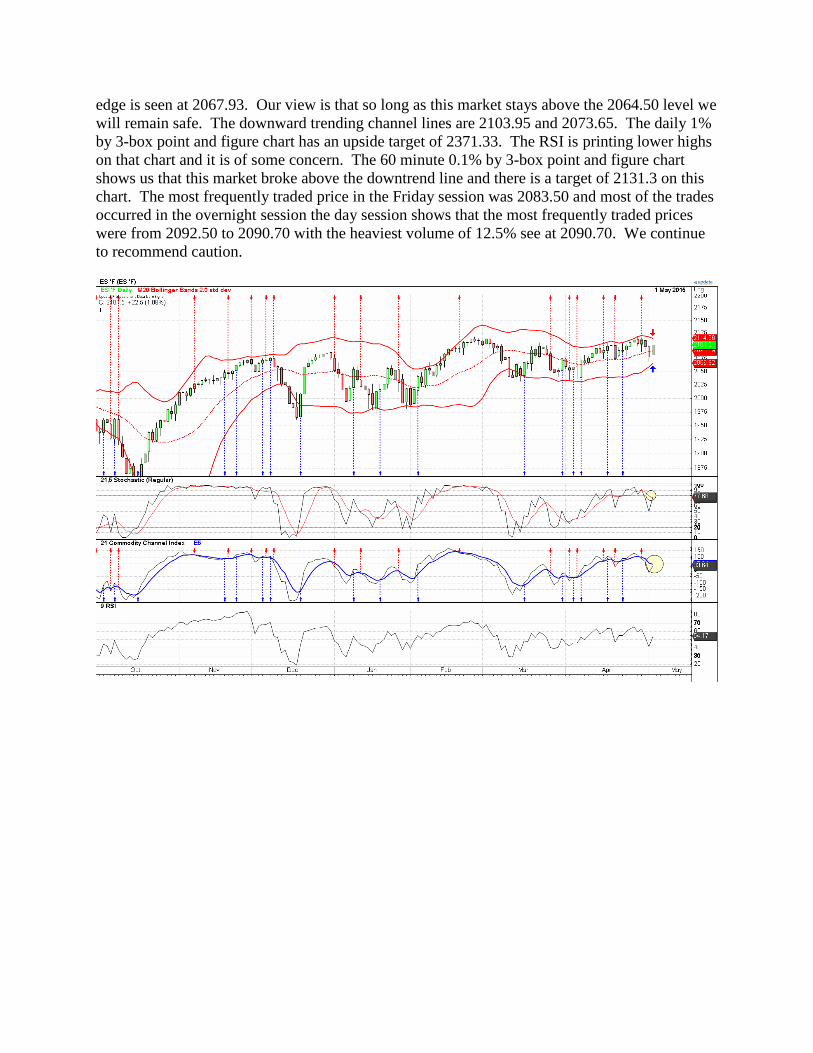
edge is seen at 2067.93. Our view is that so long as this market stays above the 2064.50 level we
will remain safe. The downward trending channel lines are 2103.95 and 2073.65. The daily 1%
by 3-box point and figure chart has an upside target of 2371.33. The RSI is printing lower highs
on that chart and it is of some concern. The 60 minute 0.1% by 3-box point and figure chart
shows us that this market broke above the downtrend line and there is a target of 2131.3 on this
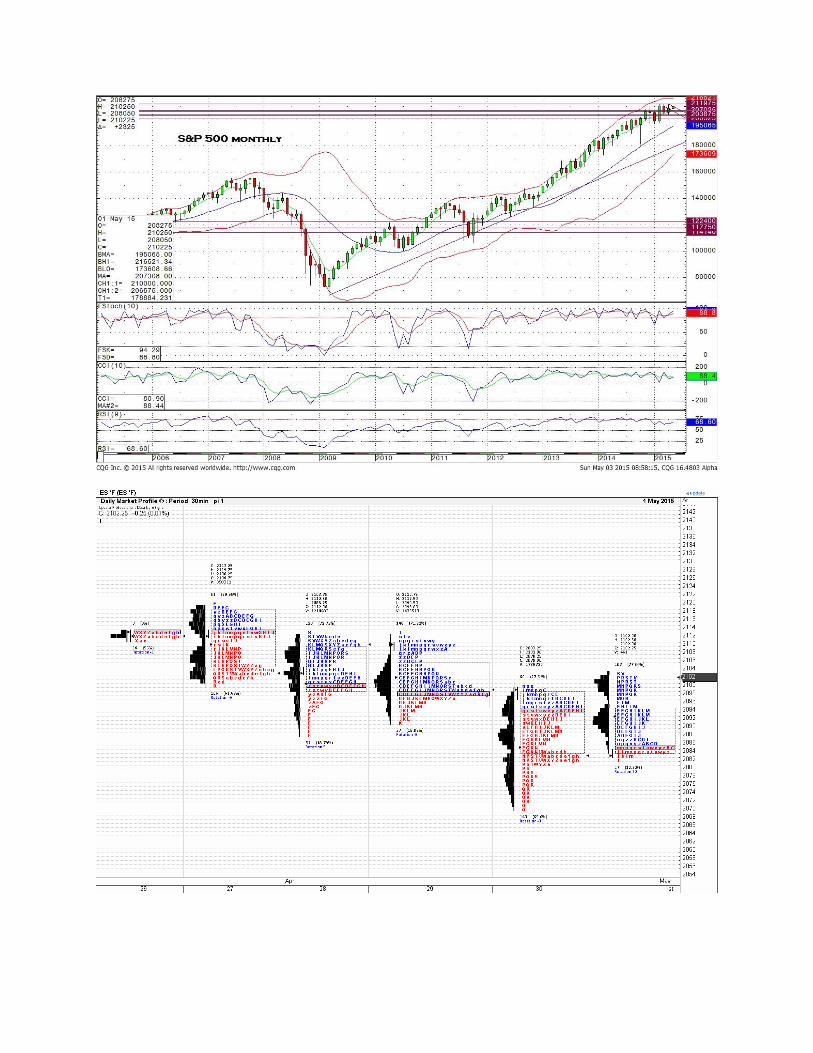
chart. The most frequently traded price in the Friday session was 2083.50 and most of the trades
occurred in the overnight session the day session shows that the most frequently traded prices
were from 2092.50 to 2090.70 with the heaviest volume of 12.5% see at 2090.70. We continue
to recommend caution.

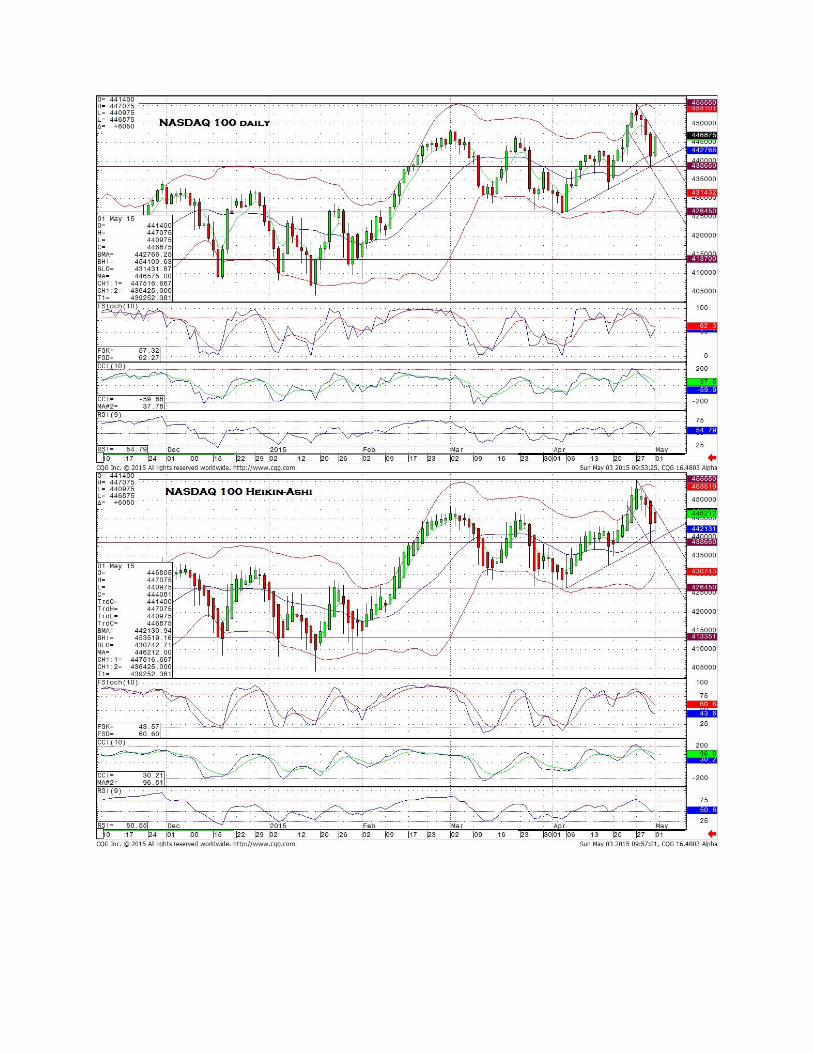
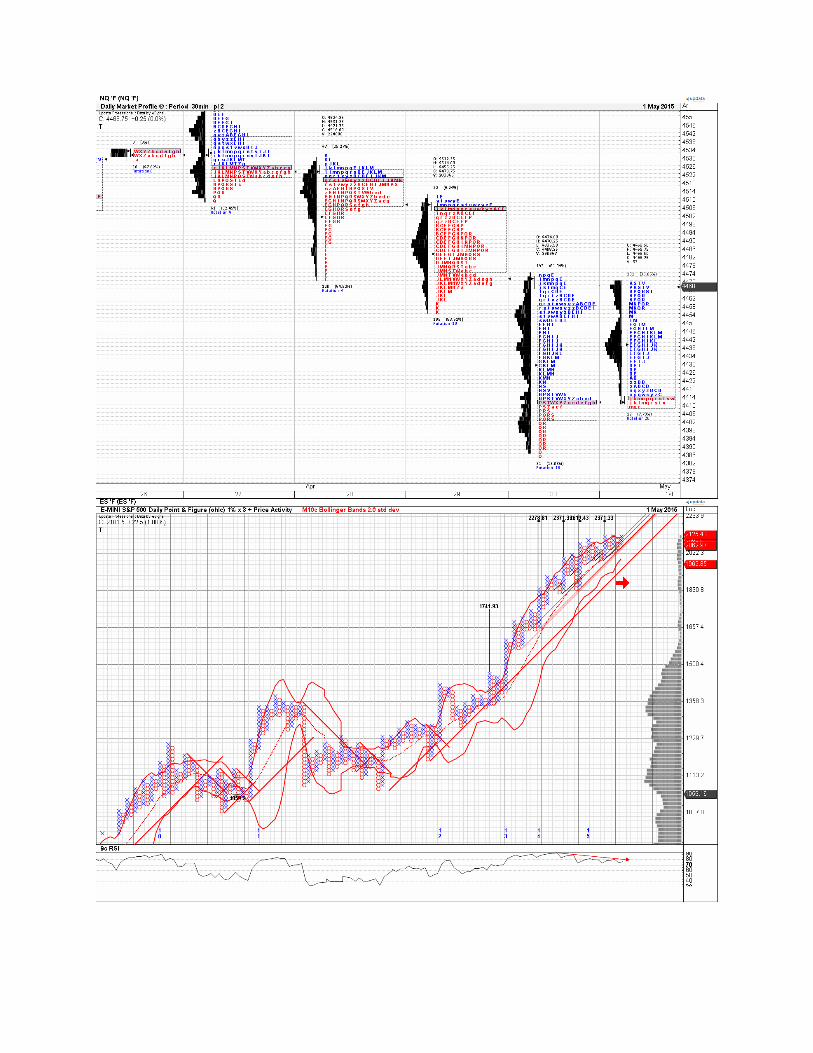
The NASDAQ 100 regained much of the losses seen in the Thursday session but failed to match
the range of the Thursday session. The Friday session saw a gain of 60.50 handles (points) in the

higher volume Friday session and left an inside day on the chart. Both the RSI and the stochastic
indicators are issuing a buy-signal our own indicator is curling upward but no signal as yet. On
May 6th
the downtrend and uptrend lines cross forming a point of inflection. That number is
4414.92. Should the markets remain between the uptrend and downtrend lines till Wednesday or
so, the result should be an explosive move in either direction. The 5-period exponential moving
average is 4465.75. The top of the contracting Bollinger Band is 4541.00 and the lower edge is
seen at 4314.31. We are above the Ichimoku Clouds for all time-frames. The most frequently
traded price of 4411.96 occurred during the overnight session. The heaviest volume of 7.8% was
seen at 4435.48. The most frequent traded prices during the day session occurred from 4443.32
to 4439.40 with the heaviest volume at 4439.40. The daily 1% by 3-box point and figure chart
continues to look bullish and seems to be consolidating. We have an upside target of 4711.59
and multiple internal uptrend lines. The 60 minute 0.1% by 3-box point and figure chart shows
that the NASDAQ 100 broke above the downtrend line. We have an upside target of 4563.24.
The candlestick chart is showing us that all is not well and, although the retreat’s angle of decent
is too steep to continue, we believe that there is either more consolidation or a rally in the near
future.

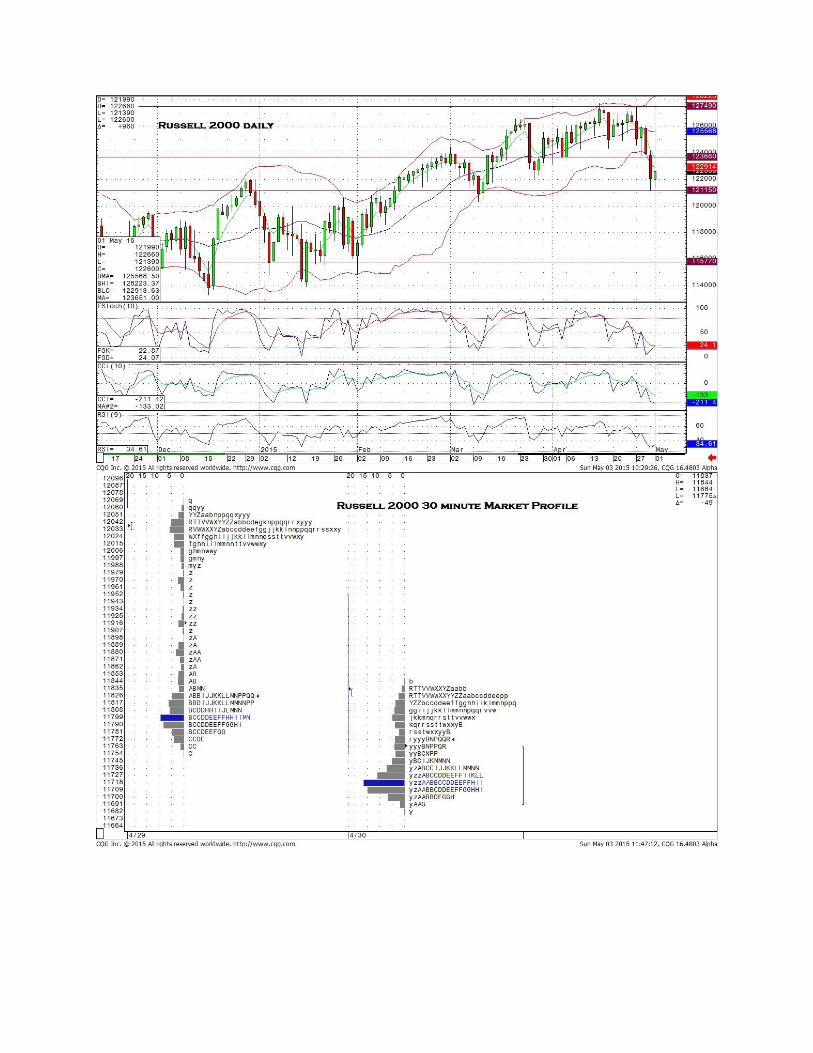
The Russell 2000 rallied in the Thursday session but underperformed the other financial indices
that we review. The 5-period exponential moving average is 1236.51. The top of the Bollinger
Band is 1282.23 and the lower edge is seen at 1229.13. We closed below the lower edge of the
Bollinger Band. It is important for this index to stay above 1211.50 and 1203.50. Should these
levels fail to support the market, there will be rapid decline to 1180 or so. All of the indicators
that we follow herein are issuing a buy-signal. The highest volume for the day of 11.9%
occurred at 1223.68. The most frequently traded price was 1222.40. The point and figure chart
tells us that we have to march above 1226.00. This index houses the small capitalization stocks
that, in recent days, have been hammered. Tread lightly in this index and expect continued
volatility.

Crude oil suffered a small retreat in the Friday session losing 37 cents on the day. The 5-period
exponential moving average is 58.52. The top of the Bollinger Band is 60.76 and the lower edge
is seen at 49.95. The stochastic indicator is about it issue a sell-signal and the RSI is going flat
near overbought levels. Our own indicator is flat not really giving any guidance. The upward

trending channel lines are 62.829 and 57.273. The most frequently traded price in the Friday
session was 59.68 although the lion’s shares of the trades were in the overnight session. Even
with global circumstances crude oil seems to be the mirror image of the US Dollar. This does
make a lot of sense insomuch as the price of crude is traded in US Dollars. The daily 1% by 3-
box point and figure chart continues to present a bullish picture. The daily 1% by 3-box point
and figure chart is also bullish. We are above the Ichimoku Clouds for the daily time-frame but
remain below the clouds for both the weekly and the monthly time-frame. When trading crude,
always keep your eyes on the US Dollar.


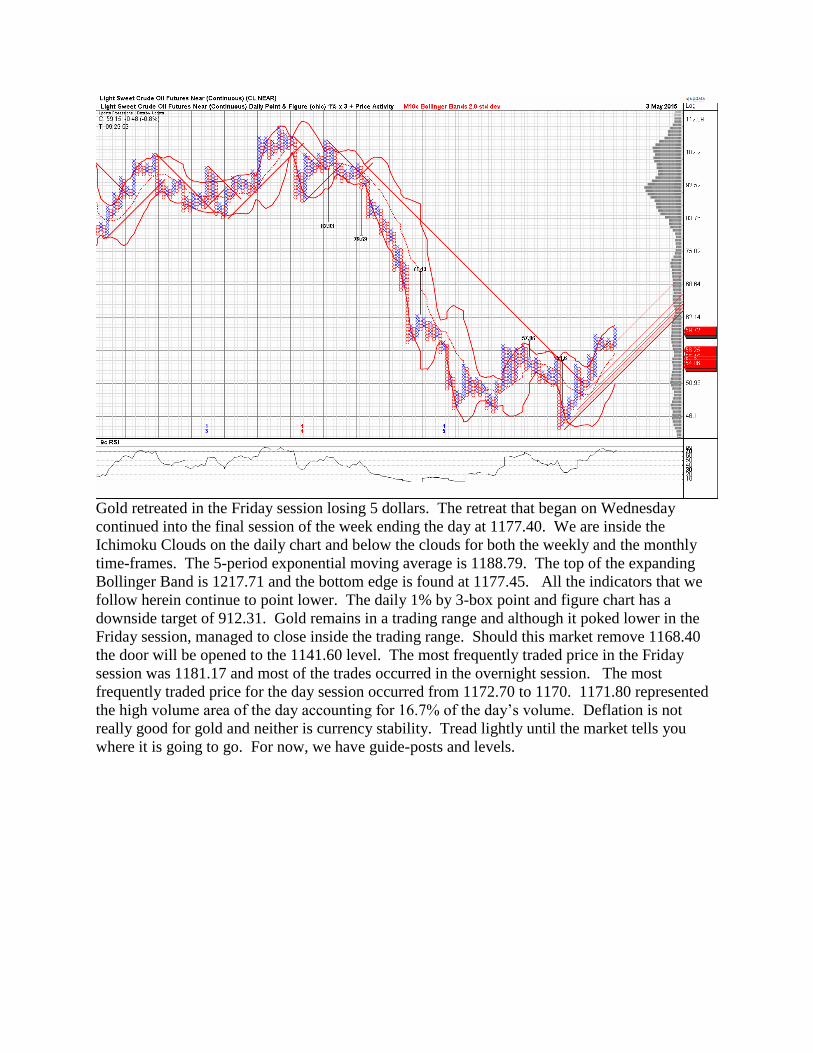
Gold retreated in the Friday session losing 5 dollars. The retreat that began on Wednesday
continued into the final session of the week ending the day at 1177.40. We are inside the
Ichimoku Clouds on the daily chart and below the clouds for both the weekly and the monthly
time-frames. The 5-period exponential moving average is 1188.79. The top of the expanding
Bollinger Band is 1217.71 and the bottom edge is found at 1177.45. All the indicators that we
follow herein continue to point lower. The daily 1% by 3-box point and figure chart has a
downside target of 912.31. Gold remains in a trading range and although it poked lower in the
Friday session, managed to close inside the trading range. Should this market remove 1168.40
the door will be opened to the 1141.60 level. The most frequently traded price in the Friday
session was 1181.17 and most of the trades occurred in the overnight session. The most
frequently traded price for the day session occurred from 1172.70 to 1170. 1171.80 represented
the high volume area of the day accounting for 16.7% of the day’s volume. Deflation is not
really good for gold and neither is currency stability. Tread lightly until the market tells you
where it is going to go. For now, we have guide-posts and levels.


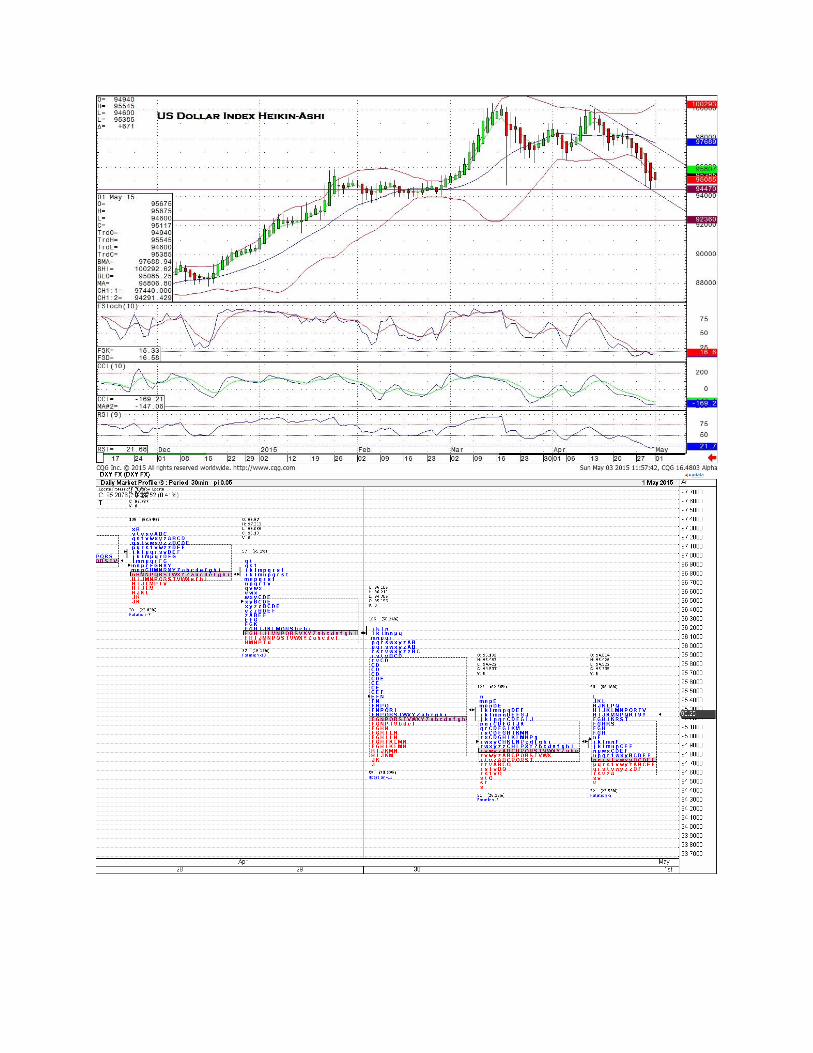
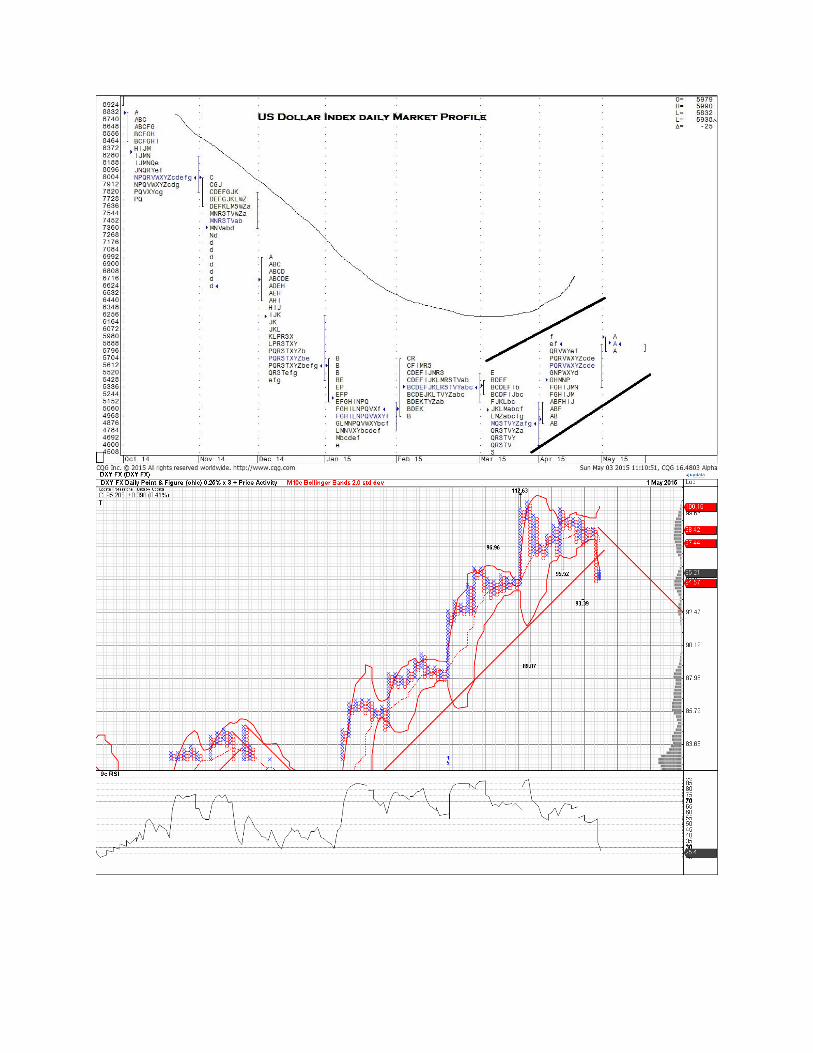
The US Dollar Index advanced in the Friday session gaining on the day. The 5-period
exponential moving average is 95.732. The top of the expanding Bollinger Band is 100.376 and
the lower edge is seen at 94.940. The downward trending channel lines are 97.440 and 94.291.

All the indicators that we follow herein are issuing a buy-signal. The most frequently traded
price of 95.004 had very little volume and was seen in the overnight sessions. The highest
volume occurred in the session with the fewest brackets at 95.043 with a volume of 7.9%. The
second highest volume of 7.8% of the day’s volume was seen at 95.355 which was during the
day session. The 60 minute 0.1% by 3-box point and figure chart is consolidating. The daily
0.25% by 3-box point and figure chart has a downside target of 93.39 and has just fallen below
the uptrend line. There is now a downtrend line in place. The Bollinger Bands are expanding
and the RSI is plunging lower. Although the candlestick charts look as though the US Dollar
will rally, we are concerned about the damage seen on the point and figure chart. Say awake if
trading this product.


Risk Trading Futures, Options on Futures, and retail off-exchange foreign currency transactions
involves substantial risk of loss and is not suitable for all investors. You should carefully
consider whether trading is suitable for you in light of your circumstances, knowledge, and
financial resources. You may lose all or more of your initial investment