May 2015 Environmental Science Ms. McCann. April 27 th Bell Ringers: What is the Greenhouse Effect?...
121
May 2015 Environmental Science Ms. McCann
-
Upload
christine-garrett -
Category
Documents
-
view
227 -
download
1
Transcript of May 2015 Environmental Science Ms. McCann. April 27 th Bell Ringers: What is the Greenhouse Effect?...

May 2015
Environmental ScienceMs. McCann
April 27th Bell Ringers: What is the Greenhouse Effect?
Learning Target: I will be able to explain how greenhouse gases contribute to the greenhouse effect.
Objectives 1. Begin Climate Unit
A. PowerPoint Day 1 Lesson (1&2)– highlight/underline vocabB. Ch 16 Study Cards
Chapter 15 (Atmosphere)/ Chapter 16 (Climate Change) UNIT TEST FRIDAY, MAY 1st!
*If you need to turn in Chapter 15 assignments, PLEASE do so TODAY!!!!

April 28th Bell Ringers: TRUE OR FALSE:-Winds distribute heat and moisture globally.
Learning Target: I will be able to distinguish ground (lower) ozone levels from upper ozone levels.
Objectives IF ABSENT YESTERDAY:
Need Chapter 16 PP/Maldives Is Packet Chapter 16 Study Cards (see words in black on board)
1. Tropospheric Ozone Climate Lab – Day 12. Climate PP Day 23. Complete Ch 16 vocab study cards/Maldive Is ws
Chapter 15 (Atmosphere)/ Chapter 16 (Climate Change) UNIT TEST FRIDAY, MAY 1st!
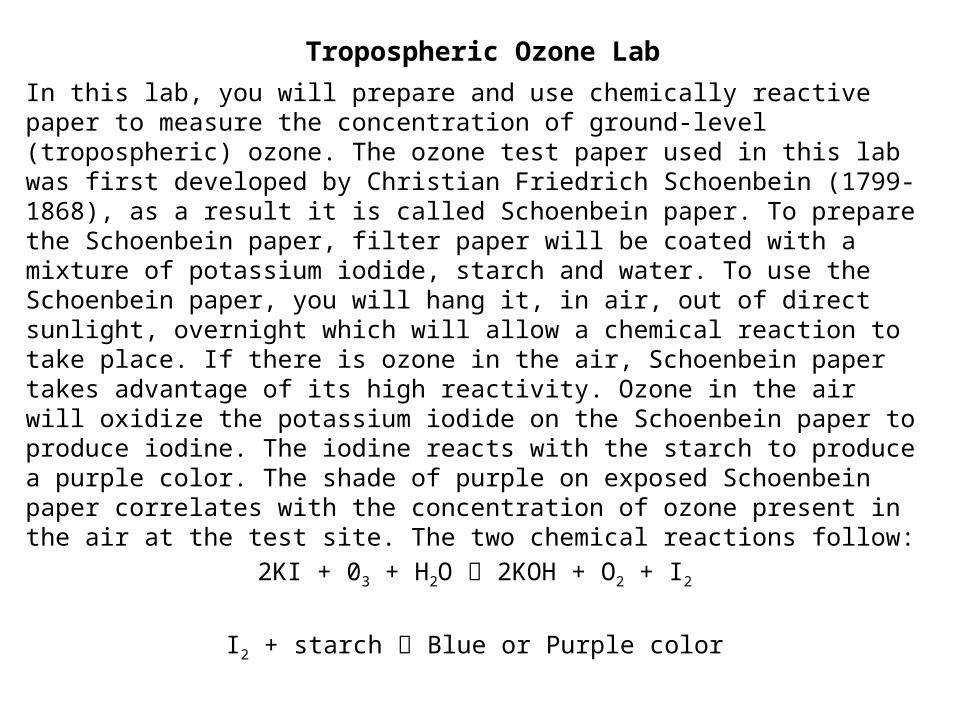
Tropospheric Ozone Lab
In this lab, you will prepare and use chemically reactive paper to measure the concentration of ground-level (tropospheric) ozone. The ozone test paper used in this lab was first developed by Christian Friedrich Schoenbein (1799-1868), as a result it is called Schoenbein paper. To prepare the Schoenbein paper, filter paper will be coated with a mixture of potassium iodide, starch and water. To use the Schoenbein paper, you will hang it, in air, out of direct sunlight, overnight which will allow a chemical reaction to take place. If there is ozone in the air, Schoenbein paper takes advantage of its high reactivity. Ozone in the air will oxidize the potassium iodide on the Schoenbein paper to produce iodine. The iodine reacts with the starch to produce a purple color. The shade of purple on exposed Schoenbein paper correlates with the concentration of ozone present in the air at the test site. The two chemical reactions follow:
2KI + 03 + H2O 2KOH + O2 + I2
I2 + starch Blue or Purple color

Day One: 1. Write your initials or group # on the corner of the strip.2. Lay a piece of filter paper on a the plastic lid and use a
small paint brush to brush the paste evenly onto both sides of the filter paper. Apply the paste as uniformly as possible. LEAVE a small corner UNPAINTED so you can handle the strip.Use soap to wash hands and scrub under fingernails after working with potassium iodide!!*We will allow to dry during the PowerPoint Notes*
2. Dry the Schoenbein paper by hanging the strip up in the air out of direct sunlight. Never expose Schoenbein paper to direct sunlight. After the PP, hang the strip on the string.

April 29th
Bell Ringers: What is the difference between global warming and global climate change? (p491)
Learning Target: I will be able to distinguish ground (lower) ozone levels from upper ozone levels.
Objectives 1. Tropospheric Ozone Climate Lab – Day 22. Hand back graded assignments.3. Complete Central Case Study: Maldives Is Activity/Ch 16 SC4. PICK UP EOC Handout!
Chapter 15 (Atmosphere)/ Chapter 16 (Climate Change) UNIT TEST FRIDAY, MAY 1st!

DAY TWO:
1. Cut the Schoenbein paper into 2.5-cm wide strips.
2. Moisten a strip of test paper with distilled water.
3. Hang the strip, out of direct sunlight, at the test site. The strip must hang freely. Leave overnight.
Use soap to wash hands and scrub under fingernails after working with potassium iodide!!

April 30th Bell Ringers: List the (4) evidence used to study and support climate change. (p491)
Learning Target: I will be able to state the probable cause of global climate change.
Objectives1. Day 3 of Ozone Lab2. Complete Central Case Study: Maldives Is Activity
Chapter 15 (Atmosphere)/ Chapter 16 (Climate Change) UNIT TEST Wednesday, MAY 6th!
DAY THREE:
1. After the strip is exposed for approximately eight hours, remove the strip and place it in an airtight ziplock bag out of direct sunlight until the results are recorded.
The possible changes in humidity will not affect results. The test paper dries in ~ 2 hours.

Day THREE:
2. Determine the ozone concentration of the air at the test site as follows:
a. Moisten the strip with distilled water, then compare the color of the strip with the Schoenbein Color Scale.
b. Determine the Schoenbein Number. If the color of the paper is not uniform, use the color in the area with the most conspicuous change to determine the Schoenbein Number.
*LOOK AT THE COLOR VERSION ON THE POWERPOINT!Determine the relative humidity at the test site and round it to the nearest 10%.

Schoenbein Color Scale
0 1 2 3 4 5 6 7 8 9 10
Schoenbein Number
0-3 Little or no change 4-6 Lavender Hue 7-10 Blue or Purple

Day THREE:
ON YOUR LAB SHEET: Use to the Relative Humidity/Schoenbein Number Chart as follows:
Along the bottom of the chart, find the point that corresponds to the Schoenbein Number.
Draw a line upward from the Schoenbein Number until it intersects the curve that represents the correct relative humidity.
Draw a line from the intersection in “ii” to the left side of the chart.

Day THREE:Relative Humidity/Schoenbein Number Chart

Day THREE/FOURafter test???:
Now, Answer the Tropospheric Ozone Lab POST LAB QUESTIONS

May 1st
Bell Ringers: What is a carbon footprint?
Learning Target: I will be able to explain methods to reduce my carbon footprint.
Objectives 1. Review Central Case Study: Maldives Is Activity2. Review changes to calendar. 3. Complete Ozone Lab Questions4. Continue working on EOC Study Guide
Chapter 15/16 Test: May 6th*We will REVIEW questions 1-21 on May 8th

Central Case Study: Maldives Island1. Rising sea levels first threaten the safety of
coastal populations, and may also threaten inland populations as the sea begins to engulf the island. Coastal flooding can cause economic disruption and ecological damage.
2. Rising sea levels cause the intrusion of salty water into freshwater drinking supplies, compromising drinking water.
3. The trend is a general rise in sea levels for the past 100 years.

4. Dead zone areas appear to be increasing in size and shifting along Pacific coasts, signaling new areas where existing marine life is compromised. 5. One of the most significant consequences of a warming Earth is the rising of sea levels, which threatens the health and economies of coastal populations worldwide.

Changing Temperature in the Atmosphere
1. Global air temperature is rising.2. It has increased by 0.8 degrees Celsius.3. It fluctuated, but was below the 1961-1990
average.4. Before 1910, the temperature rose and fell;
after 1910, it has risen fairly consistently except for the period between 1940 and 1950.
5. Steadily rising temperatures may cause sea levels to rise, increasing flooding in the Maldives.

Changes to Calendar

University High SchoolUnderclassmen Testing Schedule

Atmosphere and Climate Change Diagnostic Test
1 C 2 A 3 A4 A5 A 6 C7 A8 C 9 A 10 C 11 A12 B

13 C14 A 15 A16 C17 D18 A19 A20 B

21 C 22 B 23 A 24 B 25 B 26 B 27 D 28 A 29 B

30. B31. C32. A33. B34. B35. B

May the FOURTH be with YOU!
Bell Ringers: List Earth’s four spheres.
Learning Target: I WILL PASS MY EOC!
Objectives 1. Continue working on EOC – study guide
(YES! IT IS A GRADE!)*We will REVIEW questions 1-21 on May 8th
Chapter 15 (Atmosphere)/ Chapter 16 (Climate Change) UNIT TEST Wednesday, May 6th!

May 5th
Bell Ringers: Define the Law of Conservation of Matter.
Learning Target: I WILL PASS MY EOC!
Objectives 1. Continue working on EOC Study Guide.
*We will REVIEW questions 1-21 on May 8th
Chapter 15 (Atmosphere)/ Chapter 16 (Climate Change) UNIT TEST TOMORROW, MAY 6th!

May 6th Bell Ringers How do independent and dependent variables differ?
Learning Target:I WILL PASS MY EOC!
Objectives 1. Ch 15 (Atmosphere)/ Ch 16 (Climate Change) UNIT TEST
2. Continue working on EOC Study Guide *We will REVIEW questions 1-21 on May 8th

May 7th
Bell Ringers How is a food chain different from a food web?
Learning Target: I WILL PASS MY EOC!
Objectives 1. Continue working on EOC Study Guide
Review 1-21 TOMORROW!1-21 = 78 points!!!
22-42 = 42 points!!!Ch 15/16 Unit test posted to Pinnacle.
Please see me! I will permit test corrections!!!!
*We will REVIEW EOC Study Guide Questions 22-42 Tuesday, May 12th!

May 8th Bell Ringers How does biotic differ from abiotic?
*Make-Up Bell Ringers on Monday, May 11th
CLEAR EVERYTHING OFF YOUR DESK YOU WILL NEED A RED GRADING PEN!
Learning Target I WILL PASS MY EOC!
Objectives 1. Review 1-14!2. Continue working on EOC Study Guide
– Questions 15-42*We will REVIEW EOC Study Guide
Questions 15-25 On Monday, May 11th Questions 26-42 on Tuesday, May 12th!

EOC REVIEW
*Biodiversity: the variation of life within a particular area; a healthy area will have a high level of biodiversity with a variation of biotic and abiotic factors
1. (4) Ch 3.3: List and explain the Earths 4 spheres.
Name of Sphere Explanation/Characteristics
Geosphere
Earth’s crust, mantle, and the core. Land forms – Pangea; tectonic plates move = earthquakes
Biosphere
Bio = life, where living things interact with nonliving things; “The Living Earth”
Atmosphere Ocean of gases that support and protect Earth; contain the ozone. Hydrosphere
Encompasses all water- salt, fresh; liquid, ice, vapor on Earth’s surface, underground and in the atmosphere.
2. (1) Ch 3.4: Describe the Law of Conservation of Matter: Matter can be transformed; Matter can be neither created nor destroyed. Nutrients cycle through the environment endlessly.
Experiment Parts Description
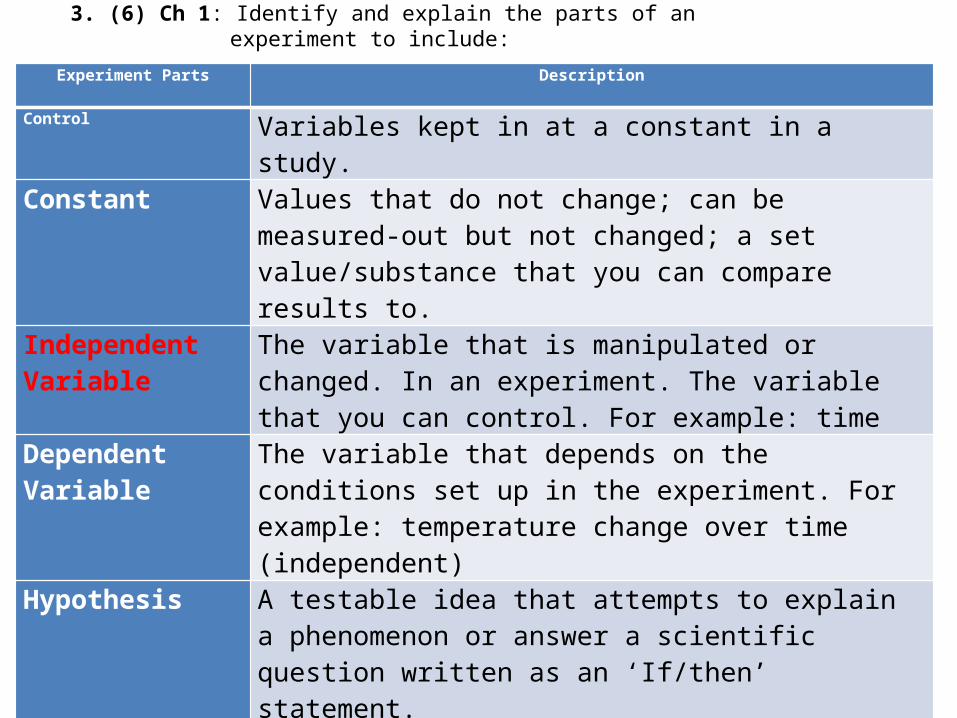
Control Variables kept in at a constant in a study.
Constant Values that do not change; can be measured-out but not changed; a set value/substance that you can compare results to.
Independent Variable
The variable that is manipulated or changed. In an experiment. The variable that you can control. For example: time
Dependent Variable
The variable that depends on the conditions set up in the experiment. For example: temperature change over time (independent)
Hypothesis A testable idea that attempts to explain a phenomenon or answer a scientific question written as an ‘If/then’ statement.
Conclusion The end result of an experiment.
3. (6) Ch 1: Identify and explain the parts of an experiment to include:
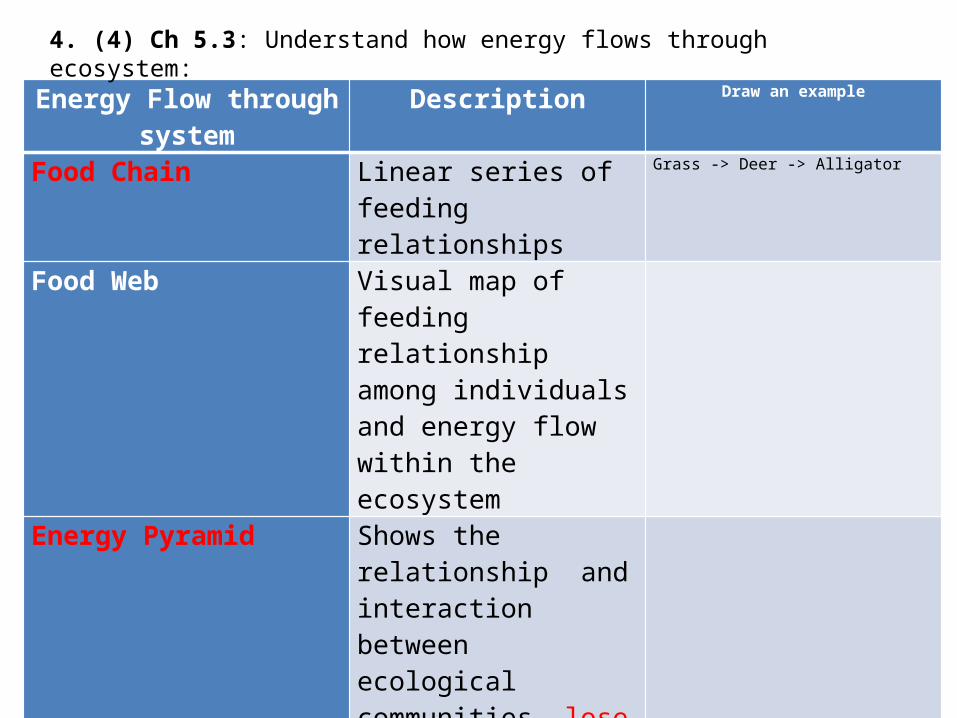
Energy Flow through system Description Draw an example
Food Chain Linear series of feeding relationships
Grass -> Deer -> Alligator
Food Web Visual map of feeding relationship among individuals and energy flow within the ecosystem
Energy Pyramid Shows the relationship and interaction between ecological communities, lose 90% of energy at each level, only 10% is passed on to the next level
Trophic Levels An organism’s rank in a feeding hierarchy
4. (4) Ch 5.3: Understand how energy flows through ecosystem:

5. (1) Ch 4.1: Make a VENN diagram to COMPARE/CONTRAST biotic and abiotic environmental factors.
Biotic: Both: Abiotic:living or once living Make-Up never living
Ecosystem
Ex: Plants, Animals, Fungi Ex: Temperature, Wind, pH

6. (5) Ch 4.1:Differentiate between the levels of ecological organizationEcological Organization Definition Example
Species A group of individuals that interbreed and produce fertile offspring
dolphin
Population Group of the same species living in the same area at the same time
Pod of dolphin
Community All the populations in a particular area
Pod of dolphin with fish, turtles, sharks, sea weed; kelp, algae (all biotic)
Ecosystem All of the living things and their physical environments within a particular area
Community (Pod of dolphin with fish, turtles, sharks, sea weed; kelp, algae) + abiotic: temperature, pH, rocks, nutrients
Biosphere Where living things interact with nonliving things
All of the ecosystems on Earth

Wetland Description Draw an Example
Freshwater Marshes Shallow water, tall grass-like plants (cattails)
*Swamps
Shallow water, rich in vegetation with woody shrubs and trees, few grasses
Bogs Low nutrients, acidic pH of water, floating mats of vegetation, usually moss, result of secondary succession
Fens Rich in nutrients, less acidic, connected to a source of groundwater
7. (4) Ch 6.3: Compare the four types of wetlands:

Types of Species Interactions Description
Predator/Prey Process by which an individual of one species hunts, captures and kills prey (+/-)
Competition Occurs when organisms seek the same limited resource (-/-)
Mutualism Two or more organisms benefit from sharing this relationship (+/+)
Commensalism Relationship in which one species benefits and the other is unaffected (+/0)
Parasitism One organisms depends on the other for nourishment or some other benefit, one is harmed (+/-)
8. (5) Ch 5: Compare/contrast the 5 types of species interaction:

9. (3) Ch 6.2: Describe the unique characteristics of the major biomes and their occurrence to average temperature and precipitation (think latitude)
Biome DescriptionHow would you describe to someone who
couldn’t see it??
Average Temperature
Average Precipitation
Latitude
Tropical Rain Forest 12 hour days, dense canopy, trees, vines, plants; nutrient rich vegetation, not soil
Warm; tropical Very wet Around equator
Tropical Dry Forest Seasonal variations, dry and wet season
Warm Heavy rainy season with a long dry season
Just above/below the equator
Savanna
Tropical region, with less rain than tropical dry forest but more than a desert, “Tropical Grassland”
20 degree Cwarm
40mm –dry with a rainy season
Just above/below tropical dry forests
Desert Dry area full of sand, rocks, little to no plants
HOT, can get chilly/cold at night, 30 C
VERY DRY, little to no rain- 25cm
Found just above savanna
Temperate Rain Forest Damp, high humidity, surrounded by vegetation
25 degree C, can be chilly
Very rainy-200-300 mm
Just above desert areas

Temperate Forest
Seasons, broad leafy trees, forests, abundant with variety of vegetation, nutrient rich soil –deciduous trees
25 CSeasonal variations
Moderate rain, 80-100mm
Found above temperate rain forest
Temperate Grassland
No big trees due to little rain, variety of tall grasses, deciduous flowers
23 C 30-50 mm – little rain
Found around temperate forest areas
Chaparral Highly seasonal; wet winters, dry summer; hills with shrubs
20 C 80mm Found around temperate grasslands
Boreal Forest Coniferous trees; cool, dry region, ranges of tall pine needle trees: “coniferous forest”
15 C 70mm Found in the North
Tundra Snowy, dry, cold area; can be mountainous, full of scrubby vegetation; broad hoofed animals with think fur
5 C, very cold winters with mild summer
30mm Found between boreal and near Poles, around polar ice caps
Polar Ice Caps Very cold region, snow, ice, no plants at all
Negative/LoC Little – snow poles
Mountains Steep mountains, full of small and large trees
Variation dependent on latitude and altitude
Varies Makes up parts of many areas

10. (5)Ch 12.1: Explain various sustainable farming practices that reduce erosion.Sustainable Farming Type Description
Shelter Belts “wind breaks”; rows of trees (other plants) planted along the edges of fields to slow the wind
Conservation Tillage Turning over of soil before planting
Intercropping Planting of different crops in a mixed arrangement
Terracing Used on steep hillsides, transforms steep slopes into a series of steps
Contour Farming Plowing sideways across a hillside, perpendicular to the hills slope

11. (3) Ch 12: Describe the factors that contribute to soil pollution
Soil Pollutants
Description
Irrigation Providing water to plants; short-term: good; long-term: pollutes leading to erosion and increases salinization
Salinization Build-up of salts in upper soil horizons; increased through irrigation
Pesticides Chemicals that kill organisms that attack or compete with plants can kill plants, animals, fungus, bacteria or viruses

12. (3)Ch 20: List/describe the advantages and disadvantages of the various methods of hazardous waste disposal
Hazard Waste Disposal Description Advantages Disadvantages
Surface Impoundment
Shallow pit, lined with plastic, used to hold liquid or semisolid hazardous wastes
Reduce volume of hazardous waste material
Can crack and leak wastes; only a temporary solution
Sanitary Landfill
A facility in which waste is buried in the ground or piled up in large, engineered mounds
Prevent contamination of groundwater and soil
Expensive, uses a lot of space, can be seen
Deep Well Injection
A method of hazardous waste disposal in which the waste is pumped into a well that has been drilled beneath the water table into porous rock
Out of sight, and away from people
Pollutes aquifer (groundwater that can be used for drinking water)

13. (1)Ch 19: What is Integrated Waste Management (IWM). A comprehensive solid waste program that emphasizes REDUCE, REUSE, RECYCLE; through prevention, recycling, composting and disposal program; Considers how to prevent, recycle, and manage solid waste in waste that promote human health and the environment.

14. (1) Ch 2: Explain how supply and demand effect the economy.
The amount of a product offered for sale at a given price is supply. The amount of a product people will but at a given price if free to do so is demand. Working to equilibrium is best, however as the as the supply decreases and demand increases, so does the price. If the supply increases and the demand decreases, so does the price.

May 11th Bell Ringers Give an example of each: species, population, community.
Learning Target I WILL PASS MY EOC!
Objectives 1. Review EOC SG 15-252. Continue working on EOC Study Guide
– Questions 26-42*We will REVIEW EOC Study Guide
Questions 22-42 onTuesday, May 12th!

3) Ch 18: Explain the positive and negative affect of the various forms of alternative energyAlternative Energy Description Positive Effects Negative Effects
Nuclear Uranium is sued to generate electricity without creating air pollution
Does not create air pollution, safer for workers
Very expensive to maintain; possible risk of meltdown’s waste disposal
Hydro Using the kinetic energy of moving water to turn turn-bines and generate electricity
Renewable energy; clean-nothing burns = no air pollution, inexpensive
*drastically change ecosystems leading to a decrease in biodiversity
Wind Wind turn-bines convert wind’s kinetic energy into electrical energy
Non-polluting; efficient Unpredictable supply; damage to landscape and wildlife
Solar Using the sun’s energy directly for electricity
Limitless supply Weather dependent’ expensive
Biomass Energy produced from organic material; ie: plants (wood/grain) and manure (animals/human waste)
Releases no net carbon into the atmosphere, economic benefits
Biofuel crops take up land deforestation, erosion, desertification, not efficient; causes indoor air pollution
Geothermal Steam or how water produced by pressure combining with the breakdown of radioactive elements producing heat used to turn turn-bines
Releases few greenhouse gases; reduces air pollution
May not be sustainable; could run out of water; not available everywhere; may trigger earthquakes
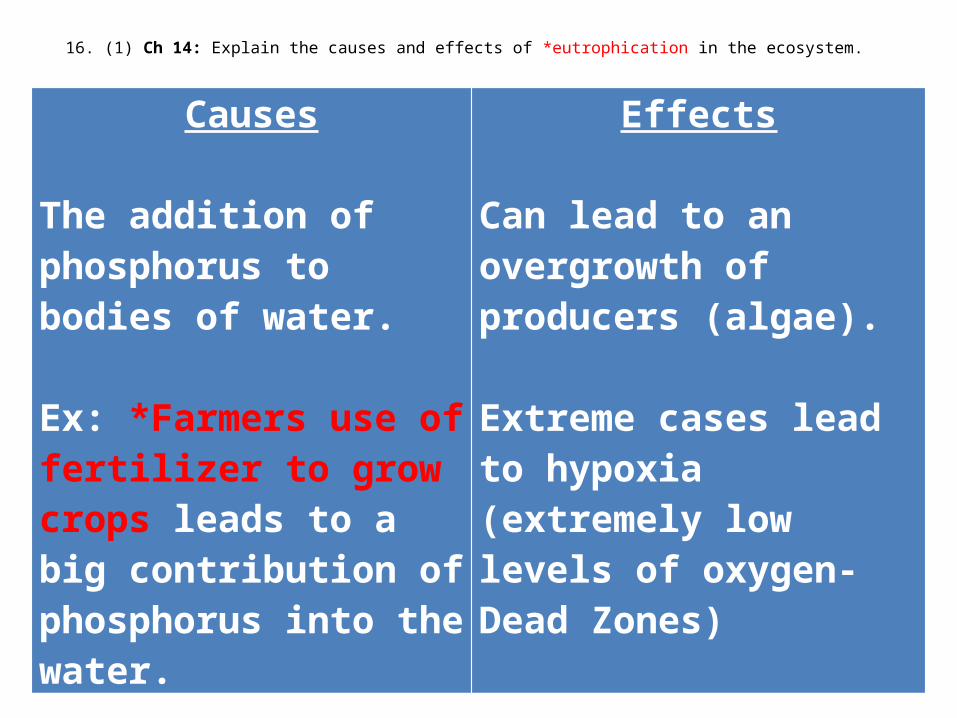
16. (1) Ch 14: Explain the causes and effects of *eutrophication in the ecosystem.
Causes
The addition of phosphorus to bodies of water. Ex: *Farmers use of fertilizer to grow crops leads to a big contribution of phosphorus into the water.
Effects
Can lead to an overgrowth of producers (algae). Extreme cases lead to hypoxia (extremely low levels of oxygen- Dead Zones)

17. (5) Ch 12: Explain the various components of soil formation to include
Factor Effects*Climate *soil forms faster in warm, wet climates than in cold,
dry climates
Time Takes decades, centuries, millennia to form soil
Structure A mixture of biotic and abiotic materials
Parent Material Chemical and physical attributes of a parent material influence properties of soil formed from it
Organic Material Material with a carbon atom; living things/once living = biotic

18. (5) Ch 12: Explain the characteristics of soil to include:
Characteristic Description
*Color Dark = rich in humus = rich in nutrientsPale = low in humus = poor nutrients
*Size Determines the texture of the soil
*Texture 3 particle sizes: *clay – silt – sand (mixture of these = loam) – know that clay is smallest, sand is largest; Indicates how porous soil is; determines the work ability (how easy it is to plant and harvest from)
*Structure Describes the arrangement of soil; particles “clumpiness”; more clumpy = more humus = better soil for agriculture
*pH Level of acidity – plants need slightly acidic/slightly alkaline soil in which to grow

19. (1) Ch 9: Make a VENN diagram to COMPARE/CONTRAST bioaccumulation with biomagnification.
Bioaccumulation Both *BiomagnificationOrganisms can build up Toxic chemicals concentration of toxic large concentrations of accumulate in substances can be greatlytoxic substances in their organisms as they magnified with each stepbodies feed on another in the food chain
Ex: DDT build-up in Fatty tissues Ex: DDT – more harm to tertiary predator because the concentration is greater
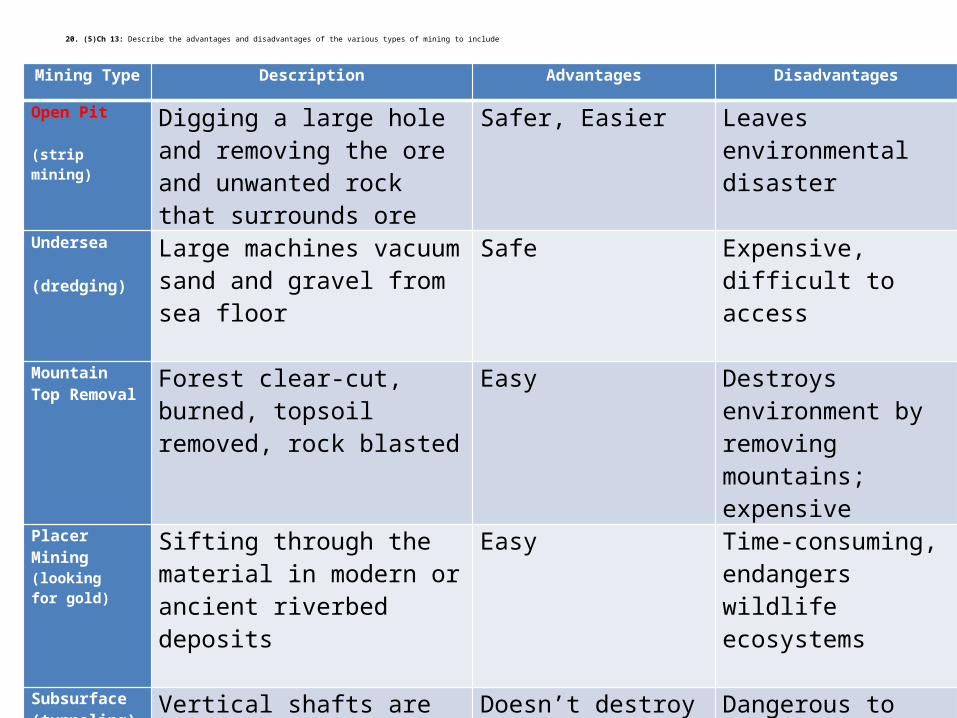
20. (5)Ch 13: Describe the advantages and disadvantages of the various types of mining to include
Mining Type Description Advantages Disadvantages
Open Pit (strip mining)
Digging a large hole and removing the ore and unwanted rock that surrounds ore
Safer, Easier Leaves environmental disaster
Undersea (dredging)
Large machines vacuum sand and gravel from sea floor
Safe Expensive, difficult to access
Mountain Top Removal
Forest clear-cut, burned, topsoil removed, rock blasted
Easy Destroys environment by removing mountains; expensive
Placer Mining (looking for gold)
Sifting through the material in modern or ancient riverbed deposits
Easy Time-consuming, endangers wildlife ecosystems
Subsurface (tunneling)
Vertical shafts are dug deep into the ground, networks of tunnels
Doesn’t destroy forests Dangerous to workers; expensive
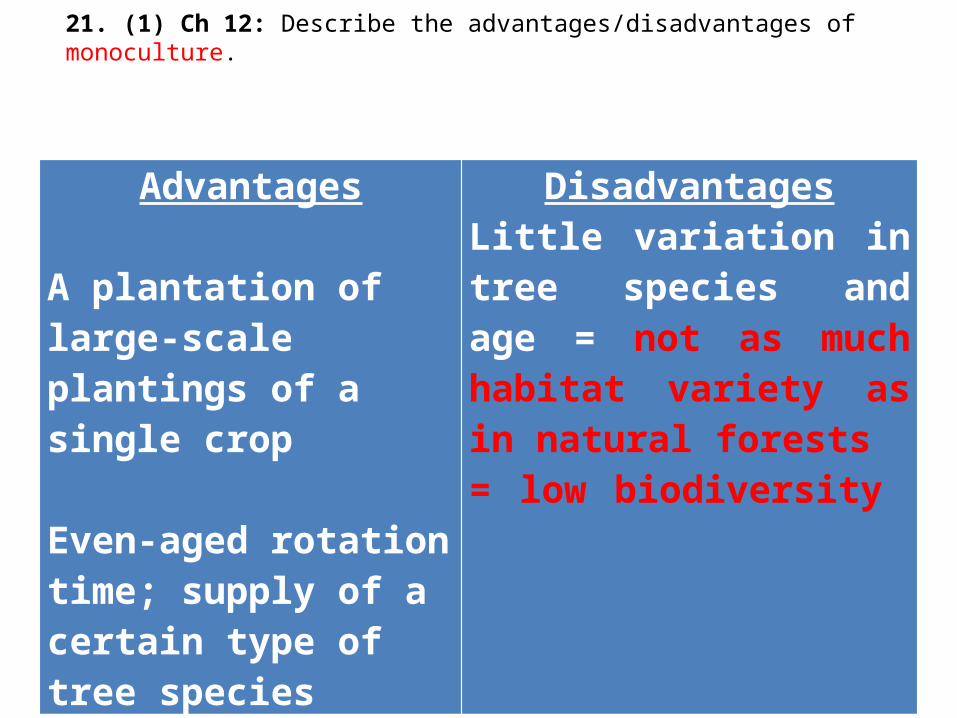
Advantages
A plantation of large-scale plantings of a single crop Even-aged rotation time; supply of a certain type of tree species
DisadvantagesLittle variation in tree species and age = not as much habitat variety as in natural forests = low biodiversity
21. (1) Ch 12: Describe the advantages/disadvantages of monoculture.

22. (1) Ch 12: Explain the importance of industrial agriculture and the Green Revolution.
Industrial technology (use of machines/technology in farming) was part of the Green Revolution, which gave developing countries a way to sustain themselves and feed their people. This lead to an increase in fossil fuel use to produce fertilizer and pesticides. 23. (1) Ch 15-16: Make a Venn Diagram to Compare/contrast low-level and high-level ozone.Low – tropospheric, dangerous, due to vehicles and industryHigh – stratospheric, safe, natural process to warm the EarthBoth- contain similar chemicals

24.(1) Ch 14: Make a Venn Diagram Compare / contrast point and non-point pollution
Point – distinct locations of pollution; ex: factories or sewer pipesBoth: types of pollution sourcesNon-Point – comes from many places spread over a large area; ex: runoff produced by rain or snow, runoff from oil covered streets, runoff from agricultural fields
25. (1) Ch 14: Explain why ground water (aquifer) pollution is difficult to clean up.
Hidden from view and difficult to monitor; takes years to rid contaminants – better to prevent than clean-up; positive: permeable, allows water to cycle through naturally.
TOTAL: 28 points

Bell Ringer Make-Up: April 27th – May 8th
4/27: What is the Greenhouse Effect?4/28: TRUE OR FALSE:- Winds distribute heat and moisture globally.4/29: What is the difference between global warming and global climate change? (p491)4/30: List the (4) evidence used to study and support climate change. (p491)5/1: What is a carbon footprint?5/4: List Earth’s four spheres. 5/5: Define the Law of Conservation of Matter.5/6: How do independent and dependent variables differ?5/7: How is a food chain different from a food web?5/8: How does biotic differ from abiotic?
May 12th
Bell Ringers List the four types of wetlands.*Make-Up April 27th-May 8th Bell Ringers!
Learning TargetI WILL PASS MY EOC!
Objectives 1. REVIEW EOC Study Guide Questions 26-42

26. (1) Ch 19: Explain the composition of municipal solid waste (trash). Paper products make-up the largest component of trash. Also includes yard debris, food scraps and plastic.

27. (3) Ch 4: Compare the impact extirpation, extinction and mass extinction have on biodiversity
Factor Effects on BiodiversityImpact Extirpation Disappearance of an organism from a
particular area but not globally; does push organism towards extinction, further decreasing biodiversity.
Extinction The disappearance of a species from the Earth; 99% of all species that once lived are now gone = decreases biodiversity
Mass Extinction Many species become extinct at once; 5 worldwide extinctions in history, decreases biodiversity greatly

28. (3) Ch 11: Describe resource management approaches to include
Approach Effects on Resource Management
Maximum Sustainable Yield Harvest the maximum amount of a resource
without reducing the amount of future harvests
Ecosystem Based Management Harvest resources in ways that minimize
impact on the ecosystems and ecological processing that provide resources
Adaptive Management Scientifically testing different management approaches in an area; one after the other, then customizing an approach based on the results

29. (1) Ch 11: Explain why there is less biodiversity in a tree plantation than in a similar sized naturally occurring forest.
A tree plantation is a large scale planting of a single crop of trees that are roughly the same age and size, unlike those in a natural forest. This leads to a lower biodiversity. ***Succession: the regrowth of a forest after a natural or man-made disaster; EX: after a mudslide, plants and animals will return to an area 30.(1) CH 17/18: Using a VENN diagram Compare/contrast renewable with nonrenewable resources.
Renewable: a resource that can be recycled or get more of; ex: soil, wind, solar
Non-Renewable: a resource that once it is used, it is gone and cannot get more of it; EX: fossil fuels: oil, coal, natural gas

*31. (3) Ch 15/16: Understand various environmental laws/policies and agencies to include:
Environmental Law/Policy
What does the abbreviation represent?
Description
NEPA* The National Environmental Policy Act
Promotes enhancement of the environment, lead to the Environmental Impact Statement (EIS)
EPA* Environmental Protection Agency
Increase air quality and human health
ESA* Endangered Species Act
Helps to protect endangered species; no hunting/poaching/trading; no harming habitat; US Fish and Wildlife keeps a list and develops recovery plans

32. (4) Ch 2: Explain the different approaches to environmental policies to include
Approach Description
Command and Control A government body sets rules and threatens punishment for
violations
Subsidy A give away of cash or public resources that is intended to encourage a particular activity or lower the price of a product
Green Tax Taxes imposed on companies that participate in activities or produce products that are harmful to the environment
Cap and Trade A government determines the overall amount of pollution it will accept for a specific pollutant and issues permits that allow polluters to emit a certain fraction of that amount

33. (4) Ch 11: Compare the advantages and disadvantages of timber harvesting methods to include:
Timber Harvesting Method
Description Advantages Disadvantages
Clear Cutting All trees in a certain area are cut down
Creates more lumber Reduces our oxygen and destroys animal habitats, leads to erosion and even-aged regrowth of trees leading to decrease in biodiversity
Seed Tree Small numbers of mature and healthy seed-producing tress are left standing so they can reseed the logged area
Less harmful than clear-cutting
Even-aged regrowth
Shelter Wood Small number of trees are left in place to provide shelter for the seedlings as they grow
Less harmful that clear cutting
Even age regrowth
Selection Systems
Only some trees are cut at once
Resembles a forest Dangerous to workers and expensive

Extra Info
*Biodiversity: reduced by only planting one type of tree back into the ecosystem after clear-cutting. Ex: Clear cut the forest, only plant back spruce trees.

34. (3)Ch 7: Differentiate between the three types of species diversity to include:
Type Description
Species Diversity
The number or variety of species of a particular region
Genetic Diversity
The differences in DNA among individuals within species and populations
Ecosystem Diversity
The number and variety of ecosystems within a given area

35. (1) Ch 7: What human activity results in the greatest loss of biodiversity? habitat change that leads to habitat loss, could be due to pollution, invasive species, overharvesting, or climate change 36. (no points) YOU NEED TO REMEMBER THIS: Cost effectiveness is the greatest factor in the development and implementation of alternative energy sources.

37. (4) Ch 3: Identify and describe the biogeochemical cycles in the ecosystem to include:
Biogeochemical Cycle Description Example
Carbon Cycle How a carbon atom cycles through the environment
Photosynthesis, cellular respiration. Sediments, ocean
Nitrogen Cycle How nitrogen moves through the environment – cannot cycle out of biosphere on its own
Important for DNA/RNA; essential for plant growth
Hydrological Cycle How water cycles through the environment
Evaporation/transpiration, condensation, precipitation
Phosphorus Cycle How phosphorus cycles through the environment
Keeps phosphorus availability low, overuse of fertilizer can lead to eutrophication

38. (1) Ch 3: What is a carbon sink and provide examples:
Carbon Sink
Description/Definition
Absorbs more carbon that it releases; roughly 1-2 billion metric tons of carbon unaccounted for, not returned to atmosphere or ocean
Examples
Taken in by the coniferous trees of the Boreal Forest (northern forests)

39. (4) Ch 8: Explain the various population demographics to include:Population Demographics Description Example
Population Density The number of individuals within a population per unit area
“how crowded it is”; “how many people live in a square mile”
Age Structure “Age Distribution”; describes the relative numbers of organisms of each age within a population
Can look at individuals who make-up the pre-reproductive/reproductive/post reproductive populations
Distribution Patterns How organisms are arranged within an area
Clumped, random or uniform

Extra Info
Demographic Transition

40. (4) Ch 8: What is a Population Structure Histogram and how do you interpret it.
A population structure histogram describes the relative numbers of organisms of each age within a population. Use the population structure histogram above to answer the following questions:
Which country has the SMALLEST percentage of adults reaching age 80? Congo
Looking at the US, are there more females OR males over the age of 80? Females
Does Germany or the US have a higher percentage of people age 0-4? US
41. (1) Ch 12: How can biotechnology impact biodiversity? (think: cloning, selective breeding, GMOs) Negatively: by increasing land cultivation, population growth and other environmental pressures. Positively: cloning animals on the brink of extinction 42. (1) Ch 5: How does natural selection and evolution impact the biodiversity of an ecosystem? (think: genetic changes): The biodiversity decreases because the ‘most fit’ out compete and out-live the ‘less fit’.
**Advantage of Mining = increase jobs (decrease unemployment rate)
TOTAL = 38 points

May 13th
Bell Ringers List three types of sustainable farming practices.
*Make-Up April 27th – May 8th Bell Ringers
Learning Target: I WILL PASS MY EOC!
*EOC SG Answers on the website: www.uhs-titans.comObjectives
a. Underclassman – you may give me your SG to keep so you do not lose it (I will give back to you Friday, May 21st)b. Seniors – PLEASE study tonight!!!!1. Make-Up Test or Test Corrections2. Waste Management : Read p582-5883. Complete Landfill Activity Sheet (follow color key)

Make-Up Day• ONLY to be done IN my classroom.
• ANY assignment REMOVED from my classroom will NOT be accepted.
• You have TODAY during this class period, LUNCH TODAY, LUNCH TOMORROW and LUNCH FRIDAY ONLY to complete these assignments.
• DO NOT ask for more time, as these are already low scores or zeros and I have given you the opportunity to change that.
• IF you have TEST corrections to make, I must first mark them wrong. Please bring your test to my desk.
TEST CORRECTIONS: 1. Write the correct letter on the scan-tron.
2. Write the page number where you found the correct answer. *You may ONLY use textbook, no notes/PP/ws/study guide etc.
Please hand me COMPLETED work to be graded, place UNFINISHED work in to be completed in the folder. It will remain there until Friday, at which time I will grade it!
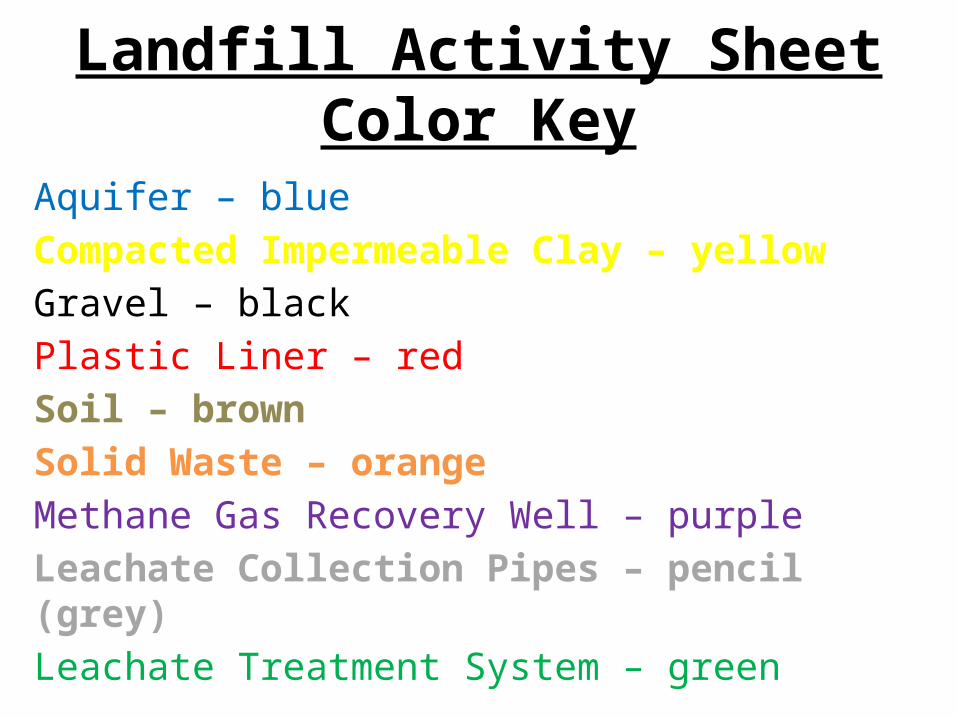
Landfill Activity Sheet Color Key
Aquifer – blueCompacted Impermeable Clay – yellowGravel – blackPlastic Liner – redSoil – brownSolid Waste – orangeMethane Gas Recovery Well – purple Leachate Collection Pipes – pencil (grey)Leachate Treatment System – green

Bell Ringer Make-Up: April 27th – May 8th
4/27: What is the Greenhouse Effect?4/28: TRUE OR FALSE:- Winds distribute heat and moisture globally.4/29: What is the difference between global warming and global climate change? (p491)4/30: List the (4) evidence used to study and support climate change. (p491)5/1: What is a carbon footprint?5/4: List Earth’s four spheres. 5/5: Define the Law of Conservation of Matter.5/6: How do independent and dependent variables differ?5/7: How is a food chain different from a food web?5/8: How does biotic differ from abiotic?

May 14th Bell Ringers List three factors that contribute to soil pollution.
Learning Target: I WILL PASS MY EOC!
Objectives 1. *EOC SG Answers on the website:
www.uhs-titans.com2. Waste Management Notes/begin lab3. Finish Waste Mgt activity sheet

Waste Management Notes
• Did You Know? – The average American generates more than 4.5 pounds of trash per day.

What is Waste?Any unwanted material or substance that results from a
human activity or process.
TYPES:
– Municipal solid waste: From homes and businesses
– Industrial waste: Resulting from manufacturing, agriculture, and mining
– Hazardous waste: Toxic, reactive, flammable, and corrosive
– Wastewater: Includes used, discarded water and runoff

Methods of Solid Waste Disposal: Sanitary Landfills
• Waste buried in
the ground or carefully
piled into mounds
• Designed to
prevent groundwater
contamination and
minimize soil and
air pollution

Did You Know? Regulations require that landfills be at least 6 m above the water table
Benefits of Landfills
Decomposition yields methane, which can be used like natural gas.
When full, landfills are capped. The land can be used for recreation.

Costs of Landfills
• Leachate may eventually escape and contaminate the groundwater.
• Trash decomposes very slowly.
• Few communities are willing to host landfills (NIMBY).

Waste Management Vocabulary
aquifer An underground layer of permeable rock, sand, gravel or soil that contains or conducts groundwater. The pore spaces in aquifers are filled with water and are interconnected, so that water flows through them. Source of water for springs and wells.
geosynthetic: Human-made materials for earth systems (such as landfills, dams, roads and retaining walls).
landfill: An engineered site used to dispose of garbage by burying it.
leachate: Contaminated water that seeps out of landfills. Often contains high amounts of organic matter and toxic chemicals.

Waste Management Vocabularyliner system: The technical term for the layers of
materials (such as clay and geosynthetics) that protect landfills from erosion, and keep trash and leachate from escaping from landfills.
impermeable: A material characteristic that does not allow a fluid (such as water) to flow through it.
optimize: To make a system as good or functional as possible.
requirement: What a particular product, system or service should do. A necessary attribute, capability, characteristic, quality or limitation. In engineering, sets of requirements are inputs into the design stages of product development.

Design, Build and Test Your Own Landfill
SummaryYou will design and build model landfills using materials similar to those used by engineers for full-scale landfills.
Your completed small-size landfills are "rained" on and subjected to other erosion processes.
The goal is to create landfills that hold the most garbage, minimize the cost to build and keep trash and contaminated water inside the landfill to prevent it from causing environmental damage.
Teams create designs within given budgets, test the landfills' performance, and graph and compare designs for capacity, cost and performance.

Engineering Connection
Engineers design landfills to contain waste from many types of anthropogenic (human-generated) sources. The garbage comes from many places, including household trash cans, worn-out tires, sludge from wastewater treatment plants, old couches, and scrap metal. The main challenge for engineers is to keep the waste materials from being a health hazard. Also, because of economic constraints, landfills must be as small as possible while holding the most amount of waste material possible. Engineers work with regulators to design landfills that are suitable for hazardous and non-hazardous waste.
Introduction/Motivation
• The people living in the US make about 250 million tons of trash every single year! (EPA, 2009) And, about 300 million people live in the US. So, that works out to about 4½ pounds of trash generated per person — every single day!
• How much of this garbage do you think gets recycled and composted? Only about one-third of this trash gets recycled or composted, which means that on average, you make three pounds of trash every day that we have to put somewhere (and the US makes 470 tons of trash every day).
• Where do you think we should put this trash? Can we just dump it out in a field? Why not? What if the dump or landfill is near a lake or a river? Groundwater that is stored in aquifers is always flowing. People use wells to bring groundwater up from the aquifers to drink. We must keep dirty water that comes from the landfill (leachate) from getting into the groundwater, otherwise we can make people sick.

WHERE SHOULD THE TRASH GO?So what should be put underneath all the trash in the landfill?
How about once the landfill is finished?
Should we cover the landfill or leave it open to the air?
What should we cover it with?
Erosion can affect your landfill if you are not careful.
Landfills must be designed well enough to withstand erosion from rain, wind or even earthquakes.
Let's make some models and learn what works best.

Learning Objectives
After this activity, you should be able to:• Describe a landfill and its purpose.• Explain the alternatives to dumping human-made
garbage in landfills and ways to decrease the amount of waste that ends up in landfills.
• Describe how landfills can be hazardous for the environment if they are not well engineered.
• Describe the kinds of materials make good liner systems for landfills.
• Explain what it means to optimize something.

Procedure
Each group must design a landfill that 1) Can hold the most garbage.2) Minimizes the cost.3) While making sure that the landfill is able to contain the waste during a rainstorm
without allowing leachate to get to the town.
As you do this, just like engineers, you will be following the steps of the engineering design process:
Understand the needBrainstorm different designsSelect a Design PlanCreate TestAnalyze Improve

MATERIALSEach group needs:
– clear plastic tub – clay – sand– gravel – 15 cotton balls
• (optional) tiny houses and buildings (such as Monopoly game houses and hotels), or any other simple representation to simulate the presence of a town sitting on the sand base
• Student Lab Sheet• Graph Paper

Environmental Engineering, Landfills: Build Them Better Lesson, Design, Build and Test Your Own
Landfill Activity — Roles and Optimization Worksheet
You will be in groups of FOUR. Each member of the group will have one of these roles:
Project Engineer Design Engineer
Construction Engineer Budget Office

Project Engineer
The project engineer is the project leader.
This person is in charge of final decisions.
S/he listens to all of the engineers and helps to decide on the best idea.
S/he makes sure the landfill gets built on schedule.

Design Engineer
The design engineer plans how the landfill will work and look.
This person is in charge of picking materials and deciding how the landfill should be built.
S/he works with the budget office (when picking materials) and construction engineer (when deciding how to build the landfill).

Construction Engineer
The construction engineer builds the landfill.
This person gets the plans about how to build the landfill from the design engineer.
If the landfill design must be fixed, s/he talks to the budget office about getting more or different materials.
Budget Office
The budget office makes sure that the project spends the least amount of money possible.
This person helps the design engineer pick materials.
S/he is in charge of filling out the budget worksheet, doing the calculations, and keeping track of how much money has been spent.
You cannot go over budget!!!

DECIDE On ROLES
You have 2 minutes to decide who will assume each role.

STEP ONE:Have the "design engineer" students draw out his/her team's landfill design and complete the budget worksheet.
If time permits, have the "design engineer" calculate the volume of the plastic bin and compare this to the volumes of materials (e.g., sand, clay, etc) they are using.
*Note: 1 cup ≈ 15 in3.

Ms. McCann is the Building Authority
• You must bring the engineering landfill designs and budget worksheets for Ms. McCann to Sign-Off!
• Bring both your approved (signed) designs and completed budgets to the "supply shop" to get supplies.

Step Two: Construct Base Liner SystemStudents construct the base liner systems for their model landfills (see Figure 2).
The goal is to keep water from getting out of the landfill. Therefore, materials such as clay and geosynthetics are good choices, because water cannot flow through them easily.
Basically, the liner should look like a clay bowl or box. Of course, not all teams will choose this path — so you may see Popsicle sticks, toothpicks, etc., at this stage. )
The word "system" is used because your team can use a combination of materials to make base liners. However, because of the budget constraint, you cannot afford to buy many things.
*Remember to save some funds to purchase materials to build your top cap (to put on after the garbage is inserted).
A landfill without a top is no good for anybody!
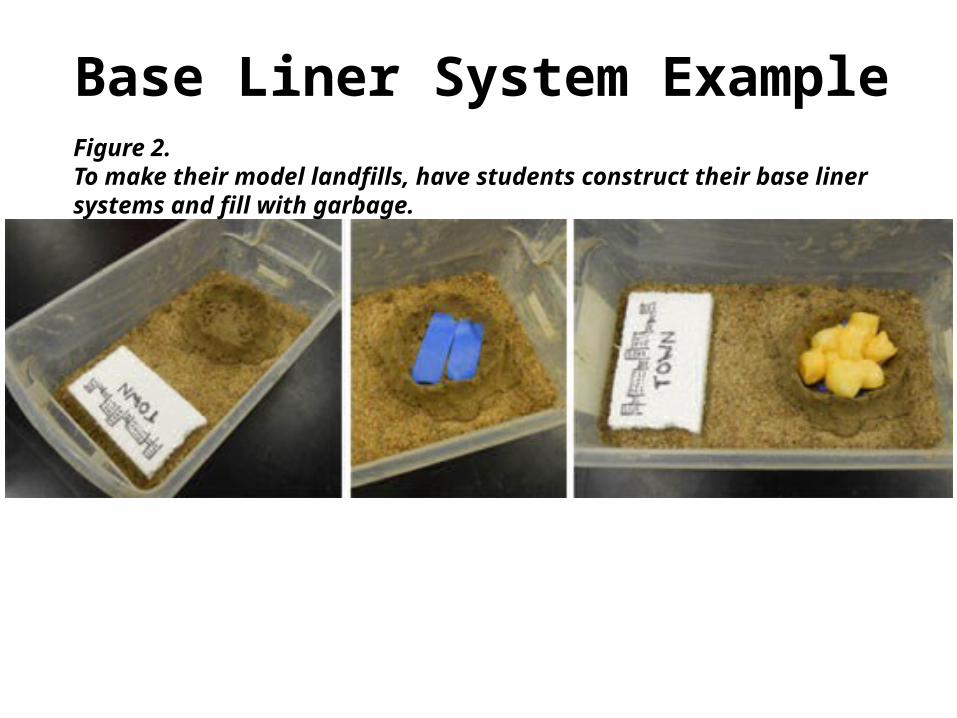
Base Liner System ExampleFigure 2. To make their model landfills, have students construct their base liner systems and fill with garbage.

Step Three: Filling the Landfill with ‘garbage’
Fill the landfill with "garbage" (see Figure 2) making sure not to let the food coloring seep out into the area around the landfill before construction is completed.
Count how many cotton balls you put in. Have the Project Engineer tell you how many to put in.
*Record the quantity of garbage cotton balls that your landfill can hold on the worksheet.

Step FOUR: Construct the Top Cap Liner System
Constructing the top cap liner systems for their landfills (see Figure 3):
The purpose of the top cap is to keep the rain out of the landfill.
Therefore, like the bottom liner system, it should be made of materials water cannot flow through.
Additionally, some protection (such as gravel) can be placed on top to keep rainwater and sunlight from eroding away the liner.

Figure 3. Have students construct top cap liner systems using clay and gravel. Then test the model landfills with "rainstorms

Step FIVE: TESTING YOUR LANDFILL DESIGNWith Ms. McCann: Test Landfill Performance
1. Create "rainstorms" by pouring water on the model landfills (see Figure 3).
2. Use a pencil or Popsicle stick to dig into the sand outside of the landfill and near the town to look for any seeping food coloring (leachate) (see Figure 4). Make multiple soils tests.
3. Repeat the rainstorm, if desired.
4. (optional) Apply other erosion forces to the model landfill, such as wind or earthquakes.

Figure 4. Does it work? Test the model for any landfill leakage.

Recording InformationDocument on your worksheets the performance of their landfills:
How much garbage did it hold?How much it cost?Did it or did it not leak?
Once you have recorded the garbage capacity, cost and performance, PRESENT your designs to the class.

DESIGN Comparison1. Create a table that compiles data (amount of garbage, cost and performance) from each group.
2. Present the data on large, colorful posters.
3. Make a line graph of the amount of garbage each landfill held.
4. Make a line graph of the cost of each landfill.
5. Make a line graph of the performance of each landfill (rate as pass/fail or on a 1-to-5 scale).
6. Discuss the differences between presenting data in graphs as opposed to tables.
7. Class discussion that compares and analyzes all group data, and explores the concept of optimization.
8. Complete the post-activity reflection assessment questions.
*Determine which landfill is most optimal.

May 15th
Bell Ringers What is Integrated Waste Management?
Learning Target I WILL PASS MY EOC!
Objectives 1. Seniors: EOC DAY 2 Underclassman: Waste Management: Landfill Lab

May 18th Bell Ringers List the three types of methods of hazardous waste disposal.
Learning Target I will be able to describe how waste is properly disposed.
Objectives 1. Waste Management Landfill Lab – Complete

May 19th Bell RingersDescribe the process used to dispose of municipal solid waste (trash).
Learning TargetI will be able to describe how waste is properly disposed.
Objectives 1. Complete Waste Lab2. Begin Energy Unit: Nonrenewable Energy Poster

May 20th SUB
Bell RingersHow do renewable and nonrenewable energy sources differ?
Learning Target I will be able to describe the different sources of energy.
Objectives 1. Nonrenewable Energy Activity Sheets
May 21st
Bell RingersWhat are the six types of alternative energy?
Learning Target I will be able to describe the different sources of energy.
Objectives 1. Renewable Energy Lab: Windmills

May 22nd
Bell RingersWhat is eutrophication?
Learning Target I will be able to describe the different sources of energy.
Objectives 1. Renewable Energy Lab: Windmills2. Pass back EOC study guides

May 25th
• NO SCHOOL!

May 26th
Bell Ringers What is a Carbon Sink?
Learning TargetI will be able to describe the different sources of energy.
Objectives 1. Finish Renewable Energy Lab2. ??Begin Common Lab #1

May 27th
Bell Ringers What is eutrophication?
Learning Target I will pass my EOC!
Objectives 1. 1st/2nd: Review for EOC2. 3rd-7th: Common Lab #1 Day 1
May 29th
Bell Ringers: How do low-level and high-level ozone differ?
Learning Target: I will Pass my EOC!
Objectives 1. 1st/2nd: EOC Testing 2. 3rd: Review for EOC3. 5th - 7th: Common Lab #1 Day 2

May 30th
Bell Ringers: How does point source pollution differ from non-point source pollution?
Learning Target I will pass my EOC!
Objectives 1. 1st/2nd: Common Lab #1 Day 12. 3rd: EOC Testing3. 5th/6th: Review For EOC4. 7th: Common Lab Day 3

June 1st
Objectives 1. 1st/2nd: Common Lab #1 Day 22. 3rd: Common Lab #1 Day 23. 5th/6th: EOC Testing4. 7th: Review for EOC

June 2nd
Objectives : MAKE-UP Day1. 1st/2nd: Common Lab #1 Day 32. 3rd: Common Lab #1 Day 33. 5th/6th: Common Lab Day 34. 7th: EOC Testing
*Make-Up Bell Ringers!

June 3rd: Early Dismissal
SUMMER
SUMMER
SUMMER
SUMMER