May 2014 Biol. Pharm. Bull. 37 Review Total Purine and ...
13
May 2014 709 Biol. Pharm. Bull. 37(5) 709–721 (2014) © 2014 The Pharmaceutical Society of Japan Total Purine and Purine Base Content of Common Foodstuffs for Facilitating Nutritional Therapy for Gout and Hyperuricemia Kiyoko Kaneko,* ,a Yasuo Aoyagi, b Tomoko Fukuuchi, a Katsunori Inazawa, a and Noriko Yamaoka a a Laboratory of Biomedical and Analytical Sciences, Faculty of Pharma Sciences, Teikyo University; 2–11–1 Kaga, Itabashi, Tokyo 173–8605, Japan: and b Department of Health and Nutrition, Kagawa Nutrition University; 3–9–21 Chiyoda, Sakado, Saitama 350–0288, Japan. Received December 14, 2013; accepted February 17, 2014; advance publication released online February 20, 2014 Purines are natural substances found in all of the body’s cells and in virtually all foods. In humans, purines are metabolized to uric acid, which serves as an antioxidant and helps to prevent damage caused by active oxygen species. A continuous supply of uric acid is important for protecting human blood vessels. However, frequent and high intake of purine-rich foods reportedly enhances serum uric acid levels, which re- sults in gout and could be a risk factor for cardiovascular disease, kidney disease, and metabolic syndrome. In Japan, the daily intake of dietary purines is recommended to be less than 400 mg to prevent gout and hy- peruricemia. We have established an HPLC method for purine analysis and determined purines in a total of 270 foodstuffs. A relatively small number of foods contained concentrated amounts of purines. For the most part, purine-rich foods are also energy-rich foods, and include animal meats, fish meats, organs such as the liver and fish milt, and yeast. When the ratio of the four purine bases (adenine, guanine, hypoxanthine, and xanthine) was compared, two groups of foods were identified: one that contained mainly adenine and guanine and one that contained mainly hypoxanthine. For patients with gout and hyperuricemia, the amount of total purines and the types of purines consumed, particularly hypoxanthine, are important considerations. In this context, the data from our analysis provide a purine content reference, and thereby clinicians and patients could utilize that reference in nutritional therapy for gout and hyperuricemia. Key words purine content; nutritional therapy; gout; hyperuricemia; HPLC 1. INTRODUCTION Dietary purines, including nucleotides, nucleosides and bases, are reported to be absorbed as their corresponding nucleosides or bases and are then utilized through the purine metabolic pathway (Fig. 1). The end product of purine me- tabolism is uric acid and the increase of serum uric acid level causes gout and hyperuricemia. 1–3) Gout and hyperuricemia are therefore considered to be lifestyle-related diseases. 4–6) Pa- tients with gout and hyperuricemia tend to have consumed a large amount of meat or giblets over many years. 7) During the last 10 years, epidemiological surveys have revealed an asso- ciation between the intake of purine-rich food and the serum concentration of uric acid, 8,9) which is higher in individuals who regularly consume large quantities of purine-rich foods than in those who consume less. Moreover, an association between the intake of these foods and the risk of gout has also been reported. 10,11) A higher consumption of meat and seafood is reportedly associated with an increased gout risk. Acute purine intake also increases the risk of recurrent gout attacks by almost fivefold. 12) With the realization that hyperuricemia and gout are related to excessive intake of purine-rich foods, education and proper guidance is considered to be important. In the guidelines for the management of hyperuricemia and gout in Japan, spe- cific details for lifestyle guidance are included. 13) In nutritional therapy, it is recommended that the amount of dietary purines should be less than 400 mg per day. Guidelines for hyperuri- cemia and gout are also given in the United States and the United Kingdom. 14–16) Although there have been several reports investigating the effects of food on purine metabolism and the serum concen- tration of uric acid, 2,17–20) only a few have reported both the amounts of the four purine bases and the total amount of purines in foodstuffs. 21,22) There are several reports on purine content in foodstuffs, but these reports are written in Japanese or in German and are not highly cited. 23–29) We previously es- tablished a method to determine the purine base and total pu- rine content of alcoholic beverages. 30) We applied this method to several vegetables and mushrooms, 22) and determined the purine base and total purine content of many foodstuffs. 23,28,29) We recently refined this technique to enable the detection of very small amounts of purines in alcoholic beverages. 31) In the present review, we add our latest data and summa- rize the amount of total purines as well as the four individual purine bases in various foodstuffs, as determined by high- performance liquid chromatography (HPLC). We also calcu- lated the ratio of adenine, guanine or hypoxanthine to the total purine in these foods, and discussed the association with the risk of gout. 2. ANALYTICAL METHOD FOR THE DETERMINA- TION OF PURINE CONTENT IN FOODSTUFFS 2.1. Pretreatment of Foodstuffs The protocol of purine analysis in foodstuffs is shown in Fig. 2. Foodstuffs were purchased from several supermarkets. For several types of food, the effect of heating on purine content was examined. Heating of foodstuffs was performed by boiling in hot water, steaming in a steamer, or frying in a * To whom correspondence should be addressed. e-mail: [email protected] The authors declare no conflict of interest. Review
Transcript of May 2014 Biol. Pharm. Bull. 37 Review Total Purine and ...

May 2014 709Biol. Pharm. Bull. 37(5) 709–721 (2014)
© 2014 The Pharmaceutical Society of Japan
Total Purine and Purine Base Content of Common Foodstuffs for Facilitating Nutritional Therapy for Gout and Hyperuricemia
Kiyoko Kaneko,*,a Yasuo Aoyagi,b Tomoko Fukuuchi,a Katsunori Inazawa,a and Noriko Yamaokaa
a Laboratory of Biomedical and Analytical Sciences, Faculty of Pharma Sciences, Teikyo University; 2–11–1 Kaga, Itabashi, Tokyo 173–8605, Japan: and b Department of Health and Nutrition, Kagawa
Nutrition University; 3–9–21 Chiyoda, Sakado, Saitama 350–0288, Japan.Received December 14, 2013; accepted February 17, 2014;
advance publication released online February 20, 2014
Purines are natural substances found in all of the body’s cells and in virtually all foods. In humans, purines are metabolized to uric acid, which serves as an antioxidant and helps to prevent damage caused by active oxygen species. A continuous supply of uric acid is important for protecting human blood vessels. However, frequent and high intake of purine-rich foods reportedly enhances serum uric acid levels, which re-sults in gout and could be a risk factor for cardiovascular disease, kidney disease, and metabolic syndrome. In Japan, the daily intake of dietary purines is recommended to be less than 400 mg to prevent gout and hy-peruricemia. We have established an HPLC method for purine analysis and determined purines in a total of 270 foodstuffs. A relatively small number of foods contained concentrated amounts of purines. For the most part, purine-rich foods are also energy-rich foods, and include animal meats, fish meats, organs such as the liver and fish milt, and yeast. When the ratio of the four purine bases (adenine, guanine, hypoxanthine, and xanthine) was compared, two groups of foods were identified: one that contained mainly adenine and guanine and one that contained mainly hypoxanthine. For patients with gout and hyperuricemia, the amount of total purines and the types of purines consumed, particularly hypoxanthine, are important considerations. In this context, the data from our analysis provide a purine content reference, and thereby clinicians and patients could utilize that reference in nutritional therapy for gout and hyperuricemia.
Key words purine content; nutritional therapy; gout; hyperuricemia; HPLC
1. INTRODUCTION
Dietary purines, including nucleotides, nucleosides and bases, are reported to be absorbed as their corresponding nucleosides or bases and are then utilized through the purine metabolic pathway (Fig. 1). The end product of purine me-tabolism is uric acid and the increase of serum uric acid level causes gout and hyperuricemia.1–3) Gout and hyperuricemia are therefore considered to be lifestyle-related diseases.4–6) Pa-tients with gout and hyperuricemia tend to have consumed a large amount of meat or giblets over many years.7) During the last 10 years, epidemiological surveys have revealed an asso-ciation between the intake of purine-rich food and the serum concentration of uric acid,8,9) which is higher in individuals who regularly consume large quantities of purine-rich foods than in those who consume less. Moreover, an association between the intake of these foods and the risk of gout has also been reported.10,11) A higher consumption of meat and seafood is reportedly associated with an increased gout risk. Acute purine intake also increases the risk of recurrent gout attacks by almost fivefold.12)
With the realization that hyperuricemia and gout are related to excessive intake of purine-rich foods, education and proper guidance is considered to be important. In the guidelines for the management of hyperuricemia and gout in Japan, spe-cific details for lifestyle guidance are included.13) In nutritional therapy, it is recommended that the amount of dietary purines should be less than 400 mg per day. Guidelines for hyperuri-cemia and gout are also given in the United States and the
United Kingdom.14–16)
Although there have been several reports investigating the effects of food on purine metabolism and the serum concen-tration of uric acid,2,17–20) only a few have reported both the amounts of the four purine bases and the total amount of purines in foodstuffs.21,22) There are several reports on purine content in foodstuffs, but these reports are written in Japanese or in German and are not highly cited.23–29) We previously es-tablished a method to determine the purine base and total pu-rine content of alcoholic beverages.30) We applied this method to several vegetables and mushrooms,22) and determined the purine base and total purine content of many foodstuffs.23,28,29) We recently refined this technique to enable the detection of very small amounts of purines in alcoholic beverages.31)
In the present review, we add our latest data and summa-rize the amount of total purines as well as the four individual purine bases in various foodstuffs, as determined by high-performance liquid chromatography (HPLC). We also calcu-lated the ratio of adenine, guanine or hypoxanthine to the total purine in these foods, and discussed the association with the risk of gout.
2. ANALYTICAL METHOD FOR THE DETERMINA-TION OF PURINE CONTENT IN FOODSTUFFS
2.1. Pretreatment of Foodstuffs The protocol of purine analysis in foodstuffs is shown in Fig. 2.
Foodstuffs were purchased from several supermarkets. For several types of food, the effect of heating on purine content was examined. Heating of foodstuffs was performed by boiling in hot water, steaming in a steamer, or frying in a
* To whom correspondence should be addressed. e-mail: [email protected]
The authors declare no conflict of interest.
Review

710 Vol. 37, No. 5
frying pan.Each foodstuff was divided into several parts and weighed.
Two or three pieces of the same foodstuff of similar weight were homogenized with a Polytron homogenizer PT3100 (Kimematica AG, Littau-Lucerne, Switzerland) at 12000 rpm on ice and frozen before lyophilization. After lyophilization, 30 mL of 70% perchloric acid was added, and the solution was heated at 95°C with stirring for 60 min. This converted the nucleic acids, nucleosides, and nucleotides to corresponding purine bases by hydrolysis. A portion of the hydrolyzed sam-ple solution was neutralized and centrifuged, and then aliquots
were injected into the HPLC system.22,28–30)
2.2. HPLC HPLC was performed under the follow-ing conditions: instrument, Shimadzu LC10A HPLC system with autoinjector SIL-10AD (Kyoto, Japan); column, Shodex Asahipak GS-320HQ (7.6 mm i.d. and 300 mm length) (Tokyo, Japan); mobile phase, 150 mM sodium phosphate buffer (pH 2.5–2.8); flow rate, 0.6 mL/min; column temperature, 35°C; and detector wavelength, 260 nm.22,28–30) The measurement of adenine, guanine, hypoxanthine, and xanthine was performed in duplicate.
Purine bases (adenine, guanine, hypoxanthine, xanthine,
Fig. 2. Determination of Purine Content in Foodstuffs
Fig. 1. Purine Metabolism and Uric Acid Production

May 2014 711
and uric acid) were completely separated by HPLC and their detection limits were 0.05–0.2 ng (Fig. 2).
2.3. Peak-Shift Assay with Enzyme Treatment To eliminate interference from other metabolic compounds, a comparison with or without enzyme treatment was performed. Xanthine oxidase is an enzyme that oxidizes hypoxanthine, xanthine, adenine, and guanine, and guanase is an enzyme that converts guanine to xanthine. Each aliquot of the food samples was therefore treated with xanthine oxidase and gua-nase before HPLC analysis.22,28–31) The content of purine bases was determined as the mean of two or three experiments. As shown in Figs. 3 and 4, after undergoing enzymatic treatment to identify purine base peaks, the amount of each of the four purine bases except uric acid was determined exactly.
2.4. Total Purine Content and Calculated Uric Acid Value The total purine content was calculated from the com-
bined amounts of adenine, guanine, hypoxanthine, and xan-thine. The calculated uric acid value represents the amount of uric acid produced in the body when ingested food is absorbed and metabolized in the purine metabolic pathway. Calculated amount as uric acid (mg/100 g) was given after multiplying the molecular weight of uric acid (168.1) by total purine amount (µmol/100 g) and dividing by 1000.
3. TOTAL PURINE AND PURINE BASE CONTENT OF FOODSTUFFS
3.1. Classification of Foodstuffs According to the Pu-rine Content Total purine and purine base content of 8 cereals, 5 beans, 10 soybean products, 5 seaweeds, 2 eggs, 4 dairy products, 22 mushrooms, 2 fruits, 38 vegetables (sepa-rate parts), 43 meats (separate parts), 9 processed meats, 36
Fig. 3. Chromatograms of Tofu with or without Xanthine Oxidase TreatmentThe purine peaks are indicated with arrows. A: Adenine; G: Guanine; HX: Hypoxanthine; X: Xanthine. A′, G′, HX′, X′: Adenine, guanine, hypoxanthine, and xanthine, respectively, were oxidized and the peaks disappeared.
Fig. 4. Chromatograms of Tofu with or without Guanase TreatmentThe peaks of guanine and xanthine are indicated with arrows. G: Guanine; X: Xanthine. G′: Guanine was deaminated and the peak disappeared. Xanthine was generated from guanine by the action of guanase.

712 Vol. 37, No. 5
fish (separate parts), 9 fish roe or milt, 24 shellfish or mol-lusks, 8 dried or half-dried fish, 2 canned fish, 8 processed fish, 3 snacks, 17 seasonings, and 15 supplements are shown in Tables 1 to 8.
The amount of total purines was classified into five groups, the very low group: <50 mg/100 g, the low group: 50–100 mg/100 g, the moderate group: 100–200 mg/100 g, the high group: 200–300 mg/100 g, and the very high group: >300 mg/100 g. We determined considerable number of dried or half-dried food. When the dried food cannot be eaten without cooking, it is not classified into the high or very high group even if the appearance value of purine was high. In such food, the amount of purines increases from the corre-sponding raw value because the weight of foodstuffs is lighter following moisture evaporation than in its raw state.
3.2. Amount of Purines in Cereals, Beans, Soybean Products, and Dried Seaweeds Table 1 shows that most of the cereals, beans, and soybean products contained less than 50 mg/100 g purines. Dried soybean contained higher amounts of purines than other beans at 172.5 mg/100 g, although raw soybean (green soybean) had a much lower amount at
47.9 mg/100 g (very low group). Soybean products including tofu and soymilk contained less than 50 mg/100 g purines ex-cept for fermented soybeans (natto).
Seaweeds were all dried. Although wakame and nori had high purine values, they were dried and very light, and a little amount is used during cooking. Thus, seaweeds were not con-sidered to be foodstuffs affecting serum uric acid level.
All cereals, beans, soybean products, and seaweeds con-tained >60% of their total purines as adenine and guanine.
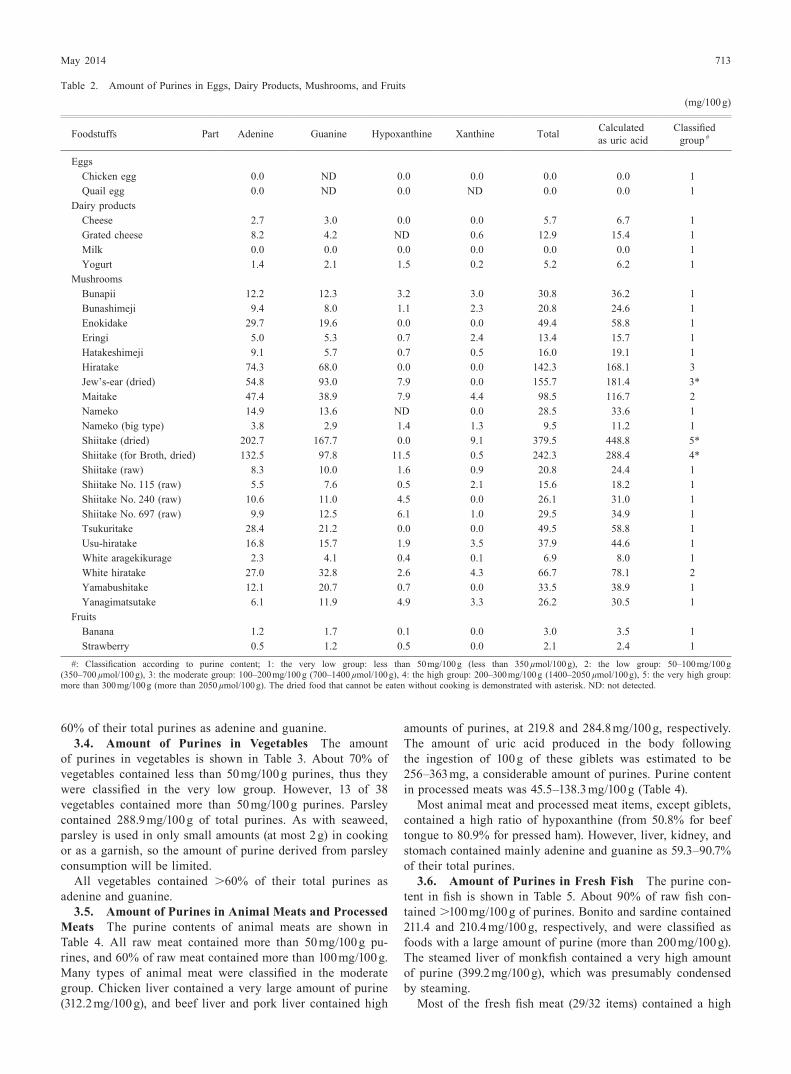
3.3. Amount of Purines in Eggs, Dairy Products, Mushrooms, and Fruits Eggs and dairy products contained almost no purine or less than 13 mg/100 g (Table 2). Most mushrooms, except for dried shiitake and hiratake, contained 6.9–98.5 mg/100 g purines, so they were classified in the low or very low group. Dried shiitake contained more than 240 mg/100 g purines. It is thought that the amount of purine became larger because purines in mushroom was condensed and the weight became light by drying. Purine content in 2 fruits, namely, banana and strawberry, was very low at 2.1 and 3.0 mg/100 g, respectively.
All dairy products and mushrooms contained more than
Table 1. Amount of Purines in Cereals, Beans, Soybean Products, and Dried Seaweeds(mg/100 g)
Foodstuffs Part Adenine Guanine Hypoxanthine Xanthine Total Calculated as uric acid
Classified group #
CerealsBarley 21.6 22.7 0.0 0.0 44.3 52.1 1Buckwheat flour 35.1 40.8 0.0 0.0 75.9 89.1 2Flour (bread flour) 12.2 13.6 0.0 0.0 25.8 30.3 1Flour (cake flour) 8.1 7.6 0.0 0.0 15.7 18.5 1Flour (pastry flour) 12.2 13.6 0.0 0.0 25.8 30.3 1Rice (polished) 10.8 15.1 0.0 0.0 25.9 30.3 1Rice (unpolished) 16.2 21.2 0.0 0.0 37.4 43.7 1Rice (with the bud) 14.9 19.6 0.0 0.0 34.5 40.3 1
BeansAlmond 13.6 13.8 2.3 1.7 31.4 37.0 1Azuki bean (dried) 33.8 43.8 0.0 0.0 77.6 90.8 2*Broad bean 14.1 19.9 1.3 0.2 35.5 41.5 1Green-peas (canned) 6.8 12.1 0.0 ND 18.8 21.9 1Peanut 18.9 28.6 0.0 1.6 49.1 57.1 1
Soybean productsBean curd lees (Okara) 15.0 24.0 4.5 5.0 48.6 56.6 1Deep-fried tofu 20.3 32.4 0.5 1.2 54.4 63.2 2Fermented soybean (Natto) 40.5 51.4 6.8 15.2 113.9 132.8 3Freeze-dried tofu 120.4 168.3 0.6 3.7 293.1 342.0 4*Green soybean 20.8 27.2 0.0 0.0 47.9 56.1 1Soymilk 7.7 11.7 2.5 0.0 22.0 25.8 1Soybean (dried) 74.3 98.2 0.0 0.0 172.5 201.7 3*Tofu (Kinu) 7.6 11.2 0.5 0.7 20.0 23.3 1Tofu (Momen, chilled) 14.0 16.7 0.4 0.0 31.1 36.5 1Tofu (Momen, 3 min boiled) 13.1 8.8 0.0 0.0 21.9 26.0 1
Dried seaweedsCladosiphon okamuranus (Mozuku) 5.6 9.4 0.5 0.0 15.4 18.0 1Hijiki 31.1 76.5 25.1 0.0 132.8 154.9 3*Kombu 18.0 21.8 4.7 1.9 46.4 54.5 1Nori 216.0 299.2 73.3 3.2 591.7 695.6 5*Wakame 67.7 148.1 46.6 0.0 262.4 306.5 4*
#: Classification according to purine content; 1: the very low group: less than 50 mg/100 g (less than 350 µmol/100 g), 2: the low group: 50–100 mg/100 g (350–700 µmol/100 g), 3: the moderate group: 100–200 mg/100 g (700–1400 µmol/100 g), 4: the high group: 200–300 mg/100 g (1400–2050 µmol/100 g), 5: the very high group: more than 300 mg/100 g (more than 2050 µmol/100 g). The dried food that cannot be eaten without cooking is demonstrated with asterisk. ND: not detected.
May 2014 713
60% of their total purines as adenine and guanine.3.4. Amount of Purines in Vegetables The amount
of purines in vegetables is shown in Table 3. About 70% of vegetables contained less than 50 mg/100 g purines, thus they were classified in the very low group. However, 13 of 38 vegetables contained more than 50 mg/100 g purines. Parsley contained 288.9 mg/100 g of total purines. As with seaweed, parsley is used in only small amounts (at most 2 g) in cooking or as a garnish, so the amount of purine derived from parsley consumption will be limited.
All vegetables contained >60% of their total purines as adenine and guanine.
3.5. Amount of Purines in Animal Meats and Processed Meats The purine contents of animal meats are shown in Table 4. All raw meat contained more than 50 mg/100 g pu-rines, and 60% of raw meat contained more than 100 mg/100 g. Many types of animal meat were classified in the moderate group. Chicken liver contained a very large amount of purine (312.2 mg/100 g), and beef liver and pork liver contained high
amounts of purines, at 219.8 and 284.8 mg/100 g, respectively. The amount of uric acid produced in the body following the ingestion of 100 g of these giblets was estimated to be 256–363 mg, a considerable amount of purines. Purine content in processed meats was 45.5–138.3 mg/100 g (Table 4).
Most animal meat and processed meat items, except giblets, contained a high ratio of hypoxanthine (from 50.8% for beef tongue to 80.9% for pressed ham). However, liver, kidney, and stomach contained mainly adenine and guanine as 59.3–90.7% of their total purines.
3.6. Amount of Purines in Fresh Fish The purine con-tent in fish is shown in Table 5. About 90% of raw fish con-tained >100 mg/100 g of purines. Bonito and sardine contained 211.4 and 210.4 mg/100 g, respectively, and were classified as foods with a large amount of purine (more than 200 mg/100 g). The steamed liver of monkfish contained a very high amount of purine (399.2 mg/100 g), which was presumably condensed by steaming.
Most of the fresh fish meat (29/32 items) contained a high
Table 2. Amount of Purines in Eggs, Dairy Products, Mushrooms, and Fruits(mg/100 g)
Foodstuffs Part Adenine Guanine Hypoxanthine Xanthine Total Calculated as uric acid
Classified group #
EggsChicken egg 0.0 ND 0.0 0.0 0.0 0.0 1Quail egg 0.0 ND 0.0 ND 0.0 0.0 1
Dairy productsCheese 2.7 3.0 0.0 0.0 5.7 6.7 1Grated cheese 8.2 4.2 ND 0.6 12.9 15.4 1Milk 0.0 0.0 0.0 0.0 0.0 0.0 1Yogurt 1.4 2.1 1.5 0.2 5.2 6.2 1
MushroomsBunapii 12.2 12.3 3.2 3.0 30.8 36.2 1Bunashimeji 9.4 8.0 1.1 2.3 20.8 24.6 1Enokidake 29.7 19.6 0.0 0.0 49.4 58.8 1Eringi 5.0 5.3 0.7 2.4 13.4 15.7 1Hatakeshimeji 9.1 5.7 0.7 0.5 16.0 19.1 1Hiratake 74.3 68.0 0.0 0.0 142.3 168.1 3Jew’s-ear (dried) 54.8 93.0 7.9 0.0 155.7 181.4 3*Maitake 47.4 38.9 7.9 4.4 98.5 116.7 2Nameko 14.9 13.6 ND 0.0 28.5 33.6 1Nameko (big type) 3.8 2.9 1.4 1.3 9.5 11.2 1Shiitake (dried) 202.7 167.7 0.0 9.1 379.5 448.8 5*Shiitake (for Broth, dried) 132.5 97.8 11.5 0.5 242.3 288.4 4*Shiitake (raw) 8.3 10.0 1.6 0.9 20.8 24.4 1Shiitake No. 115 (raw) 5.5 7.6 0.5 2.1 15.6 18.2 1Shiitake No. 240 (raw) 10.6 11.0 4.5 0.0 26.1 31.0 1Shiitake No. 697 (raw) 9.9 12.5 6.1 1.0 29.5 34.9 1Tsukuritake 28.4 21.2 0.0 0.0 49.5 58.8 1Usu-hiratake 16.8 15.7 1.9 3.5 37.9 44.6 1White aragekikurage 2.3 4.1 0.4 0.1 6.9 8.0 1White hiratake 27.0 32.8 2.6 4.3 66.7 78.1 2Yamabushitake 12.1 20.7 0.7 0.0 33.5 38.9 1Yanagimatsutake 6.1 11.9 4.9 3.3 26.2 30.5 1
FruitsBanana 1.2 1.7 0.1 0.0 3.0 3.5 1Strawberry 0.5 1.2 0.5 0.0 2.1 2.4 1
#: Classification according to purine content; 1: the very low group: less than 50 mg/100 g (less than 350 µmol/100 g), 2: the low group: 50–100 mg/100 g (350–700 µmol/100 g), 3: the moderate group: 100–200 mg/100 g (700–1400 µmol/100 g), 4: the high group: 200–300 mg/100 g (1400–2050 µmol/100 g), 5: the very high group: more than 300 mg/100 g (more than 2050 µmol/100 g). The dried food that cannot be eaten without cooking is demonstrated with asterisk. ND: not detected.

714 Vol. 37, No. 5
ratio of hypoxanthine (from 51.4% for sailfin sandfish to 87.3% for Spanish mackerel). Eleven fresh fish (11/32 items) contained guanine as more than 20% of their total purines (47.6% for sardine, 31.8% for Pacific saury, 28.7% for rainbow trout, 27.1% for jack mackerel, 23.5% for wakasagi smelt).
Guanine is reported to be present in fish skin as anhydrous crystals producing a metallic color and sometimes irides-cence.32,33) A shining mechanism of guanine crystals has also been reported.34,35) This explains why the skin of gnome-fishes and other such fish with a metallic color have a large amount of guanine (296.7 mg/100 g for the gnomefish skin, 105.8 mg/100 g for sardine).
3.7. Amount of Purines in Fish Roe, Fish Milt, Shell-fish, Mollusks, and Dried Fish Purines in other forms of seafood are shown in Tables 6 and 7. The amount of purines in many shellfish, mollusks, and dried fish was high, with values exceeding 150 mg/100 g. Pigfish milt, several shellfish, and half-dried fish contained 208.8–305.7 mg/100 g, placing
them within the high or very high groups. By contrast, sev-eral types of fish roe and processed fish contained only small amounts of purines.
Fish milt contained 90.8% of purine as adenine and gua-nine. Almost all of the fish roe, more than half of the shellfish and mollusks, and the processed fish also contained adenine and guanine as >60% of total purines.
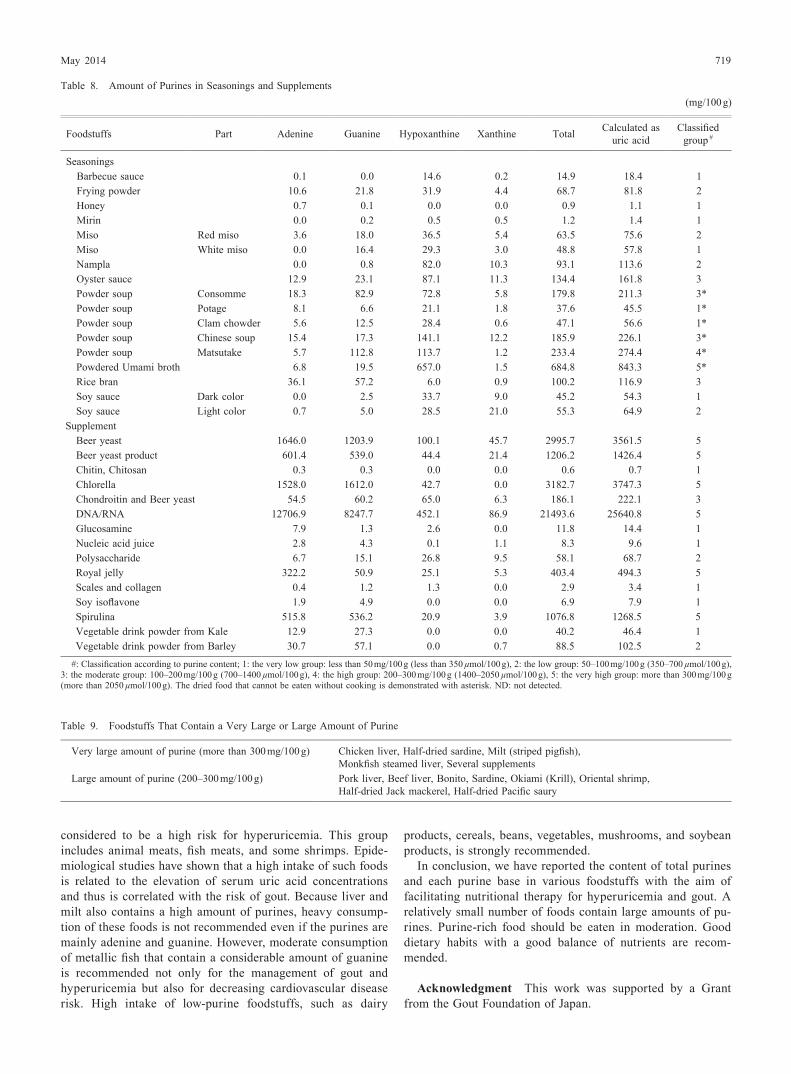
3.8. Amount of Purines in Seasonings and Supplements Within the examined seasonings and supplements, several items contained high amounts of purines (Table 8). Powdered umami broth includes inosine 5′-monophosphate (IMP), so its purine content was very high at 684.8 mg/100 g of purines. However, only small quantities are used during cooking so its classification is marked with an asterisk in Table 8. Most seasonings (12/17) also contained a high ratio of hypoxan-thine (from 51.2% for matsutake soup to 96.2% for powdered umami broth).
Several supplements, especially DNA/RNA, beer yeast, and
Table 3. Amount of Purines in Vegetables (mg/100 g)
Foodstuffs Part Adenine Guanine Hypoxanthine Xanthine Total Calculated as uric acid
Classified group #
Asparagus Upper part 20.7 30.5 3.8 0.3 55.3 64.7 2Asparagus Lower part 3.6 4.8 1.7 0.1 10.2 12.0 1Avocado 10.6 7.5 0.3 0.0 18.4 21.8 1Balsam pear (goya) 3.5 4.3 1.1 1.0 9.9 11.6 1Bamboo shoot Upper part 24.8 35.2 2.8 0.6 63.3 74.0 2Bamboo shoot Lower part 12.8 17.0 0.7 0.4 30.8 36.1 1Bean sprouts 14.1 14.2 3.2 3.5 35.0 41.2 1Broccoli 25.1 33.9 5.7 5.3 70.0 81.8 2Broccoli sprout 59.5 57.2 8.1 4.8 129.6 153.0 3Cabbage 1.3 1.7 0.2 0.0 3.2 3.8 1Carrot 0.7 1.4 0.0 0.0 2.2 2.5 1Cauliflower 27.0 30.2 ND 0.0 57.2 67.2 2Cherry tomato 1.6 1.5 0.0 0.0 3.1 3.7 1Chinese cabbage 2.6 2.9 1.2 0.3 7.0 8.2 1Corn 4.7 6.9 0.1 0.1 11.7 13.7 1Cucumber 4.2 5.0 0.1 0.1 9.4 11.1 1Eggplant 11.0 31.6 6.6 1.6 50.7 58.7 2Garlic 6.0 6.9 3.4 0.7 17.0 20.1 1Garlic chives (nira) 9.4 8.5 1.4 0.1 19.4 23.0 1Ginger 0.4 1.4 0.0 0.5 2.3 2.5 1Green pepper 15.9 35.5 7.0 10.7 69.2 79.8 2Gumbo (okura) 17.2 21.3 0.3 0.7 39.5 46.3 1Japanese ginger (myoga) 3.1 3.5 0.7 0.4 7.8 9.2 1Japanese leek (negi) 12.0 26.8 2.6 0.0 41.4 48.0 1Japanese pumpkin 23.2 29.1 1.9 2.5 56.6 66.3 2Komatsuna Leaf 4.2 6.3 0.0 0.0 10.6 12.3 1Komatsuna Young leaf 13.0 24.7 0.0 1.4 39.0 45.1 1Onion 1.0 1.1 0.1 0.0 2.3 2.7 1Parsley 121.5 135.1 32.3 0.0 288.9 341.3 4Perilla leaves (shiso) 19.1 19.1 3.1 0.2 41.4 49.0 1Potato 2.1 4.2 0.2 0.0 6.5 7.5 1Spinach Leaf 29.8 13.8 0.0 7.7 51.4 61.0 2Spinach Young leaf 83.5 88.3 0.0 0.0 171.8 202.1 3Sprouts (with bean) 28.1 28.2 0.0 1.1 57.3 67.4 2Sweet potato 6.7 7.3 2.4 0.6 17.0 20.1 1White radish sprouts 33.9 29.4 6.4 3.5 73.2 86.6 2Zucchini 5.0 6.3 1.0 0.8 13.1 15.3 1

May 2014 715
Table 4. Amount of Purines in Animal Meat and Processed Meat (mg/100 g)
Foodstuffs Part Adenine Guanine Hypoxanthine Xanthine Total Calculated as uric acid
Classified group #
MeatBeef Brisket 13.5 7.6 49.0 9.1 79.2 95.8 2
Clod 18.9 9.1 65.3 10.6 104.0 126.1 3Heart 45.9 27.2 96.6 15.2 185.0 223.6 3Kidney 67.6 63.5 8.2 35.0 174.2 203.4 3Large intestine 27.1 38.6 15.2 7.3 88.0 103.3 2Liver 86.5 83.1 ND 50.2 219.8 255.5 4Neck 18.9 13.6 54.4 13.7 100.6 121.0 3Ribloin 13.5 7.6 39.5 13.7 74.2 89.1 2Shin 17.6 13.6 58.5 16.7 106.4 127.8 3Shoulder ribs 14.9 9.1 36.7 16.7 77.4 92.5 2Shoulder sirloin 16.2 9.1 55.8 9.1 90.2 109.3 2Stomach 28.4 21.2 17.7 16.7 83.9 99.2 2Tenderloin 16.2 9.1 64.0 9.1 98.4 119.4 2Tongue 24.3 12.1 44.9 9.1 90.4 109.3 2Topside 18.9 10.6 72.1 9.1 110.8 134.5 3Topside (raw) 20.3 15.1 77.3 22.5 135.2 162.4 3Topside (heated) 27.1 15.8 87.2 13.3 143.5 173.8 3
Chicken Breast 20.5 21.4 98.4 1.0 141.2 171.8 3Buttocks 17.0 21.9 23.2 6.7 68.8 81.6 2Gizzard 45.9 51.4 39.5 6.1 142.9 169.8 3Heart 31.3 36.1 52.6 5.4 125.4 150.0 3Leg 27.0 19.6 76.2 0.0 122.9 149.6 3Liver 121.6 151.1 ND 39.5 312.2 363.1 5Skin 48.6 43.8 27.2 ND 119.7 142.9 3White meat 27.0 16.6 110.2 0.0 153.9 188.3 3Wing 28.4 16.6 92.5 0.0 137.5 168.1 3
Horse 10.0 10.0 77.8 15.2 113.1 136.5 3Mutton Mutton 17.6 10.6 68.1 ND 96.2 117.7 2
Rum 17.6 10.6 65.3 ND 93.5 114.3 2Pork Heart 39.2 24.2 55.8 0.0 119.2 144.6 3
Kidney 64.8 77.1 53.1 0.0 195.0 232.0 3Liver 81.1 102.7 34.0 66.9 284.8 331.2 4Neck 14.9 12.1 43.6 0.0 70.5 85.7 2Ribs 13.5 10.6 51.7 0.0 75.8 92.5 2Rump 20.3 15.1 77.6 0.0 113.0 137.8 3Shoulder 16.2 12.1 53.1 0.0 81.4 99.2 2Shoulder ribs 16.2 10.6 64.0 0.0 90.8 110.9 2Shoulder sirloin 18.9 13.6 62.6 0.0 95.1 116.0 2Shoulder knee 21.6 16.6 69.4 0.0 107.6 131.1 3Sirloin 17.6 12.1 61.2 0.0 90.9 110.9 2Tenderloin 23.0 15.1 81.7 0.0 119.7 146.2 3Tongue 24.3 21.2 58.5 0.0 104.0 126.1 3
Whale Meat 18.9 12.1 80.3 ND 111.3 136.2 3Tail meat 13.5 6.0 68.1 ND 87.6 107.6 2
Processed meatBacon 12.2 6.0 43.6 ND 61.8 75.6 2Boneless ham 10.8 7.6 55.8 0.0 74.2 90.8 2Corned beef 8.1 6.0 31.3 1.5 47.0 57.2 1Frankfurt sausage 8.1 7.6 32.7 1.5 49.8 60.5 1Liver paste 25.7 30.2 15.0 9.1 80.0 94.1 2Pressed ham 8.1 4.5 51.7 0.0 64.4 79.0 2Prosciutto (Parma ham) 23.4 22.8 92.1 0.0 138.3 168.2 3Salami 16.2 13.6 83.0 7.6 120.4 146.2 3Vienna sausage 6.8 6.0 32.7 ND 45.5 55.5 1
#: Classification according to purine content; 1: the very low group: less than 50 mg/100 g (less than 350 µmol/100 g), 2: the low group: 50–100 mg/100 g (350–700 µmol/100 g), 3: the moderate group: 100–200 mg/100 g (700–1400 µmol/100 g), 4: the high group: 200–300 mg/100 g (1400–2050 µmol/100 g), 5: the very high group: more than 300 mg/100 g (more than 2050 µmol/100 g). ND: not detected.

716 Vol. 37, No. 5
chlorella, contained very large amounts of purine at 21493.6, 2995.7, and 3182.7 mg/100 g, respectively. Patients with gout or hyperuricemia should therefore avoid taking these supple-ments. More than half of the supplements contained adenine and guanine as >60% of total purines
3.9. The Ratio of the Four Purine Bases in Various Foodstuffs When the ratio of the four purine bases was compared, two types of foodstuffs were shown to contain mainly adenine and guanine or mainly hypoxanthine.
All cereals, beans, soybean products, seaweeds, dairy prod-ucts, mushrooms, and vegetables contained >60% of their total purines as adenine and guanine (Tables 1–3). Liver, fish milt, most fish roe, and more than half of the shellfish and mollusks also contained mainly adenine and guanine (Table 4–7). In these foods, the ratio of adenine and that of guanine to the total amount of purine was almost the same.
On the other hand, most of animal and fish meats contained hypoxanthine as >50% of total purines (Tables 4, 5). Metal-lic colored fish contained considerable amounts of guanine
(Table 5).
4. IN NUTRITIONAL THERAPY FOR GOUT AND HYPERURICEMIA
In Japan, lifestyle interventions for patients with hyperuri-cemia/gout are shown in the Guidelines for the Management of Hyperuricemia and Gout.13) The major points of lifestyle interventions are nutritional therapy, restriction of alcohol consumption and recommendations for physical training. Nutritional therapy suggests an appropriate intake of energy and water and a reduced intake of dietary purines (less than 400 mg/d) and fructose. Education and proper guidance are also thought to play a crucial role in improving the clinical course of the disease with or without drug therapy in the United States.4,5,36,37)
In the Japanese guidelines, food is categorized according to the purine amount (very large, large, small, very small). Pa-tient with gout or hyperuricemia are advised to avoid overeat-
Table 5. Amount of Purines in Fresh Fish (mg/100 g)
Foodstuffs Part Adenine Guanine Hypoxanthine Xanthine Total Calculated as uric acid
Classified group #
Arabesque greenling 18.9 34.0 94.7 2.4 150.0 181.0 3Ayu 17.6 25.7 89.8 0.0 133.1 161.4 3Barracuda 13.5 24.2 110.2 ND 147.9 179.9 3Bastard halibut 17.6 15.1 100.7 0.0 133.4 163.1 3Bonito 21.6 19.6 170.1 0.0 211.4 258.9 4Carp 16.2 12.1 74.9 ND 103.2 126.1 3Chub mackerel 13.5 10.6 98.0 0.0 122.1 149.6 3Fat greenling 20.3 13.6 95.3 ND 129.1 158.0 3Flying fish 13.5 22.7 118.4 0.0 154.6 188.3 3Gnomefish Meat 14.6 15.3 120.1 0.8 150.8 184.4 3Gnomefish Skin 9.6 296.7 73.5 2.5 382.3 435.5 5Herring 13.5 22.7 103.4 ND 139.6 169.8 3Jack mackerel 17.6 48.4 99.4 0.0 165.3 198.4 3Japanese amberjack 18.9 12.1 89.8 0.0 120.8 147.9 3Japanese eel 13.5 24.2 54.4 ND 92.1 110.9 2Japanese seabass 13.5 12.1 93.9 0.0 119.5 146.2 3Mebaru 13.5 18.1 92.5 0.0 124.2 151.3 3Monkfish Meat 17.5 19.5 32.6 0.5 70.0 84.2 2Monkfish Liver (raw) 38.2 55.6 6.0 4.4 104.3 121.8 3Monkfish Liver (steamed) 158.2 211.4 26.6 3.1 399.2 468.2 5Pacific saury 14.9 52.9 87.1 0.0 154.9 184.9 3Rainbow trout 25.7 55.9 99.4 ND 180.9 216.8 3Red seabream 13.5 10.6 104.8 0.0 128.9 158.0 3Sablefish Meat 27.4 11.9 83.9 0.2 123.3 151.1 3Sablefish Skin 12.1 14.0 39.2 1.6 66.9 80.8 2Sailfin sandfish 16.2 30.2 49.0 3.0 98.5 117.7 2Salmon 17.6 10.6 91.2 0.0 119.3 146.2 3Sardine 17.6 105.8 87.1 ND 210.4 247.1 4Sillaginidae 13.5 10.6 119.8 ND 143.9 176.5 3Spanish mackerel 12.2 6.0 121.1 ND 139.3 171.5 3Striped pigfish 13.5 10.6 125.2 ND 149.3 183.2 3Tilefish 9.5 10.6 99.4 0.0 119.4 146.2 3Tuna 17.6 10.6 129.3 0.0 157.4 193.3 3Wakasagi smelt 13.5 24.2 57.2 0.0 94.8 114.3 2Weather loach 28.4 49.9 51.7 6.1 136.0 161.4 3Yellow striped flounder 14.9 28.7 69.4 0.0 113.0 136.2 3

May 2014 717
ing the foods that contain a very large or large amount of pu-rine (Table 9). These foods contain >200 mg/100 g of purines.
In several epidemiological studies, the consumption of meat and fish was strongly correlated with elevated uric acid serum concentrations and the risk of gout.6,8–12) In the present review, many meats and fishes contained >100 mg/100 g of purine. We found that most meat and fish contained hypoxanthine at a high ratio relative to the total amount of purines (>50%). From our recent study that examined the composition of pu-rines in some foodstuffs such as beef, beef contained a high amount of IMP, inosine, and hypoxanthine.38) Because IMP and inosine are hydrolyzed to hypoxanthine in our purine ana-lytical method, the amount of hypoxanthine reflects the sum of these purine compounds.
The effect of purines on the serum concentration of uric acid has been shown to differ between purines. Hypoxanthine, IMP, adenine, adenosine 5′-monophosphate, and guanosine
5′-monophosphate were found to increase the serum concen-tration of uric acid in normal and hyperuricemic subjects and those with gout.39) The effect of hypoxanthine seemed stron-ger than other purines.40) Considering the different effect on serum uric acid level, such foods that contain not only a large amount of total purines but also a high ratio of hypoxanthine can therefore be considered as the greatest dietary risk factor for developing gout. Heavy intake of these foodstuffs should be avoided.
Interestingly, guanine has not been reported to change serum level or urinary excretion of uric acid.39,40) Some of the examined fish, especially fish with a metallic coloration, contained a considerable amount of guanine. Metallic fish also contained an abundance of unsaturated fatty acid. Epidemio-logical studies have reported that consumption of these oily fish decreases the risk of cardiovascular disease (CVD).41) Oily fish are allowed for decreasing the risk of CVD in gouty pa-
Table 6. Amount of Purines in Fish Roe, Fish Milt, Shellfish, and Mollusks (mg/100 g)
Foodstuffs Part Adenine Guanine Hypoxanthine Xanthine Total Calculated as uric acid
Classified group #
Fish roe, Fish miltCaviar 7.5 46.1 39.4 1.7 94.7 111.1 2Flying fish roe
(in soy sauce, Tobiko)21.3 47.7 20.4 2.2 91.5 107.1 2
Flying fish roe (Tobiko)
9.9 14.5 41.4 2.1 67.8 81.8 2
Herring roe (Kazunoko)
6.8 15.1 0.0 0.0 21.9 25.2 1
Salmon roe (Ikura) 0.0 0.0 2.5 1.1 3.7 4.4 1Pollock roe
(marinated, Mentaiko)32.9 81.0 36.9 8.6 159.3 186.0 3
Pollock roe (Tarako) 35.1 66.5 19.1 ND 120.7 141.2 3Salmon roe (Sujiko) 4.1 7.6 4.1 ND 15.7 18.5 1Milt (Striped pigfish) 67.0 211.5 19.4 7.7 305.5 351.1 5
Shellfish, MolluskBotan shrimp 8.3 16.4 28.7 0.0 53.4 64.0 2Botan shrimp (roe) 75.0 53.0 34.5 0.0 162.5 194.9 3Clam 63.5 39.3 12.2 30.4 145.5 171.5 3Common orient clam 45.9 24.2 5.4 28.9 104.5 122.7 3Crab Ovary 42.5 105.8 3.9 0.0 152.2 175.4 3Firefly squid 51.4 57.6 15.6 3.4 128.1 151.2 3Japanese flying squid 47.3 21.2 80.3 38.0 186.8 223.6 3Japanese scallop 63.6 6.6 5.3 1.0 76.5 94.2 2Kuruma shrimp 58.1 15.1 87.1 35.0 195.3 235.3 3Octopus 21.6 18.1 36.7 60.8 137.3 159.7 3Octopus Organs 29.1 42.0 4.8 4.0 79.8 93.1 2Okiami (Krill) 108.1 74.0 17.7 25.9 225.7 267.3 4Oriental shrimp 40.5 12.1 103.4 117.1 273.2 321.1 4Oyster 55.4 34.8 12.2 82.1 184.5 213.5 3Red king crab 56.7 19.6 9.5 13.7 99.6 119.4 2Sakura shrimp (dried) 83.9 124.0 512.2 29.0 749.1 907.0 5*Sea cucumber 3.2 2.1 0.2 0.0 5.5 6.6 1Sea Urchin 40.0 65.7 22.5 9.1 137.3 160.7 3Shiba shrimp 43.2 16.6 84.4 ND 144.2 176.5 3Shredded squid (dried) 24.9 20.6 47.9 1.0 94.4 114.2 2*Snow crab 75.7 13.6 0.0 47.2 136.4 161.4 3Spear squid 58.1 15.1 34.0 53.2 160.5 190.0 3Spiny lobster 31.1 9.8 61.2 0.1 102.1 125.2 3Squid Organs 0.0 17.1 22.1 20.4 59.6 68.8 2

718 Vol. 37, No. 5
tients with cardiovascular comorbidities.5) Therefore, moderate intake of metallic oily fish can be recommended in nutritional therapy for gout and hyperuricemia, because such a diet does not seem to substantially elevate serum uric acid level and can be expected to decrease the risk of CVD.
On the other hand, vegetables, mushrooms, and cereals contain small amounts of purines, which are mainly adenine and guanine. In these foods, the ratio of adenine and that of guanine to total purine are almost the same, so purine is considered to be mainly present as nucleic acid (e.g. DNA or RNA). Several vegetables contain >50 mg/100 g purine bodies, and are known as purine-rich vegetables. However, they are not reported to increase the risk of gout.10) This is likely to be because their purine content is three to four times less than that of meat. In addition, they contain mainly adenine and guanine in nucleic acids, and guanine does not tend to elevate serum concentrations of uric acid.
Thus, foods containing small amounts of total purine and those containing mainly adenine and guanine are considered to be beneficial for hyperuricemic patients and those with gout. These include eggs, dairy food, cereals, beans, vegeta-bles, mushrooms, and soybean products. Eggs and dairy prod-ucts contain almost zero purine. In particular, dairy products are recommended dietary foods for patients with gout. Milk proteins such as casein also reduce uric acid serum concen-trations by increasing the excretion of uric acid.2,42) A popu-
lation-based case-control study showed that calcium was in-versely associated with plasma urate concentration.9) The risk of gout has been shown to be low in individuals who consume plenty of dairy products.10) Indeed, U.S. and British guidelines for gout recommend the consumption of these foods.14–16)
Most seasonings, such as Japanese miso, soy sauce, and umami broth, contain hypoxanthine at a ratio of more than half the total amount of purines (Table 8). This is because they include an umami component derived from IMP. Howev-er, as only a small amount of seasoning is used during cook-ing, their overeating will not occur in a normal diet.
Although we report total purine and purine bases of 270 foodstuffs in the present review, there are many other food-stuffs remaining that have not been categorized in terms of their purine content. We will continue to determine the purine content of various foods.
5. CONCLUSION
Two important points should be taken into consideration regarding nutritional therapy for gout or hyperuricemia with particular respect for the restriction of dietary purines. The first is the amount of total purines in the food and the second is what types of purine bases are included.
The consumption of foods that contain >200 mg/100 g of purines, especially with a high ratio of hypoxanthine, is
Table 7. Amount of Purines in Dried Fish, Canned Fish, Processed Fish, and Snacks (mg/100 g)
Foodstuffs Part Adenine Guanine Hypoxanthine Xanthine Total Calculated as uric acid
Classified group #
Half-dried fishJack mackerel 14.9 119.4 111.6 ND 245.8 289.1 4Pacific saury 12.2 102.7 93.9 ND 208.8 245.4 4Sardine 20.3 157.1 125.2 3.0 305.7 358.1 5Shishamo with roe 12.1 60.4 74.5 2.6 149.6 177.1 3
Dried fishAnchovy (dried) 258.3 464.6 381.8 4.0 1108.6 1314.2 5*Katsuobushi (dried bonito) 51.3 78.6 363.4 0.0 493.3 600.1 5*Niboshi (dried baby sardines) 133.7 355.1 257.2 0.0 746.1 879.2 5*Whitebait (dried) 159.0 235.4 69.6 7.5 471.5 554.0 5*
Canned fishSalmon 24.3 37.8 70.8 0.0 132.9 159.7 3Tuna 14.9 13.6 88.5 0.0 116.9 142.9 3
Processed fishFish ball 12.2 24.2 31.3 0.0 67.6 80.7 2Fish sausage 6.8 9.1 6.8 0.0 22.6 26.9 1Fishcake tube (Chikuwa) 14.9 15.1 17.7 0.0 47.7 57.2 1Fish product (Hanpen) 1.6 3.3 7.4 0.2 12.5 15.0 1Fish product (Kamaboko) 9.5 6.0 10.9 0.0 26.4 31.9 1Fish product (Narutomaki) 8.1 12.1 12.2 0.0 32.4 38.7 1Fish product (Sasakamaboko) 14.9 16.6 16.3 0.0 47.8 57.2 1Fish product (Satsuma age) 6.8 10.6 4.1 0.0 21.4 25.2 1
SnacksDeep-fried rice cracker 0.0 4.3 4.2 5.7 14.1 16.2 1Ramen (Japanese noodle) Soup 4.7 9.9 16.5 1.5 32.7 39.0 1Ramen (Japanese noodle) Noodle 7.5 6.8 0.0 7.3 21.6 25.0 1
#: Classification according to purine content; 1: the very low group: less than 50 mg/100 g (less than 350 µmol/100 g), 2: the low group: 50–100 mg/100 g (350–700 µmol/100 g), 3: the moderate group: 100–200 mg/100 g (700–1400 µmol/100 g), 4: the high group: 200–300 mg/100 g (1400–2050 µmol/100 g), 5: the very high group: more than 300 mg/100 g (more than 2050 µmol/100 g). The dried food that cannot be eaten without cooking is demonstrated with asterisk. ND: not detected.
May 2014 719
considered to be a high risk for hyperuricemia. This group includes animal meats, fish meats, and some shrimps. Epide-miological studies have shown that a high intake of such foods is related to the elevation of serum uric acid concentrations and thus is correlated with the risk of gout. Because liver and milt also contains a high amount of purines, heavy consump-tion of these foods is not recommended even if the purines are mainly adenine and guanine. However, moderate consumption of metallic fish that contain a considerable amount of guanine is recommended not only for the management of gout and hyperuricemia but also for decreasing cardiovascular disease risk. High intake of low-purine foodstuffs, such as dairy
products, cereals, beans, vegetables, mushrooms, and soybean products, is strongly recommended.
In conclusion, we have reported the content of total purines and each purine base in various foodstuffs with the aim of facilitating nutritional therapy for hyperuricemia and gout. A relatively small number of foods contain large amounts of pu-rines. Purine-rich food should be eaten in moderation. Good dietary habits with a good balance of nutrients are recom-mended.
Acknowledgment This work was supported by a Grant from the Gout Foundation of Japan.
Table 8. Amount of Purines in Seasonings and Supplements(mg/100 g)
Foodstuffs Part Adenine Guanine Hypoxanthine Xanthine Total Calculated as uric acid
Classified group #
SeasoningsBarbecue sauce 0.1 0.0 14.6 0.2 14.9 18.4 1Frying powder 10.6 21.8 31.9 4.4 68.7 81.8 2Honey 0.7 0.1 0.0 0.0 0.9 1.1 1Mirin 0.0 0.2 0.5 0.5 1.2 1.4 1Miso Red miso 3.6 18.0 36.5 5.4 63.5 75.6 2Miso White miso 0.0 16.4 29.3 3.0 48.8 57.8 1Nampla 0.0 0.8 82.0 10.3 93.1 113.6 2Oyster sauce 12.9 23.1 87.1 11.3 134.4 161.8 3Powder soup Consomme 18.3 82.9 72.8 5.8 179.8 211.3 3*Powder soup Potage 8.1 6.6 21.1 1.8 37.6 45.5 1*Powder soup Clam chowder 5.6 12.5 28.4 0.6 47.1 56.6 1*Powder soup Chinese soup 15.4 17.3 141.1 12.2 185.9 226.1 3*Powder soup Matsutake 5.7 112.8 113.7 1.2 233.4 274.4 4*Powdered Umami broth 6.8 19.5 657.0 1.5 684.8 843.3 5*Rice bran 36.1 57.2 6.0 0.9 100.2 116.9 3Soy sauce Dark color 0.0 2.5 33.7 9.0 45.2 54.3 1Soy sauce Light color 0.7 5.0 28.5 21.0 55.3 64.9 2
SupplementBeer yeast 1646.0 1203.9 100.1 45.7 2995.7 3561.5 5Beer yeast product 601.4 539.0 44.4 21.4 1206.2 1426.4 5Chitin, Chitosan 0.3 0.3 0.0 0.0 0.6 0.7 1Chlorella 1528.0 1612.0 42.7 0.0 3182.7 3747.3 5Chondroitin and Beer yeast 54.5 60.2 65.0 6.3 186.1 222.1 3DNA/RNA 12706.9 8247.7 452.1 86.9 21493.6 25640.8 5Glucosamine 7.9 1.3 2.6 0.0 11.8 14.4 1Nucleic acid juice 2.8 4.3 0.1 1.1 8.3 9.6 1Polysaccharide 6.7 15.1 26.8 9.5 58.1 68.7 2Royal jelly 322.2 50.9 25.1 5.3 403.4 494.3 5Scales and collagen 0.4 1.2 1.3 0.0 2.9 3.4 1Soy isoflavone 1.9 4.9 0.0 0.0 6.9 7.9 1Spirulina 515.8 536.2 20.9 3.9 1076.8 1268.5 5Vegetable drink powder from Kale 12.9 27.3 0.0 0.0 40.2 46.4 1Vegetable drink powder from Barley 30.7 57.1 0.0 0.7 88.5 102.5 2
#: Classification according to purine content; 1: the very low group: less than 50 mg/100 g (less than 350 µmol/100 g), 2: the low group: 50–100 mg/100 g (350–700 µmol/100 g), 3: the moderate group: 100–200 mg/100 g (700–1400 µmol/100 g), 4: the high group: 200–300 mg/100 g (1400–2050 µmol/100 g), 5: the very high group: more than 300 mg/100 g (more than 2050 µmol/100 g). The dried food that cannot be eaten without cooking is demonstrated with asterisk. ND: not detected.
Table 9. Foodstuffs That Contain a Very Large or Large Amount of Purine
Very large amount of purine (more than 300 mg/100 g) Chicken liver, Half-dried sardine, Milt (striped pigfish), Monkfish steamed liver, Several supplements
Large amount of purine (200–300 mg/100 g) Pork liver, Beef liver, Bonito, Sardine, Okiami (Krill), Oriental shrimp, Half-dried Jack mackerel, Half-dried Pacific saury

720 Vol. 37, No. 5
REFERENCES
1) Benedict JD, Forsham PH, Stetten D Jr. The metabolism of uric acid in the normal and gouty human studied with the aid of isotopic uric acid. J. Biol. Chem., 181, 183–193 (1949).
2) Garrel DR, Verdy M, PetitClerc C, Martin C, Brulé D, Hamet P, PetitClerc C, Martin C, Bruke D, Hamet P. Milk- and soy-protein ingestion: acute effect on serum uric acid concentration. Am. J. Clin. Nutr., 53, 665–669 (1991).
3) Yu TS, Berger L, Gutman AB. Renal function in gout. II. Effect of uric acid loading on renal excretion of uric acid. Am. J. Med., 33, 829–844 (1962).
4) Becker MA, Chohan S. We can make gout management more suc-cessful now. Curr. Opin. Rheumatol., 20, 167–172 (2008).
5) Choi HK. A prescription for lifestyle change in patients with hyper-uricemia and gout. Curr. Opin. Rheumatol., 22, 165–172 (2010).
6) Singh JA, Reddy SG, Kundukulam J. Risk factors for gout and prevention: a systematic review of the literature. Curr. Opin. Rheu-matol., 23, 192–202 (2011).
7) Gibson T, Rodgers AV, Simmonds HA, Court-Brown F, Todd E, Meilton V. A controlled study of diet in patients with gout. Ann. Rheum. Dis., 42, 123–127 (1983).
8) Choi HK, Liu S, Curhan G. Intake of purine-rich foods, protein, and dairy products and relationship to serum levels of uric acid: The Third National Health and Nutrition Examination Survey. Ar-thritis Rheum., 52, 283–289 (2005).
9) Zgaga L, Theodoratou E, Kyle J, Farrington SM, Agakov F, Tenesa A, Walker M, McNeill G, Wright AF, Rudan I, Dunlop MG, Camp-bell H. The association of dietary intake of purine-rich vegetables, sugar-sweetened beverages and dairy with plasma urate, in a cross-sectional study. PLoS ONE, 7, e38123 (2012).
10) Choi HK, Atkinson K, Karlson EW, Willett W, Curhan G. Purine-rich foods, dairy and protein intake, and the risk of gout in men. N. Engl. J. Med., 350, 1093–1103 (2004).
11) Villegas R, Xiang YB, Elasy T, Xu WH, Cai H, Cai Q, Linton MF, Fazio S, Zheng W, Shu XO. Purine-rich foods, protein intake, and the prevalence of hyperuricemia: The Shanghai men’s health study. Nutr. Metab. Cardiovasc. Dis., 22, 409–416 (2012).
12) Zhang Y, Chen C, Choi H, Chaisson C, Hunter D, Niu J, Neogi T. Purine-rich foods intake and recurrent gout attacks. Ann. Rheum. Dis., 71, 1448–1453 (2012).
13) Yamanaka H. Japanese Society of Gout and Nucleic Acid Metabo-lism. Japanese guideline for the management of hyperurticemia and gout: second edition. Nucleosides Nucleotides Nucleic Acids, 30, 1018–1029 (2011).
14) Khanna D, Khanna PP, Fitzgerald JD, Singh MK, Bae S, Neogi T, Pillinger MH, Merill J, Lee S, Prakash S, Kaldas M, Gogia M, Perez-Ruiz F, Taylor W, Lioté F, Choi H, Singh JA, Dalbeth N, Ka-plan S, Niyyar V, Jones D, Yarows SA, Roessler B, Kerr G, King C, Levy G, Furst DE, Edwards NL, Mandell B, Schumacher HR, Robbins M, Wenger N, Terkeltaub R. 2012 American College of Rheumatology Guidelines for Management of Gout. Part 2: therapy and antiinflammatory prophylaxis of acute gouty arthritis. Arthritis Care Res. (Hoboken), 64, 1447–1461 (2012).
15) Khanna D, Fitzgerald JD, Khanna PP, Bae S, Singh MK, Neogi T, Pillinger MH, Merill J, Lee S, Prakash S, Kaldas M, Gogia M, Perez-Ruiz F, Taylor W, Lioté F, Choi H, Singh JA, Dalbeth N, Ka-plan S, Niyyar V, Jones D, Yarows SA, Roessler B, Kerr G, King C, Levy G, Furst DE, Edwards NL, Mandell B, Schumacher HR, Robbins M, Wenger N, Terkeltaub R. 2012 American College of Rheumatology Guidelines for Management of Gout. Part 1: system-atic nonpharmacologic and pharmacologic therapeutic approaches to hyperuricemia. Arthritis Care Res. (Hoboken), 64, 1431–1446 (2012).
16) Jordan KM, Cameron JS, Snaith M, Zhang W, Doherty M, Seckl J, Hingorani A, Jaques R, Nuki A. British Society for Rheumatology
and British Health Professionals in Rheumatology guideline for the management of gout. Rheumatology, 46, 1372–1374 (2007).
17) Waslien CI, Calloway DH, Margen S. Uric acid production of men fed graded amounts of egg protein and yeast nucleic acid. Am. J. Clin. Nutr., 21, 892–897 (1968).
18) Griebsch A, Zollner N. Effect of ribomononucleotides given orally on uric acid production in man. Adv. Exp. Med. Biol., 41, 443–449 (1974).
19) Yamakita J, Yamamoto T, Moriwaki Y, Takahashi S, Tsutsumi Z, Higashino K. Effect of tofu (bean curd) ingestion and on uric acid metabolism in healthy and gouty subjects. Adv. Exp. Med. Biol., 431, 839–842 (1998).
20) Cao G, Russell RM, Lischner N, Prior RL. Serum antioxidant capacity is increased by consumption of strawberries, spinach, red wine or vitamin C in elderly women. J. Nutr., 128, 2383–2390 (1998).
21) Brulé D, Sarwar G, Savoiet L. Purine content of selected Canadian food products. J. Food Compost. Anal., 1, 130–138 (1988).
22) Kaneko K, Kudo Y, Yamanobe T, Mawatari K, Yasuda M, Nak-agomi K, Fujimori S. Purine content of soybean-derived foods and selected Japanese vegetables and mushrooms. Nucleosides Nucleo-tides Nucleic Acids, 27, 628–630 (2008).
23) Ogata E, Fujimori S, Kaneko K. Contents of purine bases in foods and alcoholic beverages. Nihon Rinsho, 61 (Suppl. 1), 489–495 (2003).
24) Wolfram G, Colling M. Total purine content in selected foods. Z. Ernahrungswiss, 26, 205–213 (1987).
25) Matsumoto M, Aoyagi Y, Sugawara T. Contents of purine bases in meat and meat products. Eiyo to Shokuryo, 30, 155–162 (1977).
26) Shinoda T, Aoyagi Y, Sugawara T. Contents of purine bases in fishes and fish products. Eiyo to Shokuryo, 34, 153–162 (1981).
27) Shinoda T, Aoyagi Y, Sugahara T. Purine base contents in foods and effects of cooking methods. Eiyo to Shokuryo, 35, 103–109 (1982).
28) Kaneko K, Sagawa H, Fujiwara N, Mawatari K, Nakagomi K, Ya-manobe T, Fujimori S. Contents of purine bases in alcohol-free or low-alcohol beer and in some convenience food. Gout and Nucleic Acid Metabolism, 28, 109–114 (2004).
29) Kaneko K, Kudo Y, Nishizawa Y, Horiba S, Motegi J, Mawatari K, Nakagomi K, Yamanobe T, Fujimori S. Concentrations of purine bases in several Japanese foods and in some health care supple-ments. Gout and Nucleic Acid Metabolism, 31, 23–29 (2007).
30) Kaneko K, Yamanobe T, Fujimori S. Determination of purine con-tents of alcoholic beverages using high performance liquid chroma-tography. Biomed. Chromatogr., 23, 858–864 (2009).
31) Fukuuchi T, Yasuda M, Inazawa K, Ota T, Yamaoka N, Mawatari K, Nakagomi K, Kaneko K. A simple HPLC method for determin-ing the purine content of beer and beer-like alcoholic beverages. Anal. Sci., 29, 511–517 (2013).
32) Levy-Lior A, Pokroy B, Levavi-Sivan B, Leiserowitz L, Weiner S, Addadi L. Biogenic guanine crystals from the skin of fish may be designed to enhance light reflectance. Cryst. Growth Des., 8, 507–511 (2008).
33) Jordan TM, Partridge JC, Roberts NW. Non-polarizing broadband multilayer reflectors in fish. Nat. Photonics, 6, 759–763 (2012).
34) Gur D, Politi Y, Sivan B, Fratzl P, Weiner S, Addadi L. Guanine-based photonic crystals in fish scales form from an amorphous precursor. Angew. Chem. Int. Ed., 52, 388–391 (2013).
35) Iwasaka M, Mizukawa Y. Light reflection control in biogenetic micro-mirror by diamagnetic orientation. Langmuir, 29, 4328–4334 (2013).
36) Kedar E, Simkin PA. A perspective on diet and gout. Adv. Chronic Kidney Dis., 19, 392–397 (2012).
37) Torralba KD, De Jesus E, Rachabattula S. The interplay between diet, urate transporters and the risk for gout and hyperuricemia: current and future directions. Int. J. Rheum. Dis., 15, 499–506

May 2014 721
(2012).38) Inazawa K, Sato A, Kato Y, Yamaoka N, Fukuuchi T, Yasuda M,
Mawatari K, Nakagomi K, Kaneko K. Determination and profil-ing of purines in foods by using HPLC and LC-MS. Nucleosides Nucleotides Nucleic Acids (2014), in press.
39) Clifford AJ, Riumallo JA, Young VR, Scrimshaw NS. Effect of oral purines on serum and urinary uric acid of normal, hyperuricemic and gouty humans. J. Nutr., 106, 428–434 (1976).
40) Brulé D, Sarwar G, Savoie L. Changes in serum and urinary uric
acid levels in normal human subjects fed purine-rich foods contain-ing different amounts of adenine and hypoxanthine. J. Am. Coll. Nutr., 11, 353–358 (1992).
41) Kris-Etherton PM, Harris WS, Apple LJ. Fish consumption, fish oil, omega-3 fatty acids, and cardiovascular disease. Circulation, 106, 2747–2757 (2002).
42) Verdi RJ, Barbano DM, Dellavalle ME, Senyk GF. Variability in true protein, casein, nonprotein nitrogen, and proteolysis in high and low somatic cell milks. J. Dairy Sci., 70, 230–242 (1987).