
Luxury Budget Hotels in Sri Lanka | Transport Services in Sri Lanka

Natural Hazards 33: 303–318, 2004.© 2004 Kluwer Academic Publishers. Printed in the Netherlands.
303
May 2003 Disaster in Sri Lanka and Cyclone 01-Bin the Bay of Bengal
LAREEF ZUBAIRInternational Research Institute for Climate Prediction, The Earth Institute of Columbia University,P.O. Box 1000 (Street: 61 Route 9W), Palisades, NY 10964, U.S.A. E-mail: [email protected]
(Received: 12 September 2003; accepted: 8 December 2003)
Abstract. Heavy rainfall deluged South-Western Sri Lanka between the 11th and 19th of May2003 and led to its worst disaster in 50 years. Floods and landslides claimed 260 lives. The WorldMeteorological Organization cited it as evidence for the increase of anomalous climatic extremesin recent years. Here, a meteorological analysis is presented of this disaster as part of a sustainedeffort to undertake meteorological applications for disaster management. There were intense low-level westerlies over Sri Lanka related to cyclone 01-B that made its way across the Bay of Bengalat least 700 km away. The southeastwardly traverse of the cyclone was stalled for a few days byanomalous north-westerly geostrophic winds over South Asia. Here, it is argued that orographicrainfall induced by this stalled cyclone and seasonal inter-tropical convergence zone cloud bandsover Sri Lanka led to the deluge. The trajectory of the cyclone was remote from Sri Lanka andthis led to no cyclone hazard warnings being issued. No cyclones have made landfall in Sri Lankain May in the last 100 years. This study shows that one must exercise vigilance not only in thepath of the cyclone but also remotely due to the modulation of the cyclone by other atmosphericphenomenon and topographic features. This flood may have been predicted with contemporary localarea weather prediction models and this example points to the need for the development of local areaweather prediction models as part of disaster warning systems. This study also demonstrates the useof meteorological diagnostics for post-event analysis of hydrometeorology of disaster events.
Key words: Sri Lanka, Bay of Bengal, climatic diagnostics, cyclone, flooding, disaster warning.
1. Introduction
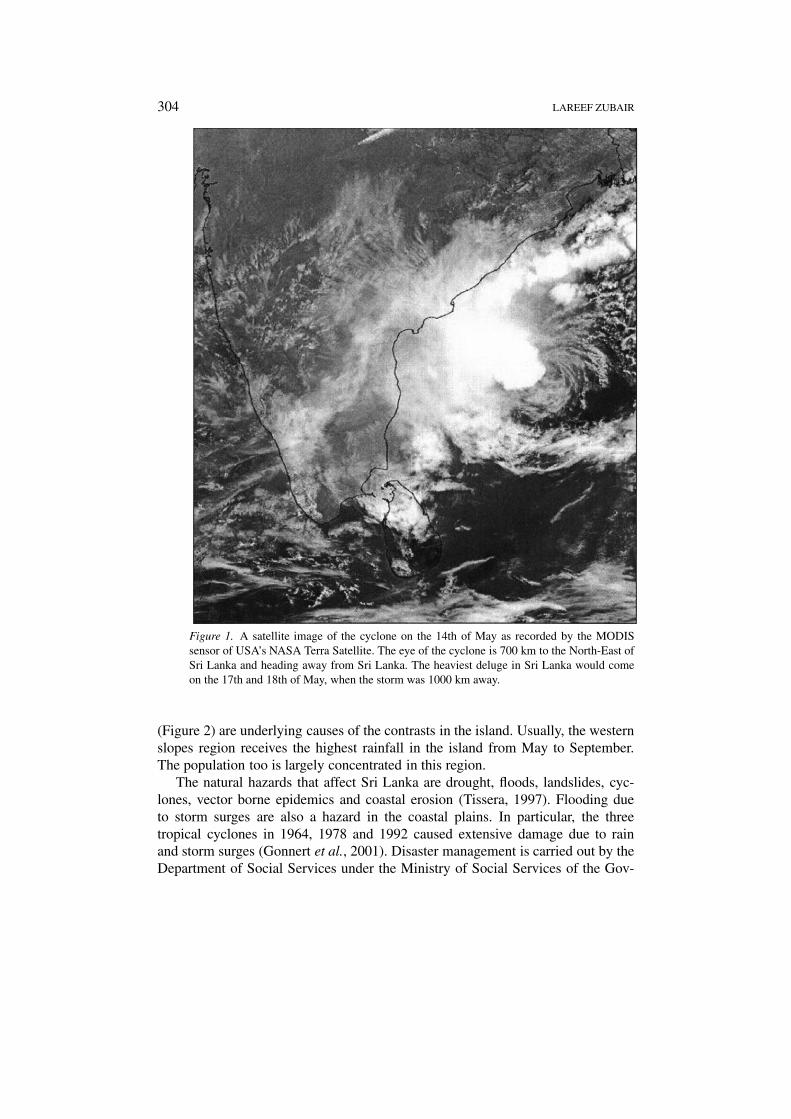
Heavy rainfall deluged South-Western Sri Lanka between the 11th and 19th of May2003 (Figure 1). Floods and landslides claimed 260 lives. A reduction of 20–30%is expected for the output of low-grown tea in the summer of 2003. Schools, homesand other infrastructure were destroyed. This was the worst natural disaster in 50years in Sri Lanka (GOSL, 2003). The World Meteorological Organization (WMO)cited this disaster as a symptom of the increase of atmospheric extreme events dueto global climate change (WMO, 2003).
Sri Lanka has an area of 65,000 square kilometers and a population of 19.5million (Department of Census and Statistics, 2001). The principal topographicfeature is an anchor shaped mountain massif in the South-Central part of the is-land that rises to 2500 meters. The topography and differences in regional climate
304 LAREEF ZUBAIR
Figure 1. A satellite image of the cyclone on the 14th of May as recorded by the MODISsensor of USA’s NASA Terra Satellite. The eye of the cyclone is 700 km to the North-East ofSri Lanka and heading away from Sri Lanka. The heaviest deluge in Sri Lanka would comeon the 17th and 18th of May, when the storm was 1000 km away.
(Figure 2) are underlying causes of the contrasts in the island. Usually, the westernslopes region receives the highest rainfall in the island from May to September.The population too is largely concentrated in this region.
The natural hazards that affect Sri Lanka are drought, floods, landslides, cyc-lones, vector borne epidemics and coastal erosion (Tissera, 1997). Flooding dueto storm surges are also a hazard in the coastal plains. In particular, the threetropical cyclones in 1964, 1978 and 1992 caused extensive damage due to rainand storm surges (Gonnert et al., 2001). Disaster management is carried out by theDepartment of Social Services under the Ministry of Social Services of the Gov-

CAUSES OF MAY 2003 FLOODING DISASTER IN SRI LANKA 305
Figure 2. The topography of Sri Lanka, the principal towns and Adam’s Peak and Piduru-talagala mountain peaks are shown.
306 LAREEF ZUBAIR
ernment of Sri Lanka. Weather prediction is handled by the Sri Lanka Departmentof Meteorology who use synoptic analysis and expert assessments to issue weatherforecasts a day in advance (Zubair, 2002b).
Almost all natural hazards that affect Sri Lanka have hydro-meteorologicalantecedents. There are useful descriptions of the meteorology related to past dis-aster such as cyclones and floods by meteorologists and climatologists (Bamford,1926; Ekanayake, 1968; Jameson, 1922, 1927, 1937; Jayatillake Banda, 1992;Suppiah, 1982; Thambyapillay, 1959). However, there has been little applicationof meteorological knowledge to hazard analysis, disaster preparedness or disasterwarning systems. To contribute to mitigating this shortcoming, a meteorologicalanalysis is presented of the recent disaster in May 2003 as part of a sustained effortto undertake meteorological applications in hazard warning in Sri Lanka.
We shall describe in the following sections, the data that we have used, therainfall climatology and seasonality of cyclone and flood hazard risk, diagnosticsregarding the regional and local effects of the cyclone and discuss the orographicrainfall influences and local area weather predictions.
2. Data
Meteorological Data: Data was obtained from the Sri Lanka Department ofMeteorology and secondary sources for 46 stations.Disaster Related Data: The sources of data were the Sri Lanka Department ofSocial Services, Sri Lanka Department of Census and Statistics and Central Bankof Sri Lanka.Remotely Sensed Data: Satellite Images of the Cyclone was obtained from “Moder-ate Resolution Imaging Spectroradiometer” (MODIS) program from the NationalAeronautics and Space Administration of the USA (http://modis.gsfc.nasa.gov/)and rainfall estimates for the Indian Ocean from Tropical Rainfall MeasuringMission (TRMM) (http://trmm.gsfc.nasa.gov/).
3. Climatological Background
The main rainy season known as “Maha” starts in Sri Lanka in October andstretches till December (Zubair, 2002c, Zubair et al., 2003). A subsidiary rainyseason know as “Yala” starts in April and lasts till June as the Tropical ConvergenceZone (TCZ) passes over Sri Lanka. From June to September, westerly winds duringthe “South-West Monsoon” lead to the heavy orographic rainfall on the westernhill slopes (Zubair, 1999). Thus in the western hill slopes, the combination of Yala,orographic and Maha rains leads to high rainfall from May to December (Figure3) with peaks in May and October. In the western hill slopes, the month of Mayshows the highest variability in rainfall from year to year, indicative of sporadicand intense storm systems that may lead to flash floods and landslides.

CAUSES OF MAY 2003 FLOODING DISASTER IN SRI LANKA 307
Figure 3. Rainfall climatology in the south-western region of Sri Lanka.
During May, the Inter-Tropical Convergence Zone cloud bands pass over SriLanka (Gadgil et al., 1984) leading to thunderstorms. The wind is in the westerlydirection over Sri Lanka (Zubair, 2002a). These westerly winds induce rainfall onthe windward side of the Sri Lanka mountain massifs, which are in the south-central part of the island (Zubair, 1999).
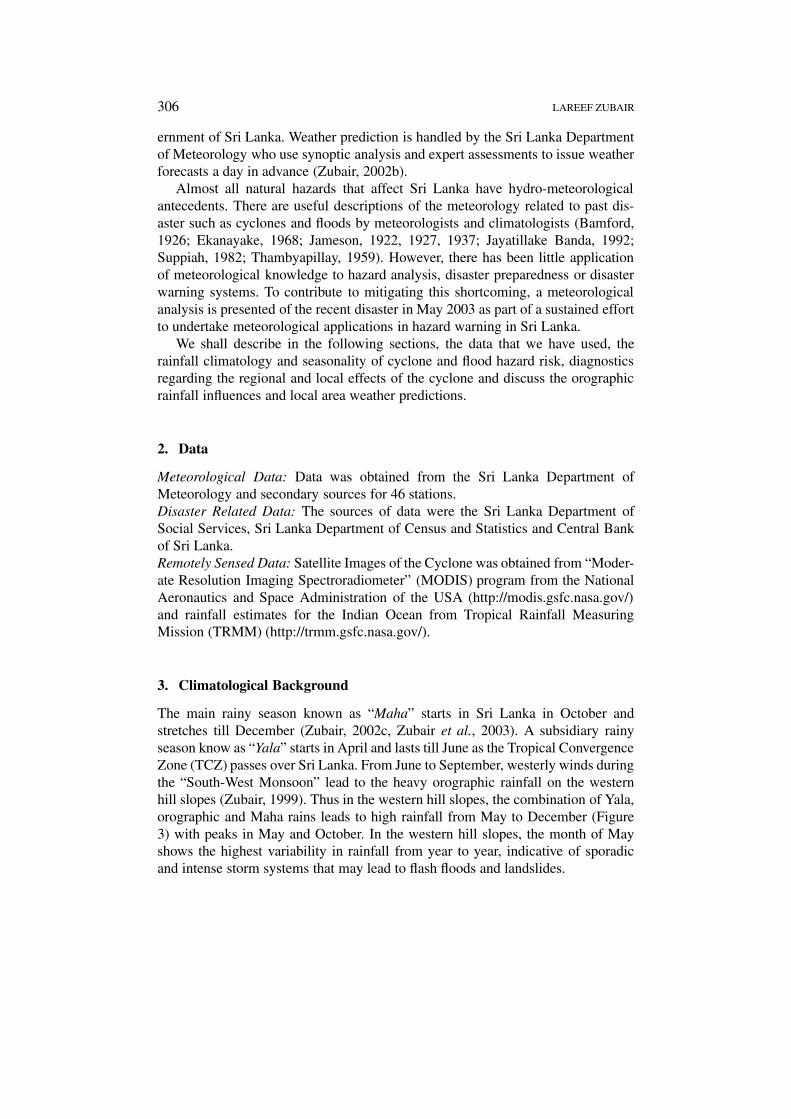
Rainfall during May (Figure 4) is usually concentrated on the South-Westerncorner. A rainfall index has been constructed as the average of the three principalstations in the South-Western coast (Galle, Ratnapura and Colombo). Since 1869,this rainfall index (Figure 5) has an average of 275 mm, a minimum of 18 mm in1953 and a maximum of 740 mm during 1916. The rainfall for the larger regioncovering the South-West coast for May 2003 is only 440 mm (Figure 5) and it iswell below the peak. However, the rainfall in some locations was as high as 893mm during May 2003.
3.1. CYCLONE HAZARD
There have been four cyclones and 10 moderate storms from the Bay of Bengalmaking landfall in Sri Lanka during the last 100 years (IMD, 1979). The Easternseaboard is at higher risk. Cyclones have rarely affected South-Western Sri Lanka.80% of all cyclones and storms occur in November and December (Figure 6). Therehas been no record of cyclones making landfall in May as the cyclones in the Bayof Bengal are steered towards Bangladesh, Burma and North-Eastern India by thesouth-westerly monsoon circulation (Singh et al., 2002).
308 LAREEF ZUBAIR
Figure 4. Average rainfall for May based on data collected by the Department of Meteorologyfrom 1960 to 1990. The stations used are marked with a bullet point. The two rainfall peaks inthe windward (westward) size of the Pidurutalagala and Adam’s Peak mountains.

CAUSES OF MAY 2003 FLOODING DISASTER IN SRI LANKA 309
Figure 5. The average rainfall for May for South-Western Sri Lanka (mean of rainfall forGalle, Ratnapura and Colombo) for the last 130 years.
Figure 6. The number of cyclones making landfall in Sri Lanka in different months duringthe last 100 years is shown.
3.2. FLOOD HAZARD
A flood disaster incidence map was constructed by using the number of majorfloods in the last 50 years. In the south-western slopes, floods occur from Octoberto February and from May to August (Zubair, 2003a). Of the 33 flood events, 11events occurred during the May to July period affecting the western slopes (Figure7). Thus the Western Slopes are at relatively high risk of flooding during May.

310 LAREEF ZUBAIR
Figure 7. The number of floods in different months from 1975–2001 years is shown.
4. Meteorological Analysis for May 2003
Cyclonic storm 01-B did not make landfall in Sri Lanka but travelled far away inthe Bay of Bengal. Figure 8 shows the traverse of the eye of the cyclone. The stormstarted 700 km to the east of Sri Lanka on the 11th of May and made its way to thenorth and north-east until it reached Myanmar on the 20th. A north-westerly windpattern over the South Asian region (Figure 9) in the lower atmosphere stalled thesouth-easterly movement of the cyclone from the 12th to the 17th.
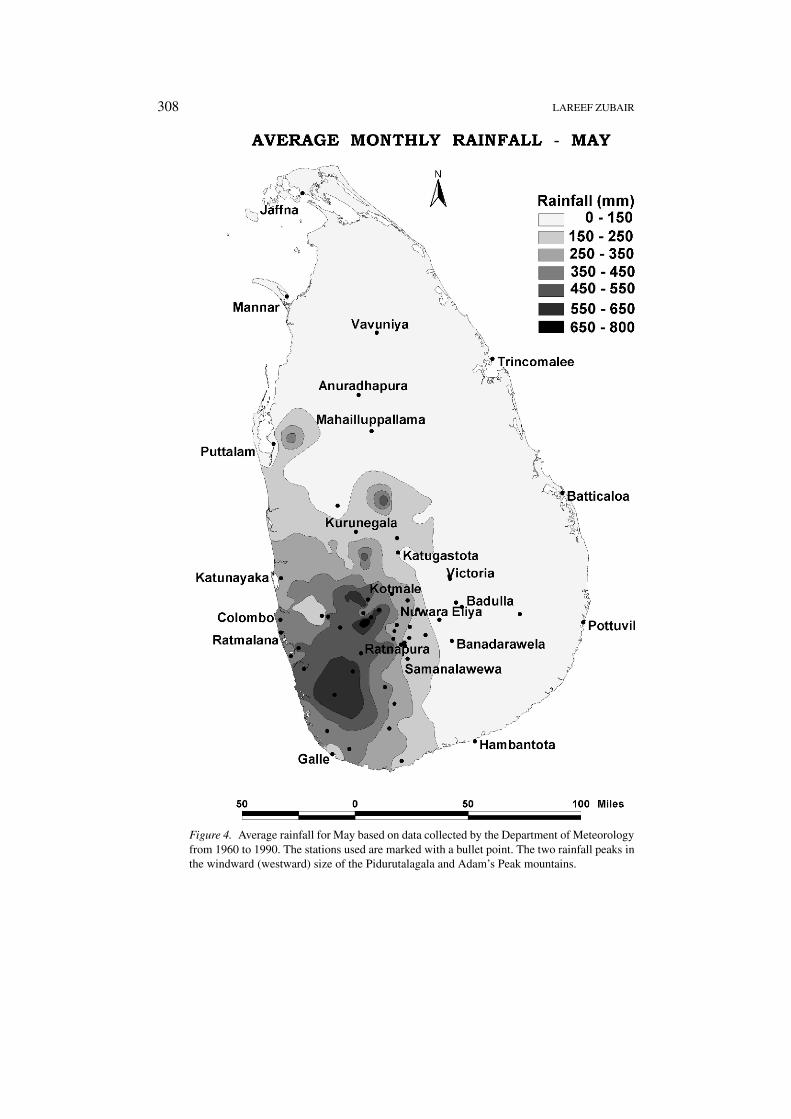
As seen in the satellite rainfall estimates for the Indian Ocean region from May15th to 19th, there was heavy rainfall along the path of the cyclone and far awayin south-western Sri Lanka (Figure 10). The rainfall in May 2003 was heavilyconcentrated in the southwest corner of the island (Figure 11). The rainfall showedan anomalous increase in a concentrated region in the south-western slopes (Figure12). The heavy rainfall in Sri Lanka from May 13 to 17 coincided with the stallingof the cyclone 01-B in the central Bay of Bengal (Figure 13). Half of the monthlyrainfall total at the Ratnapura station precipitated on the 17th of May.
4.1. OROGRAPHIC RAINFALL
Compared to the regular swift northward migration of cyclones in the Bay ofBengal, the trajectory of cyclone 01-B slowed down in the middle of the Bay ofBengal from the 12th to the 17th of May 2003. The circulation field resulting fromthe cyclone being located in the middle of the Bay of Bengal was such that therewere rapid south-westerly gusts over Sri Lanka. During May, the cloud bands thatusually deluge Kerala around June 1 hovers over Sri Lanka (Gadgil et al., 1984).The cyclonic gusts from the south-west entrained some of these clouds up the

CAUSES OF MAY 2003 FLOODING DISASTER IN SRI LANKA 311
Figure 8. The track of the 01-B storm in the Bay of Bengal from the 11th to the 19th is shown.This was a relatively weak storm that achieved the status of a cyclone only on the 14th of May.By convention, a cyclone has maximum wind speeds greater than 64 knots and storms havewind speeds in-between 34 and 64 knots.
south-western mountains in Sri Lanka precipitating the deluge on its south-westernmountain slopes. Previous work for orographic rainfall in Sri Lanka (Zubair, 1999)shows that orographic rainfall falls in a region approximately 40 km to the wind-ward (westward in May) side of the mountain ridge in Sri Lanka during the periodbetween May and September. The peak rainfall is found between 10 and 20 kmfrom the ridge. The rainfall patterns for May 2003 resemble a shadow of AdamsPeak mountain towards the South-West and the rainfall distribution is as shall beexpected for orographic rainfall in May (Figures 11 and 12).
4.2. NUMERICAL PREDICTIONS
Since March 2003, the National Centre for Medium Range Weather Forecasting(NCMRWF) has been producing maps of rainfall and wind fields with a lead timeof 3 days for Sri Lanka (Rajagopal and Iyenegar, 2003). The NCMRWF is theIndian Government Agency that issues predictions of weather from a range ofseven days up to a month (see http://www.ncmrwf.gov.in/).
The NCMWRF predictions are based on real-time weather information that isavailable from the Global Telecommunication System (GTS) of the WMO andadditional information from meteorological stations within India. All of this datais assimilated with two Global Forecast Models. These Global Model outputs areused to drive a local area model (NCEP Eta model) for the region including Sri

312 LAREEF ZUBAIR
Figure 9. The low level (3658 meters above sea level) wind anomaly field over the NorthernIndian Ocean on the 17th of May, 2003 when Sri Lanka was subjected to a heavy deluge.The cyclonic circulation pattern centered in the Bay of Bengal is overlaid over a larger scalenorth-westerly wind anomaly.
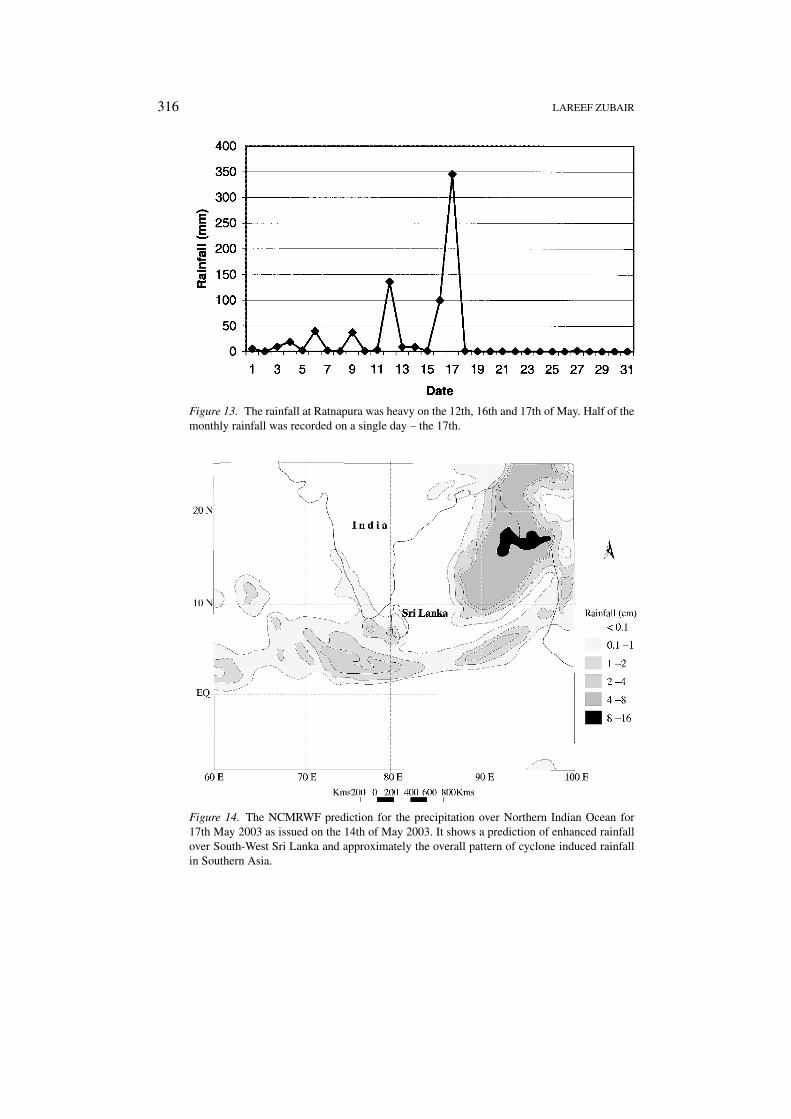
Lanka shown in Figure 14. An examination of the NCMRWF forecasts from 10thto 19th May 2003 shows that the NCMRWF model was able to provide three daysin advance forecasts of the extreme precipitation in south-western Sri Lanka (Fig-ure 14) on May 17, 2003. While the forecast is for lower than the experiencedrainfall, this model was able to capture the essential pattern of the orographicrainfall induced by the cyclonic wind field. This model has been in operation onlysince March 2003 and further refinements can be expected. In particular, the useof higher resolution topography in the simulation will improve the predictions oforographic rainfall as the representation of narrow mountains such as Adam’s peakin the simulations shall be better.
5. Conclusions
May is the month with highest rainfall variability and the highest frequency offlooding incidences in south-western Sri Lanka. Particular attention is warranted todisaster preparedness.

CAUSES OF MAY 2003 FLOODING DISASTER IN SRI LANKA 313
Figure 10. Satellite estimates of rainfall between 15th and 19th of May as observed by theTropical Rainfall Measuring Mission shows that the rainfall was along the track of the cyclonein the Bay of Bengal and remotely over South-Western Sri Lanka.
The flooding event of May 2003 in Sri Lanka was caused by the remote in-fluence of cyclone 01-B even though it traveled far away from Sri Lanka. Thiscyclone essentially stalled near the middle of the Bay of Bengal due to unusualnorth-westerly low-level geostrophic wind fields. The regional wind field inducedby the stalled cyclone was such that south-westerlies gusted over Sri Lanka. Thesestrong south-westerly winds during a period of heavy cloud activity over Sri Lankaled to heavy orographic rainfall over the south-western slopes of the south-westerncorner of the island. The unusual heavy rainfall on the South-Western slopes led tothe disastrous flooding.
This example demonstrates the need to extend caution to regions remote fromcyclone tracks during cyclone development. Local area weather prediction was ableto capture this rainfall event three days in advance and this example demonstratesthe potential utility of such predictions.
This analysis demonstrates the use of multiple strands of information such asground station observation, remotely sensed data, climate diagnostics, weatherprediction and understanding of the physical mechanisms of climate in establish-ing the hydro-meteorological antecedents of a disaster. These are resources thatshall be valuable for conducting post-event evaluations of hazards, in developinghazard-warning systems and in planning for mitigation options.

314 LAREEF ZUBAIR
Figure 11. The rainfall during May 2003 is shown and it is heaviest in two areas – one to theWest of Adams Peak (near Ratnapura) and the other to the West of the Gonagala mountainrange (between Samanalawewa and Galle).

CAUSES OF MAY 2003 FLOODING DISASTER IN SRI LANKA 315
Figure 12. The rainfall anomalies for May 2003 (computed as the departure for May 2003from the 30 year average rainfall for May). Above normal rainfall is shown with positivevalues and solid shading. Below normal rainfall is indicated with solid white and as hatchedregions.
316 LAREEF ZUBAIR
Figure 13. The rainfall at Ratnapura was heavy on the 12th, 16th and 17th of May. Half of themonthly rainfall was recorded on a single day – the 17th.
Figure 14. The NCMRWF prediction for the precipitation over Northern Indian Ocean for17th May 2003 as issued on the 14th of May 2003. It shows a prediction of enhanced rainfallover South-West Sri Lanka and approximately the overall pattern of cyclone induced rainfallin Southern Asia.
CAUSES OF MAY 2003 FLOODING DISASTER IN SRI LANKA 317
Acknowledgement
The use of data from the Sri Lanka Department of Meteorology, Sri Lanka De-partment of Social Services, MODIS and TRMM, is gratefully acknowledged. Iam grateful to Dr. E. N. Rajagopal for providing the NCMRWF model outputs.Assistance with data collection, preparation of figures and analysis by UpamalaTennakoon, Vidhura Ralapanawe, Zeenas Yahiya, M. R. A. Siraj and JanakiChandimala are gratefully acknowledged. Expert advice of Chet Ropelewski, BradLyon and Anji Seth is gratefully acknowledged. The support of the Global Dis-aster Hotspots project of the Earth Institute at Columbia University is gratefullyacknowledged.
References
Bamford, A. J.: 1926, Notes on the rain of 1926, May 14th over Ceylon, Quarterly Journal of RoyalMeteorological Society 52(220), 430–432.
Ekanayake, L. A. D. I.: 1968, Cyclone over Ceylon, December 1964, Weather 23(5), 195–197.GOSL (Government of Sri Lanka): 2003, Initial Assessment of Emergency and Rehabilitation
Requirements: Floods May 2003, Department of Social Services, Colombo. (available athttp://www.socialwelfare.gov.lk/floods/)
Gadgil, G., Joseph, P. V., and Joshi, N. V.: 1984, Ocean atmosphere coupling over monsoon regions,Nature 312, 141–143.
Gonnert, G, Dube, S. K., Murty, T., and Siefert, W.: 2001, Global storm surges: Theory observationand application, German Coastal Engineering Research Council, 623 pp.
IMD (India Meteorological Department): 1979, Tracks of storms and depressions in the Bay ofBengal and the Arabian Sea, India Meteorological Department, New Delhi, India, 186 pp.
Jameson, H.: 1922, Whirlwind at Veyangoda, Ceylon, 20th July 1921, Quarterly Journal of RoyalMeteorological Society LXVIII, 59–60.
Jameson, H.: 1927, Heavy rainfall in Ceylon, Transaction of the Engineering Association of Ceylon,1926–27, pp. 30–88.
Jameson, H.: 1937, The heavy rains of May, 1933 in Ceylon, Ceylon Journal of Science Sec. E. 2(2)77–79.
Jayatilake Banda, P. M.: 1992, Exceptional heavy rain in Colombo 4th and 5th June 1992, Proceed-ings of the 48th Annual Session, Sri Lanka. Association for the Advancement of Science, 48,104–105.
Rajagopal, E. N. and Iyengar, G. R.: 2003, Performance of Mesoscale Eta Model over India, in S.V. Singh, Swati Basu, and T. N. Krishnamurthi (eds.), Weather and Climate Modeling, New AgePublishers, New Delhi.
Singh, O. P., Khan, T. M. A., and Rahman, M. S. 2002: Impact of southern oscillation on thefrequency of monsoon depressions in the Bay of Bengal, Natural Hazards 25, 101–115.
Suppiah, R.: 1982, Some aspects of the cyclone over Sri Lanka, November 23/24, 1978, Climatolo-gical Notes 30, 125–139.
Thambyahpillay, G. G. R.: 1959, Tropical cyclones and the climate of Ceylon, University of CeylonReview 17(3/4), 137–180.
Tissera, C. H.: 1997, Natural hazards, in S. Somasekeram, Arjuna’s Atlas of Sri Lanka, ArjunaPublishers, Colombo.
WMO (World Meteorological Organization) : 2003, According to the WMO ExtremeWeather Events May Increase, Press Release 695, 2 July 2003, Geneva. (available athttp://www.wmo.ch/web/Press/Press695.doc)

318 LAREEF ZUBAIR
Zubair, L.: 1999, A dynamical model for orographic rainfall in Sri Lanka, Proceedings of theTROPMET-99, Chennai, Indian Meteorological Society, pp. 269–273.
Zubair, L.: 2002a, Diurnal and seasonal variations in surface winds at Sita Eliya, Sri Lanka,Theoretical and Applied Climatology 71(1–2), 119–127.
Zubair, L.: 2002b, Development of Meteorology in Sri Lanka, Journal of the Institution of Engineers,Sri Lanka 15(2), 14–18.
Zubair, L.: 2002c, El-Niño-southern oscillation influences on rice production in Sri Lanka, Interna-tional Journal of Climatology 22(2), 249–260.
Zubair, L.: 2003, Sensitivity of Kelani streamflow in Sri Lanka to ENSO, Hydrological Processes17(12), 2439–2448.
Zubair, L., Rao, S. C., and Yamagata, T.: 2003, Modulation of Sri Lanka rainfall by the Indian Oceandipole, Geophysical Research Letters 10(2), 1063–1066.