MAximum Multicore POwer (MAMPO) - An Automatic ...
12
MAximum Multicore POwer (MAMPO) - An Automatic Multithreaded Synthetic Power Virus Generation Framework for Multicore Systems Karthik Ganesan and Lizy K John ECE Department, University of Texas at Austin, TX, USA [email protected] and [email protected] ABSTRACT The practically attainable worst case power consumption for a com- puter system is a significant design parameter and it is a very te- dious process to determine it by manually writing high power con- suming code snippets called power viruses. Previous research ef- forts towards automating the power virus generation process are all limited to the single core processors and are not effective when applied to multicore parallel systems as the components like the interconnection network, shared caches, DRAM and coherence di- rectory also contribute significantly to the power consumption of a multicore parallel system. In this paper we propose MAximum Multicore POwer (MAMPO), which is the pioneer attempt towards a framework to automatically generate a multithreaded power virus for a given multicore parallel system configuration. We show that the the power viruses generated by MAMPO consume 40% to 89% more power than running multiple copies of single-core power viruses like MPrime torture test and the most recent published previous work called SYMPO on 3 different parallel multicore system con- figurations. The superiority of the MAMPO viruses are also shown by comparing the power consumption of the MAMPO viruses with that of the workloads in the PARSEC benchmark suite and that of the commercial Java benchmark SPECjbb. The MAMPO viruses consume 45% to 98% more power than that of the average power consumption of the workloads in the PARSEC suite and 41% to 56% more power than that of the commercial benchmark SPECjbb. 1. INTRODUCTION Due to power delivery, thermal and cooling issues along with a world-wide initiative towards green computing, power consump- tion is a first class design parameter in high end server systems and it has always been a significant constraint in low end embedded sys- tem design. More specifically, the maximum power consumption for which computer systems are designed, called the Thermal De- sign Power (TDP) is one of the most important of the different de- sign parameters and is something that is very carefully determined by the computer architects. The cooling systems of these modern processors/memories are designed in such a way, that these systems are deemed to safely operate only within this power cap and are Permission to make digital or hard copies of all or part of this work for personal or classroom use is granted without fee provided that copies are not made or distributed for profit or commercial advantage and that copies bear this notice and the full citation on the first page. To copy otherwise, to republish, to post on servers or to redistribute to lists, requires prior specific permission and/or a fee. SC11, November 12-18, 2011, Seattle, Washington, USA Copyright 2011 ACM 978-1-4503-0771-0/11/11 ...$10.00. equipped with the capability to automatically throttle down the op- erating frequency when the system is driven to reach this maximum power. This maximum power consumption for which a system is designed cannot just be fixed as the sum of the power consump- tion of the various components in the system, but rather it has to be the maximum attainable power consumption that a user work- load could practically achieve in the system under design. This is due to the fact that this maximum attainable power consumption is quite low compared to the sum of the power consumption of var- ious micro-architectural components as it is almost impossible to keep all these components of a system simultaneously active by any workload. The process of determining the maximum power for a design is very complicated due to it’s dependence on multiple factors like the workload that could be executed, the configuration of the system, the power saving features implemented in hardware and the way some of these features are exercised by the operating system. If the maximum power of a design is fixed too high, a designer will end up wasting a lot of resources by over-provisioning the heat sinks, cooling system, power delivery system and various other sys- tem level power management utilities. A related example will be the design of external power supplies to server systems. Due to incognizance of the precise maximum attainable power of a sys- tem, a power supply could be designed to handle a high load and when the typical usage scenario is far below that load, the effi- ciency of the power supply is known to drop many folds [1]. It is to be noted that over provisioning of these power related utilities could result in substantial increase in maintenance costs of servers as it is estimated that for every watt of power used by the comput- ing infrastructure in a data center, another 0.33 to 0.5 watt of power is required by the cooling system [2] [3] due to the ongoing rack- level compaction [4]. On the other hand, if this maximum power consumption is underestimated, it results in affecting the overall system reliability and availability due to overheating. When the ambient temperature increases beyond the safe operating limits, it could result in early failure of the micro-architectural components resulting in sporadic system freezes and crashes. In an effort towards fixing the maximum power consumption of systems at the most optimal point, architects are used to hand- crafting possible code snippets called power viruses [5] [6]. But, this process of trying to manually write such maximum power con- suming code snippets is very tedious [7]. This tedium is due to the fact that there are so many components that interact when a work- load executes on a processor/system making it intractable to model all these complex interactions and requires a profound knowledge about these interactions to be able to write a code snippet that will exactly exercise a given execution behavior. Adding to this complexity are the various power saving features implemented in
Transcript of MAximum Multicore POwer (MAMPO) - An Automatic ...

MAximum Multicore POwer (MAMPO) - An AutomaticMultithreaded Synthetic Power Virus Generation
Framework for Multicore Systems
Karthik Ganesan and Lizy K JohnECE Department, University of Texas at Austin, TX, USA
[email protected] and [email protected]
ABSTRACTThe practically attainable worst case power consumption for a com-puter system is a significant design parameter and it is a very te-dious process to determine it by manually writing high power con-suming code snippets called power viruses. Previous research ef-forts towards automating the power virus generation process areall limited to the single core processors and are not effective whenapplied to multicore parallel systems as the components like theinterconnection network, shared caches, DRAM and coherence di-rectory also contribute significantly to the power consumption ofa multicore parallel system. In this paper we propose MAximumMulticore POwer (MAMPO), which is the pioneer attempt towardsa framework to automatically generate a multithreaded power virusfor a given multicore parallel system configuration. We show thatthe the power viruses generated by MAMPO consume 40% to 89%more power than running multiple copies of single-core power viruseslike MPrime torture test and the most recent published previouswork called SYMPO on 3 different parallel multicore system con-figurations. The superiority of the MAMPO viruses are also shownby comparing the power consumption of the MAMPO viruses withthat of the workloads in the PARSEC benchmark suite and that ofthe commercial Java benchmark SPECjbb. The MAMPO virusesconsume 45% to 98% more power than that of the average powerconsumption of the workloads in the PARSEC suite and 41% to56% more power than that of the commercial benchmark SPECjbb.
1. INTRODUCTIONDue to power delivery, thermal and cooling issues along with a
world-wide initiative towards green computing, power consump-tion is a first class design parameter in high end server systems andit has always been a significant constraint in low end embedded sys-tem design. More specifically, the maximum power consumptionfor which computer systems are designed, called the Thermal De-sign Power (TDP) is one of the most important of the different de-sign parameters and is something that is very carefully determinedby the computer architects. The cooling systems of these modernprocessors/memories are designed in such a way, that these systemsare deemed to safely operate only within this power cap and are
Permission to make digital or hard copies of all or part of this work forpersonal or classroom use is granted without fee provided that copies arenot made or distributed for profit or commercial advantage and that copiesbear this notice and the full citation on the first page. To copy otherwise, torepublish, to post on servers or to redistribute to lists, requires prior specificpermission and/or a fee.SC11, November 12-18, 2011, Seattle, Washington, USACopyright 2011 ACM 978-1-4503-0771-0/11/11 ...$10.00.
equipped with the capability to automatically throttle down the op-erating frequency when the system is driven to reach this maximumpower. This maximum power consumption for which a system isdesigned cannot just be fixed as the sum of the power consump-tion of the various components in the system, but rather it has tobe the maximum attainable power consumption that a user work-load could practically achieve in the system under design. This isdue to the fact that this maximum attainable power consumption isquite low compared to the sum of the power consumption of var-ious micro-architectural components as it is almost impossible tokeep all these components of a system simultaneously active byany workload. The process of determining the maximum powerfor a design is very complicated due to it’s dependence on multiplefactors like the workload that could be executed, the configurationof the system, the power saving features implemented in hardwareand the way some of these features are exercised by the operatingsystem.
If the maximum power of a design is fixed too high, a designerwill end up wasting a lot of resources by over-provisioning the heatsinks, cooling system, power delivery system and various other sys-tem level power management utilities. A related example will bethe design of external power supplies to server systems. Due toincognizance of the precise maximum attainable power of a sys-tem, a power supply could be designed to handle a high load andwhen the typical usage scenario is far below that load, the effi-ciency of the power supply is known to drop many folds [1]. It isto be noted that over provisioning of these power related utilitiescould result in substantial increase in maintenance costs of serversas it is estimated that for every watt of power used by the comput-ing infrastructure in a data center, another 0.33 to 0.5 watt of poweris required by the cooling system [2] [3] due to the ongoing rack-level compaction [4]. On the other hand, if this maximum powerconsumption is underestimated, it results in affecting the overallsystem reliability and availability due to overheating. When theambient temperature increases beyond the safe operating limits, itcould result in early failure of the micro-architectural componentsresulting in sporadic system freezes and crashes.
In an effort towards fixing the maximum power consumption ofsystems at the most optimal point, architects are used to hand-crafting possible code snippets called power viruses [5] [6]. But,this process of trying to manually write such maximum power con-suming code snippets is very tedious [7]. This tedium is due to thefact that there are so many components that interact when a work-load executes on a processor/system making it intractable to modelall these complex interactions and requires a profound knowledgeabout these interactions to be able to write a code snippet thatwill exactly exercise a given execution behavior. Adding to thiscomplexity are the various power saving features implemented in
!"#$%&'()*
+,-.$%&'()*
/0$%&'()*
1!2$%&'()*
+3)$%&'()*
(a)
!"#$%&'()*
+,-.$%&'()*
/0$%&'()*
1!2$%&'()*
+3)$%&'()*
(b)
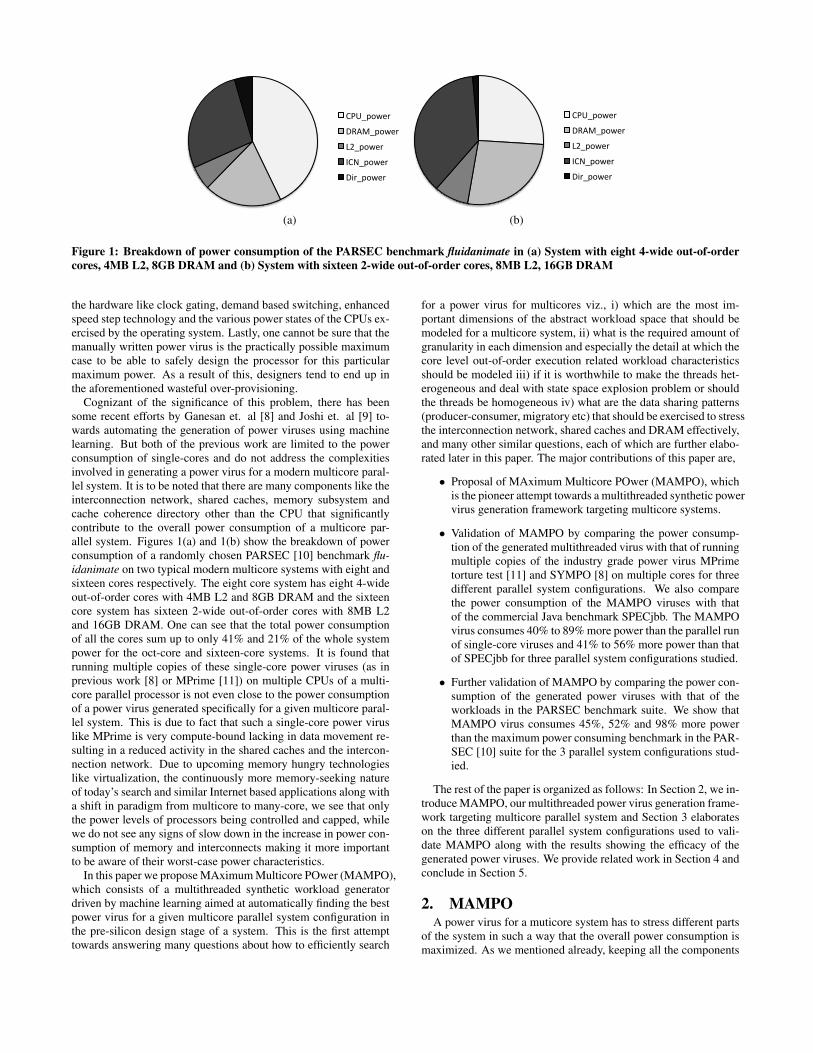
Figure 1: Breakdown of power consumption of the PARSEC benchmark fluidanimate in (a) System with eight 4-wide out-of-ordercores, 4MB L2, 8GB DRAM and (b) System with sixteen 2-wide out-of-order cores, 8MB L2, 16GB DRAM
the hardware like clock gating, demand based switching, enhancedspeed step technology and the various power states of the CPUs ex-ercised by the operating system. Lastly, one cannot be sure that themanually written power virus is the practically possible maximumcase to be able to safely design the processor for this particularmaximum power. As a result of this, designers tend to end up inthe aforementioned wasteful over-provisioning.
Cognizant of the significance of this problem, there has beensome recent efforts by Ganesan et. al [8] and Joshi et. al [9] to-wards automating the generation of power viruses using machinelearning. But both of the previous work are limited to the powerconsumption of single-cores and do not address the complexitiesinvolved in generating a power virus for a modern multicore paral-lel system. It is to be noted that there are many components like theinterconnection network, shared caches, memory subsystem andcache coherence directory other than the CPU that significantlycontribute to the overall power consumption of a multicore par-allel system. Figures 1(a) and 1(b) show the breakdown of powerconsumption of a randomly chosen PARSEC [10] benchmark flu-idanimate on two typical modern multicore systems with eight andsixteen cores respectively. The eight core system has eight 4-wideout-of-order cores with 4MB L2 and 8GB DRAM and the sixteencore system has sixteen 2-wide out-of-order cores with 8MB L2and 16GB DRAM. One can see that the total power consumptionof all the cores sum up to only 41% and 21% of the whole systempower for the oct-core and sixteen-core systems. It is found thatrunning multiple copies of these single-core power viruses (as inprevious work [8] or MPrime [11]) on multiple CPUs of a multi-core parallel processor is not even close to the power consumptionof a power virus generated specifically for a given multicore paral-lel system. This is due to fact that such a single-core power viruslike MPrime is very compute-bound lacking in data movement re-sulting in a reduced activity in the shared caches and the intercon-nection network. Due to upcoming memory hungry technologieslike virtualization, the continuously more memory-seeking natureof today’s search and similar Internet based applications along witha shift in paradigm from multicore to many-core, we see that onlythe power levels of processors being controlled and capped, whilewe do not see any signs of slow down in the increase in power con-sumption of memory and interconnects making it more importantto be aware of their worst-case power characteristics.
In this paper we propose MAximum Multicore POwer (MAMPO),which consists of a multithreaded synthetic workload generatordriven by machine learning aimed at automatically finding the bestpower virus for a given multicore parallel system configuration inthe pre-silicon design stage of a system. This is the first attempttowards answering many questions about how to efficiently search
for a power virus for multicores viz., i) which are the most im-portant dimensions of the abstract workload space that should bemodeled for a multicore system, ii) what is the required amount ofgranularity in each dimension and especially the detail at which thecore level out-of-order execution related workload characteristicsshould be modeled iii) if it is worthwhile to make the threads het-erogeneous and deal with state space explosion problem or shouldthe threads be homogeneous iv) what are the data sharing patterns(producer-consumer, migratory etc) that should be exercised to stressthe interconnection network, shared caches and DRAM effectively,and many other similar questions, each of which are further elabo-rated later in this paper. The major contributions of this paper are,
• Proposal of MAximum Multicore POwer (MAMPO), whichis the pioneer attempt towards a multithreaded synthetic powervirus generation framework targeting multicore systems.
• Validation of MAMPO by comparing the power consump-tion of the generated multithreaded virus with that of runningmultiple copies of the industry grade power virus MPrimetorture test [11] and SYMPO [8] on multiple cores for threedifferent parallel system configurations. We also comparethe power consumption of the MAMPO viruses with thatof the commercial Java benchmark SPECjbb. The MAMPOvirus consumes 40% to 89% more power than the parallel runof single-core viruses and 41% to 56% more power than thatof SPECjbb for three parallel system configurations studied.
• Further validation of MAMPO by comparing the power con-sumption of the generated power viruses with that of theworkloads in the PARSEC benchmark suite. We show thatMAMPO virus consumes 45%, 52% and 98% more powerthan the maximum power consuming benchmark in the PAR-SEC [10] suite for the 3 parallel system configurations stud-ied.
The rest of the paper is organized as follows: In Section 2, we in-troduce MAMPO, our multithreaded power virus generation frame-work targeting multicore parallel system and Section 3 elaborateson the three different parallel system configurations used to vali-date MAMPO along with the results showing the efficacy of thegenerated power viruses. We provide related work in Section 4 andconclude in Section 5.
2. MAMPOA power virus for a muticore system has to stress different parts
of the system in such a way that the overall power consumption ismaximized. As we mentioned already, keeping all the components

GAconverged ? Create next
generation
GENETIC ALGORITHM
No
Yes
BEST POWER VIRUSThread 1: spec 1 ... spec mThread 2:...
::
Thread n: Multithreaded Synthetic 1 Multithreaded Synthetic 2
: : Multithreaded Synthetic D
ABSTRACT WORKLOAD PARAMETERS
CODEGENERATOR
C-Code for Dn-threaded syntheticsCOMPILERAssembly for D
n-threaded synthetics
ASM POSTPROCESSOR
Post processedAssembly for D
n-threaded syntheticsASSEMBLER
n-thrbinary 1
n-thrbinary D
....
FULL SYSTEMSIMULATOR
FitnessValues for allD synthetics
in thisgeneration
Figure 2: Multithreaded power virus generation framework
of a system simultaneously active is not possible. For example, tobe able to stress the DRAM of a system, the processor may have tostall for many cycles for those long-latency loads to complete. Anyprogram that is completely memory-bound cannot consume muchpower in the cores and a program that is completely compute-boundcannot consume much power in the memory, caches or the inter-connection network. Thus, the power virus has to strike the rightbalance between stressing different power consuming componentsin the system to be able to maximize the overall power. There aremany latency hiding mechanisms implemented throughout a mod-ern computer system starting from the out-of-order execution cir-cuitry in the cores, various buffers, the miss status handling reg-isters in the caches, pipelining in the interconnection network tovarious optimizations implemented in the DRAM controller and allof these numerous features should be exploited to the right extentby this power virus to achieve maximum overall power. Mainly toavoid the need to model all these complex interactions, we use ablack-box approach that employs a machine learning based searchtechnique along with a multithreaded workload generator to auto-matically search for a power virus given a multicore system config-uration.
The main components of the MAMPO framework are, i) the ab-stract workload model used ii) the code generator, compiler and theassembly post processor iii) the full system simulator with detailedpower models used to evaluate the power consumption of the mul-tithreaded synthetics and iv) the machine learning technique em-ployed in the framework, Genetic Algorithm (GA). Figure 2 showsthe flowchart of the power virus generation framework. The Ge-netic Algorithm (GA) [12] generates the parameter values for thepotential candidates for the synthetic power virus case as it itera-tively searches through the abstract workload space. These gen-erated abstract workload characteristics are fed to the code gener-ator that generates a multi-threaded synthetic C program contain-ing embedded assembly instructions for each thread based on thesespecified characteristics. This multi-threaded C code is then trans-lated to direct assembly code with the help of a compiler. At times,
the compiler introduces some spurious stack operations amidst theset of instructions that we incorporate as embedded assembly andthis assembly code has to be post processed to remove such unnec-essary instructions and then it is further compiled into a SPARCbinary. This multi-threaded SPARC binary is then executed on afull system simulator with cycle accurate power models for vari-ous system components to evaluate the power consumption of thegenerated synthetic on the system configuration under study. Thesepower consumption numbers are fed back to the Genetic Algorithmto intelligently choose the next set of potential candidates for thepower virus and this process iteratively continues until the searchconverges to find the best power virus for a given system configura-tion. Each of the components of this framework will be explainedin detail further in this Section.
2.1 Genetic AlgorithmThe machine learning approach we use in our framework is pop-
ularly called the Genetic Algorithm (GA) [12]. GA is a search tech-nique inspired by evolutionary biology where problem solutions areencoded as chromosomes and these chromosomes are mutated andrecombined to form newer chromosomes. A population in the ge-netic space is defined as a set of chromosomes or possible outcomesof the problem under investigation. The algorithm proceeds by firstchoosing a set of D random chromosomes as the initial population,where D is the deme size or the population size used in the algo-rithm. For our power virus search, a chromosome will refer to theset of parameters in the abstract workload space for a candidatemultithreaded synthetic workload. These D random chromosomes(multithreaded synthetics) form the first generation of individualsfor the algorithm to get started. These synthetics of the first gen-eration are evaluated for their fitness, which is their overall systemlevel power consumption in our problem on the system configura-tion under study. The fitness values represent the quality of theseindividuals in the population and are fed back to the GA. Based onthe fitness values of these synthetics, there are different operatorsthat are applied on them like mutation, crossover and elite repro-

duction to produce the chromosomes of the individuals of the nextgeneration, which are again evaluated for their fitness and fed backto the GA. This evolutionary process continues until the GeneticAlgorithm converges with the same value for each of the differentdimensions and is repeated by seeding the GA with different ran-dom seeds to make sure that the results are robust. Though onemay argue that this process of GA does not necessarily guaranteeto achieve the best theoretically maximum power virus as it is stilla heuristic based global optimization technique, by seeding the GAwith different starting points and running it until convergence doesguarantee a tight upper-bound for the maximum power for practicalpurposes.
The most significant operators used in GA are mutation and crossover.Mutation operator probabilistically chooses parts of the chromo-some and modifies them to form new chromosomes. In our case,the specifications of the multithreaded synthetics in terms of ab-stract workload parameters are modified randomly to form newmultithreaded synthetics. The crossover operator recombines partsof two chosen chromosomes in some way to form a new chromo-some for the offspring. The specifications of two chosen multi-threaded synthetics are combined in a meaningful way to form thespecifications of the new multithreaded synthetic offspring. Wewill further explain the values used for these GA parameters like themutation rate, crossover rate and reproduction rate for our powervirus search problem in Section 3.
In this Subsection, we further explain why we chose GA overother search techniques. Firstly, as a general rule of thumb, a di-rected search technique like Genetic Algorithm (GA) is more effi-cient than a random search technique or a brute force methodology.Through various experiments, we have found that the crossover op-erator employed in GA is very effective when searching through theworkload space for a power virus. This is because when we crossover two good solutions in our space, the characteristics of the par-ents can be very meaningfully merged and hence the offspring isalso usually good, when compared to a random sample in the samespace. In the rest of this Section, we elaborate on the abstract work-load model that is employed and the process of code generation forthe multithreaded synthetic workload.
2.2 Abstract Workload ModelThe effectiveness of this kind of power virus generation frame-
work lies mainly in the efficacy of the abstract workload space thatis being searched through by machine learning. Firstly, the dimen-sions of this abstract workload space should be as much microarchi-tecture independent as possible to enable this framework to be ableto generate the best power virus for different types of microarchi-tectures. It is the job of the machine learning algorithm to take careof tailoring the parameters of the abstract workload model to max-imize the power consumption for a given microarchitecture basedon power estimates provided by the simulator for this microarchi-tecture under study. But, it is also important that these dimensionsof the abstract workload space be robust enough to be able to varythe execution behavior of the generated workload in every part ofthe multicore system. It is to be noted that the dimensions shouldalso not be too many as it could also result in a situation where thesearch would never converge due to a state space explosion. Thecharacteristics of real-world programs that affect performance andin turn the power consumption are carefully studied and is usedas a guide to design these dimensions as it is important that thegenerated power virus should still be a realistic workload depictingthe practically attainable maximum power. In earlier approachesfor synthetic benchmark generation for uniprocessors, researcherscame up with metrics to characterize the execution behavior of pro-
grams on single core processors [13] [14] [15] [16] [17]. In thispaper, we come up with similar metrics for the generation of mul-tithreaded synthetics for multicore systems.
In the abstract workload model, we have the choice of searchingfor a multithreaded power virus with homogeneous thread char-acteristics or provide the GA with the flexibility to configure thethreads to be heterogeneous. It is to be noted that, when the threadsare made heterogeneous, almost we multiply the number of dimen-sions in the abstract workload space for every thread by the numberof threads. This could possibly result in a state space explosion andthe GA may never converge. But, on the other hand, most of thereal world parallel applications have heterogeneous thread charac-teristics [10] at least in their data access pattern. For example, oneof the most commonly used data access pattern is the producer-consumer relationship between simultaneously executing threads,where one or more producer threads write data, which is read byone or more consumer threads. To be able to exercise such a behav-ior in the synthetic, there should be some amount of heterogeneityin the threads to be able to act as a producer and a consumer thread.At a minimum, there should be some heterogeneity in the instruc-tion mix in terms of the number of loads or stores. But, due tothis heterogeneity in the instruction mix, the other core-level di-mensions may also need be adjusted heterogeneously to be able toconsume maximum power. For example, the producer threads mayneed to have a different register dependency distance or branch pre-dictability than the consumer thread to be able maximize the powerconsumption of the core, in turn to keep the system at its maximumattainable power. Figure 3 shows the different dimensions of ourabstract workload model and their granularity. Further in this Sec-tion, we explain each of these dimensions or what we call as the’knobs’ of our workload generator. We first begin by explainingthe intuition behind the design of this abstract workload space.
In our abstract workload model, we have a controlled amount ofheterogeneity, where only a few heterogeneous classes of threadscan be configured and all the threads in the system have to belongto one of these few heterogeneous classes. The threads within aclass are homogeneous. This controls the state space explosionand we will also be able to mimic the communication character-istics of the real parallel applications. We have found that a rea-sonable number for heterogeneous classes is four, up to which thestate space is tractable and also allows to control power for themajor power consuming components. Investigation in previous re-search [18][19][20][21][22] about the communication characteris-tics of the parallel applications has showed that there are four sig-nificant data sharing patterns that happen in real parallel applica-tions, namely,
1. Producer-consumer sharing pattern: One or more pro-ducer threads write to a shared data item and one or moreconsumers read it. This kind of sharing pattern can be ob-served in the SPLASH-2 benchmark ocean.
2. Read-only sharing pattern: This pattern occurs when theshared data is constantly being read and is not updated. SPLASH-2 benchmark raytrace is a good example exhibiting this kindof a behavior.
3. Migratory sharing pattern: This pattern occurs when a pro-cessor reads and writes to a shared data item within a shortperiod of time and this behavior is repeated by many pro-cessors. A good example of this behavior will be a globalcounter that is incremented by many processors.
4. Irregular sharing pattern: There is not any regular patterninto which this access behavior can be classified into. A good

!" #$%&"$'()" #$%&"*'$+)"!",-*."/0'11)1""
2'3)+%*4"
!" #$%&'(")*"+,('-./" !0"10"20"!30"45" 1" 6-(-77'78/%"5" 9,('-.":7-//";"<():'//)("-//8=>%'>+"" !0"50"?"!5"" @"4" 6'(:'>+"%'%)(A"-::'//'/"+)"/,-('.".-+-" !B0"4B0"CB0"3B0"DB0"EB" 1""1" F,-('."%'%)(A"-::'//"/+(8.'/"8>"+G)"&$:H'+/" B0"10"20"!50"!30"450"31" 1""C" I)$<7'."7)-.@/+)('/" 9($'J*-7/'"" !"
F,-('.".-+-"-::'//"<-++'(>"->.":)%%$>8:-+8)>":,-(-:+'(8/+8:/"
3" 6(8K-+'"%'%)(A"-::'//"/+(8.'/"8>"+G)"&$:H'+/" "B0"10"20"!50"!30"450"31"8>"'-:,"&$:H'+" 1" 6(8K-+'".-+-"-::'//"
<-++'(>"
D" L)(H8>="/'+"/8M'"NO"7))<"8+'(-+8)>/"&'*)('"-((-A"<+(P"('/'+Q" !0"!B0"5B0"1B0"!BB0"5BB" 1" R'%)(A"*))+<(8>+"
2" R'%)(A"S'K'7"6-(-77'78/%"NRS6Q" !0"50"40"10"3" 1"E" RS6"*('T$'>:A" U8=,0"7)G" !"
R'%)(A"7'K'7"<-(-77'78/%"
!B" "VK'(-='"&-/8:"&7):H"/8M'" !B0"5B0"4B0"CB0"!BB" !"!!" "VK'(-='"&(->:,"<('.8:+-&878+A" BP20"BP230"BPE50"BPE30"BPE20"BPEE0"!PB" 1"
I)>+()7"*7)G"<('.8:+-&878+A"
!5" "W#9"VSX"<()<)(+8)>" B"@"1" 1"!4" "W#9"RXS"<()<)(+8)>" B"@"1" 1"!1" "W#9"YWZ"<()<)(+8)>" B"@"1" 1"!C" "[6"VYY"<()<)(+8)>" B"@"1" 1"!3" "[6"RXS"<()<)(+8)>" B"@"1" 1"!D" "[6"YWZ"<()<)(+8)>" B"@"1" 1"!2" "[6"R\Z"<()<)(+8)>" B"@"1" 1"!E" "[6"F]^9"<()<)(+8)>" B"@"1" 1"
W>/+($:+8)>"%8_"
5B" "S\VY"<()<)(+8)>" B"@"1" 1"
5!" "F9\^`"<()<)(+8)>" B"@"1" 1"
W>/+($:+8)>"%8_0".-+-"-::'//"<-++'(>"->.":)%%$>8:-+8)>":,-(-:+'(8/+8:/"
55" ^'=8/+'(".'<'>.'>:A".8/+->:'"N>$%&'(")*"8>/+($:+8)>/Q" !0"50"10"20"!30"450"31" 1" W>/+($:+8)>"7'K'7"
<-(-77'78/%"54" ^->.)%"/''." !0"50"4" !" I).'"-78=>%'>+"
""""
Figure 3: Abstract workload model
example will be a global task queue, which can be enqueuedor dequeued by any processor which does not follow a par-ticular order.
Though the above said patterns are the most commonly occur-ring sharing patterns, subtle variations of each one or more thanone sharing pattern may be occurring in a multicore system. In ourframework, we use a generic memory access model, which whenparameterized accordingly, can yield any combination of the abovesaid sharing patterns. In our abstract workload model, we do notinclude some characteristics of parallel applications like locks andbarriers, because the presence of locks and barriers always resultin slowing down the execution of applications resulting in a loweroverall power consumption. Next in this Section, we provide a briefoverview of our generic memory access model and then elaborateon each of the different dimensions of the abstract workload spaceor what we call as the ’knobs’ of our workload generator.
Our memory access model is mainly based on a ’stride’ basedaccess pattern [13] in terms of static loads and stores in the code.When profiling a modern workload, one can observe that each ofthe static loads/stores access the memory like in an arithmetic pro-gression, where the difference between the addresses of two suc-cessive accesses is called the stride. It is known that the mem-ory access pattern of most of the SPEC CPU2000 and the SPECCPU2006 workloads can be safely approximated to be followinga few dominant stride values [15] [14]. In our abstract workloadmodel, we handle the stride values of the memory accesses to theprivate and shared data separately. For both of the shared and theprivate memory accesses, the stride values are grouped into twobins and the stride value assigned to a memory access instructionis chosen with equal probability from each of the bins. Along withthe stride access patterns, the proportion of loads and stores in each
thread also affect the data sharing pattern of the synthetic workload.For example, to achieve the producer-consumer sharing pattern be-tween two threads, one will have to configure the instruction mixin such a way that the loads to shared data in the consumer and thestores to shared data in producer are in the right proportion and alsoconfigure the remaining knobs like the percent memory accesses toshared data, strides to shared data, thread assignment to processorsand working set size to enable these threads to communicate theright amount of data between each other in a given pattern. Thoughour model is robust enough to model parallel applications and theirbehavior, it can also be configured to model loosely related threadsof commercial applications by making the ‘percent shared‘ knob tobe very low.
The branch predictability of the benchmark can be captured inde-pendent of the microarchitecture by using the branch transition rate[23]. The branch transition rate captures the information about howquickly a branch transitions between taken and not-taken paths. Abranch with a lower transition rate is easier to predict as it sidestowards taken or not-taken for a given period of time and rathera branch with a higher transition rate is harder to predict. First,the branches that have very low transition rates, can be generatedas always taken or always not taken as they are easily predictable.The rest of the branches in the synthetic need to match the speci-fied distribution of transition rate, which is further explained in thenext Subsection. We provide a brief description about each of thedifferent knobs of our workload generator:
1. Number of threads: The number of threads knob controlsthe amount of thread level parallelism of the synthetic work-load. This varies from only one thread up to 32 threads exe-cuting in parallel.
2. Thread class and processor assignment: This knob con-

trols the thread classes to which each thread gets assigned.Up to 12 patterns are used to model the combinations of theseassignments. These combinations also include various per-mutations in terms of how far/near the threads of same/differentclasses are placed based on the assignment to the processorson which they are bound to execute.
3. Percent memory accesses to shared data: This knob con-trols what proportion of memory accesses are to the shareddata and the rest of the memory accesses are directed to pri-vate data. This knob can be configured separately for eachthread class to allow the sharing percentage to be heteroge-neous across thread classes. This heterogeneity may help thethreads to be configured to differently stress the private andshared caches.
4. Shared memory access stride values: As mentioned earlier,two bins of stride values are specified for the shared memoryaccesses and every such memory access can be configuredto have any one of the two bins with equal probability. Thisknob can also be configured separately for each of the differ-ent threads, to be able to allow each one of them to uniquelystress differ levels in the memory hierarchy.
5. Coupled load-stores: When this knob is set to true, an effortis made to couple a load with a following store to be ableto mimic a migratory sharing pattern of access. This migra-tory sharing pattern can create huge amounts of traffic whencoherence protocols like MESI is used where there is not aspecific state for a thread to own the data.
6. Private memory access stride values: Similar to the stridevalues to the shared memory, two bins of stride values arespecified for the private memory accesses and every suchmemory access can be configured to have the stride from anyone of the two bins with equal probability. This knob canalso be configured separately for each thread class to be ableto stress different levels of the memory hierarchy separately.
7. Working set size: This knob controls the working set sizeof the synthetic. The correspondence of this knob to the realimplementation in terms of number of iterations of one ofthe nested loops in the synthetic will be explained in detailin the next Subsection. This knob can be configured sepa-rately for different thread classes to be able to allow variouscache resource sharing patterns in terms of varying workingset sizes.
8. Memory Level Parallelism (MLP): This knob controls theamount of Memory Level Parallelism (MLP) in the work-load, which is defined as the number of memory operationsthat can happen in parallel and is typically used to refer tothe number of outstanding cache misses at the last level ofthe cache. The number of memory operations that can occurin parallel is controlled by introducing dependency betweenmemory operations. This knob can also be configured sep-arately for every thread class to enable the threads to havevarious access patterns to the DRAM.
9. MLP frequency: Though the MLP knob controls the bursti-ness of the memory accesses, we need one more knob to con-trol how frequently these bursty behaviors happen.
10. Average basic block size: This refers to the average numberof instructions in a basic block in the generated embeddedassembly based synthetic code. This knob is specified to behomogeneous across different thread classes.
11. Branch predictability: The branch predictability of a work-load is an important characteristic that also affects the overallthroughput of the pipeline. When a branch is mispredicted,the pipeline has to be flushed and this results in a reducedactivity in the pipeline.
12. Instruction mix: The Instruction mix is decided based onthe proportions of each of the instruction types INT ALU,INT MUL, INT DIV, FP ADD, FP MUL, FP DIV, FP MOVand FP SQRT. The GA can configure each of these weightsassociated with the instruction types to be anything betweenzero to four, controlling the proportion of each instructiontype. Some restrictions are placed on the instruction mix bywriting rules in the GA like a minimum number of INT ALUinstructions should be present if there are any memory opera-tions in the code to be able to perform the address calculationfor these memory operations.
13. Register dependency distance: This knob refers to the av-erage number of instructions between the producer and con-sumer instruction for a register data. If the register depen-dency distance is high, the Instruction Level Parallelism (ILP)in the synthetic is high resulting in a high activity factor inthe pipeline of the core. But, if the register dependency dis-tance is low, the out-of-order circuitry like the ROB and otherbuffers may have higher occupancy resulting in a higher ac-tivity factor in these parts of the core. This knob is required tobe configured separately for different thread classes, as dif-ferent threads having different memory latencies may needto have different amounts of ILP to maximize the power con-sumption in the cores.
14. Random seed: This knob controls the random seed that isused as an input to the statistical code generator, which willgenerate different code for the same values for all the otherknobs. It mostly affects the alignment of the code or the orderin which the instructions are arranged. This order of instruc-tions does have some impact on maximizing the power andwe include this knob also to be explored by the GA in thesearch for a power virus.
2.3 Code GenerationIn this Section we explain how the final code generation happens
based on the knob settings given in terms of the abstract work-load parameters. Figure 4 shows an overview of code generation.The generated code consists of the main function and a functionfor each thread that is spawned from the main function using thepthread_create() system call. The required amount of shared datais declared and allocated in the main function as a set of inte-ger/floating point arrays and the pointers to these arrays are avail-able to each of the threads. The private data that is supposed to beused by every thread is declared and allocated within the functionfor each thread. Each of the threads also bind themselves with theprocessor number specified when the code was generated based onthe thread class and processor assignment knob. We use a barriersynchronization to synchronize all the threads after they finish theirrespective system calls for allocating their private data arrays andbinding themselves to the assigned processor.
The body of each thread consists of two inner loops filled withembedded assembly and one outer loop encompassing these innerloops. As previously mentioned, our memory model is a stridebased access model, where the loads and stores in the generatedsynthetic access the elements of the private/shared arrays, eachstatic load/store with a constant stride. The address calculation for

a,fm,a,m,m,ld,ld,ld ,a,a,a,Br
a,fm,a,m,m,ld,ld,ld ,a,a,a,Br
a,fm,a,m,m,ld,ld,ld ,a,a,a,Br
a,fm,a,m,m,ld,ld,ld ,a,a,a,Bra,fm,a,m,m,ld,ld,ld ,a,a,a,Br
a,fm,a,m,m,ld,ld,ld ,a,a,a,Br
a,fm,a,m,m,ld,ld,ld ,a,a,a,Br
a,fm,a,m,m,ld,ld,ld ,a,a,a,Br
a,fa,m,m,a, ld,st ,Br
m,m,ld ,a,a,Br
m,m,ld ,a,a,Bra,x,ld,ld,ld ,s,s,Br
a,x,ld,ld,ld ,s,s,Br
a,fa,a,a,a, ld,st ,Br
a,fa,a,a,a, ld,st ,Br
InnerLoop 1
InnerLoop 2
Outer Loop
Array 1
Array nArray 3Array 2
............
BRANCHES
a,fa,m,m,a, ld,st ,BrCONDITI
ONAL
DEPENDENCY
pthread_barrier_t barr;void** shared_array_ptrs;main_function(){ shared_array_ptrs = allocate_arrays(sizes[]); //Barrier synchronization init_barrier(barr, number_of_threads); for every thread i in N; do create_pthread(thr_function_i); done join_pthreads (num_threads);}
void thr_function_i(){ private_array_ptrs = allocate_arrays(sizes[]); processor_bind(My_threadID, prscr_number);
pthread_barrier_wait(&barr);
while(out_cntr <= loop_count) { out_cntr++;
/*....EMBEDDED... ....ASSEMBLY... ..INNER LOOPS..*/
Reset_array_pointers(); } }
:
Figure 4: Multithreaded synthetic workload generation
the next access of each load/store is done by using other ALU in-structions in the generated code for each of the array pointers byusing the assigned stride value. When the specified working setsize is covered, the pointers that are used are reset to the begin-ning of the array. This pointer reset is done outside the inner loopsand inside the encompassing outer loop enabling us to control theworking set size with the number of iterations of the inner loop andthe number of dynamic instructions with the number of iterationsof the outer loop. The embedded assembly contents of the two in-ner loops are the same if the MLP frequency knob is set to high.If the MLP frequency knob is set to low, the memory operationsin the second loop are removed so that the bursty memory accessbehavior happening in the first loop occurs at a lower frequency.
The required branch predictability or the control flow behavior inthe synthetic is achieved by grouping branches into pools with eachpool assigned to a condition register. The branches are taken/nottaken based on whether this assigned condition register is set or not.This condition register is set/unset by using a modulo operationon the control variable of the loop. The only information that isrequired to generate the main function is the biggest shared datafootprint amongst the different threads to be able to allocate theshared arrays. The following steps are followed to generate thecode for every thread based on the corresponding knob settings foreach:
1. Generate the code to allocate the required amount of spacefor private data accesses based on the percent shared ac-cesses, proportion of memory operations in instruction mixand the working set size.
2. Generate the processor_bind() system call using the assignedprocessor number and then a barrier synchronization systemcall is generated.
3. Generate the code for outer-loop based on the dynamic num-ber of instructions desired taking into account the averagebasic block size and the number of basic blocks.
4. Fix the code spine for the first inner loop based on a fixed
number of basic blocks and the average basic block size knob.
5. For each of the basic block in the first inner loop, config-ure the instruction type of each instruction by stochasticallychoosing from the instruction mix information. If the cou-pled load-stores is true, the instructions are swapped basedon a bubble sort fashion in such a way that a store is made tofollow a load and they are made to access the same address.
6. The number of branch groups and the modulo operation arefixed based on the required average branch predictability.The modulo operation for each of the branch groups are gen-erated at the beginning of the inner loop based on the loopcount and a register is set/unset to decide if those branchesfor this particular group are going to be taken or not taken forthis loop iteration. Branches are generated to fall through ortake the target to another basic block based on their assignedregister value.
7. Using the average dependency distance knob, each of theoperands of every instruction is assigned with a previous pro-ducer instruction. Some rules are used to check the compat-ibility between producer and the consumer in terms of thedata that is produced by the producer instruction and thatconsumed by the consumer. If two instructions are found tobe not compatible, the dependency distance is incrementedor decremented until a matching producer is found for ev-ery instruction. The memory level parallelism information isalso used to assign load-load dependencies in this process.
8. Based on the percent shared accesses knob, each of the mem-ory operations are classified into the ones that access shareddata and the ones that access private data. Based on the stridevalue of the corresponding memory operation (shared or pri-vate and based on the assigned bin), their corresponding ad-dress calculation instructions are given the stride values asimmediate operands.
9. Register assignment happens by first assigning the destina-tion registers in a round robin fashion. The source register

!"##$%&'$%()*+&*,&-.$&-"/#$0&&1"%"2$-$%& 34(-$2&5&6& 34(-$2&5&66& 34(-$2&5&666&7*8&*,&9*%$(& :& ;& <=&>?@A& :&BC& ;&BC& <=&BC&
D<&9"9.$& =:&ECF&:&G"4F&&H&949#$(&
IH&ECF&:&G"4F&&<&949#$&
<=&ECF&H&G"4F&&<&949#$&
DH&9"9.$& :&ACF&:&G"4F&:&/"+J(&
:&ACF&;&G"4F&;&/"+J(&
;&ACF&<=&G"4F&&<=&/"+J(&
D<F&DH&A3K?(& :;& IH& H:&?LC& <H;& =:& IH&A"9.MG)N-.& ;& :& H&C%"+9.&O%$N8& P@B3F&<H&/)-&1K!& P@B3F&<<&/)-&1K!& P@B3F&<Q&/)-&1K!&C!C&()R$& <QH:& S<H& HS=&6+-&@DT(& &:&@DTF&H&6+-&N)'& &I&@DTF&<&6+-&N)'& &H&@DTF&<&6+-&N)'&&
!*O*#*U4& V%*((/"%& K)$%"%9.)9"#&(G)-9.& W)#$M(O$9),)$N&
W1&@DT(& H&@DTF&H&AX#F&&H&N)'&
H&@DTF&<&AX#F&&<&N)'&
<&@DTF&<&AX#F&&<&N)'&
&&Y)N$%&'$%()*+&*,&-.$&-"/#$0&&&
!"#"$%&%#' ()*&%$'+',' ()*&%$'+',,' ()*&%$'+',,,'7*8&*,&9*%$(& :& ;& <=&>?@A& :&BC& ;&BC& <=&BC&D<&9"9.$& =:&ECF&:&G"4F&H&949#$(& IH&ECF&:&G"4F&<&949#$& <=&ECF&H&G"4F&<&949#$&DH&9"9.$& :&ACF&:&G"4F&:&/"+J(& :&ACF&;&G"4F&;&/"+J(& ;&ACF&<=&G"4F&<=&/"+J(&D<F&DH&A3K?(& :;& IH& H:&?LC& <H;& =:& IH&A"9.MG)N-.& ;& :& H&C%"+9.&O%$N8& P@B3F&<H&/)-&1K!& P@B3F&<<&/)-&1K!& P@B3F&<Q&/)-&1K!&C!C&()R$& <QH:& S<H& HS=&6+-&@DT(& &:&@DTF&H&6+-&N)'& &I&@DTF&<&6+-&N)'& &H&@DTF&<&6+-&N)'&&!*O*#*U4& V%*((/"%& K)$%"%9.)9"#&(G)-9.& W)#$M(O$9),)$N&W1&@DT(& H&@DTF&H&AX#F&H&N)'& H&@DTF&<&AX#F&<&N)'& <&@DTF&<&AX#F&<&N)'&
&& (a)
GEMS CROSSBAR GEMS FILE-SPECIFIEDGEMS HIERARCHICAL SWITCHL1
L2
DRAM
(b)
Figure 5: (a) Multicore system configurations used to evaluate MAMPO (b) Interconnection networks used in the multicore systemconfigurations
for each operand of an instruction is assigned as the destina-tion register of the producer instruction based on the corre-sponding dependency assignment.
10. The loop counters for the inner loops are set based on thespecified working set size and the compare instructions forloop termination are generated by choosing an integer ALUinstruction in the code.
11. The second inner loop is also generated, which is a copy ofthe first loop without the memory operations if the MLP fre-quency is low or if it is set to be high, the second loop isgenerated just as a copy of the first loop.
3. EXPERIMENTAL SETUP, RESULTS ANDANALYSIS
To test the efficacy of this power virus generation framework,we use the Virtutech Simics full system simulator along with Wis-consin Multifacet GEMS [24] to evaluate the power consumptionof the multithreaded synthetic workloads for the SPARC ISA usingSolaris 10 operating system. The cycle accurate out-of-order pro-cessor simulator Opal, the detailed memory simulator Ruby andthe network simulator Garnet, all of which are a part of GEMS wasused to model a typical Chip-MultiProcessor (CMP). The powerconsumption in the core is evaluated using the power models pro-vided by Wattch [25] for the most aggressive clock gating ’cc3’ inWattch. The power consumption of the shared L2 cache and the di-rectory is modeled with help of the latest power models for cachesusing CACTI [26].
The power consumption of the network was evaluated using thenetwork power model Orion [27]. The power consumption of DRAMfor DDR2 technology was modeled by integrating the DRAMsimsimulator [28] into GEMS. The power models used for all the com-ponents of the CMP are for a 90nm technology. It is to be notedthat this power virus generation methodology aims to help a system
designer in the pre-silicon design stage of a system, when only thesimulators will be available than real hardware. We have used theGNU gcc compiler for SPARC ISA with the optimization level ofO2 for compiling the synthetics and an optimization level of O3 forcompiling other workloads.
The Figure 5(a) shows the three multicore system configurationsthat are used to evaluate the efficacy of MAMPO. Figure 5(b) showsthe various interconnection networks used in these multicore sys-tems. We use the most popular MOESI cache coherence proto-col for all our experiments, which has the states Modified, Owned,Exclusive, Shared and Invalid for every cache block. We use amultibanked shared L2 cache and a Non-Uniform Memory Accessprotocol with a directory size of 1 MB. Our power models werevalidated against published power numbers for the Sun Microsys-tem’s Niagara and the Rock systems by constructing an equivalentsystem using our infrastructure. For the machine learning, we useIBM’s Genetic Algorithm toolset called SNAP [29] [8]. We haveused a mutation rate of 0.05, crossover rate of 0.85 and a reproduc-tion rate of 0.10. A population size of 48 individuals per generationwas found to be the most optimal deme size for this problem. In-creasing it beyond 48 does not help as the execution time of eachgeneration becomes high due to the increased number of chromo-somes to evaluate and when the deme size is smaller than 48, thepopulation size is not big enough to search such a large abstractworkload space in the same time.
We compare the power consumption of the generated MAMPOvirus with that of the power consumption of the PARSEC work-loads. In the multithreaded synthetic, we use a feature called MAGICinstruction in Simics to be able to perform detailed simulation foronly the core part of the synthetic code. We start the detailed sim-ulation after all the threads have reached the barrier after the ini-tial memory allocation and processor bind system calls. The firstthread that reaches the end of it’s execution signals Simics to stopthe simulation and the profiled data is used to calculate the powerconsumption using the power models. Typically the number of dy-

!"
#!"
$!!"
$#!"
%!!"
%#!"
&!!"
&#!"
$" %" &" '" #" (" )" *" +" $!"$$"$%"$&"$'"$#"$("$)"$*"$+"%!"%$"%%"%&"%'"%#"%("%)"%*"%+"&!"&$"
!"#$%&'('#)*&+",)-&./
$0'1&
2)3)-$4"3'&
$(,-./0"
*,-./0"
',-./0"
(a)
35
40
45
50
55
60
65
70
75
80
blackscholes
bodytrack
facesim
ferret
freqmine
raytrace
swap=ons
fluidanim
ate
vips
canneal
dedup
streamcluster
x264
PARSEC average
SPECjbb
SYMPO
MPrime
MAM
PO
Total system pow
er (W
a0s)
Workloads and MAMPO virus
(b)
60
70
80
90
100
110
120
130
blackscholes
bodytrack
ferret
freqmine
raytrace
swap>ons
fluidanim
ate
vips
canneal
dedup
streamcluster
x264
facesim
average
SPECjbb
SYMP
O
MPrim
e
MAMP
O
Total system pow
er (W
a0s)
Workloads and MAMPO virus
(c)
100
125
150
175
200
225
250
275
300
325
blackscholes
bodytrack
ferret
freqmine
raytrace
swap<ons
fluidanim
ate
vips
canneal
dedup
streamcluster
x264
facesim
average
SPECjbb
SYMP
O
Mprim
e
MAMP
O
Total system pow
er (W
a0s)
Workloads and MAMPO virus
(d)
Figure 6: MAMPO virus generation for various system configurations (a) Power consumption of the best power virus at the end ofeach generation (b) Power for final virus for Machine configuration - I (c) Power for final virus for Machine configuration - II (d)Power for final virus for Machine configuration - III
namic instructions in the multithreaded synthetic is around a fewmillion instructions per thread. For PARSEC workloads, we usethe input set provided for detailed microarchitectural simulationscalled ’simsmall’.
Figure 6(a) shows the power consumption of the best power virusat the end of each generation for approximately 30 generations, af-ter which there is negligible increase in power consumption dueto the convergence of the GA. It is to be noted that there are notany known power viruses targeting multicores and so we compareour generated viruses against running multiple copies of single-core power viruses. MPrime [11], which is popularly called thetorture test is one of the system-level industry grade power virusesfor single-core systems. SYMPO [8] is the most recent previouswork by Ganesan et. al to generate a max-power virus for a givensingle-core system. We have implemented the SYMPO frameworkto enable us to generate SYMPO viruses for each of our config-urations and compare the overall power consumption of runningmultiple copies of SYMPO viruses, one on each core, with thatof MAMPO viruses. Other than these power viruses, we also com-pare out power viruses with that of the commercial Java benchmarkSPECjbb. The number of threads in SPECjbb was set to be equalto the number of processors in the system configuration. Figures6(b), 6(c) and 6(d) show the comparison of the power consump-tion of MAMPO viruses with that of the power consumption of theworkloads in the PARSEC benchmark suite, MPrime, SYMPO andthat of SPECjbb for the three machine configurations as in Figure5(a). It can be noted that the MAMPO viruses consume 45%, 52%and 98% more power than the average power consumption of theworkloads in the PARSEC suite. The MAMPO viruses consume63%, 72% and 89% more power than that of MPrime and 40%,49% and 69% more power than that of the SYMPO virus for thethree machine configurations respectively, clearly bringing out theimportance of such a multithreaded synthetic power virus gener-ation framework compared to running multiple single-core powerviruses. The MAMPO viruses consume 41%, 48% and 56% more
power than that of the SPECjbb. From these results, it can be ob-served that the MAMPO virus outperforms the other workloads asthe number of cores increases due to the reason that MAMPO isvery effective in stressing the interconnection network. It is to benoted that the energy spent in terms of data transfer through the in-terconnection network is predicted to increase many folds [30] dueto global wire scaling problems compared to the energy spent incomputation bringing out the significance of their contribution tothe power consumption of future systems.
Since the fitness evaluation of the individuals in a generation isindependent of each other, they can be run in parallel. Thus, whenwe use a modern parallel system with many cores, this process offinding a power virus can be done with a good amount of paral-lelism resulting in a quicker convergence of the GA. The time takenfor MAMPO to generate these power viruses for the three systemconfigurations range between 8 to 12 hours on a 3.4 GHz Intel Xeonsystem with 16 cores. Though we use a full system simulator withcycle accurate models to evaluate the power consumption, the to-tal number of dynamic instructions in the synthetic is restricted tobe less than 16 million instructions, to enable this search happenwithin a reasonable time frame. Rather, to find the same virus man-ually, a system architect will have to typically spend a few weeksof manpower and can still not be sure if it is a good power virus ornot.
The power viruses generated for each of these configurations arefound to be having exactly the same number of threads as that ofthe number of processors. For example, a four-threaded workloadis found to be a more suitable candidate for a quad-core system thanan eight or sixteen threaded workload. This can be attributed to thefact that the time taken for even a DRAM access in our frameworkis not enough to force a context switch in the thread scheduler usedin Solaris 10. But, a knob like number of threads may be utilizedmore effectively when a hard disk access is also modeled, wherethe access latency could force the scheduler to do a context switch.We do not model the components like the chipset and the disk sub-

0
10
20
30
40
50
60
70
80
90
MPrime SPECjbb SYMPO MAMPO
Total system pow
er (W
a0s)
(a)
0
20
40
60
80
100
120
140
MPrime SPECjbb SYMPO MAMPO
Total system pow
er (W
a0s)
(b)
0
50
100
150
200
250
300
350
MPrime SPECjbb SYMPO MAMPO
Total system pow
er (W
a0s) Dir_power
ICN_power
L2_power
DRAM_power
CPU_power
(c)
Figure 7: Breakdown of MAMPO virus and comparison to MPrime (a) Machine configuration - I (b) Machine configuration - II (c)Machine configuration - III
system in this study due to the reason that they have nearly constantpower consumption over various range of workloads [31].
It would be interesting to see how the characteristics of the fi-nally generated power viruses vary across the different system con-figurations. Figures 7(a), 7(b) and 7(c) show the breakdown of thepower consumption of the MAMPO viruses, SYMPO, MPrime andSPECjbb in various parts of the system. It can be noted that thesingle-core power viruses SYMPO and MPrime consume maxi-mum power in the cores, rather the MAMPO viruses stress differentparts of the system in such a way that the total power is maximized.Some common characteristics of these power viruses are that theyhave 10-20% of the memory accesses to shared data and they tryto move as much data as possible through the interconnection net-work, besides making sure that the slowdown caused to the CPUsdue to this is minimum. The maximum power achieved by our toolis still ‘realistically attainable‘ as the characteristics of the powerviruses still map to the range for the abstract workload model pa-rameters of realistic workloads. It is to be noted that the powerviruses for each of these systems configurations have different set-tings for most of the knobs other than the aforementioned ones andit is wasteful to analyze this further due to their sensitivity to the mi-croarchitecture changes and the aim of this whole machine learningbased framework is to make this power virus generation a com-pletely automated black-box approach to avoid the need to modelthe complex interactions involved in the execution of a workloadwithin a multicore system.
4. RELATED WORKSynthetic benchmark generation: Synthesizing workloads/traces
[32] [33] [34] [35] for performance evaluation has always been anarea that has been constantly under investigation. Usage of syn-thetic benchmarks as miniaturized proxies [15] [17] [16] for longrunning applications has been proven to be a viable solution to usewith very slow cycle accurate and Register Transfer Level (RTL)simulators in pre-silicon design validation. Joshi et al [14] [13] in-troduced the idea of using synthetic benchmarks for cloning propri-etary applications that cannot be shared with the processor vendors.Though there has been quite some work targeting the characteriza-tion of parallel applications [36], this is the first attempt towardssynthesizing multithreaded workloads.
State of the art power viruses: There have been a lot of in-dustry efforts [37] [38] [39] [40] [41] towards hand crafting codesnippets to serve as power viruses for the single core processors.Stability testing tools written for overclockers like CPUBurnin [5]and CPUBurn [6] are also popular power viruses. The programMPrime [11], which searches for mersenne prime number is popu-larly called the torture test and is a well known power virus used in
the industry. Joshi et. al [9] and Ganesan et al [8] automated powervirus generation for single cores.
5. CONCLUSIONIn this paper, we proposed the usage of MAMPO, which is a
multithreaded synthetic power virus generation framework target-ing multicore processors. We validate the efficacy of MAMPO bycomparing the power consumption of the generated virus with thatof the workloads in PARSEC for three different multicore systemconfigurations and show that the MAMPO virus consumes 45%,52% and 98% more power than the average power consumption ofthe PARSEC workloads. We also show that the single core powerviruses, when run on muticore systems do not serve the purpose asa multicore system virus by comparing the power consumption ofthe MAMPO virus with that of the previously proposed SYMPOviruses and the well known power virus MPrime. The MAMPOvirus consumes 40% to 89% more power than running multiplecopies of single-core viruses in parallel. We also provide a com-parison of the power consumption of the MAMPO virus with thatof SPECjbb and show that the MAMPO virus consumes 41%, 48%and 56% more power than that of SPECjbb. Though the powerviruses generated by MAMPO cannot theoretically guarantee to bethe absolute worst-case, based on the convergence of the GeneticAlgorithm run with multiple seeds, we can be sure that the gener-ated power viruses will serve as a tight upper-bound for the max-imum power for all practical purposes and such a framework willbe a very useful tool for the system designers.
6. ACKNOWLEDGMENTSThis work has been supported and partially funded by SRC under
Task ID 1797.001, National Science Foundation under grant num-bers 0702694, 0751112, 0750847, 0750851, 0750852, 0750860,0750868, 0750884 and 0751091, Lockheed Martin, Sun Microsys-tems and IBM. Any opinions, findings, conclusions or recommen-dations expressed in this material are those of the authors and donot necessarily reflect the views of the National Science Foundationor other sponsors.
7. REFERENCES[1] Stuart Berke, David Moss, and Randy Randall.
Understanding the challenges of delivering cost-effective,high- efficiency power supplies.http://www.dell.com/downloads/global/power/ps2q07-20070270-PowerTCO.pdf, May2007.

[2] Xiao Ping Wu, Masataka Mochizuki, Koichi Mashiko,Thang Nguyen, Vijit Wuttijumnong, Gerald Cabsao, andAliakbar Akbarzadeh Randeep Singh. Energy conservationapproach for data center cooling using heat pipe based coldenergy storage system. 26th Annual IEEE SemiconductorThermal Measurement and Management Symposium, 2010.SEMI-THERM 2010 Page(s): 115 - 122, March 2010.
[3] Michael K Patterson. The Effect of Data Center Temperatureon Energy Efficiency. 11th Intersociety Conference onThermal and Thermomechanical Phenomena in ElectronicSystems, 2008. ITHERM 2008 Page(s): 1167 - 1174, May2008.
[4] Amip Shah, Chandrakant Patel, Cullen Bash, RatneshSharma, and Rocky Shih. Impact of rack-level compactionon the data center cooling ensemble. 11th IntersocietyConference on Thermal and Thermomechanical Phenomenain Electronic Systems, 2008. ITHERM 2008 Page(s): 1175 -1182, May 2008.
[5] http://www.softpedia.com/get/System/Benchmarks/CPU-Burnin.shtml.
[6] http://pages.sbcglobal.net/redelm.[7] Private Communication with Advanced Micro Devices
(AMD) Design Engineer.[8] Karthik Ganesan, Jungho Jo, W. Lloyd Bircher, Dimitris
Kaseridis, Zhibin Yu, and Lizy K. John. System-level MaxPower (SYMPO) - A systematic approach for escalatingsystem-level power consumption using syntheticbenchmarks. In the 19th International Conference onParallel Architectures and Compilation Techniques (PACT),Vienna, Austria, September 2010.
[9] Ajay Joshi, Lieven Eeckhout, Lizy K. John, and Ciji Isen.Automated microprocessor stressmark generation. The 14thInternational Symposium on High Performance ComputerArchitecture (HPCA), February 2008.
[10] Christian Bienia, Sanjeev Kumar, Jaswinder Pal Singh, andKai Li. The PARSEC Benchmark Suite: Characterizationand Architectural Implications. Proceedings of the 17thInternational Conference on Parallel Architectures andCompilation Techniques, October 2008.
[11] http://www.mersenne.org/freesoft.[12] L D Davis and Melanie Mitchel. Handbook of genetic
algorithms. Van Nostrand Reinhold, 1991.[13] Ajay Joshi, Lieven Eeckhout, Robert H. Bell Jr., and Lizy K.
John. Performance Cloning: A Technique for DisseminatingProprietary Applications as Benchmarks. InternationalSymposium on Workload Characterization, October 2006.
[14] Ajay Joshi, Lieven Eeckhout, Jr. Robert H. Bell, and Lizy K.John. Distilling the essence of proprietary workloads intominiature benchmarks. ACM Transactions on Architectureand Code Optimization (TACO 2008), August 2008.
[15] Karthik Ganesan, Jungho Jo, and Lizy K John. SynthesizingMemory-Level Parallelism Aware Miniature Clones forSPEC CPU2006 and ImplantBench Workloads. InternationalSymposium on Performance Analysis of Systems andSoftware (ISPASS), March 2010.
[16] Robert H Bell and Lizy K John. Improved Automatic TestCase Synthesis For Performance Model Validation.Proceedings of the International Conference onSupercomputing 111-120, 2005.
[17] Jr Robert H. Bell, Rajiv R. Bhatia, Lizy K. John, JeffStuecheli, John Griswell, Paul Tu, Louis Capps, AntonBlanchard, and Ravel Thai. Automatic Testcase Synthesis
and Performance Model Validation for High PerformancePowerPC Processors. IEEE International Symposium onPerformance Analysis of Systems and Software (ISPASS2006), March 2006.
[18] Nick Barrow-Williams, Christian Fensch, and Simon Moore.A communication Characterization of Splash-2 and Parsec.IEEE International Symposium on WorkloadCharacterization, October 2009.
[19] Michael C. Huang Hemayet Hossain, Sandhya Dwarkadas.Improving support for Locality and fine-grain sharing in chipmultiprocessors. Proceedings of the 17th internationalconference on Parallel architectures and compilationtechniques, October 2008.
[20] Liqun Cheng, John B. Carter, and Donglai Dai. An AdaptiveCache Coherence Protocol Optimized forProducer-Consumer Sharing. IEEE 13th InternationalSymposium on High Performance Computer Architecture,2007. HPCA 2007, February 2007.
[21] Umakishore Ramachandran, Gautam Shah, AnandSivasubramaniam, Aman Singla, and Ivan Yanasak.Architectural Mechanisms for Explicit Communication inShared Memory Multiprocessors. Proceedings of theIEEE/ACM Supercomputing Conference, 1995.
[22] Guhan Viswanathan and James R. Larus. Compiler-directedShared-Memory Communication for Iterative ParallelApplications. Proceedings of the ACM/IEEE Conference onSupercomputing, 1996.
[23] Haungs M, Sallee P, and Farrens M. Branch transition rate: anew metric for improved branchclassification analysis. SixthInternational Symposium on High-Performance ComputerArchitecture (HPCA 2000), Volume , Issue , 2000Page(s):241 - 25, January 2000.
[24] Milo M.K. Martin, Daniel J. Sorin, Bradford M. Beckmann,Michael R. Marty, Min Xu, Alaa R. Alameldeen, Kevin E.Moore, Mark D. Hill, , and David A. Wood. Multifacet’sGeneral Execution-driven Multiprocessor Simulator (GEMS)Toolset. Computer Architecture News (CAN),, September2005.
[25] Margaret Martonosi, Vivek Tiwari, and David Brooks.Wattch: A Framework for Architectural-Level PowerAnalysis and Optimizations. isca, pp.83, 27th AnnualInternational Symposium on Computer Architecture (ISCA2000).
[26] Naveen Muralimanohar, Rajeev Balasubramonian, andNorman P. Jouppi. Optimizing NUCA Organizations andWiring Alternatives for Large Caches With CACTI 6.0. Proc.40th Annual IEEE/ACM IntâAZl Symp. on Microarchitecture(MICRO 07), IEEE CS Press pp. 3-14., December 2007.
[27] Hangsheng Wang, Xinping Zhu, Li-Shiuan Peh, and SharadMalik. Orion: A Power-Performance Simulator forInterconnection Networks. In Proceedings of MICRO 35,Istanbul, Turkey, November 2002.
[28] David Wang, Brinda Ganesh, Nuengwong Tuaycharoen,Katie Baynes, Aamer Jaleel, and Bruce Jacob. DRAMsim: Amemory-system simulator. Computer Arch. News, vol. 33,no. 4, pp. 100-107, Sep 2005.
[29] Sameh Sharkawi, Don Desota, Raj P, Rajeev Indukuru,Stephen Stevens, and Valerie Taylor. Performance Projectionof HPC Applications Using SPEC CFP2006 Benchmarks.IEEE International Parallel & Distributed Processing Symp.,May 2009.
[30] Michele Petracca, Benjamin G. Lee, Keren Bergman, and

Luca P. Carloni. Design Exploration of OpticalInterconnection Networks for Chip Multiprocessors. 16thIEEE Symposium on High Performance Interconnects pages:31 - 40, September 2008.
[31] W. Lloyd Bircher and Lizy K.John. Complete System PowerEstimation: A Trickle-Down Approach Based onPerformance Events. International Symposium onPerformance Analysis of Systems and Software, April 2007.
[32] Cheng-Ta Hsieh and M. Pedram. Microprocessor powerestimation using profile-driven program synthesis. IEEETransactions on Computer-Aided Design of IntegratedCircuits and Systems,, November 1998.
[33] Wing Shing Wong and Robert J. T. Morris. BenchmarkSynthesis Using the LRU Cache Hit Function. IEEETransactions on Computers, 1988.
[34] E.S. Sorenson and J.K. Flanagan. Evaluating synthetic tracemodels using locality surfaces. 2002. WWC-5. 2002 IEEEInternational Workshop on Workload Characterization,November 2002.
[35] Lizy John, Jungho Jo, and Karthik Ganesan. WorkloadSynthesis for a Communications SoC. In Workshop on SoCArchitecture, Accelerators and Workloads, held inconjunction with HPCA-17, San Antonio, Texas, Feb 2011.
[36] Karthik Ganesan, Lizy K John, James Sexton, and ValentinaSalapura. A Performance Counter Based WorkloadCharacterization on BlueGene/P. In 37th InternationalConference on Parallel Processing (ICPP), Portland,Oregon, September 2008.
[37] W. Felter and T. Keller. Power measurement on the applepower mac g5. IBM Tech Report RC23276, 2004.
[38] M. Gowan, L. Biro, and D. Jackson. Power considerations inthe design of the alpha 21264 microprocessor. DesignAutomation Conference, 1998.
[39] R. Vishwanath, V. Wakharkar, A. Watwe, and V.Lebonheur.Thermal performance challenges from silicon to systems.Intel Technology Journal, 2000.
[40] R. Joseph, D. Brooks, and M. Martonosi. Control techniquesto eliminate voltage emergencies in high performanceprocessors. High Performance Computer Architectures,2003.
[41] F. Najm, S. Goel, and I. Hajj. Power estimation in sequentialcircuits. Design Automation Conference, 1995.