
Maximize Warehouse Management Systems with Process · PDF fileWMS Terminology Wave –...
37
WMS Maximize Warehouse Management Systems with Process Mining Technology
-
Upload
phungtuyen -
Category
Documents
-
view
216 -
download
3
Transcript of Maximize Warehouse Management Systems with Process · PDF fileWMS Terminology Wave –...

WMS
Maximize Warehouse Management Systems with Process Mining Technology

Warehouse Management System
Ordering & Receiving Goods to the Warehouse
Operational & Business Rules
Document Creation
Inventory Control & Quality
Assurance
WMS
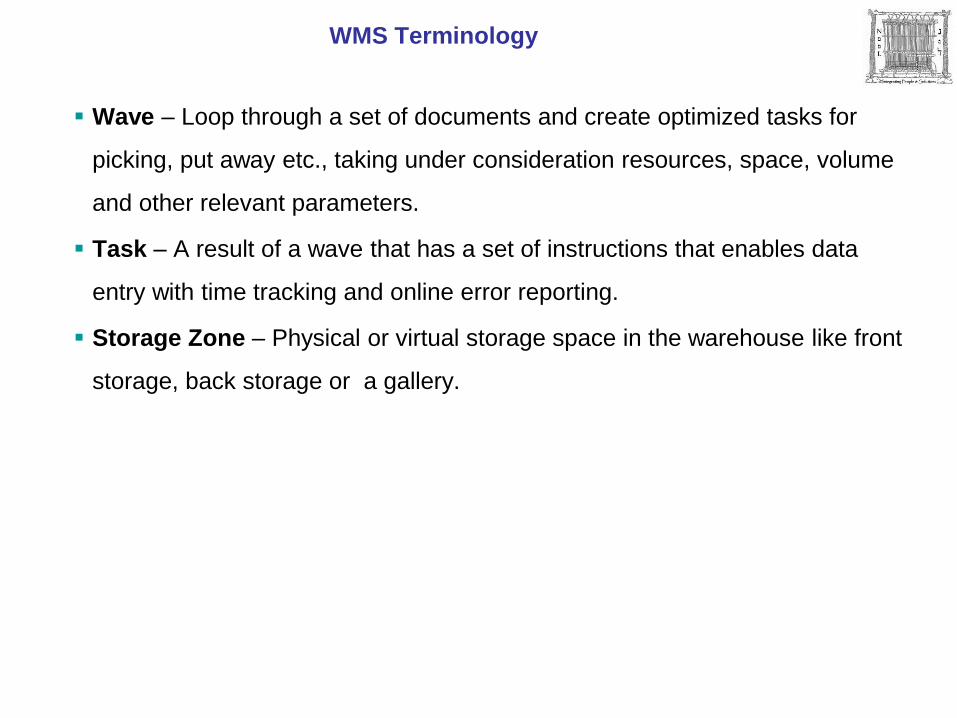
WMS Terminology
Wave – Loop through a set of documents and create optimized tasks for
picking, put away etc., taking under consideration resources, space, volume
and other relevant parameters.
Task – A result of a wave that has a set of instructions that enables data
entry with time tracking and online error reporting.
Storage Zone – Physical or virtual storage space in the warehouse like front
storage, back storage or a gallery.

Warehouse Definitions (in Priority ERP)


Automation
• Real-time reporting on data
• Verification via barcode scanning
• Significant reduction on need to
work with paper
• Eliminates need for data entry
• Eliminates need for quality control
of picking
• Eliminates needs to rely on
memory and personal knowledge
of warehouse personnel
Optimization
• Task Consolidation
• Consolidating orders into one
picking
• Performing a number of
actions in one task
• Task Interleaving - mixing tasks to
reduce travel time, e.g. sending a forklift
driver to put away a pallet on his way to his
next pick
• Inventory Reserve
• Inventory replenishment by level or
orders
• Storage Optimization
Advantages of WMS

So now… how does WMS work?
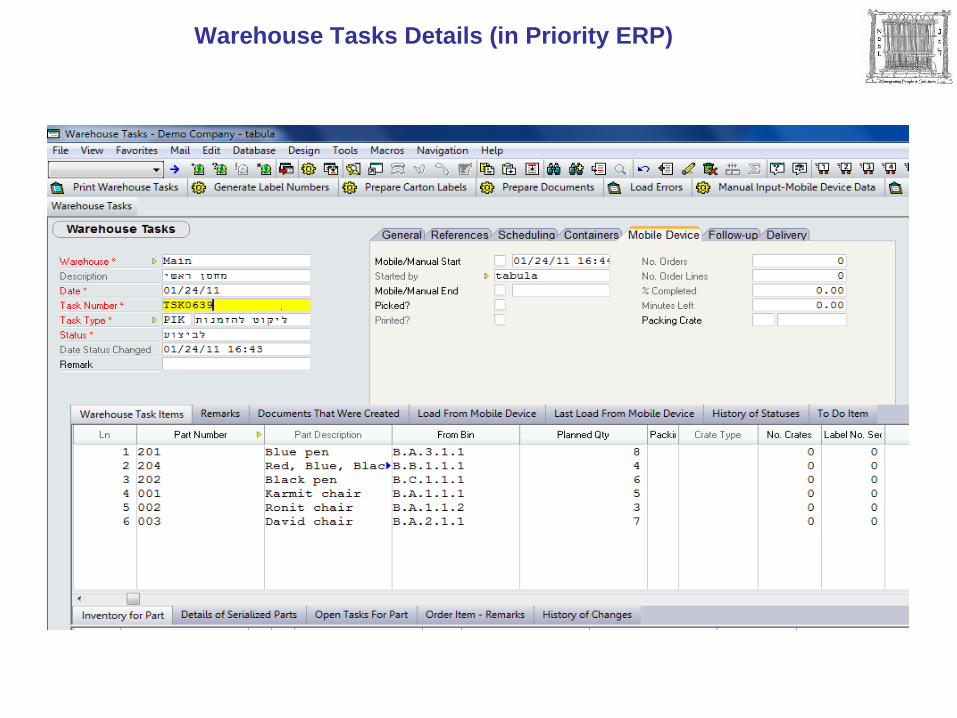
Warehouse Tasks Details (in Priority ERP)

No. of open tasks for each user
PDA UI Forklift PDA or Laptop UI
Hand Held Device UI

PDA Pick sample
Pick recommendation
Pack Details
Show alternate Bins
Data entry Zone
Next/Previous Record
Copy Record Details
PDA Pick Example

WMS BI Dashboard

Analyzing Warehouse Tasks Handling
with Disco
Example Deliverables

The Planned Warehouse Task Status Flow
Notes: Tasks created by a wave, might be set to start with the status “To Do”. There are several task types (e.g., PUT, PIK), having the same planned flow.

The Required Data
The warehouse tasks data are exported from WMS and saved as Excel or CSV. The file contains the mandatory data and additional attributes (e.g., Task type, Customer ID).
1
2
3
Task identifier
Task Status
Timestamp of status change
4 Additional Attributes
1 2 3 4

Import Configuration Screen in Disco
1. Configuring the data file columns to the appropriate built-in process mining definitions.
2. Importing the data into Disco.
1
2

Overview of the Imported Data in Disco

The Types of the Warehouse Tasks
PIK = Pick PUT = Putting away RPL = Replenish MOV = Moving

Analyzing PIK (Picking) Tasks
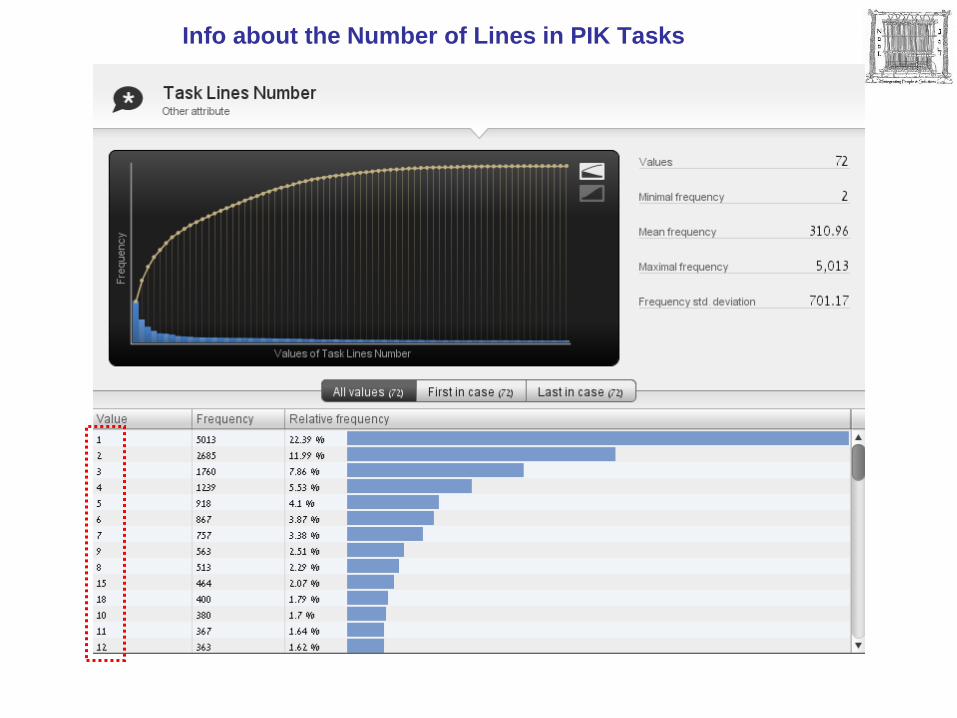
Info about the Number of Lines in PIK Tasks

Filtering Tasks with One Line Only

Map Display of the Actual Process - Frequencies
The map displays the various ways PIK tasks with one line were performed. Numbers, colors and lines thickness represent the frequencies of statuses and paths
accordingly.

Statuses & Paths Frequency
Number of tasks starting the process
Number of status occurrences
Number of times a path was taken
Number of times the path was repeated*
*Such loops may indicate inefficiency and waste in the process

The map displays the mean durations of performing PIK tasks with one line. The thickness of the arrows and the coloring of the paths visually support these numbers.
Map Display of the Actual Process - Performance

Display of the Mean Duration in Tasks Performance
The average time of the path between statuses

Locating the Slow Tasks
Average duration of PIK tasks with 1 line is approx. 1Hour. Tasks which take longer then 5 hours are filtered.

Statistical Info of the Workers involved in the Slow Tasks

Comparing Storekeepers Performance

PIK Tasks Distribution Among Storekeepers
The number of tasks allocated to a storekeeper

Comparing Storekeepers Performance
The numbers indicate the mean duration of paths between statuses

Performance of a Certain Storekeeper – Different Task Types

Performance of a Certain Storekeeper – Different Task Types

Analysis by Task Types
Example Deliverables

Task Types Comparison - Frequencies

Task Types Comparison - Performance
Further Analysis Suggestions
By Wave ID (instead of Task ID)
► Waves issues
By wave strategy types
Adding attributes from customer orders (or other ERP documents)
Locating influence/dependency among task types executions
Worker’s performance against established labor standards
Traffic in zones

Dafna Levy
Email: [email protected]
Phone: +972 (0)54-6881739
Web: http://bpmintro.wordpress.com
Disco website: http://fluxicon.com/disco/
Thank You!