Max-Stephan Schulze Patterns of growth and stagnation in ...
31
Max-Stephan Schulze Patterns of growth and stagnation in the late nineteenth century Habsburg economy Article (Published version) (Refereed) Original citation: Schulze, Max-Stephan (2000) Patterns of growth and stagnation in the late nineteenth century Habsburg economy. European review of economic history, 4 (3). pp. 311-340. ISSN 1361-4916 © 2000 Cambridge University Press This version available at: http://eprints.lse.ac.uk/4370/ Available in LSE Research Online: September 2012 LSE has developed LSE Research Online so that users may access research output of the School. Copyright © and Moral Rights for the papers on this site are retained by the individual authors and/or other copyright owners. Users may download and/or print one copy of any article(s) in LSE Research Online to facilitate their private study or for non-commercial research. You may not engage in further distribution of the material or use it for any profit-making activities or any commercial gain. You may freely distribute the URL (http://eprints.lse.ac.uk) of the LSE Research Online website.
Transcript of Max-Stephan Schulze Patterns of growth and stagnation in ...
Max-Stephan Schulze Patterns of growth and stagnation in the late nineteenth century Habsburg economy Article (Published version) (Refereed) Original citation: Schulze, Max-Stephan (2000) Patterns of growth and stagnation in the late nineteenth century Habsburg economy. European review of economic history, 4 (3). pp. 311-340. ISSN 1361-4916 © 2000 Cambridge University Press This version available at: http://eprints.lse.ac.uk/4370/ Available in LSE Research Online: September 2012 LSE has developed LSE Research Online so that users may access research output of the School. Copyright © and Moral Rights for the papers on this site are retained by the individual authors and/or other copyright owners. Users may download and/or print one copy of any article(s) in LSE Research Online to facilitate their private study or for non-commercial research. You may not engage in further distribution of the material or use it for any profit-making activities or any commercial gain. You may freely distribute the URL (http://eprints.lse.ac.uk) of the LSE Research Online website.
Patterns of growth and stagnation in thelate nineteenth century HabsburgeconomyMAX-STEPHAN SCHULZEDepartment of Economic History, London School of Economics, HoughtonStreet, London WCA AE
This article addresses two issues that feature prominently in the recenthistoriography. First, how does the Habsburg Empire’s economicperformance compare to the record for other European economies interms of levels and growth of national income? Second, to what extentwas the Austrian economy subject to prolonged stagnation after ?These questions are examined on the basis of new annual estimates ofGDP for Austria and Hungary for to . The article argues, first,that over the whole period under review Austrian per capita income failedto expand at a pace broadly commensurate with the country’s relativeincome position. The Austrian economy did not catch up with the leaders and failed to keep pace with other ‘followers’. Second, theHungarian economy recorded a markedly higher rate of per capita incomegrowth, placing it about mid-range in a European growth comparison.Third, the new evidence supports the notion of a ‘great depression’ in thewestern half of the empire (Austria) after . The distinct periodicityand differential rates of Austrian and Hungarian growth are consistentwith the argument that the outflow of Austrian capital to Hungary afterthe Vienna stock market crash was crucial in prolonging economicstagnation in Austria, whilst fuelling the first widespread wave ofindustrialisation in Hungary. The reversal of this capital outflow in theearly s was associated with an increase in Austrian economic growthand a decrease in Hungary’s rate of expansion.
. Introduction
The Habsburg Empire, one of the largest economies on the EuropeanContinent before , rarely features in comparative studies of long-rungrowth for, it seems, two major reasons. First, the empire was dissolved inthe aftermath of the First World War and gave way to a multitude of suc-cessor states. Consequently, the Habsburg economy cannot be includedreadily in comparative data sets that encompass the twentieth century.Second, much of Central and Eastern Europe lies in a ‘statistical dark age’compared to Western Europe (Good ).
European Review of Economic History, , –. Printed in the United Kingdom © Cambridge University Press

This article presents new annual estimates of GDP for Austria andHungary for to . These estimates are used to address two issuesthat feature prominently in the recent historiography. First, how does theHabsburg Empire’s economic performance compare to the record for otherEuropean economies in terms of levels and growth of national income?Williamson () argued recently that the late nineteenth century wit-nessed a process of rapid growth and convergence in living standards, atleast among those countries that now form the OECD. Poor countries atthe European periphery tended to grow faster than the developedeconomies at the centre and often even faster than the richer countries over-seas in the New World, while most of the Third World and Eastern Europedid not share in this experience. Placed somewhere midrange on the west-east developmental gradient in Europe and displaying a similar pattern ofregional disparities within its own boundaries (Good ), where does theHabsburg Empire fit in? Second, to what extent did the Austrian economyexperience prolonged stagnation after (Komlos , März ,Schulze )?
The first attempt at a systematic estimation of national income in theHabsburg Empire and its two major subunits, imperial Austria(Cisleithania) and imperial Hungary (Transleithania), was made during theFirst World War (Fellner , Gürtler ). Subsequently, the dissolutionof the empire stimulated Fellner () and Waizner () to determinepre-war income levels in the successor-state units. These calculations wereconcerned solely with income levels in – and no attempt was made toderive estimates for the nineteenth century. This early body of work wastaken up again by Eckstein () who estimated national income and cap-ital formation in – for Hungary in its interwar boundaries to whichthe country reverted after World War II. In the s, Nachum Gross in hisdoctoral thesis on Austria’s industrialisation () re-worked Fellner’s() and Waizner’s () material and complemented it by estimates forearlier benchmark years. This marked the shift in emphasis from predomi-nantly qualitative and descriptive work to quantitative-analytical research inHabsburg economic history.
Much of the initial work in the new vein reflected the search for a majorRostovian or Gerschenkronian economic discontinuity and has led to newannual estimates of sectoral production. The most significant quantitativecontributions are the industrial and agricultural production indices ofKomlos (), which are on both methodological and empirical groundsgenerally recognised as the best produced so far, and the detailed accountof Austrian agricultural production by Sandgruber (). Rudolph’s() earlier calculations of industrial output are important in this contextprimarily because they form an integral part of the one annual estimate ofAustrian national income that has been produced so far (Kausel ). Itsderivative, which refers to the territories of modern-day Austria, is included
European Review of Economic History

in the much used Maddison data sets (Maddison ). For Hungary, thenew GDP estimate presented here is the first annual series of nationalincome for the late nineteenth century. However, earlier attempts at meas-uring aggregate growth have been made on the basis of estimates for twobenchmark years such as Katus’s () computation of Gross DomesticMaterial Product for and .
More recently, David Good adopted a Crafts-type structural equationapproach to estimate per capita income levels for five benchmark years in theHabsburg Empire as a function of several proxy variables (Crafts ,Good , , ; Good and Ma ). The main purpose of thiswork is to estimate relative income levels of the regions and successor-stateterritories of the Habsburg Empire. Yet it has also been used to assess therelative growth performance of Austria-Hungary. The proxy approach maybe a feasible way to approximate output at regional levels for which stan-dard national income measures cannot be computed because of the lack ofessential data. For theoretical and conceptual reasons, though, it does notoffer an alternative to the national income approach where that can beemployed (Maddison ; Pammer ).
The main comparator for the new estimates is those existing annualestimates of GDP that build on standard national income methodology,that is, Kausel (). For Hungary, no such comparable estimates exist.Katus’s () figures do not permit an assessment of the phasing of aggre-gate economic growth as they include only estimates for the very beginningand the very end of the period under review. The re-estimation of GDPinvolved the construction of new series for secondary sector output. Here,the relevant comparison is with Komlos’s () indices for both Austriaand Hungary. Table summarises the main results of research on the rateof economic growth in the Habsburg Empire.
This article argues, first, that economic growth in the western half of theempire (imperial Austria) failed by a significant margin to keep pace withrates achieved in most other European economies. In terms of per capitaincome growth, the Austrian economy was not catching up, but fallingbehind in the late nineteenth century. Hungary, in contrast, recorded a
Growth and stagnation in the Habsburg Empire
Pammer () argues that the procedure yields statistical artefacts in terms of bothabsolute income levels and rates of income growth over time. He maintains that, first, theincome estimates are biased as a result of inappropriate functional specification of theestimation equation and the application to relatively backward regions of coefficientswhich were estimated on the basis of data for relatively advanced economies. Second,individual country effects alter or offset the impact of variables generally associated withincome; hence they severely restrict the validity of using these proxy variables (such ascrude death rates, the share of the agricultural labour force, and letters posted) forpredicting income in other economies. Finally, he questions the validity of using proxyvariables that are not theoretically linked to GDP. See Good () and Good and Ma() for a response and revised estimates.

higher than average rate of per capita income growth. Second, the new evi-dence is more in tune with interpretations that postulate a marked slow-down in Austrian economic activity during the s and s, the ‘GreatDepression’ (Komlos , ; März ; Schulze ), than with the‘revisionist’ argument of almost uniform growth between and (Good , , ). Third, the distinct periodicity and differentialrates of Austrian and Hungarian growth are consistent with the argumentthat the outflow of Austrian capital to Hungary after the Vienna stockmarket crash was crucial in prolonging economic stagnation in Austria,whilst fuelling the first widespread wave of industrialisation in Hungary(Komlos ). The rest of the article is organised as follows: Section describes briefly the derivation of the new GDP estimates, with details onmethods and sources provided in the Appendix. Section offers a com-parison with earlier estimates of GDP and industrial production. Finally,Section summarises the results and points to some of their implications.
. Deriving GDP estimates for the Habsburg Empire
The new estimates of Austrian and Hungarian GDP in constant pricesare based on eight sectoral series (agriculture, mining, manufacturing, con-struction, handicrafts, trade and communications, public and private serv-ices, housing). These output series and their constituent sub-series are
European Review of Economic History
The estimates for ‘Austria’ refer to all Kingdoms and Lands represented in the ImperialCouncil, those for ‘Hungary’ to all territories of the Hungarian crown (Hungary proper,Fiume, Croatia-Slavonia). Bosnia-Hercegovina, occupied in and annexed byAustria-Hungary in , is not included in the estimates.
Table . Estimates of GDP per capita growth (per cent per annum).
– – –
Imperial AustriaGood () .a .b .c
Kausel () . . .Good and Ma () . . .New estimate . . .
Imperial HungaryKatus () – – .d
Good and Ma () . . .New estimate . . .
Habsburg EmpireGood and Ma () . . .New estimate . . .
Notes: a/–/; b/–/; c/–/; dGDMP, –Sources: Appendix, Tables A, A, for new estimates. References for other figures.

combined using constant value added shares as weights.
Total gross value added (or GDP) for and its sectoral componentsare reconstructed on the basis of estimates by Fellner (; for Austriannon-state regulated manufacturing, Hungarian manufacturing and handi-crafts production), Gürtler (; for Hungarian agriculture), Katus (;for Hungarian construction, trade, transport and communications), Kausel(; for Austrian trade, transport and communications, public and pri-vate services, housing), Komlos (; for Austrian and Hungarian mining),and Waizner (; for Austrian agriculture, state regulated manufacturing,construction, handicrafts). In addition, new estimates have been producedfor Austrian and Hungarian iron and steel production. Value added asdocumented in Table was projected backwards drawing on a broad rangeof sector-specific output indices. The methods and sources used in the der-ivation of these indices are set out in the Appendix.
. A comparison with earlier estimates of GDP andindustrial output
Kausel draws on Waizner’s estimates of net national income for /which he projected backwards after rebasing them to and conversioninto gross value added format. The main data sources for extrapolation areSandgruber () for agricultural production, an index of industrial outputcompiled by Rudolph (), estimates of industrial production for severalcensus years and an approximation of national income for made byGross (). Estimates for the tertiary sector are made largely on the basisof material published in Brusatti (). However, virtually all of the sub-stantial difference between Kausel’s results and the new GDP calculationsis due to the different data and methods used in estimating output in themining and secondary sectors.
Gross () has produced estimates of industrial output in current pricesfor , , , and /, and deflated these using a Germanwholesale price index. Rudolph (), in contrast, compiled a weighted
Growth and stagnation in the Habsburg Empire
There are some minor exceptions to this rule. First, Sandgruber’s () index of outputof fieldcrops and wine, which forms the core of the estimate of agricultural production,draws on average / quantities and prices as weights. Second, the new estimate ofconstruction output rests on a composite index which uses weights derived fromHoffmann (). Third, the value-added estimates for steel refining and electricitygeneration are measured in prices, and the estimate for petroleum output is given in prices.
Many of the sectoral output data provided by Fellner (), Gürtler () and Waizner() are either for single years between and or a period average over theseyears. As a rule, their figures have been converted into prices, relying on product-specific price indices from Mühlpeck et al. () and rebased to using branch-specific production indices.

annual index based on volume indicators for five branches (mining, metal-making, machine-building, food processing, textiles). For to ,Kausel ‘joined’ these two series in a not altogether transparent way such thattheir mean rate of growth was taken to reflect the long-run rate of growth ofindustrial production. Rudolph’s annual values were then incorporated intothis ‘frame’ by interpolation. The series so obtained was then used to proj-ect backwards total value added in mining, manufacturing, handicrafts pro-duction and construction. This procedure and the underlying estimatesentail several problems which severely impede the quality of Kausel’s
European Review of Economic History
Table . Composition of gross value added, .
Austria Hungary
m. K Share m. K Share
Fieldcrops, wine, vegetables ,. . ,. .Fruit . . . .Livestock ,. . ,. .Forestry . . . .Mining . . . .Beer . . . .Sugar . . . .Tobacco . . . .Spirits . . . .Petroleum . . . .Iron and steel . . . .Mechanical engineering . . . .Transport engineering . . . .Electrical engineering . . . .Instruments and apparatus . . # #Metal-working . . . .Brick, clay, glass . . . .Flour . . . .Food processing . . . .Textiles, clothing, leather, rubber ,. . . .Electricity generation . . . .Fuel and light . . . .Other* . . . .Construction . . . .Handicrafts ,. . . .Trade, transport, communications ,. . . .Public and private services ,. . ,. .Housing ,. . ,. .GDP ,. . ,. .
Notes: * Includes wood-working, paper-making, printing, chemicals, misc. # Includedunder electrical engineering.Sources: See text.

results. First, Gross’s observations do not lend themselves to any measure-ment over time since the underlying original (census and survey) data weregenerated by using different methods and gathered unsystematically relativeto the business cycle (Komlos ; cf. Huertas ). Some of the dates ofthe estimates are closer to troughs while others are closer to peaks and,therefore, growth rates cannot be calculated properly. Second, the examin-ation of the composite’s sub-series reveals that Rudolph’s index is biased ina different way. The main problem here is that the Hungarian trade statis-tics have not been used to isolate Austria’s share in the Habsburg Empire’sforeign trade and constant coefficients have been used instead. Moreover,the substantial internal trade between the two halves of the empire is nottaken into account. As a result, the actual consumption of industrial inputmaterials is seriously misrepresented by most of the sub-series. Rudolph’sindex and Kausel’s derivative, first, overestimate the rate of industrialgrowth between and , and, second, mask important variations overthe business cycles. This is what a comparison with both the new industrialoutput estimates presented here and Komlos’s indices would suggest.
In order to gauge the extent of the bias thus introduced into Kausel’sGDP estimates, Table compares trend growth rates of the new estimateswith those of both the original and adjusted versions of the Kausel data.
Growth and stagnation in the Habsburg Empire
Table . Trend rates of growth, GDP per capita (per cent per annum).
Imperial Austria Imperial Hungary
New estimate Kausel Kausel Kausel New estimate
A A
Lower Upper Lower Upper bound bound Bound Bound
– . . . . . . . . .– . . . . . . . . .– . . . . . . . . .
Notes: Kausel A: Kausel estimate adjusted, using Komlos’s industrial output index;Kausel A: Kausel estimate adjusted, using new industrial output index (Table A);Lower, upper bounds: % confidence interval.Sources: Appendix, Tables A, A; Kausel (), Komlos (: Table E).
Komlos () offers a detailed critique of the Rudolph index. For a discussion ofRudolph’s treatment of the engineering sector, see Schulze ().
Fitted log-linear trend, using OLS. For the new estimates for Austria (–), theresults of the Chow predictive failure and structural stability tests are significant at the and per cent levels respectively, suggesting a structural break in trend growth in theearly to mid-s. For Hungary, the structural stability test also points in this direction(significant at the per cent level). Hence fitting a linear trend over the whole periodunder review may not be particularly useful.
The two sub-periods – and – have been chosen in accor-dance with the literature which, conventionally, views the early to mid-s as marking the end of the Great Depression in Austria. Kausel’s levelestimates have been adjusted by keeping his original sectoral value-added shares unchanged, but substituting Komlos’s () index ofmining, manufacturing and construction and, alternatively, the new esti-mate of industrial production for his industrial output series. Table (Kausel A) shows that using Komlos’s index leads to a reduction in theoverall rate of growth and, perhaps more significantly, to a widening of thegrowth differential between the two sub-periods. These effects are evenmore pronounced when the new industrial output estimates are used foradjustment rather than those of Komlos (Table , Kausel A). In terms ofgrowth, the Kausel estimates so adjusted hardly differ from the new GDPper capita estimates, displaying a large growth gap of about . of a per-centage point between the – and – periods.
For Hungary, the timing of economic expansion seems to mirror theAustrian experience in reverse. Trend growth was much faster during– than it was in the following years to (Table ). This growthdifferential and the lower rate of growth over the whole period contrast withGood and Ma (). It should be emphasised that adjusting the new GDPestimates for Hungary by replacing the new secondary sector estimates withthe Komlos industrial output index, in a fashion identical to the adjust-ments of the Kausel estimates, makes no material difference to this finding.
The main message of Table is, therefore, that both the timing and therates of per capita income growth in the Habsburg Empire were markedlydifferent from what earlier estimates suggested.
Table shows that in Austria all major sectors of the economy grew morerapidly after the mid-s than before. The growth differential, though,was widest in the secondary sector (including mining). In Hungary, on theother hand, the pattern was more complex. Here it was agriculture thatdecelerated more strongly than industry, whilst growth in services evenincreased after . In both halves of the empire, however, the secondarysector was by a significant margin the fastest growing sector over each of thetwo sub-periods. As a result, its share in constant price GDP increased from per cent () to per cent () in Austria, and from about to per cent in Hungary (Tables A, A).
Virtually all of the difference between Kausel and the new GDP estimates
European Review of Economic History
Building on Waizner’s () work, Kausel’s () gross value-added shares are asfollows: () agriculture, forestry: .; () mining, manufacturing, crafts, construction:.; () trade, transport: .; () public and personal services: .; () housing:.. These shares are, overall, fairly close to those used in the new estimates (see Table).
The trend growth rates of GDP per capita so adjusted are: (a) –, . per cent;(b) –, . per cent; (c) –, . per cent per annum.

is down to the different treatment of the secondary sector. However, thenew estimates also express a more pronounced temporal pattern of outputexpansion in the secondary sector than the Komlos () productionindices. The overall rate of Austrian industrial growth was practically equalto that estimated by Komlos, but the growth gap between the sub-periodsbefore and after was much wider (Table ). For Hungary, the new esti-mates indicate a higher rate of industrial expansion for – and thetwo sub-periods (Table ). Both estimates agree, however, on the sharpdeceleration after the mid-s.
These differences result from the inclusion of additional output series notcovered in the Komlos indices, from revisions in series such as iron and tex-tiles, and from the different weighting of industrial branches in the aggre-gate. The Komlos overall index is calculated as the unweighted sum of valueadded in individual industrial sectors, measured in constant prices.However, weighting is introduced implicitly by the relative prices withwhich the sub-series have been combined. Given that the sub-series of theindex do not span the full range of industrial sectors, this kind of implicitweighting leads to different results than the explicit weighting adopted here.First, handicrafts production, which in accounted for more than a fifthof total secondary sector output in both Austria and Hungary (Table ), isnot included in the Komlos estimates. Second, construction, constitutingabout and per cent of Austrian and Hungarian value added in the sec-ondary sector (Table ), is represented in the Komlos index only by railwaybuilding and maintenance. In contrast, the new estimates (especially forAustria) also comprise road and waterway construction, a proxy for com-mercial investment in buildings and a series for residential construction (seeAppendix). Third, the Komlos manufacturing series includes eight sub-series (beer, sugar, spirits, iron, flour, woollen textiles, cotton textiles, elec-tricity), while the new estimates build on about double that number. The
Growth and stagnation in the Habsburg Empire
This is confirmed by substituting the new agricultural output index for Kausel’s serieswhich has no effect on GDP per capita growth. Both the new estimates and Kausel relylargely on Sandgruber () for the computation of output in agriculture and forestry.
Table . Annual growth by sector (per cent).
Austria Hungary
Primary Secondary Tertiary GDP Primary Secondary Tertiary GDP
– . . . . . . . .– . . . . . . . .– . . . . . . . .
Note: Peak-to-peak measurement. Since the peaks in the individual series do notcorrespond exactly with one another, the periods of measurement are not always identical.Sources: Appendix, Tables A, A.

weights of each of these eight branch series in the aggregate of the newmanufacturing series are accordingly lower. Fourth, among the newadditional output series are some, such as the engineering branches, whichdisplay a particularly high degree of responsiveness to variations in aggre-gate economic activity.
Tables to illustrate the relative extent to which differences betweenKomlos and the new estimates for ‘industry’ are due to different weights
European Review of Economic History
Table . Shares in industrial value added, .
Austria Hungary
New estimate Komlos New estimate Komlos
Mining . . . .Manufacturing . . . .Handicrafts . – . –Construction . . . .
Sources: Table ; Komlos (: Tables E, E, E, E, E)
Table . Annual growth of industrial output, Austria (per cent).
New estimate Komlos
Mining Manuf.Crafts Constr. Total Mining Manuf. Constr.Total
– . . . . . . . �. .– . . . . . . . �. .– . . . . . . . . .
Note: Peak-to-peak measurement. Since the peaks in the individual series do notcorrespond exactly with one another, the periods of measurement are not always identical.Sources: See text for new estimates; Komlos (: Tables E, E).
Table . Annual growth of industrial output, Hungary (per cent).
New estimate Komlos
Mining Manuf. Crafts Constr. Total Mining Manuf. Constr. Total
– . . . . . . . . .– . . . . . . . . .– . . . . . . . �. .
Note: Peak-to-peak measurement. Since the peaks in the individual series do notcorrespond exactly with one another, the periods of measurement are not always identical.Sources: See text for new estimates; Komlos (: Tables E, E).

and the different treatment of the handicrafts, construction and manufac-turing sectors.
The first point worth noting is mining’s much lower weight in the newestimates (Table ). Albeit from a comparatively low base, this was a sectorthat, in Austria, expanded faster during the first two decades under reviewthan thereafter. In Hungary, there was no significant difference in thegrowth of mining during the two sub-periods. The new estimates, beingbased on the total of value added in the industrial sector rather than on asub-sample, correct for the implicit weighting bias by reducing the overallweight of this branch in the industrial aggregate.
Second, construction is also given a more prominent weight. However, incomparison to Komlos, the new construction indices for both halves of theempire entail positive rates of expansion over all sub-periods, and, forAustria, a much less pronounced growth differential between the two sub-periods (Tables , ). Hence this treatment of the construction sector is,if at all, biased against the view advanced here. The new construction seriesare more comprehensive, as noted above, and cyclically far less volatile thanseries based on railway construction alone.
Third, according to Fellner () and Waizner () the handicraftssector accounted for approximately one fifth of secondary sector output(including mining) before the First World War. It is not incorporated in theKomlos estimates. Here, a value added share weighted index of manufac-turing and construction has been used as a proxy (see Appendix). This feedsinto an overall rate of ‘industrial’ growth in Austria that is slightly higher forthe whole period, lower for – and higher for – (Tables , ).
Finally, manufacturing assumes a lower weight in the new estimates ofindustrial output than in the Komlos index (Table ). Again, this is an out-come of explicit weighting and the fuller coverage of industries that makeup the secondary sector as a whole. Irrespectively, it is manufacturing thatprimarily drives the pattern of expansion of the secondary sector and makesfor much of the difference between Komlos’s and the new estimates. Thelatter cover an additional set of manufacturing branches that () expandedfairly rapidly over the whole period and () more importantly displayed pro-nounced growth differentials between the two sub-periods in both Austriaand Hungary. These include the engineering and metalworking industries.The coverage of those branches, in turn, implies a reduction in the weightaccorded to other branches within manufacturing. Tables A and A present annual output indices for groups of related manufacturingbranches, documenting the effects of the wider coverage of the new esti-mates. For example, Austria’s engineering sector as a whole (mechanical
Growth and stagnation in the Habsburg Empire
In Tables and , growth in Komlos’s railway construction series has been measured to (Austria) and (Hungary). This leads to higher estimated growth than had thelower ‘peaks’ been used.

engineering, transport engineering, electrical engineering, instruments andapparatus) expanded at . per cent per annum between and , butat . per cent thereafter. Hungarian engineering output, on the other hand,increased at a higher rate before the mid-s than after, though thegrowth differential was not nearly as wide as for Austria.
. Results and implications
The new GDP estimates suggest a pattern of Habsburg economic growththat is distinctly different from that implied in earlier national product esti-mates. First, Austria’s GDP per capita grew by only per cent per annumbetween and (Table ). Whilst confirming the tendency towardsdownward adjustment of the Austrian growth rate during the last twenty orso years of research, this result places Austria near the bottom of theEuropean growth league for the period under review (Table ). Second,economic growth in Hungary was faster than in the western half of theempire and this result matches with most previous estimates. In Europeancomparison, Hungarian per capita growth of . per cent per annum wasabout mid-range. Third, for both halves of the empire the new estimatesreflect a pattern of expansion that was far from uniform over time. Thecomparative growth rates presented in Tables and indicate that Austriangrowth in the two decades after proceeded at a rate between . and. of a percentage point below Kausel’s and Good and Ma’s () esti-mates. Moreover, the increase in the rate of growth of Austrian per capitaGDP after was not on a par with that achieved elsewhere. The post- period was one of incomes generally rising at higher rates than before.The unweighted average growth rate for twelve European countries rosefrom per cent per annum for – to . per cent for – (Table, excluding Switzerland). Finally, in contrast to previous estimates,Hungarian GDP per capita growth decelerated after to a rate below theEuropean average. This was to a considerable extent an outcome of thesharp slow-down in agriculture after , when it was still the dominantsector in terms of both output and employment. Service sector output evenaccelerated during this period and although industrial growth was slowerthan in the preceding two decades, it still continued at an annual rate ofmore than per cent to (Table ). These results raise several questionsabout the process of growth in the Habsburg Empire.
.. The pace of growth
The literature stresses the eighteenth century antecedents of nineteenthcentury economic expansion in Austria (Good , Komlos ). JohnKomlos () went even further and argued that the industrial revolutionin Austria began at about the same time as in Britain, though without imply-
European Review of Economic History

ing that it even spread at nearly the same rate as there. Viewed against thisbackground, it seems a little surprising that the late nineteenth centuryAustrian economy did not display the growth characteristics of a typicalGerschenkronian latecomer to industrialisation. However, the compara-tively low rate of Austrian per capita GDP growth is equivalent to thatachieved in advanced economies such as Britain and Belgium, which by had per capita incomes about twice the level of imperial Austria. Thegrowth experience of economies in the south-east of the Continent makesAustria’s record appear much less unfavourable in European comparison.Bulgaria and Serbia, for instance, suffered actual falls in per capita outputduring the late nineteenth century (Palairet ). Yet in the broad con-text of European growth in the period this was an extreme experience andthe problem remains: if initially low levels of per capita output (or labourproductivity) entail the potential for faster growth than in the moreadvanced economies (Gerschenkron , Abramovitz ), then thequestion arises why the western half of the empire failed to expand at a pacebroadly commensurate with its relative GDP position. For example, theeconomies of three other European countries with roughly comparablelevels of per capita GDP in , that is, Italy, Spain and Norway, grewmarkedly faster during the period up to (Table ). Using Good andMa’s () ‘imperial Austria/modern Austria’ ratios to make some tenta-tive approximations of per capita output levels in the territories of modernAustria, we might ask by the same token why the economically mostadvanced part of the Habsburg Empire failed to keep pace with the expan-sion achieved in countries such as Denmark, France and Germany, all ofwhich had broadly similar GDP per capita levels in . Nachum Gross(, p.) argued that ‘long-run industrial growth in nineteenth centuryAustria was not sufficiently rapid to make her economy relatively less back-ward at the end of the period than it had been in the middle of the century’.The new evidence on economic growth supports this assessment.Moreover, given her dominant weight in total output of the empire, imperialAustria’s lacklustre performance meant that the customs union’s growthrecord was also poorer than that of most other European economies.
Growth and stagnation in the Habsburg Empire
The magnitudes implied in Palairet’s (, pp. –) detailed reconstruction of nationalproduct for Serbia and Bulgaria in do not match with the results of the proxy approach.First, according to Good and Ma (), Serbia’s per capita GDP was about per centabove that of Bulgaria while Palairet’s calculations suggest that it was per cent below theBulgarian level. Second, Good and Ma’s estimates place Serbia right at the top of theEuropean growth league with a rate of . per cent per annum for to , andBulgarian GDP is reported to have grown by . per cent during –. In contrast,Palairet argues that Serbian per capita income shrank by at least . per cent per annumbetween and and that Bulgarian per capita product is also likely to have fallen.

.. The periodicity of growth
The very low rates of per capita growth between and , both rela-tive to rates of expansion achieved elsewhere in Europe during this periodand relative to Austria’s post- record, are an expression of the GreatDepression that affected the western part of the Habsburg Empire after (März , ; Komlos ). Moreover, the distinct timing anddifferential rates of Austrian and Hungarian growth are consistent with theview that the direction of intra-empire capital flows played a crucial role inprolonging economic stagnation in Austria after the Vienna stockmarket crash and fostering economic expansion in Hungary. Subsequent tothe crash and as a result of Austrian investors’ preferences for safe bonds,capital left Austria for Hungary (Komlos ; cf. Pammer, ). Thisoutflow of capital was paralleled by a dramatic contraction in machineryinvestment and low rates of industrial growth. In Hungary, on the otherhand, the inflow of Austrian funds allowed a substantial increase in invest-ment and was instrumental in stimulating a process of rapid industrialisa-tion (Schulze ). These trends were only reversed in the late s/earlys when capital was repatriated to Austria and industrial activity therepicked up again, coinciding with a slow-down in Hungarian growth. In con-trast to the argument advanced in Good (, , ), the evidence
European Review of Economic History
Table . Levels of GDP per capita ( Geary-Khamis $).
∆ (% p.a.)
–
Imperial Austria , , , .Imperial Hungary , , , .Habsburg Empire , , , .Modern Austria# , , , .Belgium , , , .Denmark , , , .Finland , , , .France , , , .Germany , , , .Italy , , , .Netherlands , , , .Norway , , , .Spain , , , .Sweden , , , .Switzerland , n/a , .UK , , , .USSR , , , .
Note: # New estimate using Good and Ma’s () ‘imperial Austria/modern Austria’ratios.Sources: See text for Austria-Hungary; Maddison (, ).

on aggregate growth shows that Austria’s Great Depression was not a mythor a phenomenon confined to price deflation, but a long-lasting slowdownof the real economy (Table ). This finding raises the question about thelong-term impact of this depression on the pace of growth. For instance, towhat extent were the institutional and structural changes that emerged inAustria during this period detrimental to more rapid growth subsequently?
For what looked like a relatively favourable income position in was tobe eroded during the protracted stagnation of the s and s and, mostimportantly, was not to be regained in the following decades to . By thetime of the First World War, imperial Austria’s relative income position haddeteriorated against nine of the other countries in Table when com-pared with .
To some extent a better understanding of the nature of this prolongedstagnation requires a look back to the preceding decades. To what extentwas Austria’s economic performance during the Great Depression markednot only by a deviation from its course after, say, but also from whatwas happening before ? Unfortunately, the data at our disposal areseverely limited. There are no annual estimates of national product thatwould permit a reasonably satisfactory assessment. Yet some observationscan be made nevertheless on the basis of industrial output.
During the s, there came first a sharp downturn in Austrian indus-trial production () which was eventually followed by extremely rapidrecovery growth from . The initial contraction was first and foremostan outcome of the cotton famine associated with the American civil war,which led to a per cent fall in cotton imports in . In its wake, outputin other manufacturing branches contracted too, albeit at considerablylower rates than in the cotton industry (Liese and Schulze ). It seemsprobable, however, that the available data overestimate somewhat the effectof this exogenous shock on manufacturing output and subsequent expan-sion. The weight of cotton textiles in Komlos’s manufacturing index(Komlos , Table E) is far higher ( per cent) than it would be if thefull range of manufacturing branches were covered in the index ( percent). These problems notwithstanding, the evidence on industrial growthpoints to rapid expansion prior to , a marked slowdown thereafter andacceleration from the mid-s. Using an index for mining, manufacturingand construction in Austria and measuring from peak to peak, the follow-ing average annual rates apply: –, . per cent; –, . percent; –, . per cent.
Growth and stagnation in the Habsburg Empire
See note . This question is the subject matter of current research. Komlos (, Table E). Note that the high growth rate for – is not solely an
outcome of the boom of the late s. During – industrial output increased at arate of nearly per cent per annum, i.e. at almost one percentage point above the ratefor –.

The phasing of expansion in Hungarian industry is in line with the pat-tern that Komlos has drawn, even if growth rates differ somewhat over indi-vidual cycles. There was rapid growth between and the early s, amarked slow-down up to and renewed vigorous growth again to thelast peak before the First World War (). As such the new estimates ofindustrial output support the argument that the timing of economic growthin Hungary was influenced not only by changes in the volume and directionof intra-empire capital flows, but also by the related changes in governmentexpenditure and movements in Hungary’s terms of trade vis-à-vis Austria.The latter improved during the s and s (causing a rise inHungarian real incomes), worsened from , and turned favourable againafter . The transfer of funds from Austria after was associated withfiscal expansion. With the repatriation of Austrian capital in the mid-s,growth in government expenditure slowed to a rate below the increase intaxes and government investment stagnated. From , governmentexpenditure grew again far faster than taxes. Though primarily funded outof domestic resources, the associated rise in national debt growth was aug-mented by a growing inflow of foreign capital (Komlos , pp. –).
At the aggregate level, however, the impact of these stimuli and con-straints was less clear cut. Although GDP growth fell markedly after ,there was no subsequent increase in the growth rate after . This was anoutcome of the performance of the rural economy. Output growth in theprimary sector decelerated heavily after to about half a per cent perannum. This more than compensated for the rapid expansion in industryand the per cent annual increase in service sector output. As it turns out,the pattern of Hungarian growth throughout the late nineteenth century wasto a significant extent shaped by agriculture. Over the period under review,Hungary’s economy expanded most rapidly between and (. percent per annum). Nearly per cent of all GDP growth that occurredduring this period was a result of agriculture’s vigorous expansion (Table). During the next cycle to , when aggregate growth declined slightly
European Review of Economic History
Table . Relative contributions to GDP growth, Hungary (per cent).
Primary Secondary Tertiary GDP GDP sector sector sector growth growth p.a.
– . . . . .– . . . . .– . . . . .– . . . . .
Note: Measurement for all sectors from peak to peak in GDP. For each period, relativecontributions to GDP growth are computed as each sector’s growth rate weighted by thatsector’s share in GDP at the beginning of the period.Source: Appendix, Table A.
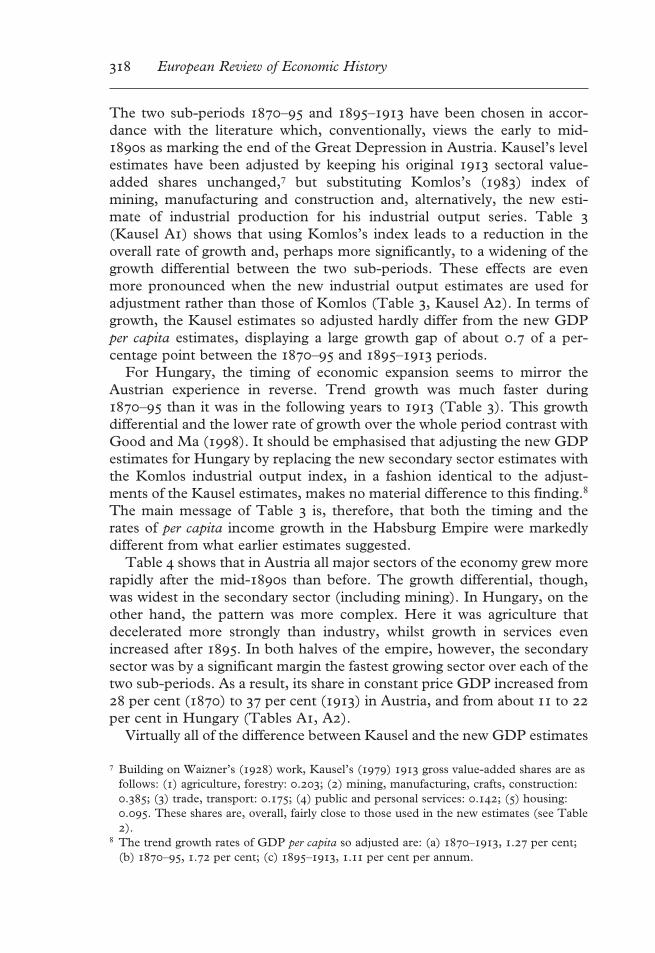
to . per cent, the continuing rise in industrial output (over per cent) wascounterbalanced by the rural sector’s falling contribution to GDP growth.That rose again in the following decade when growth in GDP and industrywas at its slowest (. and . per cent, respectively), while agricultureexpanded again at a slightly higher rate. Thus, in conjunction with thestable rate of expansion in services, agricultural growth helped to someextent in reducing the adverse effects of the contraction in industry.However, after , as noted above, the primary sector became a majordrag on economic growth, effectively preventing a return to the high ratesof expansion prevalent during the s and s.
In Austria, the primary sector’s relative contribution to GDP growth ineach of the four sub-periods was more limited than in the eastern half of theempire. This reflects the rural sector’s much smaller share in national prod-uct and lower rates of expansion than in Hungary. Only during the cycle– did agriculture contribute more than per cent to aggregategrowth (Table ). However, even then agricultural growth was not suffi-ciently rapid to raise GDP growth significantly above the per cent mark.For this was the period when both the secondary and the tertiary sectorswere almost stagnant, expanding by less than per cent per annum. During the next cycle to , sluggish expansion in the primary sectorbecame a severe constraint. First, it reduced the impact on GDP growth ofthe industrial revival after and of the marked rise in service sectoroutput. Second, slow growth in rural incomes is likely to have reduceddemand for manufactures and may have contributed to slow growth inindustry during the s. In the following cycle to , output of the pri-mary sector rose at higher rates than before, augmenting the effects of theindustrial upsurge. However, in the last period –, when the industrialsector and services continued to expand at almost the same rates as during–, agriculture made no contribution to GDP growth. As inHungary, it was stagnation in the rural economy that led to a slowdown inGDP growth in the last five years or so before the First World War.
Growth and stagnation in the Habsburg Empire
Table . Relative contributions to GDP growth, Austria (per cent).
Primary Secondary Tertiary GDP GDP sector sector sector growth growth p.a.
– . . . . .– . . . . .– . . . . .– . . . . .
Note: Measurement for all sectors from peak to peak in GDP. For each period, relativecontributions to GDP growth are computed as each sector’s growth rate weighted by thatsector’s share in GDP at the beginning of the period.Source: Appendix, Table A.

. Conclusions
First, the Austrian economy failed to catch up with the leaders and con-tinued to fall behind most other European economies in terms of GDP percapita growth. Second, the extent of the post- depression in Austria wassuch that it affected not only the industrial sector but left its imprint on theaggregate economy. Third, the broad pattern of industrial expansion in onehalf of the empire coinciding with contraction in the other is also reflectedin the behaviour of national product. Fourth, despite rapid industrialadvance, the rural sector continued to dominate the pattern of growth inHungary into the early twentieth century. Finally, Hungary’s economy grewat a markedly faster rate than Austria’s over the period as a whole andranked about mid-range in the European growth comparison.
Acknowledgements
I wish to thank Nick Crafts, Knick Harley, David Good, John Komlos and the ref-erees for helpful criticisms and suggestions. The comments by participants in sem-inars and workshops at Guelph, Leuven, the London School of Economics, Lund,Toronto, Warwick, Wifo Institute Vienna and at the EHS Conference Leeds aregratefully acknowledged.
References
ABRAMOVITZ, M. (). Catching up, forging ahead and falling behind. Journalof Economic History , pp. –.
BACHINGER, K. (). Das Verkehrswesen. In A. Brusatti (ed.), DieHabsburgermonarchie –, vol.: Die wirtschaftliche Entwicklung. Vienna:Österreichische Akademie der Wissenschaften.
BRUSATTI, A. (ed.) (). Die Habsburgermonarchie –, vol.: Diewirtschaftliche Entwicklung. Vienna: Österreichische Akademie derWissenschaften.
BURNHAM, T. H. and HOSKINS, G. O. (). Iron and steel in Britain, –.London: George Allen & Unwin.
CRAFTS, N. F. R. (). Gross national product in Europe –: some newestimates. Explorations in Economic History , pp. –.
ECKSTEIN, A. (). National income and capital formation in Hungary,–. In S. Kuznets (ed.), Income and Wealth, series V. London: Bowes& Bowes.
FELLNER, F. VON (). Das Volkseinkommen Österreichs und Ungarns.Statistische Monatsschrift , pp. –.
FELLNER, F. VON (). Die Verteilung des Volksvermögens und desVolkseinkommens der Länder der Ungarischen Heiligen Krone zwischen demheutigen Ungarn und den Successionsstaaten. Metron , pp. –.
European Review of Economic History
This finding tends to support the view that Hungary gained more from the customs andmonetary union than Austria did (Komlos ).

GERSCHENKRON, A. (). Economic Backwardness in Historical Perspective.Cambridge, MA: Harvard University Press.
GOOD, D. F. (). Stagnation and ‘take-off’ in Austria, –. EconomicHistory Review, nd series , pp. –.
GOOD, D. F. (). The great depression and Austrian economic growth after. Economic History Review, nd series , pp. –.
GOOD, D. F. (). The Economic Rise of the Habsburg Empire, –.Berkeley, CA: University of California Press.
GOOD, D. F. (). Austria-Hungary. In R. Sylla and G. Toniolo (eds), Patternsof European Industrialization: The Nineteenth Century. London: Routledge.
GOOD, D. F. (). The economic lag of central and eastern Europe: incomeestimates for the Habsburg successor states, –. Journal of EconomicHistory , pp. –.
GOOD, D. F. (). Proxy data and income estimates: reply to Pammer. Journalof Economic History , pp. –.
GOOD, D. F and MA, T. (). New estimates of income levels in central andeastern Europe, –. In F. Baltzarek, F. Butschek and G. Tichy (eds),Von der Theorie zur Wirtschaftspolitik – ein österreichischer Weg. Stuttgart: Lucius.
GROSS, N. T. (). Industrialization in Austria in the nineteenth century.Unpublished Ph.D thesis, University of California, Berkeley.
GÜRTLER, F. (). Das Volkseinkommen Österreichs und Ungarns.Weltwirtschaftliches Archiv , pp. –.
HOFFMANN, W. G. (). Das Wachstum der deutschen Wirtschaft seit der Mitte des. Jahrhunderts. Berlin: Springer.
HUERTAS, T. (). Economic Growth and Economic Policy in a MultinationalSetting: The Habsburg Monarchy, –. New York: Arno Press.
KUPELWIESER, F. (). Die Erzeugung von Flusseisen und Stahl im XIX.Jahrhundert in Oesterreich-Ungarn. Österreichische Zeitschrift für Berg- undHüttenwesen , pp. –.
LIESE, J. and SCHULZE, M. S. (). Geldpolitik und Konjunktur in Österreich:Die ‘Plener’sche Stagnation’ bis . Vierteljahrschrift für Sozial- undWirtschaftsgeschichte , pp. –.
KATUS, L. (). Economic growth in Hungary during the age of dualism(–): a quantitative analysis. In E. Pamlényi (ed.), Sozial-ökonomischeForschungen zur Geschichte von Ost-Mitteleuropa. Budapest: Akadémiai Kiadó.
KAUSEL, A. (). Österreichs Volkseinkommen –. In Geschichte undErgebnisse der zentralen amtlichen Statistik in Österreich –. Vienna:Österreichisches Statistisches Zentralamt.
KOMLOS, J. (). Is the depression in Austria after a ‘myth’? EconomicHistory Review, nd series , pp. –.
KOMLOS, J. (). The Habsburg Monarchy as a Customs Union. EconomicDevelopment in Austria-Hungary in the Nineteenth Century. Princeton, NJ:Princeton University Press.
KOMLOS, J. (). Stature, Nutrition, and Economic Development in the EighteenthCentury Habsburg Monarchy: The ‘Austrian’ Model of the Industrial Revolution.Princeton, NJ: Princeton University Press.
MADDISON, A. (). Measuring European growth: the core and the periphery.
Growth and stagnation in the Habsburg Empire

In E. Aerts and N. Valério (eds.), Growth and Stagnation in the MediterraneanWorld. Leuven, Belgium: Leuven University Press.
MADDISON, A. (). Dynamic Forces in Economic Development. Oxford: OxfordUniversity Press.
MADDISON, A. (). Monitoring the World Economy, –. Paris: OECD.MÄRZ, E. (). Die wirtschaftliche Entwicklung der Donaumonarchie im
.Jahrhundert. Wirtschaft und Gesellschaft, pp. –.MÄRZ, E. (). Oesterreichische Industrie- und Bankpolitik in der Zeit Franz Joseph
I. Vienna: Europa.MATIS, H. and BACHINGER, K. (). Österreichs industrielle Entwicklung. In A.
Brusatti (ed.), Die Habsburger Monarchie –, vol. I: Die wirtschaftlicheEntwicklung. Vienna: Österreichische Akademie der Wissenschaften.
MSE (–): Magyar Kir. Központi Statisztikai Hivatal, Magyar StatisztikaiÉvkönyv. Budapest.
MÜHLPECK, V., SANDGRUBER, R. and WOITEK, H. (). Index derVerbraucherpreise –. In Geschichte und Ergebnisse der zentralenamtlichen Statistik in Österreich –. Vienna: Österreichisches StatistischesZentralamt.
ÖZBH (–). Österreichische Zeitschrift für Berg- und Hüttenwesen –.ÖSTERREICHISCHES HANDELSMUSEUM (). Materialien zur österreichischen
Produktions- und Betriebsstatistik. Vienna: k.k. Hof- und Staatsdruckerei.PALAIRET, M. (). The Balkan Economies c. –. Cambridge: Cambridge
University Press.PAMMER, M. (). Proxy data and income estimates: the economic lag of
central and eastern Europe. Journal of Economic History , pp. –.PAMMER, M. (). Austrian private investments in Hungary, –.
European Review of Economic History , part , pp. –.RUDOLPH, R. L. (). Banking and Industrialization in Austria-Hungary: the Role
of Banks in the Industrialization of the Czech Crownlands, –. Cambridge:Cambridge University Press.
SANDGRUBER, R. (). Österreichische Agrarstatistik –. Munich:Oldenbourg.
SANDGRUBER, R. (). Die Anfänge der Konsumgesellschaft:Konsumgüterverbrauch, Lebensstandard und Alltagskultur in Österreich im . Und. Jahrhundert. Munich: Oldenbourg.
SCHULZE, M. S. (). Engineering and Economic Growth: The Development ofAustria-Hungary’s Machine-Building Industry in the late th Century. Frankfurt,New York: Peter Lang.
SCHULZE, M. S. (). The machine-building industry and Austria’s greatdepression after . Economic History Review, nd series , pp. –.
SCHUSTER, F. (). Die Stahlproduktion Österreich-Ungarns. ÖsterreichischeZeitschrift für Berg- und Hüttenwesen , pp. –.
SHB (–): k.k. Statistische Central-Commission, ÖsterreichischesStatistisches Handbuch. Vienna.
SJB (–): k.k. Statistische Central-Commission, Statistisches Jahrbuch derÖsterreichischen Monarchie. Vienna.
WAIZNER, E. (). Das Volkseinkommen Alt-Oesterreichs und seine Verteilungauf die Nachfolgestaaten. Metron , pp. –.
European Review of Economic History
WILLIAMSON, J. G. (). Globalization, convergence, and history. Journal ofEconomic History , pp. –.
Appendix: Estimates of GDP – methods and sources
Agriculture
Fieldcrops, wine, vegetables. Austria (A): Index of fieldcrop and wine productioncomprising commodities (Sandgruber , Table ). Hungary (H): Index ofcrop production comprising commodities (Komlos , Tables D, D, D).
Fruit. (A), (H): Three-year moving averages of wine production based onSandgruber (, Table ) and Komlos (, Tables D, D).
Livestock. (A): Volume indices for meat, milk and wool production were com-puted by interpolation between the , , , , and benchmarkestimates produced by Sandgruber (, Tables , , ), and either extrapo-lated to or amended by additional data given in Fellner () and Waizner(). The volume index of silk production is based on Sandgruber’s period aver-ages and, for to , on Fellner (). An index composed of the four series,with value added shares as weights, was then used to estimate total livestockproduction. (H): Index based on Katus’s (, Table ) calculation of growth invalue added between the two benchmarks / and /.
Forestry. (A): Index of annual ‘Einschlag’ based on growth in timber stocks(Sandgruber, , Table ). (H): Index based on Katus’s calculation of growthbetween the two benchmarks / and / (including game and fisherieswhich, however, account for less than per cent of combined output in forestry,game, fisheries).
Mining
(A), (H): Comprehensive calculations of gross value added in mining are taken fromKomlos (, Tables E, E). For Austria, these estimates encompass eight miningproducts (anthracite, lignite, iron ore, silver, mercury, copper, lead, zinc), whichaccount forper centof thegross valueof totalminingoutput in (SHB),plusoutput of crude oil and salt. The Hungarian estimates cover eleven mining products.
Manufacturing
Beer, sugar, spirits, flour. (A),(H): Four separate indices of value added in beer,sugar, spirits, and flour production by Komlos (, Tables E, E). Trendextrapolation for spirits –.
Tobacco. (A): The volume and value of output of tobacco products is given in theofficial statistics. Thus a series of gross output in constant prices was readilyavailable and converted into value added, using a proportion of per cent (Fellner, Waizner ). (H): Volume index based on output data from the official sta-tistics (MSE, various issues) for – and trend extrapolation for –.
Petroleum. (A): Volume index of Austrian crude oil production derived from theofficial statistics. Domestically produced crude oil accounted for between and per cent of crude oil input in Austrian refineries. (H): As no adequate data are
Growth and stagnation in the Habsburg Empire
available it was assumed that output in this small sector (see Table ) expanded inline with manufacturing as a whole.
Iron and steel. (A), (H): For both Austria and Hungary, the volume and valueof cast iron and pig iron production are well documented in the official statistics(SJB, SHB, MSE). Drawing on input cost coefficients from Waizner () andBurnham and Hoskins (), a value added proportion of per cent was used forsmelting. The Austrian price of pig iron was . crowns per ton and that ofcast iron . crowns. The volumes of Austrian and Hungarian steel production arereported in Kupelwieser (), Schuster () and ÖZBH (–), whileestimates of wrought iron output were taken from Schulze (). Value added inrefining was then computed by, first, converting steel and wrought iron output intovalue terms (using the mean of plate and bar iron prices in Austria, i.e. crowns per ton; a price is not available) and, second, applying a constant valueadded proportion of per cent (Komlos ). This procedure differs fromKomlos’s estimates of value added in iron and steel production mainly in itsreliance on contemporary records on the actual volume of steel and, partially,wrought iron output. This helps avoid the tricky issues of stock variations and theuse of scrap that may affect estimates of wrought iron and steel output derivedsolely from output and net imports of pig iron. In addition, the further processingof iron and steel in the metal working industry has been estimated separately (seebelow). Note that neither Fellner () nor Waizner () account for valueadded in refining. The estimation equation for Austria’s value added in iron smelt-ing and refining was:
[.*(.*Q � .*Q)] � [.**(Q� Q)],
where Q is the volume of pig iron output, Q the volume of cast iron output, Q thevolume of steel output and Q the volume of wrought iron production. The estimatesfor Hungary were produced in identical fashion but rely on Hungarian price data.
Mechanical engineering. (A), (H): Annual estimates of output are taken fromSchulze () where the estimation methods and sources used are set out in detail.These estimates build on wage-sums paid in the machine-building industry and on thevolume of iron and steel inputs. Hoffmann’s steam engine price index for Germany wasrevised so as to account for Austrian rather than German input prices (Hoffmann ).This revised price index was used for deflating output in all four engineering series.
Transport engineering. (A), (H): Output in this engineering branch was estimatedas for mechanical engineering, drawing on material reproduced and sources cited inSchulze (). For both branches, the value-added proportion was per cent.
Electrical engineering. (A): Wage-bill data are available only for to andfor these years value added was calculated as for mechanical engineering. An initialattempt to approximate value added in this ‘new’ industry by use of a series of thenumber of telephones (Komlos ) was abandoned, as the growth in this seriesoutstripped that of the electrical engineering series by a very large margin during theyears with overlap. Using iron and steel inputs for extrapolation did not seem sen-sible either, as a considerable proportion of output is not iron and steel intensive.Instead, a log-linear trend was fitted to obtain values for the missing years. (H):Index comprises the series for mechanical and transport engineering with valueadded shares as weights, as no branch-specific data are available for extrapolation.
European Review of Economic History

Instruments and apparatus. (A): Weighted index comprising the series for mech-anical, transport and electrical engineering. The shares in combined valueadded of these branches were used as weights. (H): Index comprising the series formechanical and transport engineering with value added shares as weights.
Metal-working. (A), (H): Output in this branch was calculated as for mechan-ical engineering and transport engineering (Schulze ). The price index used isa composite of several iron and steel input prices. The value added proportion is per cent. Value added in the non-ferrous metal working branch of this sector isassumed to have grown in line with that in the iron and steel using branches.
Brick, clay, glass (construction materials). (A), (H): Weighted indices derived forconstruction (see below).
Food processing. (A), (H): Weighted indices of value added in beer, sugar, spir-its and flour milling (Komlos , Tables E, E).
Textiles and clothing. (A): Weighted index of value added in woollen, cotton andlinen textiles production. The two indices for woollen and cotton textiles are takenfrom Komlos (, Table E). These have been combined with linen productionusing their respective shares in total value added as weights. Linen textiles pro-duction was estimated in a two stage process (spinning, weaving) on the basis ofdomestic flax production, net imports of flax and net imports of linen yarn. Given thehigh rate of non-marketed output (Sandgruber ), it was assumed that only halfof domestically produced flax was used for commercial linen production. The valueadded proportions were per cent for both spinning and weaving (Fellner ,Gross ). Rates of conversion from flax to yarn ( per cent for domestically pro-duced flax fibre and per cent for imported flax) and from yarn to cloth ( percent) are taken from Hoffmann (). According to the official export statistics, theaverage price of yarn was . crowns per kilogram; the price of cloth was .crowns. The estimation equation for value added in linen spinning and weaving was:
[.*.*(.*.*Q�.*Q)]�[.*.*.*((.*.*Q�.*Q)�Q)],
where Q is the volume of domestic flax production, Q is the volume of netimports of flax and Q the volume of net imports of yarn. (H): weighted indexof value added in woollen and cotton textiles production (Komlos , Table E).
Leather and rubber. (A), (H): It was assumed that value added in this branchgrew in line with value added in textiles and clothing, i.e. the respective weightedtextile indices have been used.
Electricity generation. (A): Output was approximated in four stages. Thenumber of central power stations is available for , when the first station wasbuilt in Austria, to (Matis and Bachinger ) and for to (Österreichisches Handelsmuseum ). For the years between and ,the number of generating plants was approximated by linear interpolation. Totalelectricity output (in kw) and output per power station is available only for to (Österreichisches, Handelsmuseum ). It was assumed that electricityoutput per unit rose between and at the same rate as for to .Multiplying estimated unit output by the actual (–) and estimated(–) number of power stations yielded annual estimates of total electricityoutput for the years with missing data, which were then combined with the original
Growth and stagnation in the Habsburg Empire

data for to . Finally, the output series so obtained was used to calculatevalue added for to on the basis of the value added/physical outputratio. Note that this series is measured in prices. (H): No adequate data areavailable for Hungary and it was assumed that electricity output there rose at thesame rate as Austria’s.
Fuel; light; wood-working; paper-making; printing; chemicals; misc. (A), (H): Nodata are available for Austria and Hungary and it was assumed that value added grewin line with manufacturing as a whole. Note that total output in these branchesaccounted for only per cent of Austrian GDP and per cent of total commodityoutput in ( and per cent, respectively, for Hungary; see Table ).
Construction
(A): Weighted index that includes an infrastructure series, a series for residentialbuilding, and a series for commercial investment in buildings (machinery produc-tion as a proxy). The infrastructure series is composed of Komlos’s (, TableE ) index for value added in railway construction and repair, and two new indicesfor road construction and inland waterway construction which draw on official data(annual issues of SJB and SHB). Using a proportion of per cent, value added inroad construction was estimated for new construction and for maintenance on thebasis of road length and expenditure data. The cost of constructing one kilometreof new road in was approximately , crowns per year; that of maintainingone kilometre of road was , crowns. The incomplete and inconsistent data onthe length of inland waterways necessitated to estimate value added in the con-struction of waterways solely on the basis of public expenditure data. A new serieswas obtained by deflating total annual outlays for new construction and mainten-ance (using the general price index of Mühlpeck et al. ()) and applying a valueadded proportion of per cent. The three indices for railway, road and waterwayconstruction are combined using shares in joint value added as weights.
The new series for residential construction is based on additions to the housingstock as recorded in the censuses and adjusted for population growth to correct forthe effects of unrecorded changes in the average size of residential dwellings (annualissues of SJB and SHB).
Finally, the infrastructure, residential and commercial building indices are com-bined using weights derived from Hoffmann ().
(H): No data are available on changes in the housing stock. Residential con-struction was, therefore, estimated on the basis of population growth and theassumption that the average number of residents per dwelling in Austria appliedalso to Hungary. Data on road and waterways construction are either lackingaltogether or are incomplete and inconsistent. Hence the infrastructure series is
European Review of Economic History
These figures are based on the average expenditure on state roads (, crownsper kilometre) and the assumption that the ratio between the costs of new constructionand the costs of maintenance approximated to that which applied in railwayconstruction (Komlos ).
Note, however, that in state expenditure on inland waterways accounted for lessthan half the expenditure on state roads which, in turn, made up only about per centof the total road network.

based solely on railway construction and repair (Komlos , E; three yearmoving average to smooth the impact of the high level of volatility in railway con-struction). As for Austria, machinery production has been used as a proxy for com-mercial building. The three series are combined using the same weights as forAustria.
Handicrafts
(A), (H): The share of handicrafts production in commodity output remained more orless constant throughout the late nineteenth century (Gross , Fellner ). Theofficial census data would suggest, moreover, that the handicrafts sector did not loseout to industry in terms of employment. In short, there is little evidence that the hand-icrafts sector declined in absolute or relative terms. This resilience can be explained,at least partly, by this sector’s shift into custom production, components making andrepair work. It was, therefore, assumed that value added in handicrafts productionexpanded in line with manufacturing and construction, i.e. weighted indices of manu-facturing and construction were used for extrapolation. The respective shares ofmanufacturing and construction in combined value added were used as weights.
Trade, transport and communications
(A): The value added series for trade and communications is taken from Kausel(, Table ) without further adjustment. He assumed, first, that trade moved inline with primary and secondary production and, second, that only half of agricul-tural output was traded. Kausel used data from Bachinger () to approximateoutput of rail and road transport, of shipping and of the postal system. (H): weightedindex of output in transport and communication and output in trade. The index ofoutput in transport and communication is taken from Katus (, Table ), whilethe trade series is based on the annual average rate of growth between Katus’s (,Tables , ) benchmark estimates for and . value added shares havebeen used as weights (. for transport and communication, . for trade).
Services
(A): Value added in ‘productive’ (private and public) and ‘personal’ services hasbeen estimated by Kausel (, Table ) on the basis of official employment sta-tistics. His series is incorporated into the GDP estimates without further adjust-ment. (H): Fellner’s () estimates of incomes generated in services areinconsistent and a comparison with Kausel () would suggest that his figures forAustria seriously underestimate service sector output. Hence they have not beenused here. As a first step, the level of the labour force in public and privateservices was estimated using the data provided in Katus (, Tables , ). Itwas then assumed that the ratio of Hungarian to Austrian output per workerin trade, transport and communications (Katus , Table ; Kausel ,Tables , , ) prevailed also in private and public services. Applying this ratio toAustrian labour productivity in services yielded an approximation of the level ofHungarian service output for . Finally, this was extrapolated using the trendrate of growth of Austrian service sector output for –.
Growth and stagnation in the Habsburg Empire

Housing
(A): Kausel (, Table ) estimated rental income from housing for to using the total number of residents’ parties and assuming a constant size and qual-ity of the dwellings, while taking account of owner-occupation. Again, no attemptat further adjustment has been made before integrating this series into the GDPestimates. (H): Drawing on housing tax records, Fellner () estimated rentalincome as a proportion of the capital value of residential dwellings in the HabsburgEmpire. Kausel’s computations for Austria (and comparisons with othereconomies) would suggest that Fellner’s data and procedure underestimate theactual level of rental incomes by a large margin. Here an approximation was madeby, first, calculating the average ‘rent per head’ of population in Austria. Thenthe income differential between the two economies was taken into account by com-puting the ratio of Hungarian to Austrian total output of commodities and tradeand communications per capita (as proxy for average income). Applying this ratioto the Austrian figure of ‘rent per head’ yielded an approximation of the respectiveHungarian ‘rent per head’ which was, finally, extrapolated by the index of popu-lation.
European Review of Economic History

Growth and stagnation in the Habsburg Empire
Table A. Austrian GDP in constant prices (m. Crowns).
Primary Secondary Tertiary GDPsectora sectorb sectorc GDP per capita
Crowns �
. . . . . . . . . . . . . . . . . . . . . . . . . . . . . . . . . . . . . . . . . . . . . . . . . . . . . . . . . . . . . . . . . . . . . . . . . . . . . . . . . . . . . . . . . . . . . . . . . . . . . . . . . . . . . . . . . . . . . . . . . . . . . . . . . . . . . . . . . . . . . . . . . . . . . . . . . . . . . . . . . . . . . . . . . . . . . . . . . . . . . . . . . . . . . . . . . . . . . . . . . . . . . . . . . . . . . . . . . . . . . . . . . . . . . . . . . . . . . . . . . . . . . . . . . . . . . . . . . . . . . . . .
Notes: a Agriculture; forestry. b Manufacturing; mining; handicrafts; construction. c Trade,transport, communications; public and private services; housing.Sources: See text.

Table A. Hungarian GDP in constant prices (m. Crowns).
Primary Secondary Tertiary GDP GDP per capitasectora sectorb sectorc
Crowns �
. . . . . . . . . . . . . . . . . . . . . . . . . . . . . . . . . . . . . . . . . . . . . . . . . . . . . . . . . . . . . . . . . . . . . . . . . . . . . . . . . . . . . . . . . . . . . . . . . . . . . . . . . . . . . . . . . . . . . . . . . . . . . . . . . . . . . . . . . . . . . . . . . . . . . . . . . . . . . . . . . . . . . . . . . . . . . . . . . . . . . . . . . . . . . . . . . . . . . . . . . . . . . . . . . . . . . . . . . . . . . . . . . . . . . . . . . . . . . . . . . . . . . . . . . . . . . . . . . . . . . . . .
Notes: a Agriculture; forestry. b Manufacturing; mining; handicrafts; construction. c Trade,transport, communications; public and private services; housing.Sources: See text.
European Review of Economic History

Growth and stagnation in the Habsburg Empire
Table A. Indices of manufacturing production in Austria ( prices, � ).
Food Iron Engin. Metalw. Energy Textiles Constr. Totalmats.
. . . . . . . . . . . . . . . . . . . . . . . . . . . . . . . . . . . . . . . . . . . . . . . . . . . . . . . . . . . . . . . . . . . . . . . . . . . . . . . . . . . . . . . . . . . . . . . . . . . . . . . . . . . . . . . . . . . . . . . . . . . . . . . . . . . . . . . . . . . . . . . . . . . . . . . . . . . . . . . . . . . . . . . . . . . . . . . . . . . . . . . . . . . . . . . . . . . . . . . . . . . . . . . . . . . . . . . . . . . . . . . . . . . . . . . . . . . . . . . . . . . . . . . . . . . . . . . . . . . . . . . . . . . . . . . . . . . . . . . . . . . . . . . . . . . . . . . . . . . . . . . . . . . . . . . . . . . . . . . . . . . . . . . . . . . . . . . . . . . . . . . . . . . . . . . .
Notes: Food: weighted index of beer, sugar, tobacco, spirits, flour, and other food-processing; Iron:weighted index of iron smelting and refining; Engineering: weighted index of mechanical engineering,transport engineering, electrical engineering, instruments and apparatus; Metalworking: index offerrous metalworking; Energy: weighted index of petroleum, electricity generation, fuel and light;Textiles: weighted index of cotton, woollen, linen textiles; Construction materials: weightedconstruction index; Total: includes also residual other manufacturing not listed separately.Sources: See text.

Table A. Indices of manufacturing production in Hungary (prices, � ).
Food Iron Engin. Metalw. Textiles Const. TotalMats.
. . . . . . . . . . . . . . . . . . . . . . . . . . . . . . . . . . . . . . . . . . . . . . . . . . . . . . . . . . . . . . . . . . . . . . . . . . . . . . . . ., . . . . . . . . . . . . . . . . . . . . . . . . . . . . . . . . . . . . . . . . . . . . . . . . . . . . . . . . . . . . . . . . . . . . . . . . . . . . . . . . . . . . . . . . . . . . . . . . . . . . . . . . . . . . . . . . . . . . . . . . . . . . . . . . . . . . . . . . . . . . . . . . . . . . . . . . . . . . . . . . . . . . . . . . . . . . . . . . . . . . . . . . . . . . . . . . . . . . . . . . . . . . . . . . . . . . . . . . . . . . . . . . . . .
Notes: Food: weighted index of beer, sugar, tobacco, spirits, flour, and other food-processing; Iron: weighted index of iron smelting and refining; Engineering: weighted indexof mechanical engineering, transport engineering, electrical engineering, instruments andapparatus; Metalworking: index of ferrous metalworking; Textiles: weighted index of cottonand woollen textiles; Construction materials: weighted construction index; Total: includesalso electricity generation and residual other manufacturing not listed separately.Sources: See text.
European Review of Economic History