MAVEN Science Results - NASA · MAVEN Science Results Bruce Jakosky LASP / University of Colorado...
28
MAVEN Science Results Bruce Jakosky LASP / University of Colorado MEPAG meeting, 3 March 2016 NOTE ADDED BY JPL WEBMASTER: This content has not been approved or adopted by, NASA, JPL, or the California Institute of Technology. This document is being made available for information purposes only, and any views and opinions expressed herein do not necessarily state or reflect those of NASA, JPL, or the California Institute of Technology.
Transcript of MAVEN Science Results - NASA · MAVEN Science Results Bruce Jakosky LASP / University of Colorado...

MAVEN Science Results
Bruce Jakosky
LASP / University of Colorado
MEPAG meeting, 3 March 2016
NOTE ADDED BY JPL WEBMASTER: This content has not been approved or adopted by,
NASA, JPL, or the California Institute of Technology. This document is being made available for
information purposes only, and any views and opinions expressed herein do not necessarily
state or reflect those of NASA, JPL, or the California Institute of Technology.
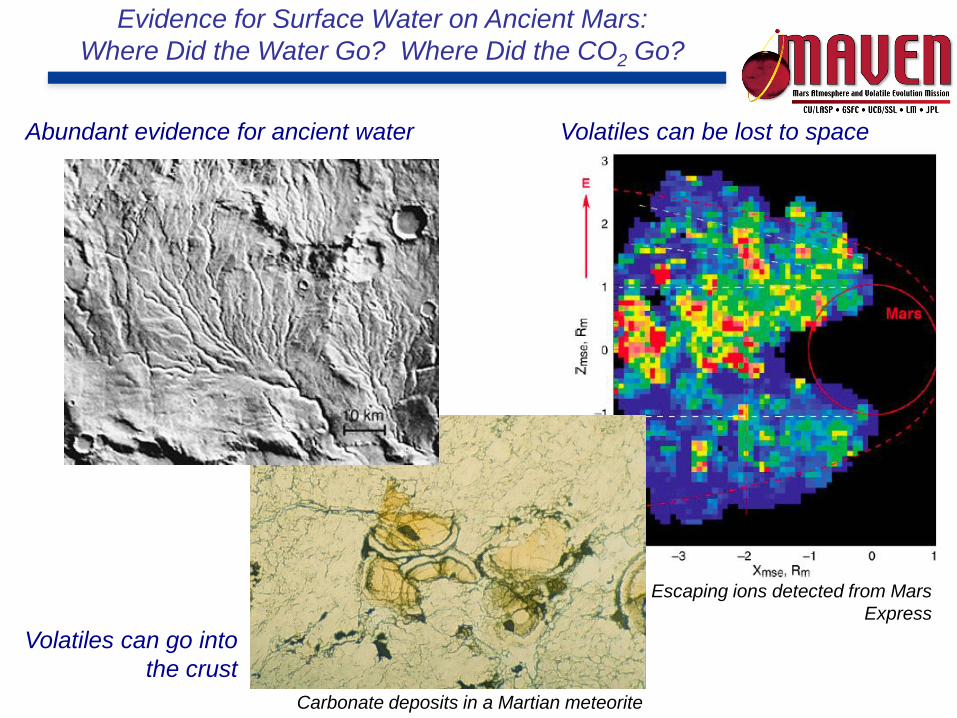
Evidence for Surface Water on Ancient Mars:
Where Did the Water Go? Where Did the CO2 Go?
Volatiles can go into
the crust
Volatiles can be lost to space
Carbonate deposits in a Martian meteorite
Abundant evidence for ancient water
Escaping ions detected from Mars
Express

MAVEN Explores Escape of Atmospheric Gases to Space
• Measure energetic drivers from the Sun, response of upper atmosphere
and ionosphere, and resulting escape to space
• Understand the key processes involved, allowing extrapolation to loss
over Mars history

Basic Structure of the Mars Atmosphere
• The Mars upper atmosphere is an extension of the lower atmosphere
• Dynamical mixing between the two allows each to affect the other

Processes Leading to Escape in the Mars Upper
Atmosphere*
* Shorthand for Mars upper atmosphere, ionosphere, solar-wind interactions, and the
consequent loss of gas to space
What controls the behavior of the Mars upper atmosphere, and
how do processes there lead to loss of gas to space?

MAVEN Coverage of Processes in the Mars Upper
Atmosphere
What controls the behavior of the Mars upper atmosphere, and
how do processes there lead to loss of gas to space?
* Shorthand for Mars upper atmosphere, ionosphere, solar-wind interactions, and the
consequent loss of gas to space

Composition and Structure of the Ionosphere
Ion densities mapped out by NGIMS, between 150-500 km altitude, shown as a
function of solar zenith angle (but divided into dawn and dusk sides). Sun is to the
right.
(Benna et al. 2016)
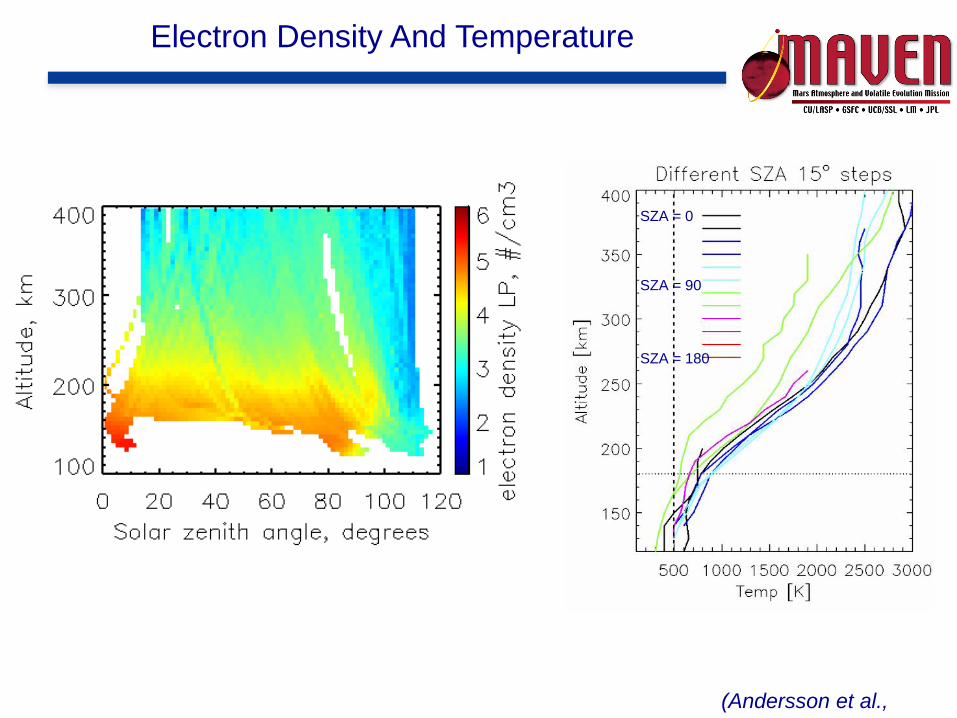
Electron Density And Temperature
(Andersson et al.,
2016)
SZA = 90
SZA = 180
SZA = 0

Discovery of Metal-Ion Layer in Ionosphere
Mass ~55-60 (Fe+)
Energy
Mass (
am
u)
O2+ straggling
O2+ background
O2+ sputtering
O2+
NGIMSSTATIC
IUVS
(McFadden et al., Benna et al., Schneider et al.)

Discovery of Dust Cloud Surrounding Mars,
Observed by LPW
Dust-impact signature
And in the lab:At Mars:
Observed distribution of dust impacts:
(Andersson et al. 2015)

IUVS Detection of Diffuse Aurora
• “Christmas lights” aurora observed for
five days on 18-23 December 2014
• Nightside emission at same wavelengths
as dayglow; characteristic of aurora in
general and of those observed by Mars
Express
• Diffuse distribution throughout northern
hemisphere; no connection to magnetic
anomalies
(Schneider et al. 2015)

Temperature Profiles – Surface To 180 km
Temperature [K]
Alt
itu
de
[km
]
Campaign #3: UMa (1)
MCD: MY 26
T of CO
IUVS: -26.43 E, -57.10 N, 2.38 hrs
MCS: -36.07 E, -53.83 N, 2.26 hrs
MCS: -37.00 E, -57.60 N, 2.21 hrs
Temperatures derived from density
profiles from MAVEN NGIMS and
IUVS data
MAVEN temperatures
combined with MRO MCS
temperature profiles
(Gröller et al. 2016)

Mars Ozone Observed By IUVS
(Lefevre et al. 2016)

IUVS Observations of Atomic Components of H2O
and CO2 on Their Way to Escaping

Hydrogen Distribution and Escape
• Hydrogen distribution not modeled well by single-component, spherically
symmetric model
• Radiative-transfer degeneracy in terms of number density and temperature
• Analysis ongoing in order to derive unique density profile and infer escape
rate
(Chaffin et al. 2015)

Observed Variations in Coronal D and
H
• H and D appear to vary by an order of magnitude throughout mission to date
• Not predicted by any model, not understood at present
• Translates directly into variation of H and D escape rates(Clarke et al. 2016)

O 130.4 nm Brightness Profiles
Thermal
Population
Non-Thermal
Population
≈1.1 eV
1 orbit 5 orbits 48 orbits
(Deighan et al. 2016)

Ion Escape Driven by the Solar Wind
• Accumulation of all data shows that polar plume is a substantial and
stable feature
• Accounts for significant fraction of total escape
O+ fluxes
z-M
SE
x-MSE
(Dong et al. 2015)

Total Escaping Flux
++
• Ion escape rate ~ 3 x 1024 s-1, or ~100 g/s
• Not expected to be constant through time(Brain et al. 2015)

Determining the Effects of Solar Storms
EUV irradiance
SEP energy
SWIA Energy
Btot
• Three solar events occurred, on March 1st, 6th, then 8th
• March 8 event was largest, but complicated by preceding events
• Flare and CME also observed by SOHO
• Examine energy input, atmospheric response (Jakosky et al. 2015)

Increased Dynamic Pressure of Solar Wind
Highest dynamic
pressure thus far

Aurora Triggered by Both Events
…and compared to the earlier “Christmas lights” aurora

Enhanced Loss Resulting From ICME
• Limited geographic coverage during ICME precludes unique
determination of total escape, integrated over all angles
• Measurements indicate minimal change to tailward flux, and significant
enhancement of flux on sunward side

Loss Resulting From Sputtering
Energy spectrum of precipitating ions from
STATIC (blue) and SWIA (red)
Spatial distribution of sputtered ion flux
MAVEN sputtering estimate (red dot)
superimposed on Luhmann et al.
model of escape history
(Leblanc et al. 2015)

Ratio of 38Ar/36Ar Provides Integrated Sputtering
Loss to Space (1 of 2)
Representative Orbit:
Exobase and Homopause Altitudes:
Homopause Altitude:
(Ma
ha
ffy
et
al. 2
01
5;
Ja
ko
sky,
Slip
ski, A
lsa
ee
d2016)
Diffusive separation above homopause enriches 36Ar relative to 38Ar at exobase,
such that sputtering loss preferentially removes the lighter isotope.

Fractional 36Ar loss derived from measurements:
Black, calculated assuming simple Rayleigh distillation
Red, incorporating supply/loss from impacts, outgassing, and crustal erosion.
49 % (~52%)
54% (~55%)
61% (~63%)
69% (~78%)79% (~85%)90% (~93%)
44% loss (~47%)
Ratio of 38Ar/36Ar Provides Integrated Sputtering
Loss to Space (2 of 2)

MAVEN’s Primary Mission Occurs on the Declining Phase of
the Solar Cycle
MAVEN
Primary
Mission

MAVEN Status Summary
• The MAVEN spacecraft and instruments are operating nominally and are
providing high-quality data.
• MAVEN is defining the basic characteristics of the Mars upper-atmosphere /
ionosphere / magnetosphere system, escape rates at the present epoch,
and the processes controlling them.
• Results tell us that loss to space was a major mechanism for the changes in
the Mars atmosphere and climate through time.
• Primary mission was completed mid-November, 2015; initial results were
published in November in Science and GRL.
• Continuing observations are allowing us to understand behavior through a
Mars year and with variations in the solar-cycle drivers.