
Mauritian ICT-BPO Salary Survey 2012
33
Mauritius 2012 PUBLIC REPORT (Full report only available for participants) ICT Sector Remuneration Survey Highlights
-
Upload
hoangtuong -
Category
Documents
-
view
224 -
download
6
Transcript of Mauritian ICT-BPO Salary Survey 2012
Mauritius
2012
PUBLIC REPORT
(Full report only available
for participants)
ICT Sector Remuneration Survey Highlights
2012 Mauritius ICT Sector Remuneration Survey Highlights
Public Report
Prepared by
CAPFOR Mauritius
Level 3, Somerset House 23, Dr Eugène Laurent Street
Port Louis Ile Maurice
T: +230 208 80 90 F: +230 208 56 24 [email protected]
GROUPE CAPFOR
90, avenue des Champs Elysées 75008 Paris,
France T : + 33 (0) 1 56 43 50 05 F: +33 (0) 1 56 43 50 25
www.capfor.com
May 2013
Shape the future of your organisation
through your people…
SPECIALIST IN STRATEGY AND HUMAN RESOURCES SINCE 1972
Prepared by CAPFOR
1 BACKGROUND TO THE REMUNERATION SURVEY ----------------------------------------- 1
1.1 INTRODUCTION ------------------------------------------------------------------------------------11.1 ACKNOWLEDGEMENT -----------------------------------------------------------------------------11.2 DISCLAIMER ---------------------------------------------------------------------------------------1
2 THE ICT SECTOR ------------------------------------------------------------------------- 2
2.1 THE ICT SECTOR IN MAURITIUS ------------------------------------------------------------------22.2 INTERNATIONAL CONTEXT-------------------------------------------------------------------------3
3 INTRODUCTION TO THE 2012 ICT BPO REMUNERATION SURVEY ---------------------- 6
3.1 TOTAL REMUNERATION ---------------------------------------------------------------------------63.2 POSITIONS AND FUNCTIONS SURVEYED-----------------------------------------------------------63.3 REWARD PRACTICES-------------------------------------------------------------------------------63.4 PROFILE OF PARTICIPATING ORGANISATIONS------------------------------------------------------73.5 PROFILE OF INCUMBENTS--------------------------------------------------------------------------10
4 IT SECTOR ---------------------------------------------------------------------------------12
4.1 INTRODUCTION ------------------------------------------------------------------------------------124.2 REMUNERATION TABLES (SUMMARY) ------------------------------------------------------------124.3 SUMMARY CHART ---------------------------------------------------------------------------------144.4 EMPLOYMENT AND REWARD PRACTICES (EXTRACTS) --------------------------------------------15
5 BPO (NON VOICE BASED BPO SERVICES) SECTOR -------------------------------------19
5.1 INTRODUCTION ------------------------------------------------------------------------------------195.2 REMUNERATION TABLES (SUMMARY) ------------------------------------------------------------195.3 SUMMARY CHART ---------------------------------------------------------------------------------215.4 EMPLOYMENT AND REWARD PRACTICES (EXTRACTS) --------------------------------------------22
6 CALL CENTRE (VOICE BASED BPO SERVICES) SECTOR ----------------------------------26
6.1 INTRODUCTION ------------------------------------------------------------------------------------266.2 REMUNERATION TABLES (SUMMARY) ------------------------------------------------------------266.3 EMPLOYMENT AND REWARD PRACTICES (EXTRACTS) --------------------------------------------27
Contents
2012 ICT (IT, BPO and Call Centre) Remuneration Survey - Public Report - Page 1
1 BACKGROUND TO THE REMUNERATION SURVEY
1.1 INTRODUCTION
This document is an extract of the full report provided to the participating organisations based onthe results of the 2012 Mauritius ICT BPO Salary Survey.
This survey was conducted by CAPFOR under the aegis of:
CCIFM (Chambre de Commerce et d’Industrie France Maurice) OTAM (Outsourcing and Telecommunications Association of Mauritius) MITIA (Mauritius IT Industry Association), and MEF (Mauritius Employers’ Federation).
The objective of this document is to provide stakeholders of the ICT sector with an overview ofremuneration levels and reward practices of the sector. Remuneration is one of the parameters toconsider to allow for a sustainable development of the sector and to make it the main pillar of theMauritian economy for the benefits of all stakeholders. These stakeholders are employers andemployees, new investors and institutions promoting the sector such as the BOI (Board ofInvestment) and NCB (national Computer Board).
This is the third edition of the Mauritius ICT BPO Salary Survey conducted by CAPFOR. The 2012Remuneration Survey was carried out between September 2012 and December 2012. Replies werereceived from 38 participating organisations operating in the ICT and BPO Sector employing morethan 6,264 employees classified in 153 benchmark positions and 10 main job families.
1.1 ACKNOWLEDGEMENT
CAPFOR Mauritius would like to thank CCIFM, OTAM, MITIA and MEF for having given their utmosthelp and support to make a success of this remuneration survey.
Our thanks also go to each and every participating company for their time, efforts and cooperationin providing the necessary data/information for the survey.
1.2 DISCLAIMER
Every effort has been made to ensure the accuracy of the information published in this report.However the data is provided “as-is,” without any warranty of any kind. It is understood that theauthor cannot be held responsible for any errors or omissions, or for any loss or damage of any kindincurred as a result of the use of this report.
2012 ICT (IT, BPO and Call Centre) Remuneration Survey - Public Report - Page 2
2 THE ICT SECTOR
2.1 THE ICT SECTOR IN MAURITIUS
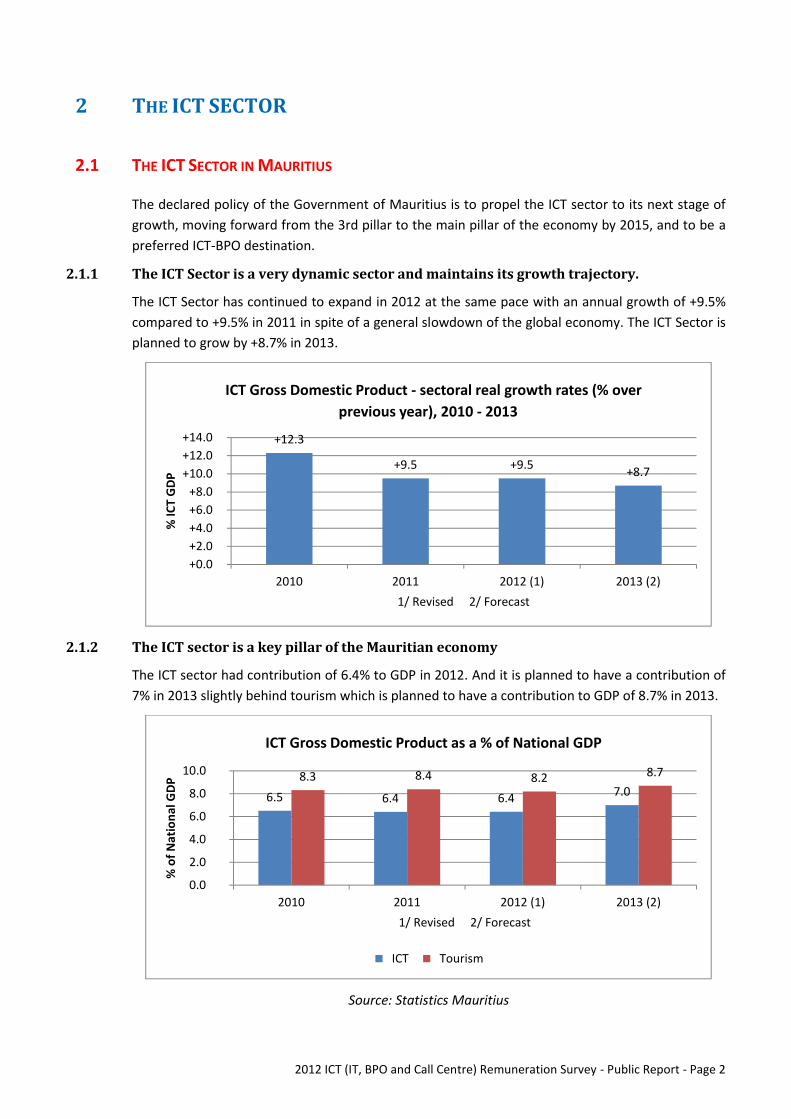
The declared policy of the Government of Mauritius is to propel the ICT sector to its next stage ofgrowth, moving forward from the 3rd pillar to the main pillar of the economy by 2015, and to be apreferred ICT-BPO destination.
2.1.1 The ICT Sector is a very dynamic sector and maintains its growth trajectory.
The ICT Sector has continued to expand in 2012 at the same pace with an annual growth of +9.5%compared to +9.5% in 2011 in spite of a general slowdown of the global economy. The ICT Sector isplanned to grow by +8.7% in 2013.
2.1.2 The ICT sector is a key pillar of the Mauritian economy
The ICT sector had contribution of 6.4% to GDP in 2012. And it is planned to have a contribution of7% in 2013 slightly behind tourism which is planned to have a contribution to GDP of 8.7% in 2013.
Source: Statistics Mauritius
+12.3
+9.5 +9.5 +8.7
+0.0+2.0+4.0+6.0+8.0
+10.0+12.0+14.0
2010 2011 2012 (1) 2013 (2)
% IC
T GD
P
1/ Revised 2/ Forecast
ICT Gross Domestic Product - sectoral real growth rates (% overprevious year), 2010 - 2013
6.5 6.4 6.4 7.08.3 8.4 8.2 8.7
0.0
2.0
4.0
6.0
8.0
10.0
2010 2011 2012 (1) 2013 (2)
% o
f Nat
iona
l GDP
1/ Revised 2/ Forecast
ICT Gross Domestic Product as a % of National GDP
ICT Tourism
2012 ICT (IT, BPO and Call Centre) Remuneration Survey - Public Report - Page 3
2.2 INTERNATIONAL CONTEXT
2.2.1 World BPO market to grow at 5.9% per year through 2017
Mauritius is competing with other offshoring services locations all over the world to attractorganisations to move their BPO activities to the Island and have a share of the world BPO Market.
It was estimated by Gartner, an international market research firm, that the world BPO market willreach US$250 billion by 2015. Gartner's 1Q13 forecast shows that BPO will grow 5.8% in 2013.However, the five-year compound annual growth rate through 2017 for worldwide BPO is forecastto be 5.9%.
2.2.2 Mauritius as one of the top thirty locations for offshore IT services
Gartner has identified Mauritius as one of the top thirty locations for offshore IT services.Gartner's top 30 locations for offshore services, alphabetically by region, are:
America Asia/Pacific Europe and theMiddle East Africa
1. Argentina,2. Brazil,3. Chile,4. Colombia,5. Costa Rica,6. Mexico,7. Peru and8. Uruguay
9. Bangladesh,10. China,11. India,12. Indonesia,13. Malaysia,14. Philippines,15. Sri Lanka,16. Thailand17. Vietnam
18. Belarus,19. Bulgaria,20. Czech Republic,21. Hungary,22. Poland,23. Romania,24. Russia,25. Slovakia,26. Turkey27. Ukraine
28. Mauritius,29. Morocco,30. South Africa,
Source: Gartner (September 2012)
However, Gartner says that alternative offshore locations for IT Services are emerging as globaldelivery models evolve. In particular additional locations with potential for offshore services inAfrica are Algeria, Egypt, Ghana, Kenya, Madagascar, Nigeria, Senegal, Tunisia and Uganda.
The A.T. Kearney Global Services Location Index measures the attractiveness of 50 countries fordelivering Information Technology (IT), Business Process Outsourcing (BPO) and voice services. Theranking is done by assessing the potential of each country across three major categories: financialattractiveness, people skills and availability and business environment. The top three countries,India, China and Malaysia have remained first, second and third since the inception of the Index in2003. In 2011 Mauritius was ranked 36th compared to 30th in 2009.
Rank Country (Africa) Total Score
4 Egypt 5.8123 Tunisia 5.2327 Ghana 5.1829 Senegal 5.1236 Mauritius 4.9837 Morocco 4.9645 South Africa 4.57
2012 ICT (IT, BPO and Call Centre) Remuneration Survey - Public Report - Page 4
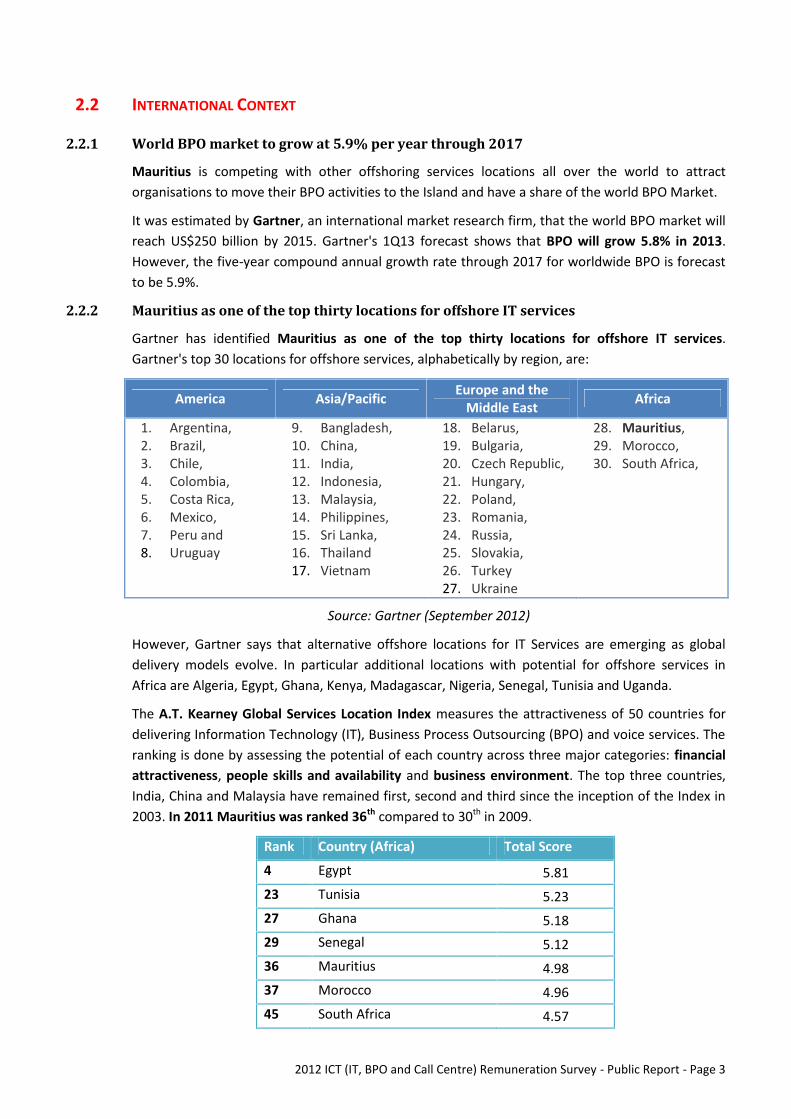
A more detailed analysis of each total score is given in the graph below.
Source: The A.T. Kearney Global Services Location Index, 2011
Note: the weight distribution between the three factors is 40:30:30. Financial attractiveness is ratedon a scale of 0 to 4, and the categories for people skills and availability, and business environmentare on a scale of 0 to 3. Higher scores indicate higher levels of attractiveness.
2.2.3 Pay and productivity
Using the A.T. Kearney Global Services Location Index, 2011 it appears that Mauritius was ranked30th in terms of Financial attractiveness. Vietnam has the highest score in this category. Financialattractiveness is made of three subcategories, namely, compensation costs, infrastructure costsand tax and regulatory costs. The compensation costs subcategory is measured by taking intoaccount average wages and median compensation costs for relevant positions (call centrerepresentatives, BPO analysts, IT programmers and local operation managers).
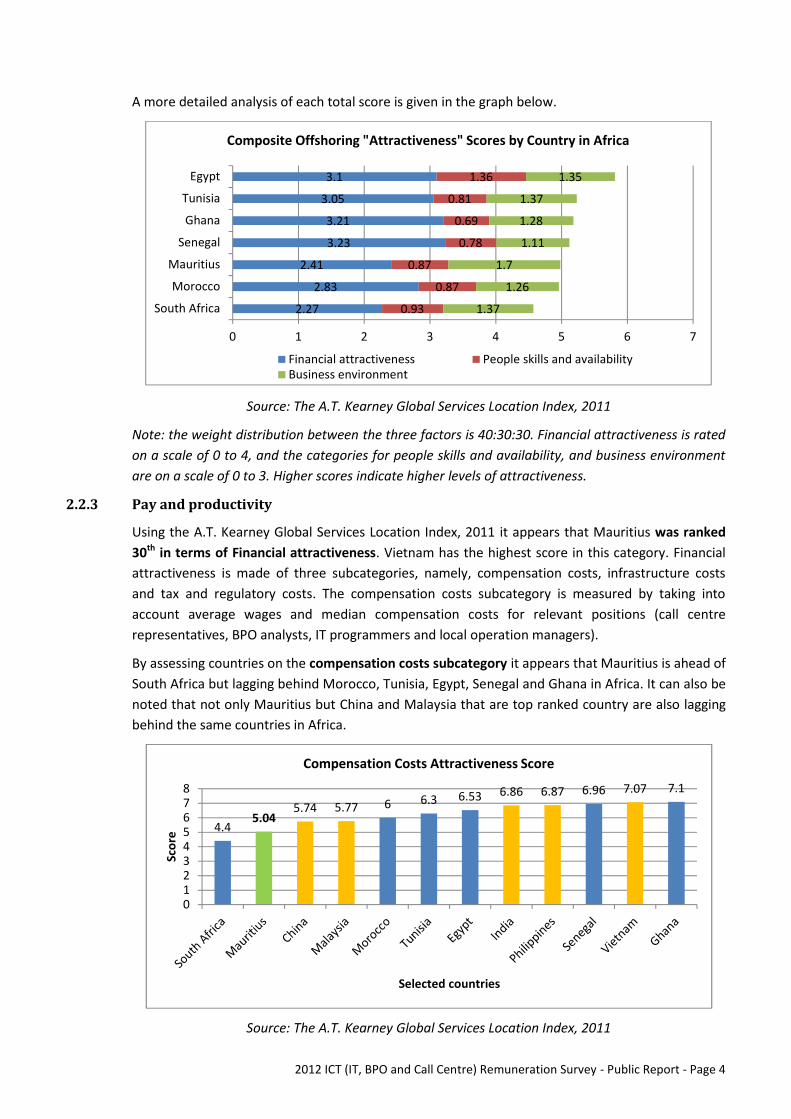
By assessing countries on the compensation costs subcategory it appears that Mauritius is ahead ofSouth Africa but lagging behind Morocco, Tunisia, Egypt, Senegal and Ghana in Africa. It can also benoted that not only Mauritius but China and Malaysia that are top ranked country are also laggingbehind the same countries in Africa.
Source: The A.T. Kearney Global Services Location Index, 2011
2.27
2.83
2.41
3.23
3.21
3.05
3.1
0.93
0.87
0.87
0.78
0.69
0.81
1.36
1.37
1.26
1.7
1.11
1.28
1.37
1.35
0 1 2 3 4 5 6 7
South Africa
Morocco
Mauritius
Senegal
Ghana
Tunisia
Egypt
Composite Offshoring "Attractiveness" Scores by Country in Africa
Financial attractiveness People skills and availabilityBusiness environment
4.45.04
5.74 5.77 6 6.3 6.53 6.86 6.87 6.96 7.07 7.1
012345678
Scor
e
Selected countries
Compensation Costs Attractiveness Score
2012 ICT (IT, BPO and Call Centre) Remuneration Survey - Public Report - Page 5
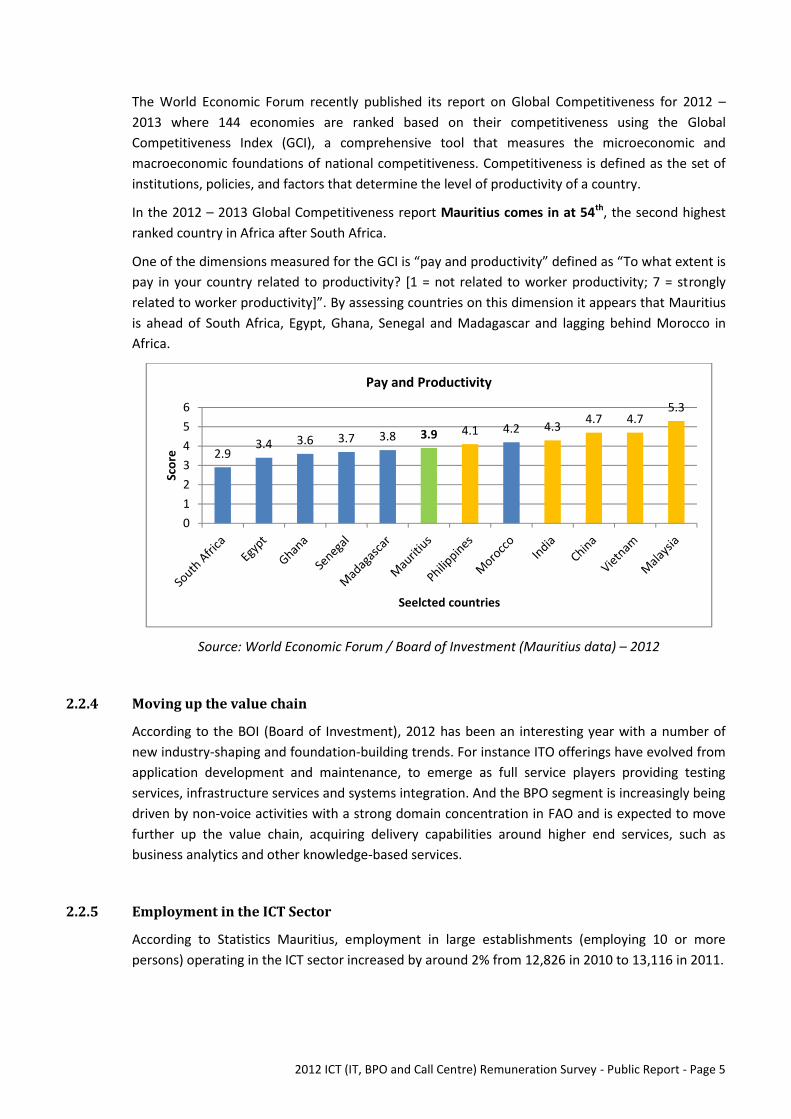
The World Economic Forum recently published its report on Global Competitiveness for 2012 –2013 where 144 economies are ranked based on their competitiveness using the GlobalCompetitiveness Index (GCI), a comprehensive tool that measures the microeconomic andmacroeconomic foundations of national competitiveness. Competitiveness is defined as the set ofinstitutions, policies, and factors that determine the level of productivity of a country.
In the 2012 – 2013 Global Competitiveness report Mauritius comes in at 54th, the second highestranked country in Africa after South Africa.
One of the dimensions measured for the GCI is “pay and productivity” defined as “To what extent ispay in your country related to productivity? [1 = not related to worker productivity; 7 = stronglyrelated to worker productivity]”. By assessing countries on this dimension it appears that Mauritiusis ahead of South Africa, Egypt, Ghana, Senegal and Madagascar and lagging behind Morocco inAfrica.
Source: World Economic Forum / Board of Investment (Mauritius data) – 2012
2.2.4 Moving up the value chain
According to the BOI (Board of Investment), 2012 has been an interesting year with a number ofnew industry-shaping and foundation-building trends. For instance ITO offerings have evolved fromapplication development and maintenance, to emerge as full service players providing testingservices, infrastructure services and systems integration. And the BPO segment is increasingly beingdriven by non-voice activities with a strong domain concentration in FAO and is expected to movefurther up the value chain, acquiring delivery capabilities around higher end services, such asbusiness analytics and other knowledge-based services.
2.2.5 Employment in the ICT Sector
According to Statistics Mauritius, employment in large establishments (employing 10 or morepersons) operating in the ICT sector increased by around 2% from 12,826 in 2010 to 13,116 in 2011.
2.93.4 3.6 3.7 3.8 3.9 4.1 4.2 4.3 4.7 4.7
5.3
0123456
Scor
e
Seelcted countries
Pay and Productivity
2012 ICT (IT, BPO and Call Centre) Remuneration Survey - Public Report - Page 6
3 INTRODUCTION TO THE 2012 ICT BPO REMUNERATION SURVEY
3.1 TOTAL REMUNERATION
In the participant report, CAPFOR's Total Remuneration Survey results provide you withcomprehensive information on compensation and benefits. The Total Remuneration package ismade up of four components: base salary, guaranteed cash, total cash and total remunerationbroken down into more than 35 remuneration elements. It has been designed to provide decisionmakers with relevant and reliable data to ensure their reward packages remain cost effective andcompetitive in the market place. In this document, summarised remuneration tables are given onlyfor base salaries at entry and median points.
3.2 POSITIONS AND FUNCTIONS SURVEYED
The 2012 ICT BPO Remuneration Survey covers more than 150 benchmark positions, from seniormanagement to the administrative level, in the following functions:
ICT Job Family BPO Job familyAdministration Human ResourcesFinance Quality AssuranceCommunications Sales and MarketingSupply and Logistics Executive
3.3 REWARD PRACTICES
In the participant report comprehensive information are provided on the current employment andremuneration practices of participating organisations. 15 main employment practice areas havebeen studied covering more than 180 dimensions. A breakdown of the employment practice areasis shown below:
1. WORKING PATTERNS2. ANNUAL LEAVE3. SICK LEAVE4. OTHER LEAVES5. BASE-PAY POLICIES6. PERFORMANCE, BONUSES, INCENTIVES AND RECOGNITION7. CAR BENEFITS8. WELLNESS, HEALTH CARE, DISABILITY AND DEATH BENEFITS9. RETIREMENT BENEFITS10. OVERSEAS TRAVEL BENEFITS / PASSAGE BENEFITS11. LOAN BENEFITS12. OTHER BENEFITS13. TALENT ACQUISITION AND RETENTION14. DEVELOPMENT AND CAREER OPPORTUNITIES15. REWARD STRATEGY AND EVALUATION.
A few examples extracted from the participant report are given in this document.
2012 ICT (IT, BPO and Call Centre) Remuneration Survey - Public Report - Page 7
3.4 PROFILE OF PARTICIPATING ORGANISATIONS
3.4.1 List of participants
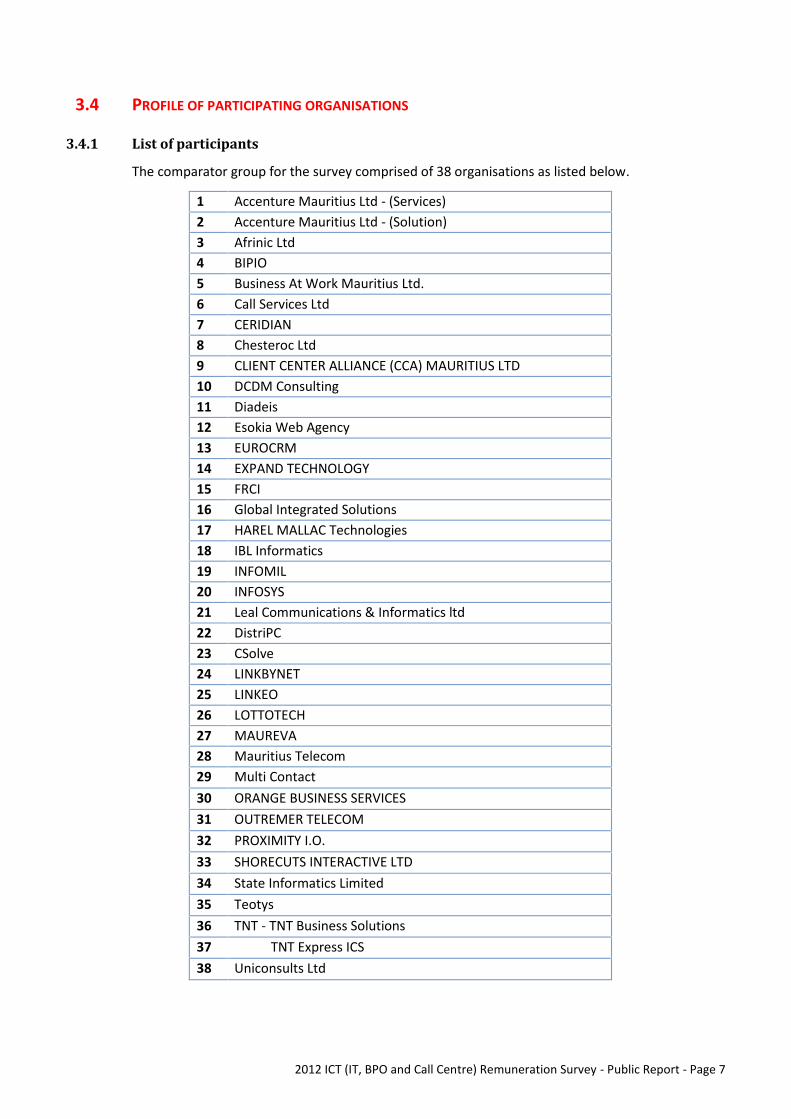
The comparator group for the survey comprised of 38 organisations as listed below.
1 Accenture Mauritius Ltd - (Services)2 Accenture Mauritius Ltd - (Solution)3 Afrinic Ltd4 BIPIO5 Business At Work Mauritius Ltd.6 Call Services Ltd7 CERIDIAN8 Chesteroc Ltd9 CLIENT CENTER ALLIANCE (CCA) MAURITIUS LTD10 DCDM Consulting11 Diadeis12 Esokia Web Agency13 EUROCRM14 EXPAND TECHNOLOGY15 FRCI16 Global Integrated Solutions17 HAREL MALLAC Technologies18 IBL Informatics19 INFOMIL20 INFOSYS21 Leal Communications & Informatics ltd22 DistriPC23 CSolve24 LINKBYNET25 LINKEO26 LOTTOTECH27 MAUREVA28 Mauritius Telecom29 Multi Contact30 ORANGE BUSINESS SERVICES31 OUTREMER TELECOM32 PROXIMITY I.O.33 SHORECUTS INTERACTIVE LTD34 State Informatics Limited35 Teotys36 TNT - TNT Business Solutions37 TNT Express ICS38 Uniconsults Ltd
2012 ICT (IT, BPO and Call Centre) Remuneration Survey - Public Report - Page 8
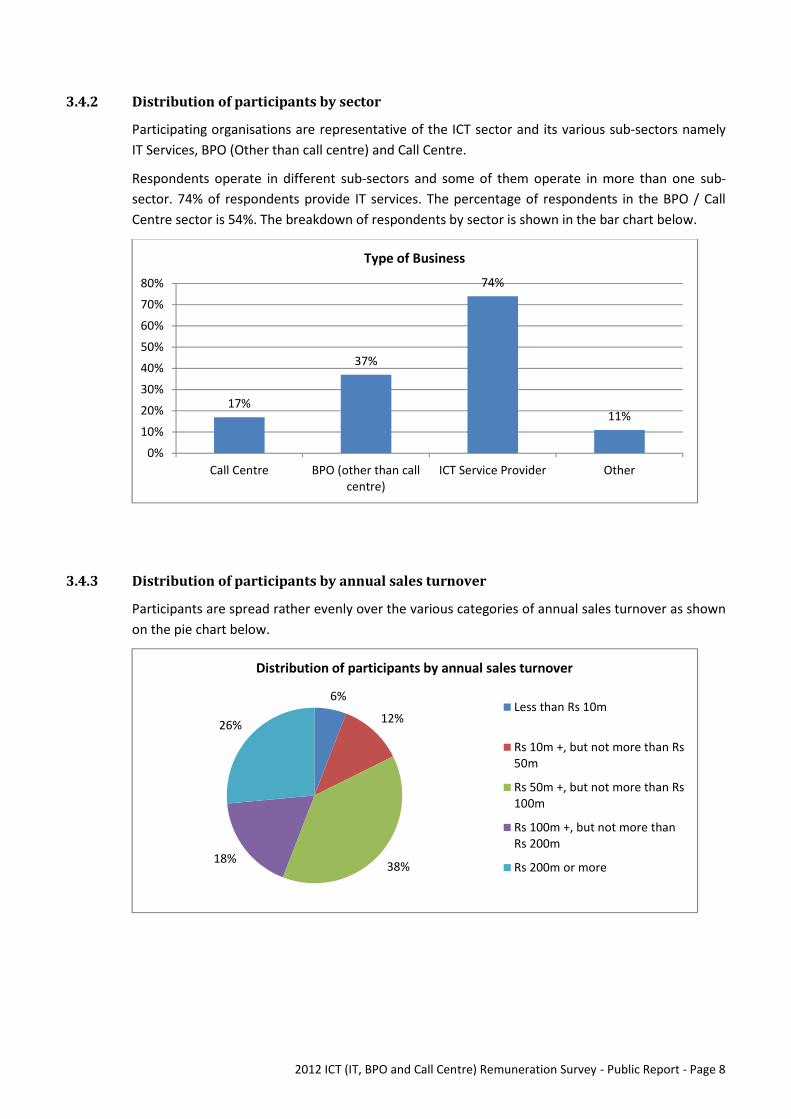
3.4.2 Distribution of participants by sector
Participating organisations are representative of the ICT sector and its various sub-sectors namelyIT Services, BPO (Other than call centre) and Call Centre.
Respondents operate in different sub-sectors and some of them operate in more than one sub-sector. 74% of respondents provide IT services. The percentage of respondents in the BPO / CallCentre sector is 54%. The breakdown of respondents by sector is shown in the bar chart below.
3.4.3 Distribution of participants by annual sales turnover
Participants are spread rather evenly over the various categories of annual sales turnover as shownon the pie chart below.
17%
37%
74%
11%
0%
10%
20%
30%
40%
50%
60%
70%
80%
Call Centre BPO (other than callcentre)
ICT Service Provider Other
Type of Business
6%
12%
38%18%
26%
Distribution of participants by annual sales turnover
Less than Rs 10m
Rs 10m +, but not more than Rs50m
Rs 50m +, but not more than Rs100m
Rs 100m +, but not more thanRs 200m
Rs 200m or more
2012 ICT (IT, BPO and Call Centre) Remuneration Survey - Public Report - Page 9
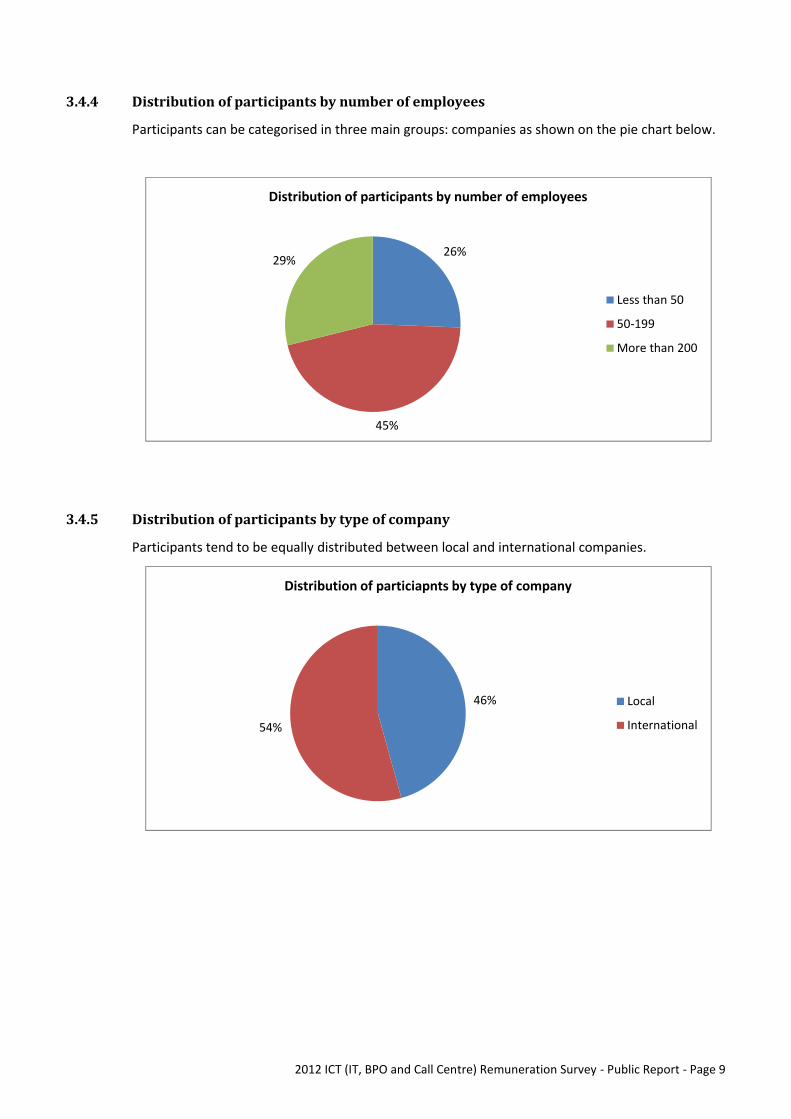
3.4.4 Distribution of participants by number of employees
Participants can be categorised in three main groups: companies as shown on the pie chart below.
3.4.5 Distribution of participants by type of company
Participants tend to be equally distributed between local and international companies.
26%
45%
29%
Distribution of participants by number of employees
Less than 50
50-199
More than 200
46%
54%
Distribution of particiapnts by type of company
Local
International
2012 ICT (IT, BPO and Call Centre) Remuneration Survey - Public Report - Page 10
3.5 PROFILE OF INCUMBENTS
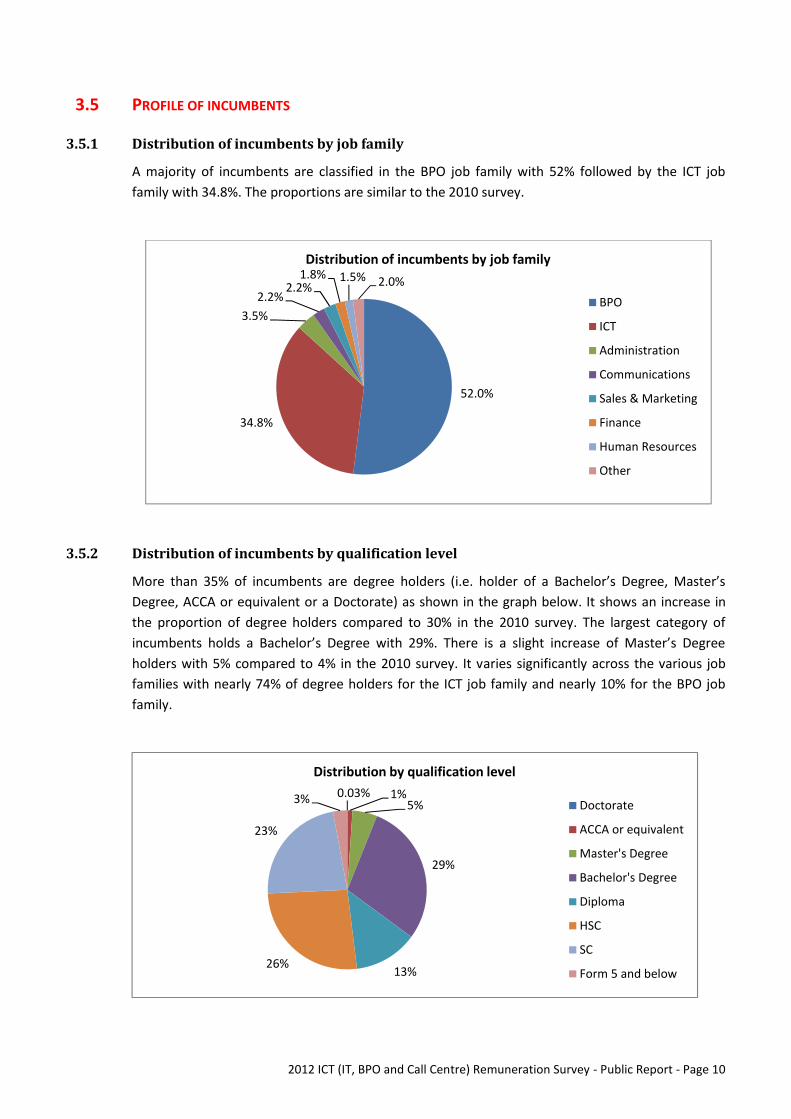
3.5.1 Distribution of incumbents by job family
A majority of incumbents are classified in the BPO job family with 52% followed by the ICT jobfamily with 34.8%. The proportions are similar to the 2010 survey.
3.5.2 Distribution of incumbents by qualification level
More than 35% of incumbents are degree holders (i.e. holder of a Bachelor’s Degree, Master’sDegree, ACCA or equivalent or a Doctorate) as shown in the graph below. It shows an increase inthe proportion of degree holders compared to 30% in the 2010 survey. The largest category ofincumbents holds a Bachelor’s Degree with 29%. There is a slight increase of Master’s Degreeholders with 5% compared to 4% in the 2010 survey. It varies significantly across the various jobfamilies with nearly 74% of degree holders for the ICT job family and nearly 10% for the BPO jobfamily.
52.0%
34.8%
3.5%2.2%
2.2%1.8% 1.5% 2.0%
Distribution of incumbents by job family
BPO
ICT
Administration
Communications
Sales & Marketing
Finance
Human Resources
Other
0.03% 1%5%
29%
13%26%
23%
3%
Distribution by qualification level
Doctorate
ACCA or equivalent
Master's Degree
Bachelor's Degree
Diploma
HSC
SC
Form 5 and below
2012 ICT (IT, BPO and Call Centre) Remuneration Survey - Public Report - Page 11
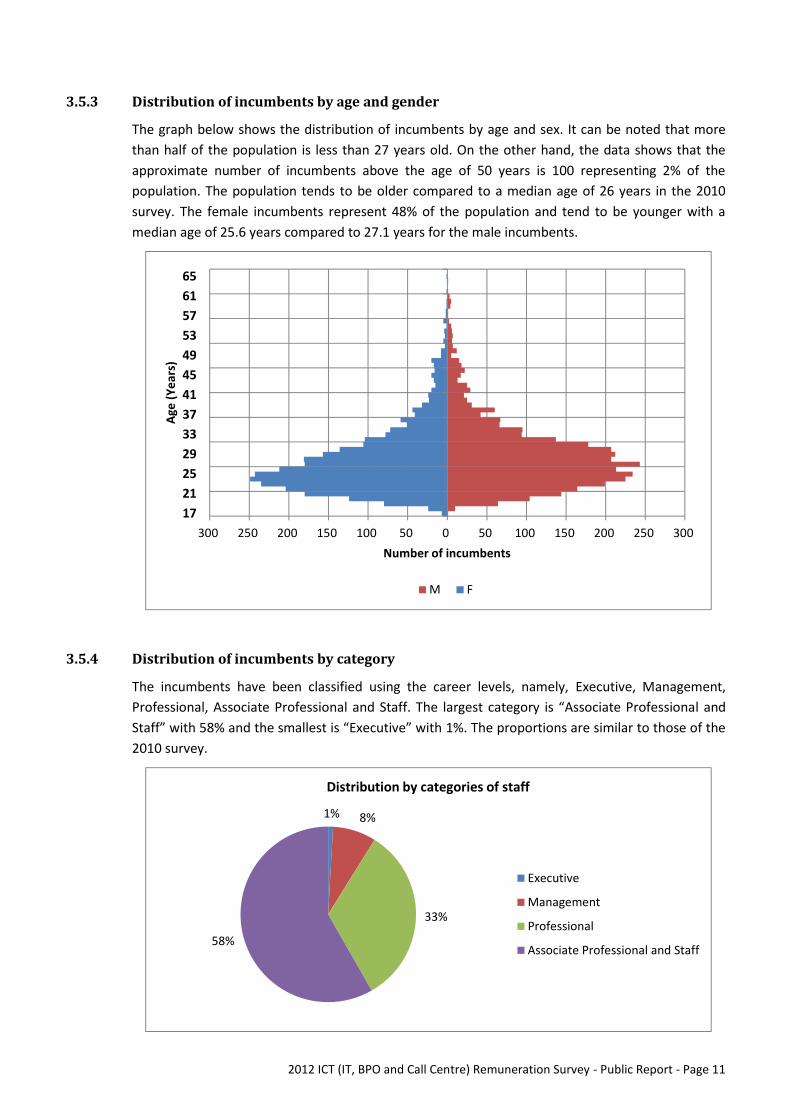
3.5.3 Distribution of incumbents by age and gender
The graph below shows the distribution of incumbents by age and sex. It can be noted that morethan half of the population is less than 27 years old. On the other hand, the data shows that theapproximate number of incumbents above the age of 50 years is 100 representing 2% of thepopulation. The population tends to be older compared to a median age of 26 years in the 2010survey. The female incumbents represent 48% of the population and tend to be younger with amedian age of 25.6 years compared to 27.1 years for the male incumbents.
3.5.4 Distribution of incumbents by category
The incumbents have been classified using the career levels, namely, Executive, Management,Professional, Associate Professional and Staff. The largest category is “Associate Professional andStaff” with 58% and the smallest is “Executive” with 1%. The proportions are similar to those of the2010 survey.
300 250 200 150 100 50 0 50 100 150 200 250 30017212529333741454953576165
Number of incumbents
Age
(Yea
rs)
M F
1% 8%
33%
58%
Distribution by categories of staff
Executive
Management
Professional
Associate Professional and Staff
2012 ICT (IT, BPO and Call Centre) Remuneration Survey - Public Report - Page 12
4 IT SECTOR
4.1 INTRODUCTION
Summarised remuneration tables have been given for the following positions:
Junior Developer Développeur Junior Application development Team Lead Chef de Projet Technique
Junior IT Infrastructure Engineer Ingénieur Infrastructure Informatique Junior
IT Infrastructure Team Lead Chef d’équipe Infrastructure Informatique
Note: the median salary is the salary for which 50% of incumbents are paid below and 50% ofincumbents are paid above this salary.
4.2 REMUNERATION TABLES (SUMMARY)
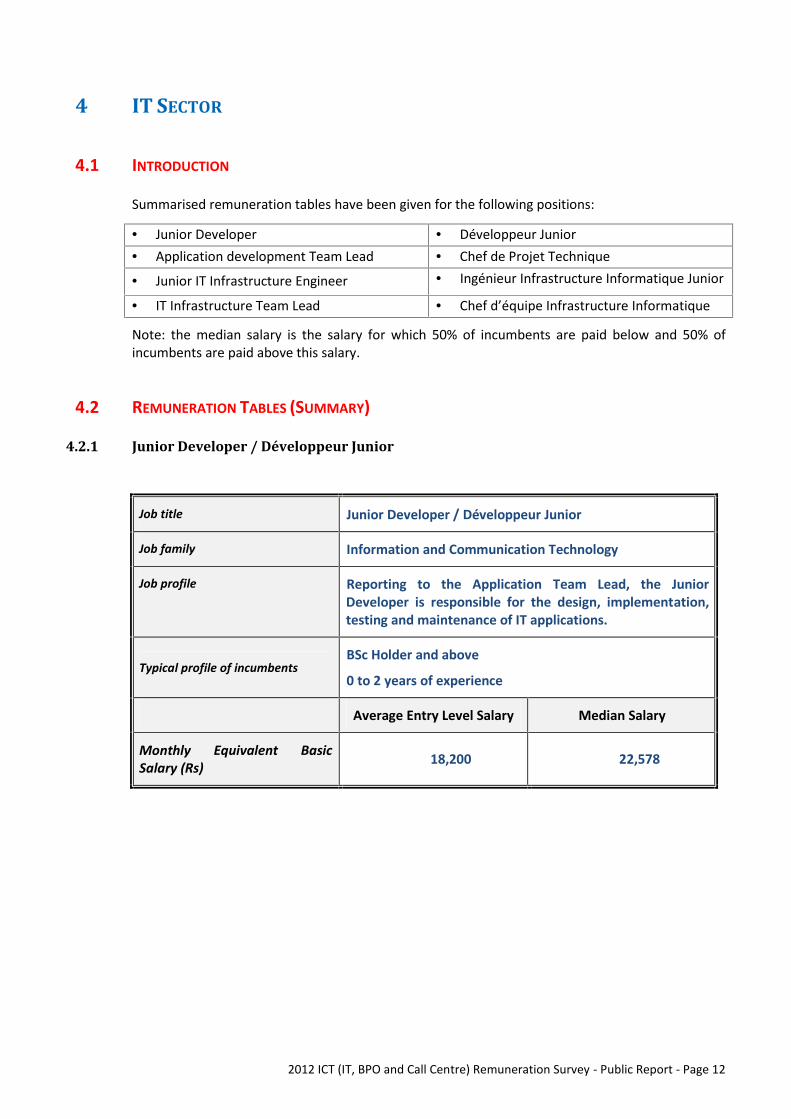
4.2.1 Junior Developer / Développeur Junior
Job title Junior Developer / Développeur Junior
Job family Information and Communication Technology
Job profile Reporting to the Application Team Lead, the JuniorDeveloper is responsible for the design, implementation,testing and maintenance of IT applications.
Typical profile of incumbentsBSc Holder and above
0 to 2 years of experience
Average Entry Level Salary Median Salary
Monthly Equivalent BasicSalary (Rs) 18,200 22,578
2012 ICT (IT, BPO and Call Centre) Remuneration Survey - Public Report - Page 13
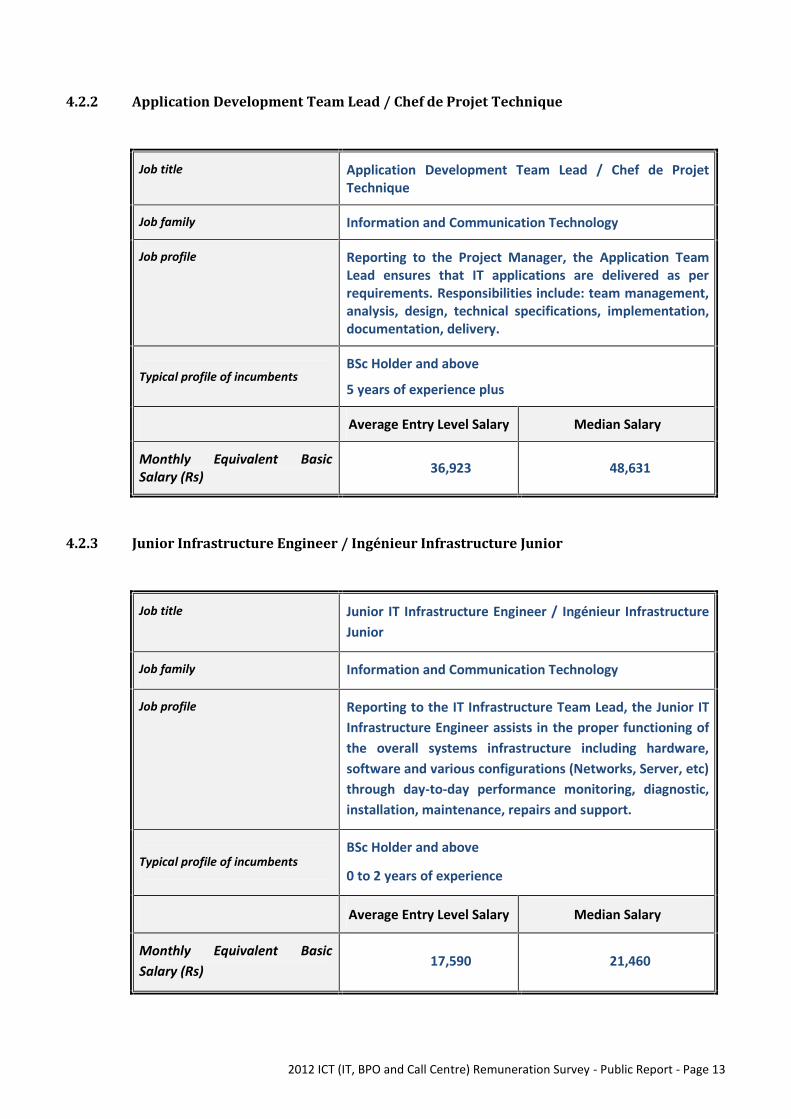
4.2.2 Application Development Team Lead / Chef de Projet Technique
Job title Application Development Team Lead / Chef de ProjetTechnique
Job family Information and Communication Technology
Job profile Reporting to the Project Manager, the Application TeamLead ensures that IT applications are delivered as perrequirements. Responsibilities include: team management,analysis, design, technical specifications, implementation,documentation, delivery.
Typical profile of incumbentsBSc Holder and above
5 years of experience plus
Average Entry Level Salary Median Salary
Monthly Equivalent BasicSalary (Rs) 36,923 48,631
4.2.3 Junior Infrastructure Engineer / Ingénieur Infrastructure Junior
Job title Junior IT Infrastructure Engineer / Ingénieur InfrastructureJunior
Job family Information and Communication Technology
Job profile Reporting to the IT Infrastructure Team Lead, the Junior ITInfrastructure Engineer assists in the proper functioning ofthe overall systems infrastructure including hardware,software and various configurations (Networks, Server, etc)through day-to-day performance monitoring, diagnostic,installation, maintenance, repairs and support.
Typical profile of incumbentsBSc Holder and above
0 to 2 years of experience
Average Entry Level Salary Median Salary
Monthly Equivalent BasicSalary (Rs)
17,590 21,460
2012 ICT (IT, BPO and Call Centre) Remuneration Survey - Public Report - Page 14
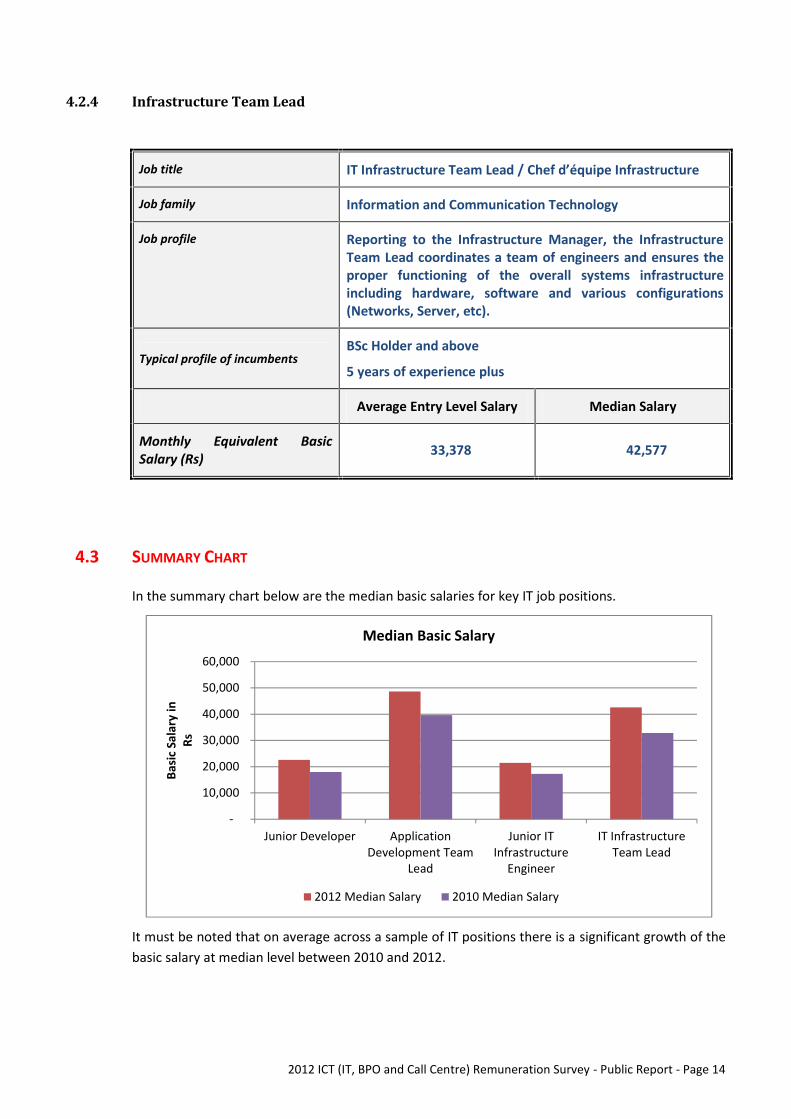
4.2.4 Infrastructure Team Lead
Job title IT Infrastructure Team Lead / Chef d’équipe Infrastructure
Job family Information and Communication Technology
Job profile Reporting to the Infrastructure Manager, the InfrastructureTeam Lead coordinates a team of engineers and ensures theproper functioning of the overall systems infrastructureincluding hardware, software and various configurations(Networks, Server, etc).
Typical profile of incumbentsBSc Holder and above
5 years of experience plus
Average Entry Level Salary Median Salary
Monthly Equivalent BasicSalary (Rs) 33,378 42,577
4.3 SUMMARY CHART
In the summary chart below are the median basic salaries for key IT job positions.
It must be noted that on average across a sample of IT positions there is a significant growth of thebasic salary at median level between 2010 and 2012.
-
10,000
20,000
30,000
40,000
50,000
60,000
Junior Developer ApplicationDevelopment Team
Lead
Junior ITInfrastructure
Engineer
IT InfrastructureTeam Lead
Basic
Sal
ary
inRs
Median Basic Salary
2012 Median Salary 2010 Median Salary
2012 ICT (IT, BPO and Call Centre) Remuneration Survey - Public Report - Page 15
4.4 EMPLOYMENT AND REWARD PRACTICES (EXTRACTS)
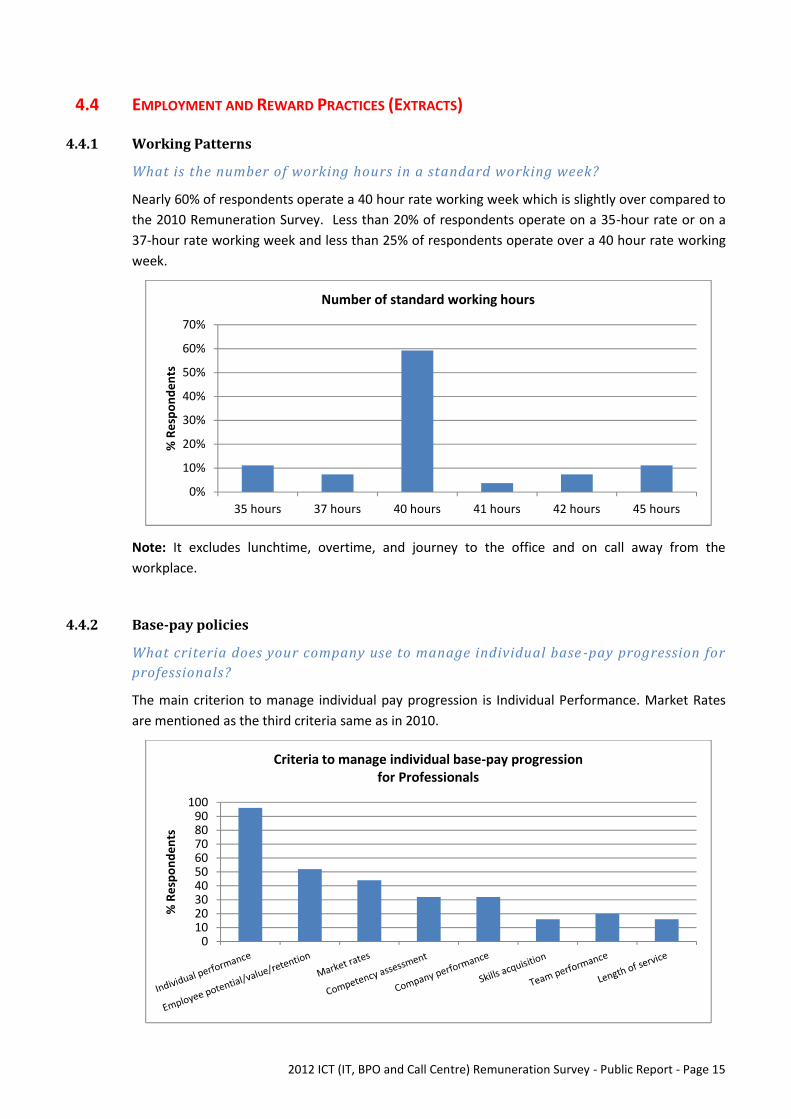
4.4.1 Working Patterns
What is the number of working hours in a standard working week?
Nearly 60% of respondents operate a 40 hour rate working week which is slightly over compared tothe 2010 Remuneration Survey. Less than 20% of respondents operate on a 35-hour rate or on a37-hour rate working week and less than 25% of respondents operate over a 40 hour rate workingweek.
Note: It excludes lunchtime, overtime, and journey to the office and on call away from theworkplace.
4.4.2 Base-pay policies
What criteria does your company use to manage individual base -pay progression forprofessionals?
The main criterion to manage individual pay progression is Individual Performance. Market Ratesare mentioned as the third criteria same as in 2010.
0%
10%
20%
30%
40%
50%
60%
70%
35 hours 37 hours 40 hours 41 hours 42 hours 45 hours
% R
espo
nden
ts
Number of standard working hours
0102030405060708090
100
% R
espo
nden
ts
Criteria to manage individual base-pay progressionfor Professionals
2012 ICT (IT, BPO and Call Centre) Remuneration Survey - Public Report - Page 16
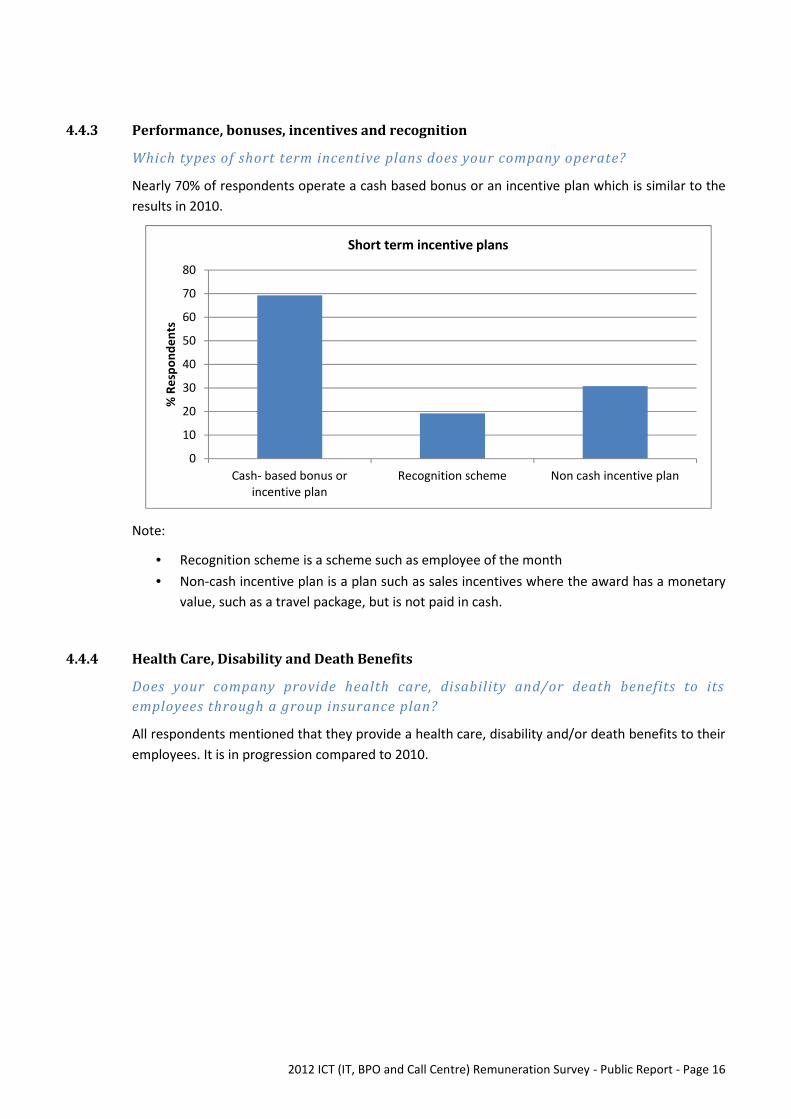
4.4.3 Performance, bonuses, incentives and recognition
Which types of short term incentive plans does your company operate?
Nearly 70% of respondents operate a cash based bonus or an incentive plan which is similar to theresults in 2010.
Note:
Recognition scheme is a scheme such as employee of the month Non-cash incentive plan is a plan such as sales incentives where the award has a monetary
value, such as a travel package, but is not paid in cash.
4.4.4 Health Care, Disability and Death Benefits
Does your company provide health care, disability and/or death benefits to itsemployees through a group insurance plan?
All respondents mentioned that they provide a health care, disability and/or death benefits to theiremployees. It is in progression compared to 2010.
0
10
20
30
40
50
60
70
80
Cash- based bonus orincentive plan
Recognition scheme Non cash incentive plan
% R
espo
nden
ts
Short term incentive plans
2012 ICT (IT, BPO and Call Centre) Remuneration Survey - Public Report - Page 17
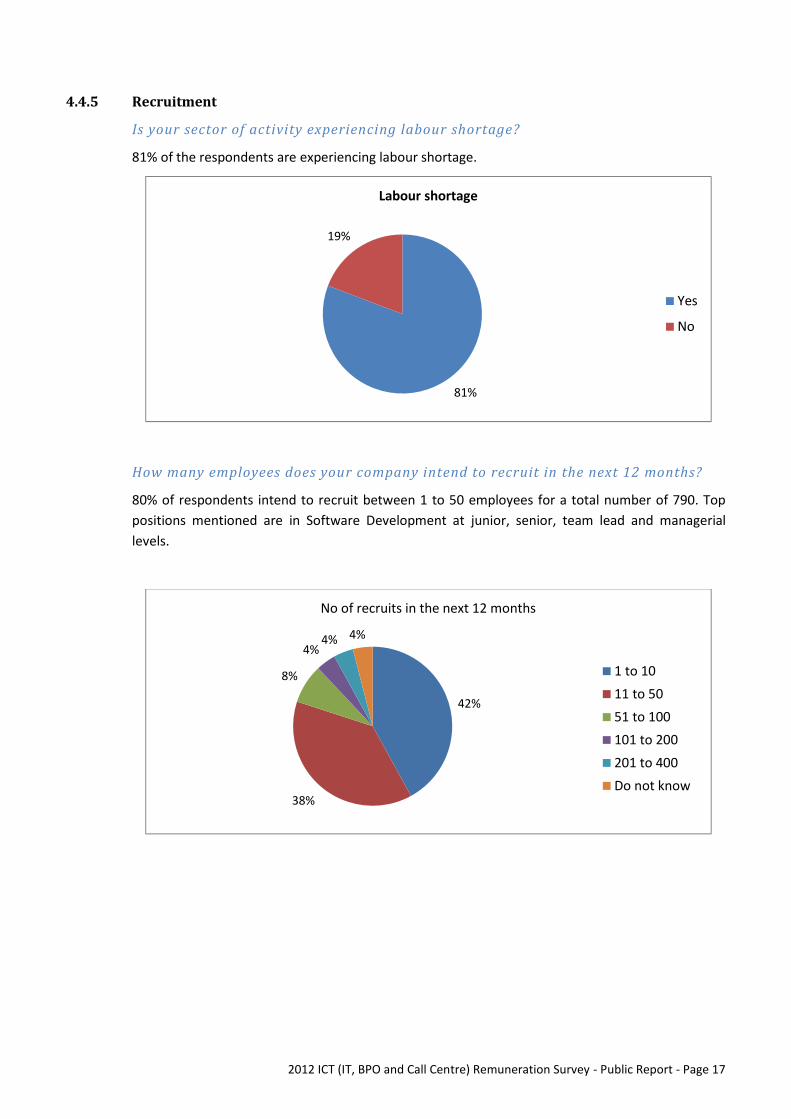
4.4.5 Recruitment
Is your sector of activity experiencing labour shortage?
81% of the respondents are experiencing labour shortage.
How many employees does your company intend to recruit in the next 12 months?
80% of respondents intend to recruit between 1 to 50 employees for a total number of 790. Toppositions mentioned are in Software Development at junior, senior, team lead and manageriallevels.
81%
19%
Labour shortage
Yes
No
42%
38%
8%
4%4% 4%
No of recruits in the next 12 months
1 to 1011 to 5051 to 100101 to 200201 to 400Do not know
2012 ICT (IT, BPO and Call Centre) Remuneration Survey - Public Report - Page 18
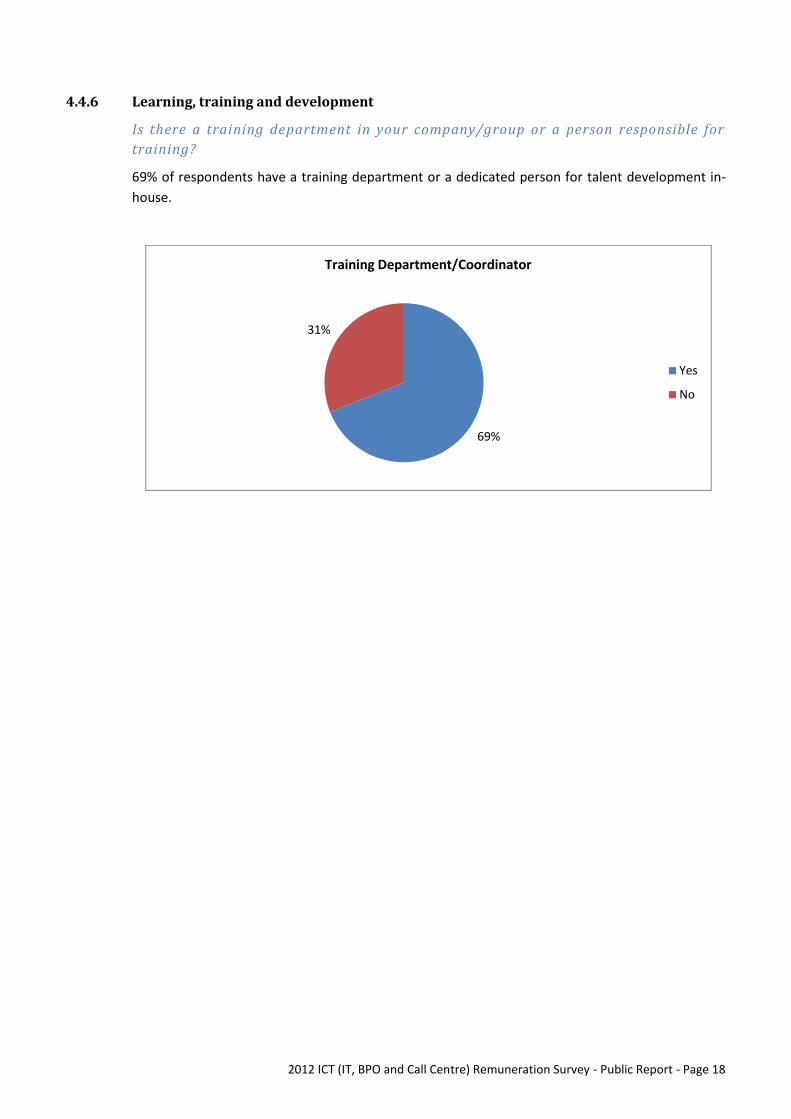
4.4.6 Learning, training and development
Is there a training department in your company/group or a person responsible fortraining?
69% of respondents have a training department or a dedicated person for talent development in-house.
69%
31%
Training Department/Coordinator
Yes
No
2012 ICT (IT, BPO and Call Centre) Remuneration Survey - Public Report - Page 19
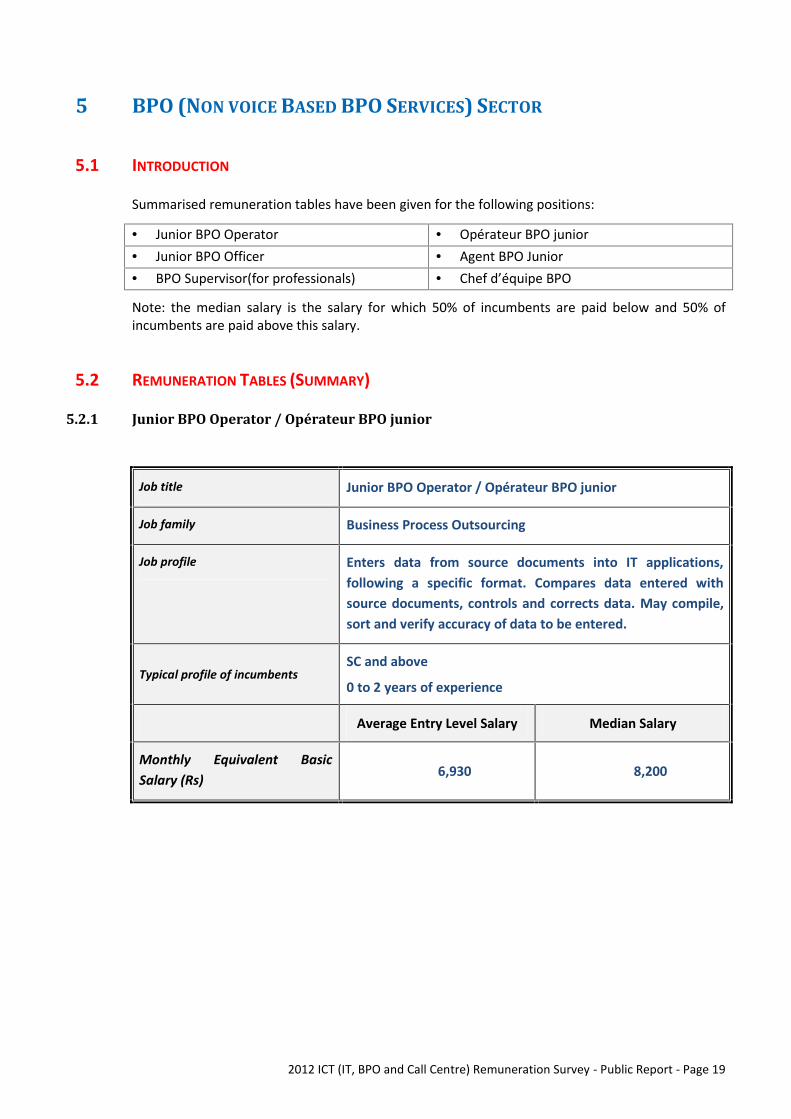
5 BPO (NON VOICE BASED BPO SERVICES) SECTOR
5.1 INTRODUCTION
Summarised remuneration tables have been given for the following positions:
Junior BPO Operator Opérateur BPO junior Junior BPO Officer Agent BPO Junior BPO Supervisor(for professionals) Chef d’équipe BPO
Note: the median salary is the salary for which 50% of incumbents are paid below and 50% ofincumbents are paid above this salary.
5.2 REMUNERATION TABLES (SUMMARY)
5.2.1 Junior BPO Operator / Opérateur BPO junior
Job title Junior BPO Operator / Opérateur BPO junior
Job family Business Process Outsourcing
Job profile Enters data from source documents into IT applications,following a specific format. Compares data entered withsource documents, controls and corrects data. May compile,sort and verify accuracy of data to be entered.
Typical profile of incumbentsSC and above
0 to 2 years of experience
Average Entry Level Salary Median Salary
Monthly Equivalent BasicSalary (Rs) 6,930 8,200
2012 ICT (IT, BPO and Call Centre) Remuneration Survey - Public Report - Page 20
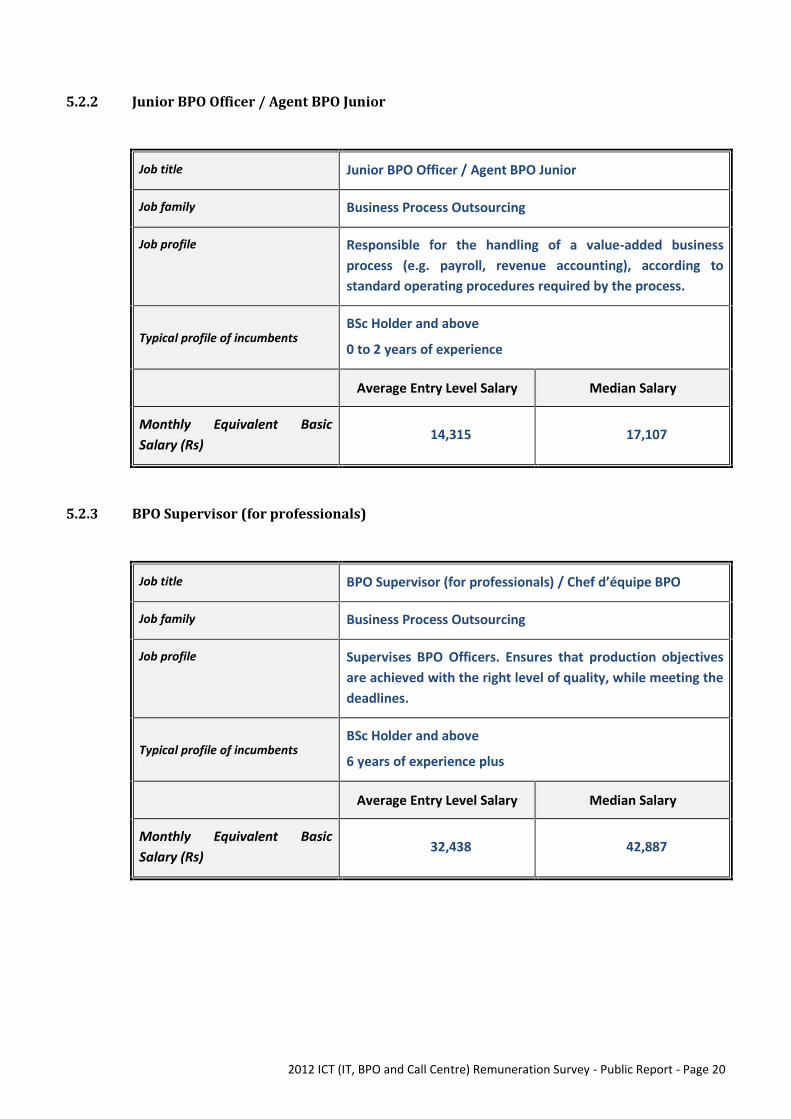
5.2.2 Junior BPO Officer / Agent BPO Junior
Job title Junior BPO Officer / Agent BPO Junior
Job family Business Process Outsourcing
Job profile Responsible for the handling of a value-added businessprocess (e.g. payroll, revenue accounting), according tostandard operating procedures required by the process.
Typical profile of incumbentsBSc Holder and above
0 to 2 years of experience
Average Entry Level Salary Median Salary
Monthly Equivalent BasicSalary (Rs)
14,315 17,107
5.2.3 BPO Supervisor (for professionals)
Job title BPO Supervisor (for professionals) / Chef d’équipe BPO
Job family Business Process Outsourcing
Job profile Supervises BPO Officers. Ensures that production objectivesare achieved with the right level of quality, while meeting thedeadlines.
Typical profile of incumbentsBSc Holder and above
6 years of experience plus
Average Entry Level Salary Median Salary
Monthly Equivalent BasicSalary (Rs)
32,438 42,887
2012 ICT (IT, BPO and Call Centre) Remuneration Survey - Public Report - Page 21
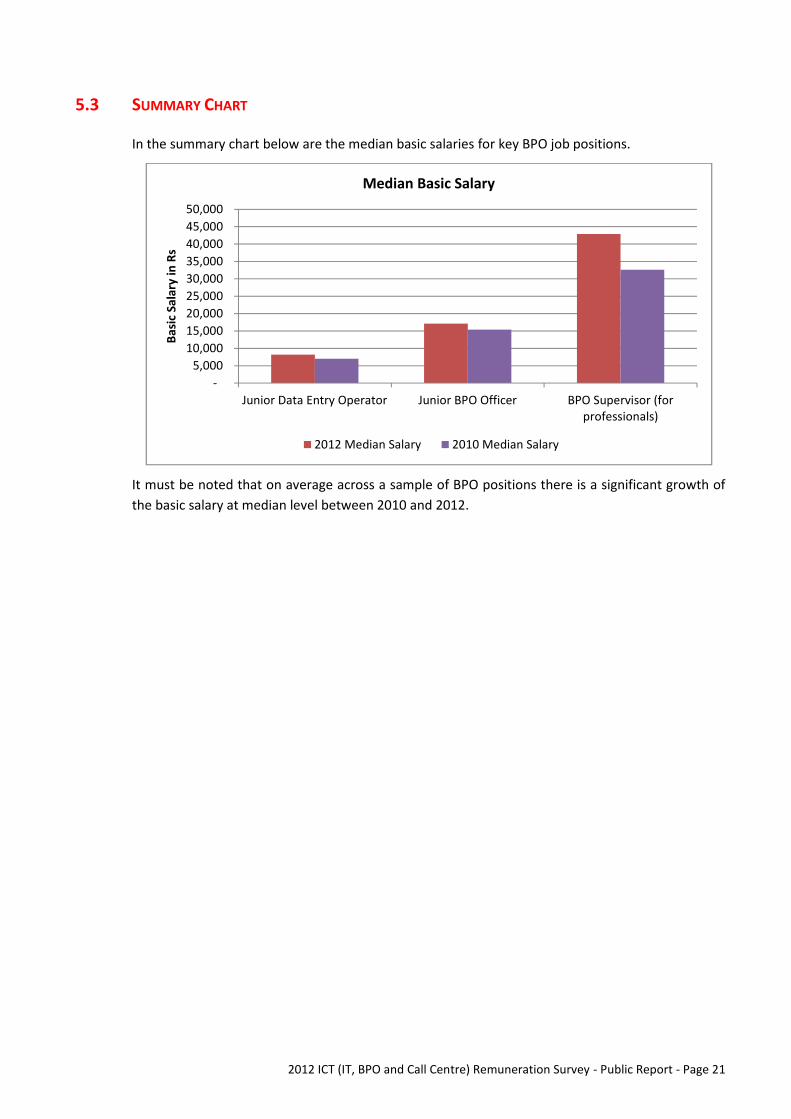
5.3 SUMMARY CHART
In the summary chart below are the median basic salaries for key BPO job positions.
It must be noted that on average across a sample of BPO positions there is a significant growth ofthe basic salary at median level between 2010 and 2012.
- 5,000
10,000 15,000 20,000 25,000 30,000 35,000 40,000 45,000 50,000
Junior Data Entry Operator Junior BPO Officer BPO Supervisor (forprofessionals)
Basic
Sal
ary
in R
sMedian Basic Salary
2012 Median Salary 2010 Median Salary
2012 ICT (IT, BPO and Call Centre) Remuneration Survey - Public Report - Page 22
5.4 EMPLOYMENT AND REWARD PRACTICES (EXTRACTS)
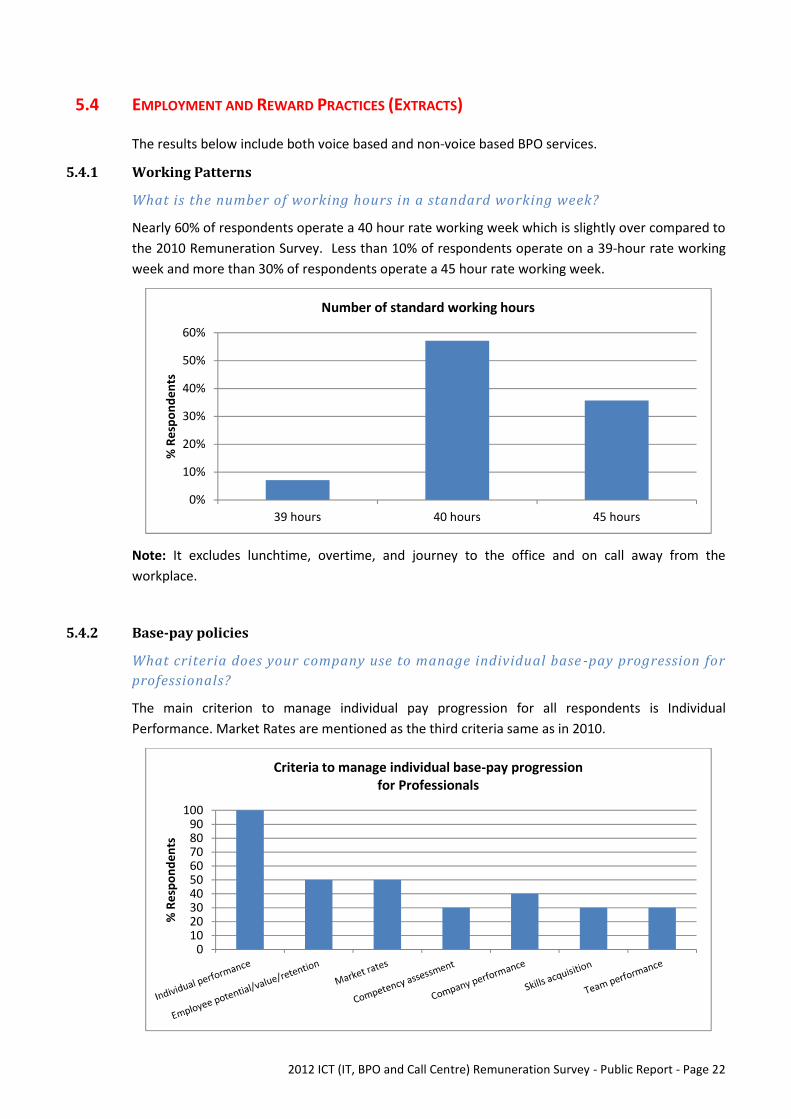
The results below include both voice based and non-voice based BPO services.
5.4.1 Working Patterns
What is the number of working hours in a standard working week?
Nearly 60% of respondents operate a 40 hour rate working week which is slightly over compared tothe 2010 Remuneration Survey. Less than 10% of respondents operate on a 39-hour rate workingweek and more than 30% of respondents operate a 45 hour rate working week.
Note: It excludes lunchtime, overtime, and journey to the office and on call away from theworkplace.
5.4.2 Base-pay policies
What criteria does your company use to manage individual base -pay progression forprofessionals?
The main criterion to manage individual pay progression for all respondents is IndividualPerformance. Market Rates are mentioned as the third criteria same as in 2010.
0%
10%
20%
30%
40%
50%
60%
39 hours 40 hours 45 hours
% R
espo
nden
ts
Number of standard working hours
0102030405060708090
100
% R
espo
nden
ts
Criteria to manage individual base-pay progressionfor Professionals
2012 ICT (IT, BPO and Call Centre) Remuneration Survey - Public Report - Page 23
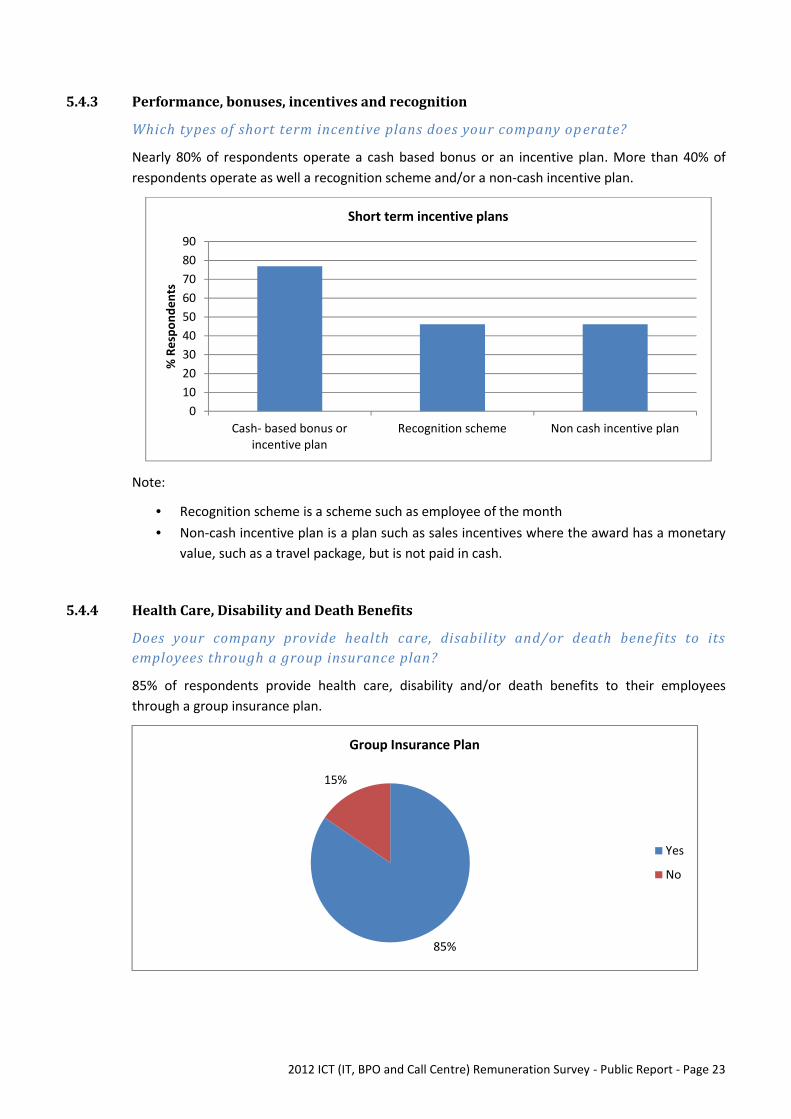
5.4.3 Performance, bonuses, incentives and recognition
Which types of short term incentive plans does your company op erate?
Nearly 80% of respondents operate a cash based bonus or an incentive plan. More than 40% ofrespondents operate as well a recognition scheme and/or a non-cash incentive plan.
Note:
Recognition scheme is a scheme such as employee of the month Non-cash incentive plan is a plan such as sales incentives where the award has a monetary
value, such as a travel package, but is not paid in cash.
5.4.4 Health Care, Disability and Death Benefits
Does your company provide health care, disability and/or death bene fits to itsemployees through a group insurance plan?
85% of respondents provide health care, disability and/or death benefits to their employeesthrough a group insurance plan.
0102030405060708090
Cash- based bonus orincentive plan
Recognition scheme Non cash incentive plan
% R
espo
nden
ts
Short term incentive plans
85%
15%
Group Insurance Plan
Yes
No
2012 ICT (IT, BPO and Call Centre) Remuneration Survey - Public Report - Page 24
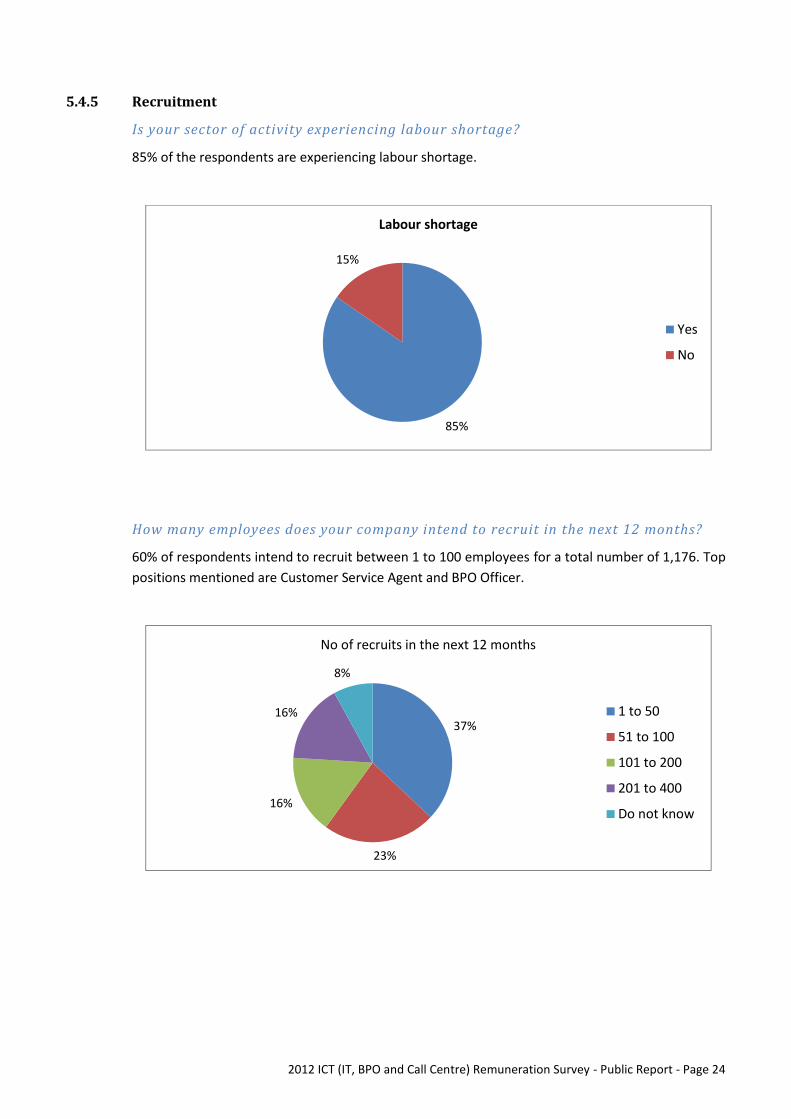
5.4.5 Recruitment
Is your sector of activity experiencing labour shortage?
85% of the respondents are experiencing labour shortage.
How many employees does your company intend to recruit in the next 12 months?
60% of respondents intend to recruit between 1 to 100 employees for a total number of 1,176. Toppositions mentioned are Customer Service Agent and BPO Officer.
85%
15%
Labour shortage
Yes
No
37%
23%
16%
16%
8%
No of recruits in the next 12 months
1 to 50
51 to 100
101 to 200
201 to 400
Do not know

2012 ICT (IT, BPO and Call Centre) Remuneration Survey - Public Report - Page 25
5.4.6 Learning, training and development
Is there a training department in your company/group or a person responsible fortraining?
92% of respondents have a training department or a dedicated person for talent development in-house.
92%
8%
Training Department/Coordinator
Yes
No
2012 ICT (IT, BPO and Call Centre) Remuneration Survey - Public Report - Page 26
6 CALL CENTRE (VOICE BASED BPO SERVICES) SECTOR
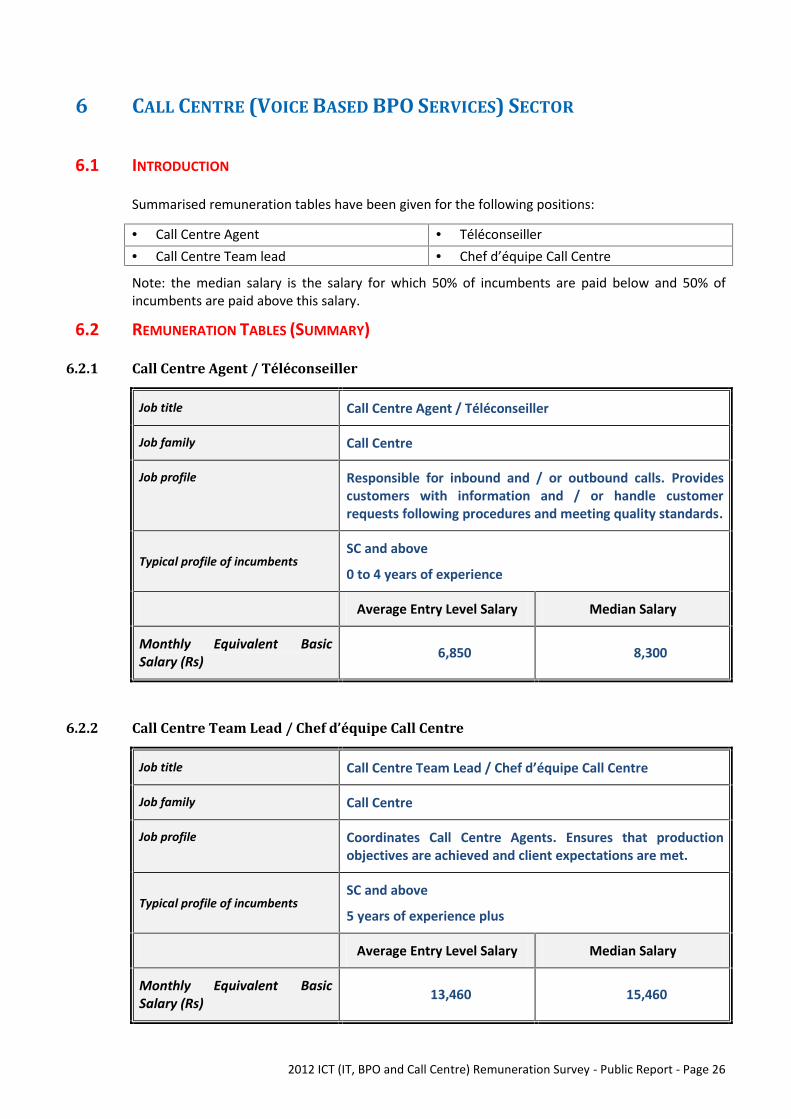
6.1 INTRODUCTION
Summarised remuneration tables have been given for the following positions:
Call Centre Agent Téléconseiller Call Centre Team lead Chef d’équipe Call Centre
Note: the median salary is the salary for which 50% of incumbents are paid below and 50% ofincumbents are paid above this salary.
6.2 REMUNERATION TABLES (SUMMARY)
6.2.1 Call Centre Agent / Téléconseiller
Job title Call Centre Agent / Téléconseiller
Job family Call Centre
Job profile Responsible for inbound and / or outbound calls. Providescustomers with information and / or handle customerrequests following procedures and meeting quality standards.
Typical profile of incumbentsSC and above
0 to 4 years of experience
Average Entry Level Salary Median Salary
Monthly Equivalent BasicSalary (Rs) 6,850 8,300
6.2.2 Call Centre Team Lead / Chef d’équipe Call Centre
Job title Call Centre Team Lead / Chef d’équipe Call Centre
Job family Call Centre
Job profile Coordinates Call Centre Agents. Ensures that productionobjectives are achieved and client expectations are met.
Typical profile of incumbentsSC and above
5 years of experience plus
Average Entry Level Salary Median Salary
Monthly Equivalent BasicSalary (Rs) 13,460 15,460

2012 ICT (IT, BPO and Call Centre) Remuneration Survey - Public Report - Page 27
6.3 EMPLOYMENT AND REWARD PRACTICES (EXTRACTS)
The results below include both voice based and non-voice based BPO services.
6.3.1 Working Patterns
What is the number of working hours in a standard working week?
Nearly 60% of respondents operate a 40 hour rate working week which is slightly over compared tothe 2010 Remuneration Survey. Less than 10% of respondents operate on a 39-hour rate workingweek and more than 30% of respondents operate a 45 hour rate working week.
Note: It excludes lunchtime, overtime, and journey to the office and on call away from theworkplace.
6.3.2 Base-pay policies
What criteria does your company use to manage individual base -pay progression forprofessionals?
The main criterion to manage individual pay progression for all respondents is IndividualPerformance. Market Rates are mentioned as the third criteria same as in 2010.
0%
10%
20%
30%
40%
50%
60%
39 hours 40 hours 45 hours
% R
espo
nden
ts
Number of standard working hours
0102030405060708090
100
% R
espo
nden
ts
Criteria to manage individual base-pay progressionfor Professionals

2012 ICT (IT, BPO and Call Centre) Remuneration Survey - Public Report - Page 28
6.3.3 Performance, bonuses, incentives and recognition
Which types of short term incentive plans does your company operate?
Nearly 80% of respondents operate a cash based bonus or an incentive plan. More than 40% ofrespondents operate as well a recognition scheme and/or a non-cash incentive plan.
Note:
Recognition scheme is a scheme such as employee of the month Non-cash incentive plan is a plan such as sales incentives where the award has a monetary
value, such as a travel package, but is not paid in cash.
6.3.4 Health Care, Disability and Death Benefits
Does your company provide health care, disability and/or death benefits to itsemployees through a group insurance plan?
85% of respondents provide health care, disability and/or death benefits to their employeesthrough a group insurance plan.
0102030405060708090
Cash- based bonus orincentive plan
Recognition scheme Non cash incentive plan
% R
espo
nden
ts
Short term incentive plans
85%
15%
Group Insurance Plan
Yes
No

2012 ICT (IT, BPO and Call Centre) Remuneration Survey - Public Report - Page 29
6.3.5 Recruitment
Is your sector of activity experiencing labour shortage?
85% of the respondents are experiencing labour shortage.
How many employees does your company intend to recruit in the next 12 months?
60% of respondents intend to recruit between 1 to 100 employees for a total number of 1,176. Toppositions mentioned are Customer Service Agent and BPO Officer.
85%
15%
Labour shortage
Yes
No
37%
23%
16%
16%
8%
No of employees intented
1 to 50
51 to 100
101 to 200
201 to 400
Do not know
2012 ICT (IT, BPO and Call Centre) Remuneration Survey - Public Report - Page 30
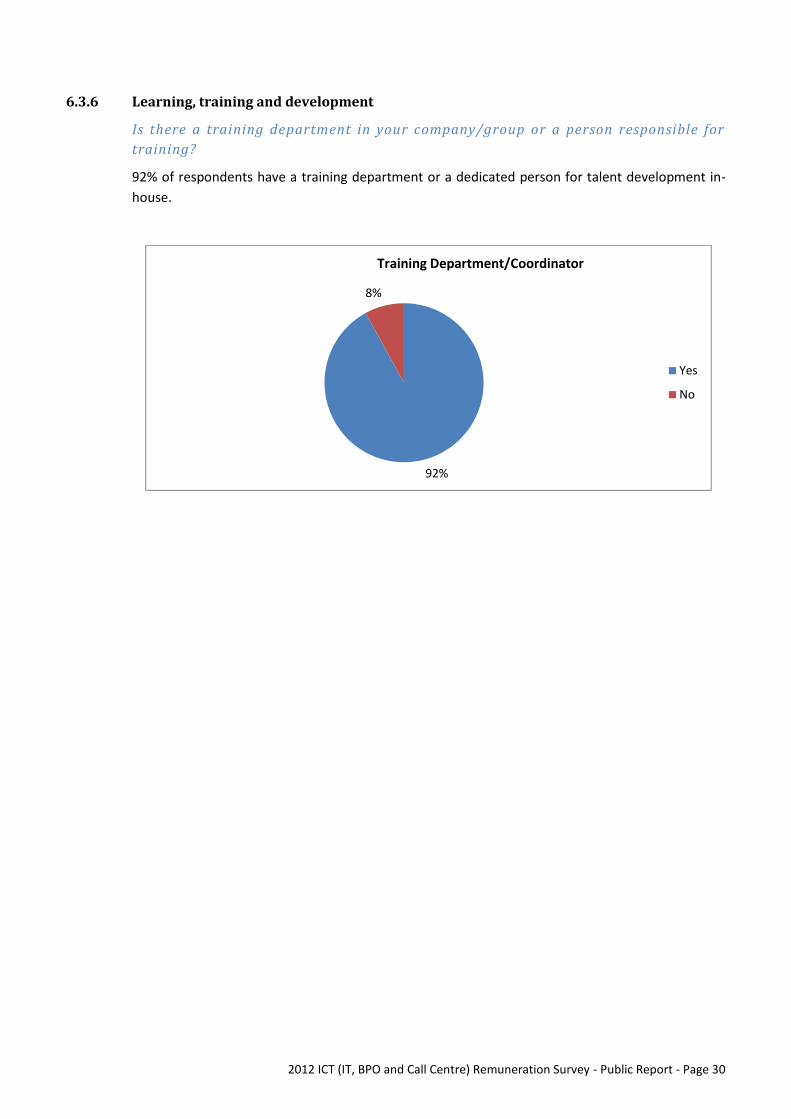
6.3.6 Learning, training and development
Is there a training department in your company/group or a person responsible fortraining?
92% of respondents have a training department or a dedicated person for talent development in-house.
92%
8%
Training Department/Coordinator
Yes
No