Maureen Knabb 1 and Tim Lutz 2 West Chester University Department of Biology 1 and Geology 2 Global...
40
Maureen Knabb 1 and Tim Lutz 2 West Chester University Department of Biology 1 and Geology 2 Global Climate Change: Impact and Remediation 1
-
date post
20-Dec-2015 -
Category
Documents
-
view
218 -
download
0
Transcript of Maureen Knabb 1 and Tim Lutz 2 West Chester University Department of Biology 1 and Geology 2 Global...

Maureen Knabb1and Tim Lutz2
West Chester University
Department of Biology1 and Geology2
Global Climate Change:Impact and Remediation
1
2
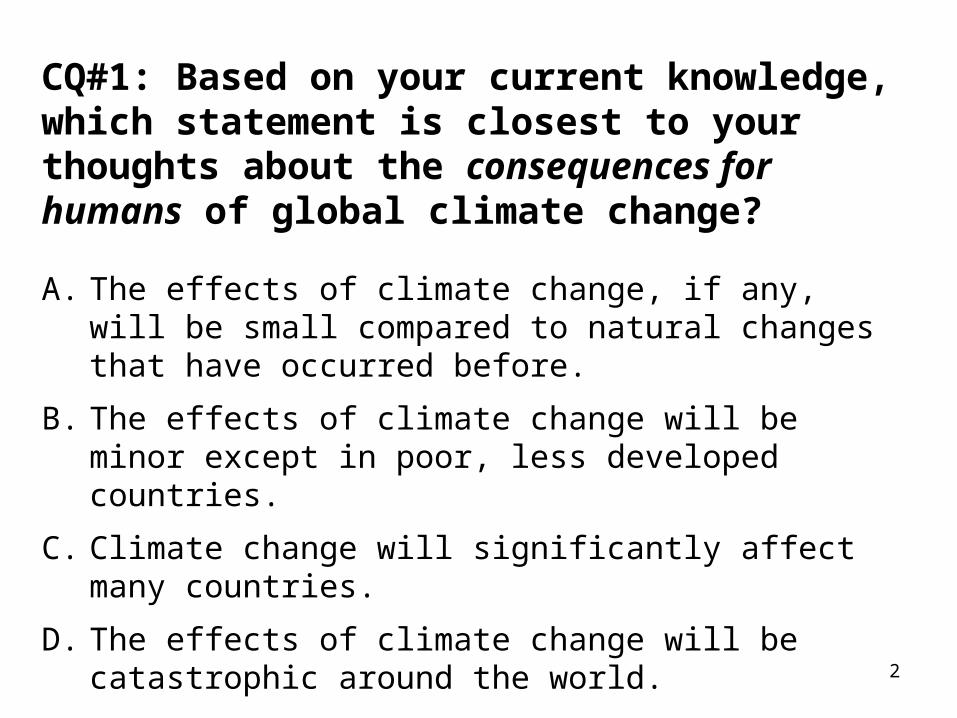
CQ#1: Based on your current knowledge, which statement is closest to your thoughts about the consequences for humans of global climate change?
A. The effects of climate change, if any, will be small compared to natural changes that have occurred before.
B. The effects of climate change will be minor except in poor, less developed countries.
C. Climate change will significantly affect many countries.
D. The effects of climate change will be catastrophic around the world.

3
You are an intern working for the senator representing your region. He wants to hold a town hall meeting to let his constituents air their feelings about global climate change.
“OK,” the senator’s office manager tells you. “We need to be able to anticipate and respond to the concerns that are likely to be raised. So I want you to identify five local groups who you think are likely to attend the meeting, and briefly describe the main points each group is likely to raise.”
Imagine that…

In groups of 3, identify 5 different groups from your community who might be concerned
about climate change and ask to meet with the Senator.
• For example, in a rural community, the Senator might meet with farmers. In an urban community, the Senator might meet with heating and cooling workers.
• In a class discussion, make a list of the different constituent groups.
4

Since your job is to anticipate and respond to questions on global climate change for a
community group for the Senator, it is important that you…
1. Understand the predicted impacts of global climate change.
2. Identify strategies to address the problems associated with global climate change.
5

Why is there so much concern about climate change?
Predicted consequences of global climate change include:
1. Melting of continental and polar glaciers and sea ice.
2. A rise in sea level and loss of coastal communities.
3. Damage to ecosystems and reduced survival of threatened species.
4. Reductions in our food supply due to changes in agricultural conditions.
5. Increased threats to human health from new diseases and changing disease distributions.
6
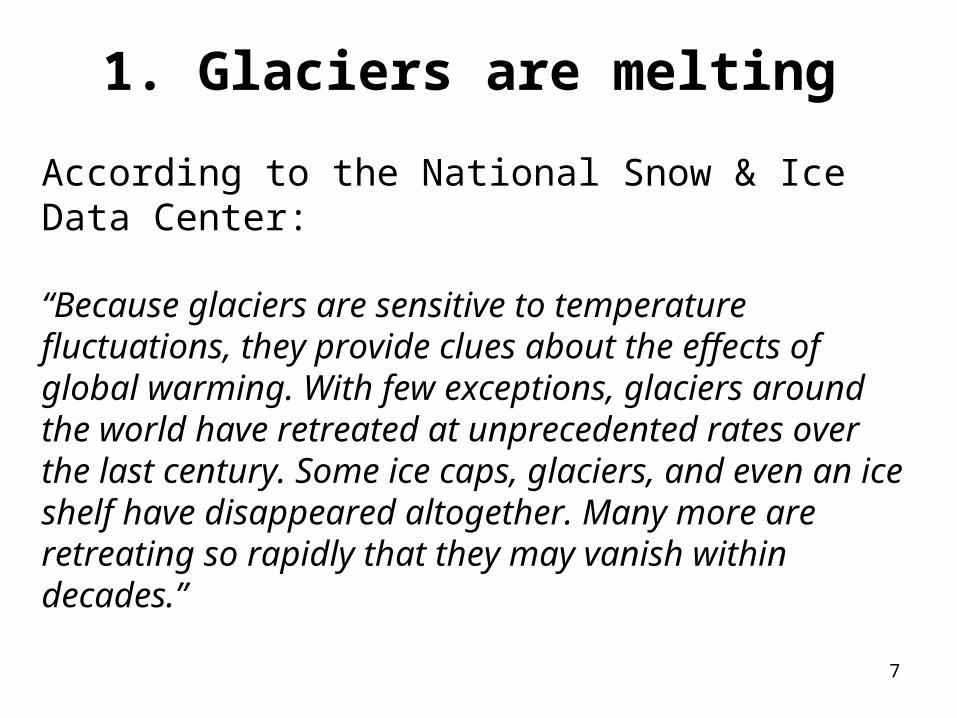
According to the National Snow & Ice Data Center:
“Because glaciers are sensitive to temperature fluctuations, they provide clues about the effects of global warming. With few exceptions, glaciers around the world have retreated at unprecedented rates over the last century. Some ice caps, glaciers, and even an ice shelf have disappeared altogether. Many more are retreating so rapidly that they may vanish within decades.”
1. Glaciers are melting
7

Muir Glacier, Alaska, in 1890 (top) and 2005 (bottom).
Glacial retreat can be judged from photographs taken from the same location decades apart.
8
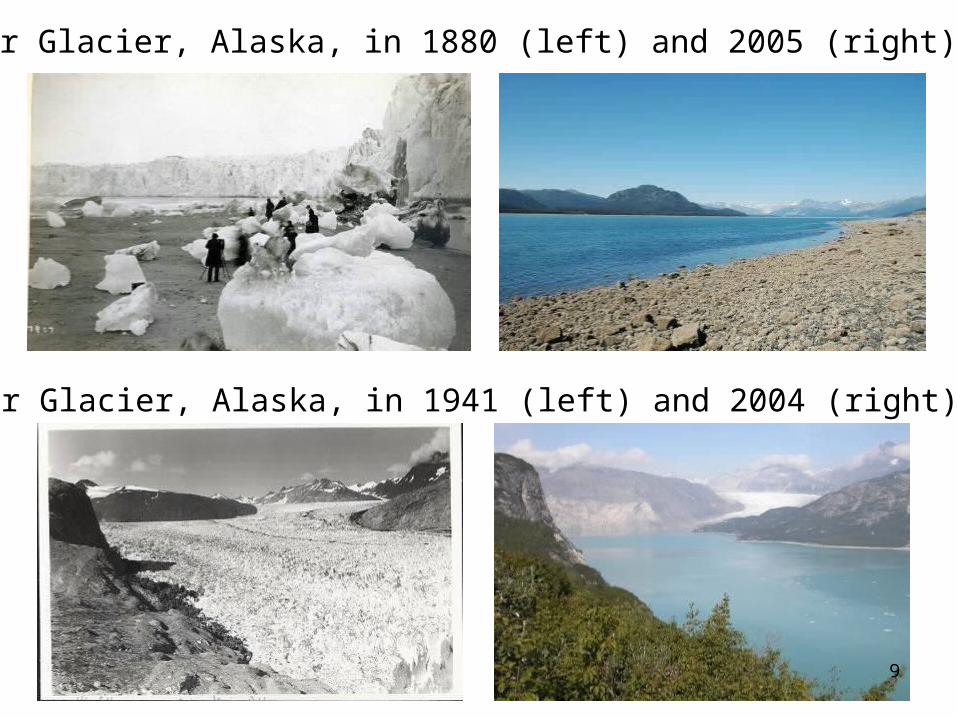
Muir Glacier, Alaska, in 1941 (left) and 2004 (right).
Muir Glacier, Alaska, in 1880 (left) and 2005 (right).
9

•Melting glaciers, which supply drinking and irrigation water for hundreds of millions of people around the world, will be lost.
•In addition, melting glaciers lead to rising sea levels and regional precipitation decreases.
1. Glaciers are melting
10

CQ#2: What should you know about melting glaciers?
A. Glaciers form and disappear only during Ice Age cycles, which take hundreds of thousands of years.
B. Glaciers might be melting at many locations around the world but the evidence is unclear.
C. During the last century, glaciers in many places have shrunk.
D. Glaciers have disappeared entirely, making it unnecessary to consider how future climate change will affect them.
11

CQ#3: Based on the graph below, after 1900, the sea level is rising at a rate of:
A. 20 m/century
B. 20 cm
C. 2 mm/year
D. 2 cm/year
12

• Because most glaciers are melting, sea level is rising.
• In addition, the oceans’ surfaces are warming because of climate change, and this expands the water and adds to sea level rise.
2. Sea level is rising
13

• From 1993-2003, the estimated rate of sea level rise from both causes has been about 2.4 centimeters/decade.
• Oceans are predicted to rise about 12 centimeters in the next 50 years.
• Coastal erosion rates are about 100 times the rate of sea level rise, which means that every centimeter of sea level rise results in 1 meter of beach erosion.
14
2. Sea level is rising

Coastal Flooding and Erosion
Miami Beach, Florida.
Current sea level (top); +1 m (bottom)
15

Ice caps in Greenland and Antarctica together hold 70% of the world's fresh water— enough to potentially raise the sea level approximately 225 feet. But changes this large are thought to be extremely unlikely in the next century.
Are larger changes possible?
16

CQ#4: Based on the graph below, sea ice has:A. Remained relatively
stable in the 50s and 60s.
B. Decreased to nearly one-half its area in the last 40 years.
C. Most recently decreased at a rate of about 10 million sq km/decade.
D. All of the above.17

The implications of melting sea ice
•Sea ice tends to reflect sun’s energy; sea water tends to absorb sun’s energy.
•When more sea ice melts in summer, there is more open water to absorb energy and heat up.
•The following winter it takes longer for sea ice to form due to warmer water and thinner ice.
•Then, more melting takes place the next summer, which warms the water even more… and so on…
The “…and so on” is an indicator of a positive feedback process. Now that melting has started, it might accelerate because of the positive feedback.
18

Another positive feedback loop:Melting permafrost
• Warming climate is melting the permafrost in Canada, Alaska, and Scandinavia.
• This increases wetlands.
• The wetlands release methane and carbon dioxide.
• which are greenhouse gases … more positive feedback effects!
19

CQ#5: In terms of the potential of glacial melting to raise sea level, what is most important for you to understand?
A. Sea level rise and erosion can be costly and widespread even if the rise is only 1 meter.
B. A catastrophic sea level rise of 225 m can occur in the next century from melting ice caps.
C. Sea level rise will mainly affect low-lying foreign countries and would have no effect on the U.S.
D. Positive feedback serves to diminish the effects of glacial melting.
20
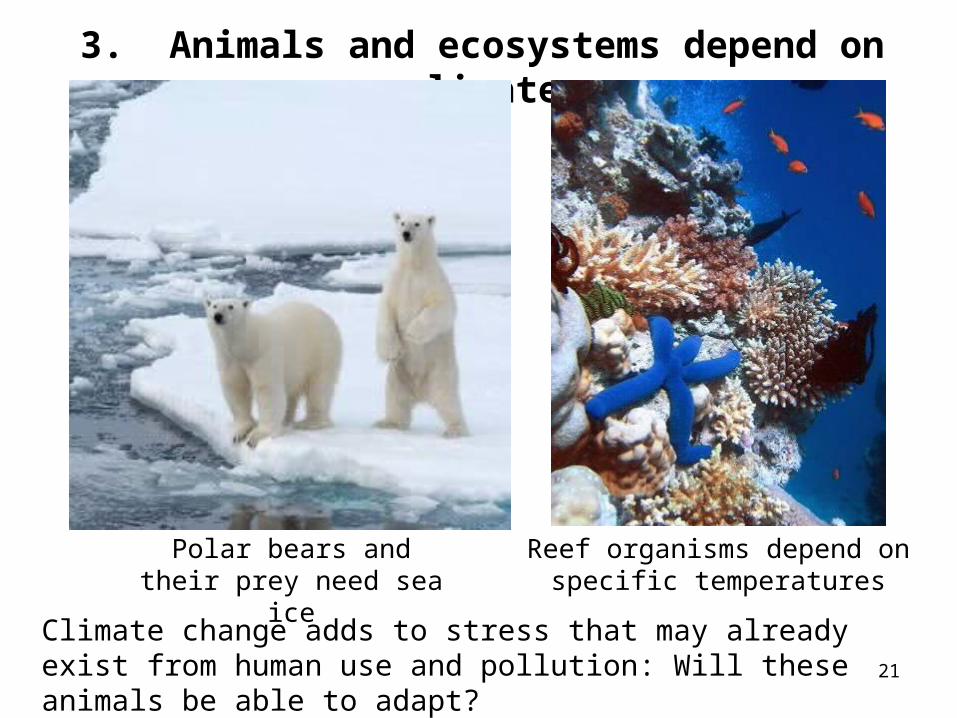
3. Animals and ecosystems depend on climate
Polar bears and their prey need sea ice
Reef organisms depend on specific temperatures
Climate change adds to stress that may already exist from human use and pollution: Will these animals be able to adapt? 21
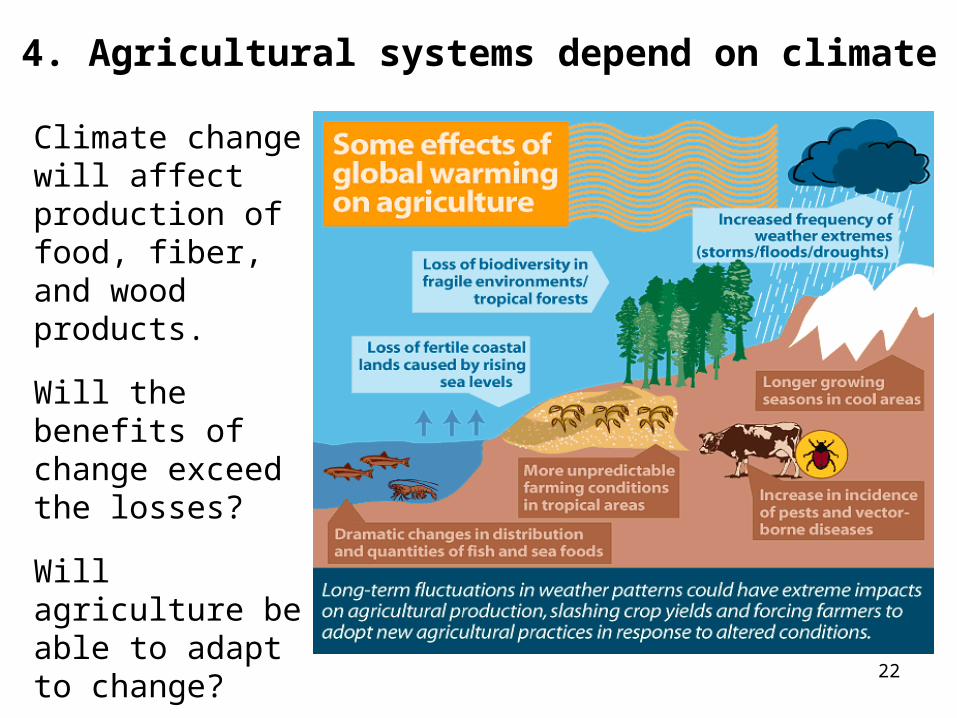
4. Agricultural systems depend on climate
Climate change will affect production of food, fiber, and wood products.
Will the benefits of change exceed the losses?
Will agriculture be able to adapt to change?
22
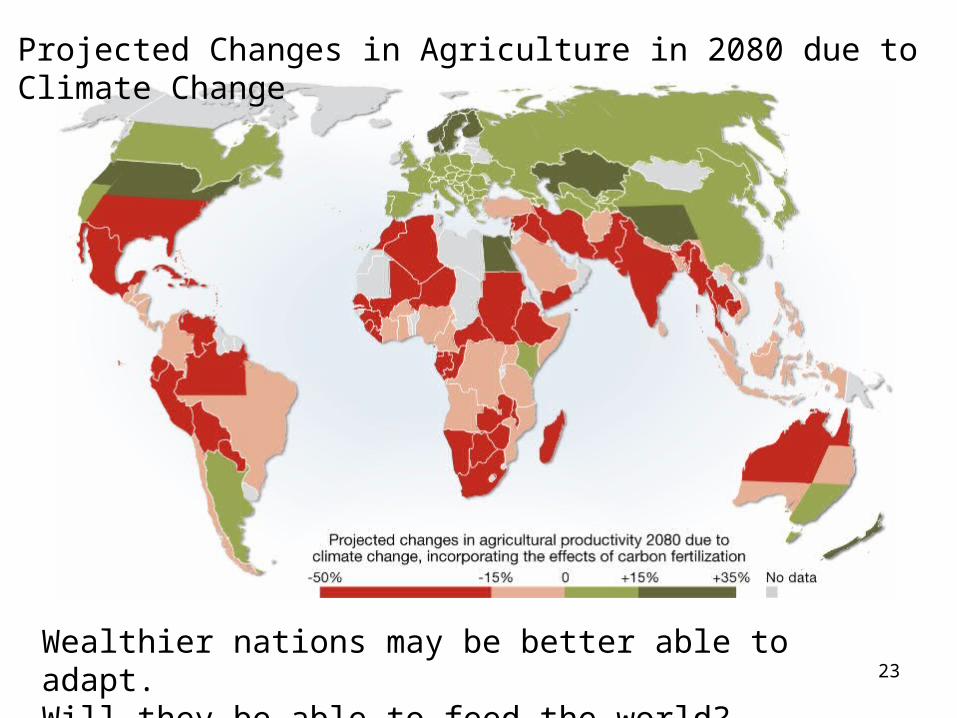
Wealthier nations may be better able to adapt. Will they be able to feed the world? 23
Projected Changes in Agriculture in 2080 due to Climate Change

CQ#6: What should you understand about the effect of climate change on ecosystems and agriculture?
A. Natural ecosystems will be affected but not human managed systems.
B. Climate change will harm all ecosystems and agriculture in every part of the world.
C. It is important to understand how natural ecosystems and agriculture will change and how they can adapt to change.
D. These changes are occurring far away and won’t affect the American public.
24

Morbidity (illness), mortality (death), and displacement (migration of population) could increase. For example, if malaria-carrying mosquitoes could move north, illness and death from malaria could move north as well, and people might respond by moving to even higher latitudes. 25

Health effects will not be the same everywhere
Which parts of the world have not been affected much by climate change so far? How and why might this change?
26
CQ#7: What should you know about the effect of climate change on human health?
A. Threats to human health are occurring far away and won’t affect the American public.
B. The health effects of climate change are nuisances, such as increased perspiration and fatigue.
C. In developed countries like the U.S., the effects of global warming will be stopped by air conditioning.
D. Climate change will affect the health of the U.S. directly and through immigration from more affected areas.
27

28
Review the list generated during the beginning of class and
identify which constituent group would be at the greatest risk
based on what you have learned about the impact of
global climate change….

CQ#8: Overall, which effect of global climate change would be the most important to this constituent group?
A. Melting glaciers and diminishing water supply.
B. Sea level rise and coastal erosion.
C. Challenges for ecosystems and native species.
D. Challenges for agriculture and diminishing food supply.
E. Threats to human health.
29
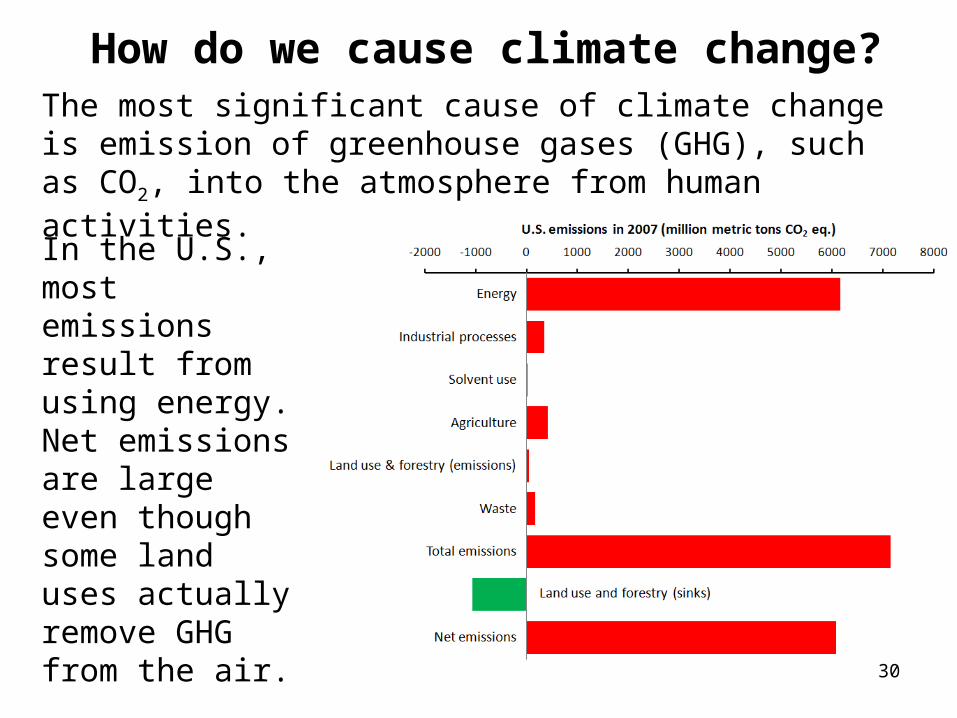
How do we cause climate change?The most significant cause of climate change is emission of greenhouse gases (GHG), such as CO2, into the atmosphere from human activities.
In the U.S., most emissions result from using energy. Net emissions are large even though some land uses actually remove GHG from the air.
30

Responding to climate change
Mitigation
• Reduce greenhouse gas (GHG) emissions. Drastic reductions could stabilize GHG in the atmosphere, but GHG remain in the atmosphere a long time so levels would not drop right away.
• Sequestration. Land use and forestry practices that store CO2 in soil and plants can lower GHG levels in the atmosphere.
31
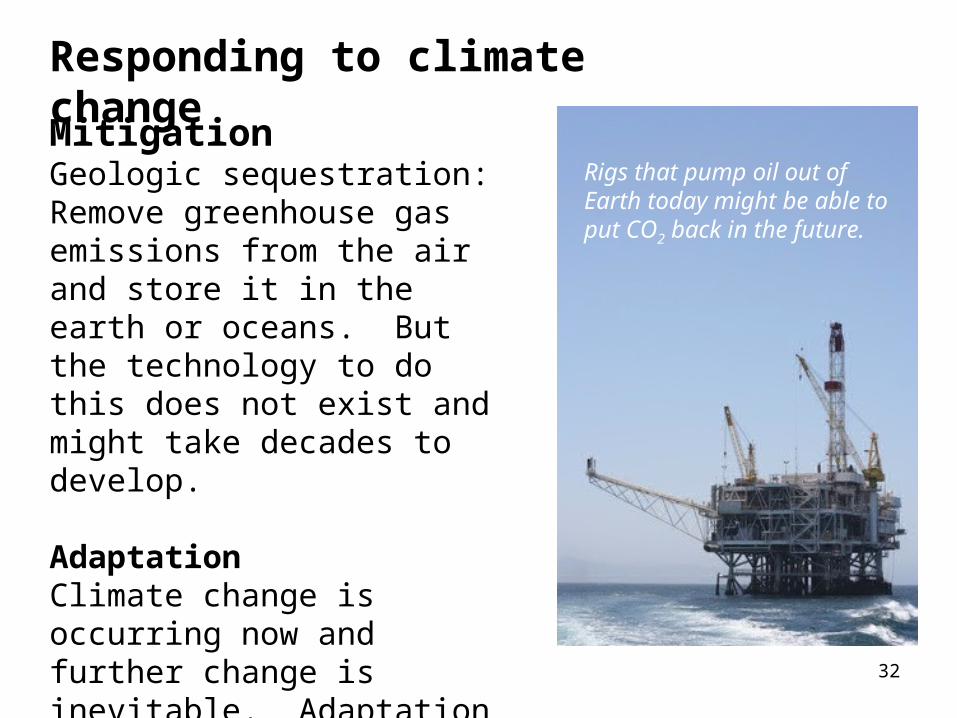
Responding to climate change
MitigationGeologic sequestration: Remove greenhouse gas emissions from the air and store it in the earth or oceans. But the technology to do this does not exist and might take decades to develop.
AdaptationClimate change is occurring now and further change is inevitable. Adaptation means altering our economy and our lives to cope with those changes.
32
Rigs that pump oil out of Earth today might be able to put CO2 back in the future.

CQ#9: In the graph below, direct emissions result from using fossil- based fuels such as gasoline and fuel oil while electricity-related emissions result from using fossil fuels, such as coal, to generate electricity. Thus, the generation of electricity represents the greatest proportion of GHGs in the ____ sector(s). (Choose the best answer)
A. ResidentialB. CommercialC. IndustrialD. Residential and
commercialE. All of the above
33
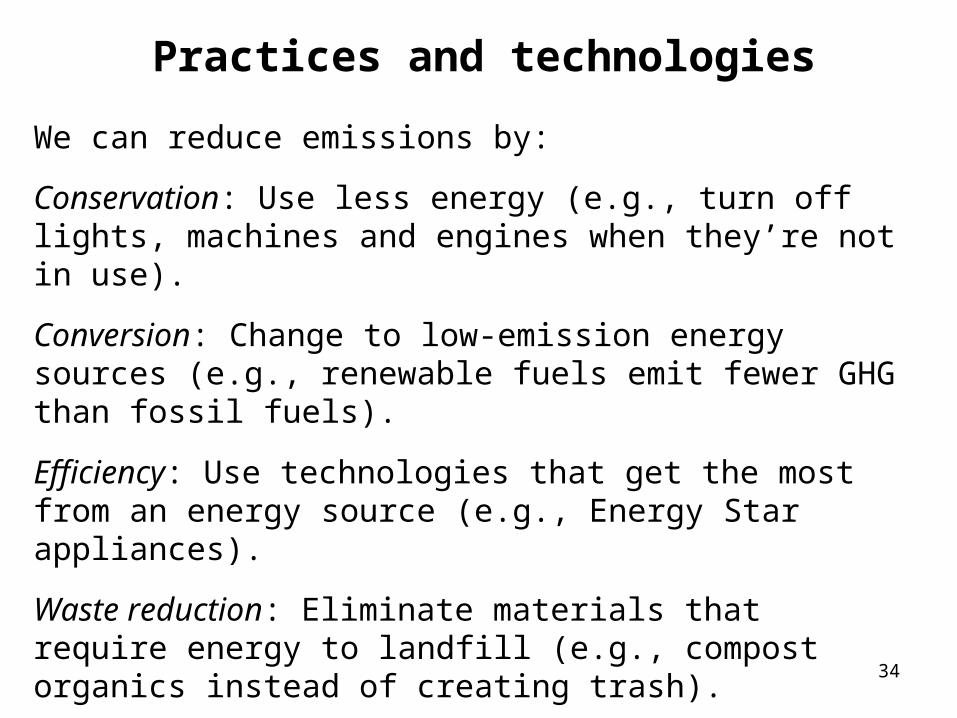
Practices and technologies
We can reduce emissions by:
Conservation: Use less energy (e.g., turn off lights, machines and engines when they’re not in use).
Conversion: Change to low-emission energy sources (e.g., renewable fuels emit fewer GHG than fossil fuels).
Efficiency: Use technologies that get the most from an energy source (e.g., Energy Star appliances).
Waste reduction: Eliminate materials that require energy to landfill (e.g., compost organics instead of creating trash).
Sequestration: take GHG out of the air (e.g., maintain and increase crops and land uses that hold carbon in soils).
34

CQ#10: The Senator should educate his constituents that an effective way that individuals can reduce their own contribution to GHGs is to:
A. Use less energy in their homes.
B. Use low emission electricity sources rather than coal-generated electricity if possible.
C. Purchase locally grown produce.
D. All of the above.
35

What can you do?As an intern you’ve taught the Senator what needs to be done to address the effects of climate change. What can you do personally?
The most important step is to find out how much GHG your lifestyle creates. Use one or more of the following online calculators to find out. Then use the GHG-reducing tips on these sites to reduce your GHG production.
The US EPA household emission calculator (http://www.epa.gov/climatechange/emissions/ind_calculator.html)
Carbonfootprint.com(http://www.carbonfootprint.com/)
The Nature Conservancy carbon footprint calculator (http://www.nature.org/initiatives/climatechange/calculator/
36

Slide CreditsSlide 4 Description: The United States Capitol Building in Washington DC, framed with the Supreme Court columns. Author: ©Michael Shake Source: Dreamstime.com, ID: 11882582 Clearance: Copyrighted, licensed royalty free.
Slide 8—Top Description: Muir Glacier, Alaska in 1890. Author: Septima M. Collis Source: National Snow and Ice Data Center/World Data Center for Glaciology, Boulder. Glacier id: muir1890000003. Link: http://nsidc.org/cgi-bin/gpd_deliver_jpg.pl?muir1890000003 Clearance: Photograph held by the National Snow and Ice Data Center/World Data Center for Glaciology, Boulder. May be used freely if
properly cited.
Slide 8—Bottom Description: Muir Glacier, Alaska in 2005. Author: Bruce F. Molnia Source: National Snow and Ice Data Center/World Data Center for Glaciology, Boulder. Glacier id: muir2005081108. Link: http://nsidc.org/cgi-bin/gpd_deliver_jpg.pl?muir2005081108 Clearance: Photograph held by the National Snow and Ice Data Center/World Data Center for Glaciology, Boulder. May be used freely if
properly cited.
Slide 9—Top left Description: Muir Glacier, Alaska in 1880. Author: G.D. Hazard Source: National Snow and Ice Data Center/World Data Center for Glaciology, Boulder. Glacier id: muir1880000001. Link: http://nsidc.org/cgi-bin/gpd_deliver_jpg.pl?muir1880000001 Clearance: Photograph held by the National Snow and Ice Data Center/World Data Center for Glaciology, Boulder. May be used freely if
properly cited.
Slide 9—Top right Description: Muir Glacier, Alaska in 2005. Author: Bruce F. Molnia Source: National Snow and Ice Data Center/World Data Center for Glaciology, Boulder. Glacier id: muir2005081111. Link: http://nsidc.org/cgi-bin/gpd_deliver_jpg.pl?muir2005081111 Clearance: Photograph held by the National Snow and Ice Data Center/World Data Center for Glaciology, Boulder. May be used freely if
properly cited.

Slide 9—Bottom left Description: Muir Glacier, Alaska in 1941. Author: William O. Field Source: National Snow and Ice Data Center/World Data Center for Glaciology, Boulder. Glacier id: muir1941081301. Link: http://nsidc.org/cgi-bin/gpd_deliver_jpg.pl?muir1941081301 Clearance: Photograph held by the National Snow and Ice Data Center/World Data Center for Glaciology, Boulder. May be used freely if
properly cited.
Slide 9—Bottom right Description: Muir Glacier, Alaska in 2004. Author: Bruce F. Molnia Source: National Snow and Ice Data Center/World Data Center for Glaciology, Boulder. Glacier id: muir2004083101. Link: http://nsidc.org/cgi-bin/gpd_deliver_jpg.pl?muir2004083101 Clearance: Photograph held by the National Snow and Ice Data Center/World Data Center for Glaciology, Boulder. May be used freely if
properly cited.
Slide 12 Description: Graph of sea level rise over the past century. Author: This figure was prepared from publicly available data by Robert A. Rohde and is incorporated into the Global Warming Art project. Source: Wikimedia Commons, http://commons.wikimedia.org/wiki/File:Recent_Sea_Level_Rise.png Clearance: Licensed in accordance with Creative Commons Attribution-Noncommercial-Share Alike 2.5 Generic.
Slide 15 Description: Photos of Miama Beach today and with 1 m change in sea level. Source: Nation Under Siege: Sea Level Rise at Our Doorstep, 2007, Edward Mazria and Kristina Kershner, The 2030 Research Center; link.
Miami Beach, Florida—1.0-meter sea level rise ©2009 2030, Inc. / Architecture 2030, Data Source: LIDAR IHRCS. Clearance: Used with permission.
Slide 16—Left Description: Globe, shaded relief, polar cap with ice cover. Author: ©Arid Ocean Source: Fotolia.com Clearance: Copyrighted, licensed royalty free.
Slide 16—Right Description: Globe, shaded relief, centered on the south pole. Author: ©Arid Ocean Source: Fotolia.com Clearance: Copyrighted, licensed royalty free.
Slide 17—Right Description: Sea ice area versus time graph. Author: Graph prepared by case author, Timothy Lutz. Source: Data from the National Snow and Ice Data Center (nsidc.org). Clearance: Graph used with permission.
Slide 19—Top Description: Close up of permafrost. Author: ©iChip Source: Fotolia.com Clearance: Copyrighted, licensed royalty free.
Slide 19—Bottom Description: Frozen tundra. Author: ©gburba Source: Fotolia.com Clearance: Copyrighted, licensed royalty free.
Slide 21—Left Description: Polar bears. Author: ©Andrew Watson Source: Fotolia.com Clearance: Copyrighted, licensed royalty free.
Slide 21—Right Description: A Blue Starfish (Linckia laevigata) resting on hard Acropora coral. Lighthouse, Ribbon Reefs, Great Barrier Reef Author: Richard Ling Source: http://en.wikipedia.org/wiki/File:Blue_Linckia_Starfish.JPG Clearance: Licensed in accordance with Creative Commons Attribution-Share Alike 3.0 Unported.
Slide 22 Description: Effects of global warming on agriculture. Source: FactFile, Food and Agriculture Organization of The United Nations, http://www.fao.org/english/newsroom/factfile/FF9721-E.HTM Clearance: Used in accordance with terms of use at http://www.fao.org/corp/copyright/en/.
Slide 23 Description: Map of projected changes in agriculture in 2080 due to climate change. Author: Hugo Ahlenius, Nordpil Source: Data from Cline, W. R. 2007. Global Warming and Agriculture: Impact Estimates by Country. Washington D.C., USA: Peterson Institute. Map
by UNEP/GRID-Arendal; exact source. Clearance: Used in accordance with terms of use.
Slide 25 Description: Effects of climate change on human health. Source: Information adapted by the Tennessee Department of Health from Agency for Toxic Substances and Disease Registry. Link: The Tennessee Department of Health, http://health.state.tn.us/Environmental/climatechange.htm Clearance: Used with permission.
Slide 26 Description: Health effects of climate change. Source: Center for Sustainability and the Global Environment (SAGE) at the University of Wisconsin-Madison,
http://www.sage.wisc.edu/index.html; exact source. Data drawn from Ezzati M, Lopez AD, Rodgers A, Murray CJL (Eds) (2004) Comparative Quantification of Health Risks: The Global and Regional Burden of Disease Attributable to Selected Major Risk Factors (Volumes 1 and 2). Geneva: World Health Organization. Map created by a team of climate and health scientists led by Jonathan Patz, associate professor of environmental studies and population health sciences at the University of Wisconsin-Madison.
Clearance: Used with permission.
Slide 30 Description: U.S. Emissions of GHG. Author: Graph prepared by case author, Timothy Lutz. Source: Data from “Inventory of U.S. Greenhouse Gas Emissions and Sinks: 1990–2007,” US EPA, 2009 (EPA 430-R-09-004), Table ES-4
see pg 33 Clearance: Graph used with permission.
Slide 31 Description: Photo of smokestack (top) and forest (bottom). Author: Personal photos by case author, Timothy Lutz. Clearance: Used with permission.
Slide 32 Description: Offshore oil rig. Author: ©bengsoon Source: Fotolia.com Clearance: Copyrighted, licensed royalty free.
Slide 33 and Slide 35 Description: Graphs from IPCC report. Source: Bottom panels of Figure SPM.4, p. 11. IPCC, 2007: Summary for Policymakers. In: Climate Change 2007: The Physical Science
Basis. Contribution of Working Group I to the Fourth Assessment Report of the Intergovernmental Panel on Climate Change [Solomon, S., D. Qin, M. Manning, Z. Chen, M. Marquis, K.B. Averyt, M.Tignor and H.L. Miller (eds.)]. Cambridge University Press, Cambridge, United Kingdom and New York, NY, USA.
Link: http://www.ipcc.ch/pdf/assessment-report/ar4/wg1/ar4-wg1-spm.pdf Clearance: Used in accordance with terms of use on http://www.ipcc.ch/home_copyright.htm.