MATURITY ASSESSMENT OF PHYSICAL ASSET MANAGEMENT PRACTICES … · 2013-03-05 · According to life...
228
POLITECNICO DI MILANO Scuola di Ingegneria dei Sistemi Corso di laurea magistrale in Ingegneria Gestionale MATURITY ASSESSMENT OF PHYSICAL ASSET MANAGEMENT PRACTICES IN MANUFACTURING PLANTS AND INFRASTRUCTURES Supervisor: Ing. Marco Macchi (Politecnico di Milano) Assistant supervisor: Dr Telli van der Lei (Delft University of Technology) Master of Science Thesis: Chiara D’Alesio matr. 754761 Academic Year 2011/2012
Transcript of MATURITY ASSESSMENT OF PHYSICAL ASSET MANAGEMENT PRACTICES … · 2013-03-05 · According to life...
POLITECNICO DI MILANO
Scuola di Ingegneria dei Sistemi
Corso di laurea magistrale in Ingegneria Gestionale
MATURITY ASSESSMENT OF PHYSICAL ASSET
MANAGEMENT PRACTICES IN MANUFACTURING
PLANTS AND INFRASTRUCTURES
Supervisor: Ing. Marco Macchi (Politecnico di Milano)
Assistant supervisor: Dr Telli van der Lei (Delft University of Technology)
Master of Science Thesis:
Chiara D’Alesio
matr. 754761
Academic Year 2011/2012

Abstract
As a consequence of the increasingly open global competitive environment caused by
the higher pressure to reduce costs, to increase profit margins and, last but not least, to
integrate the concepts of sustainable development in the business strategy, a different
and broader vision of maintenance, extended throughout the life cycle of the assets
and all the processes involved, has been developed. This approach, called Physical
Asset Management (PAM), has shown important innovations and relevant changes in
the maintenance management methods, especially in asset intensive companies such
as those dealing with infrastructures and public utilities networks.
This Master of Science thesis work aims at developing and testing a model for the
maturity assessment of PAM practices, to be applied across different industrial sectors,
having as target the field of manufacturing plants, services networks and infrastructures
(such as water, energy, gas, railway infrastructure,..).
From a methodological perspective, the work aims at studying the potentiality of pre-
existent maturity assessment approaches. In particular, two approaches were mainly
considered. The former is the result of the research activities carried out in the frame of
TeSeM Observatory (on Technologies and Services for Maintenance) of the School of
Management of Politecnico di Milano, and focuses on maintenance aspects such as
the information systems, the technologies for Condition Based Maintenance, and the
development of strategy through maintenance policies. The latter is developed by a
research group at University of Technology of Delft (TUDelft), Faculty of Technology,
Policy and Management, and studies the PAM practices at different levels of decision
making (operational, tactical and strategic); the practices particularly focused by the
TUDelft concern long term investment decisions, lifecycle approach, risk management,
organizational culture and leadership. The model proposed in this work adapts these
pre-existent methodologies of maturity assessment, thus developing a new model for
the maturity assessment of PAM practices. As a result of the thesis, the theoretical
concepts are tested by means of analysis of three real case studies in The Netherlands
in the infrastructure sector, and of two real case studies in Italy in the manufacturing
sector.

Abstract
Come conseguenza del sempre più aperto e competitivo ambiente globale causato
dalla maggiore pressione per ridurre i costi, aumentare i margini di profitto e, ultimo ma
non meno importante, per integrare i concetti di sviluppo sostenibile nella strategia di
business, una diversa e più ampia visione di manutenzione, estesa a tutto il ciclo di vita
degli assets e di tutti i processi coinvolti, è stata sviluppata. Questo approccio,
chiamato Physical Asset Management (PAM), ha mostrato importanti novità e
cambiamenti rilevanti nei metodi di gestione della manutenzione, soprattutto in aziende
asset intensive, come quelle che si occupano di infrastrutture e di reti di public utilities.
Il lavoro di Tesi mira a sviluppare e testare un modello per la valutazione delle pratiche
di maturità PAM, da applicare nei diversi settori industriali, quali impianti di produzione,
reti di servizi e infrastrutture (ad esempio, acqua, energia, gas , infrastruttura
ferroviaria, ..).
Dal punto di vista metodologico, il lavoro si propone di studiare la potenzialità di
approcci scadenza pre-esistenti di valutazione. In particolare, due approcci sono stati
principalmente considerati. Il primo è il risultato delle attività di ricerca svolte nell'ambito
dell'Osservatorio del TeSeM (su Tecnologie e Servizi per la manutenzione) della
School of Management del Politecnico di Milano, e si concentra su aspetti di gestione
della manutenzione, come i sistemi di informazione, le tecnologie per la manutenzione
su condizione, e lo sviluppo della strategia attraverso politiche di manutenzione. Il
secondo è sviluppato da un gruppo di ricerca presso la University of Technology di
Delft (TUDelft), Faculty of Technoloy, Policy and Management, e studia le pratiche
PAM a diversi livelli del processo decisionale (operativo, tattico e strategico); le
pratiche approfondite dalla TUDelft riguardano decisioni di investimento a lungo
termine, l'approccio del ciclo di vita, gestione dei rischi, la cultura organizzativa e di
leadership. Il modello proposto in questo lavoro adatta queste pre-esistenti
metodologie di valutazione della maturità, sviluppando un nuovo modello per la
valutazione delle pratiche di maturità PAM. Come risultato della tesi, i concetti teorici
sono testati attraverso l'analisi di tre casi reali nei Paesi Bassi nel settore delle
infrastrutture, e di due casi reali in Italia nel settore manifatturiero.

I
Executive Summary
What is Physical Asset Management? As a consequence of the increasingly open global competitive environment caused by the
higher pressure to reduce costs, increase profit margins and, last but not least, integrate
the concepts of sustainable development in the business strategy, a different and broader
vision of maintenance, extended throughout the life cycle of the assets and all the
processes involved, has been developed. This approach is often called Physical Asset
Management (PAM), and it has shown important innovations and relevant changes in the
maintenance management methods, especially in asset intensive companies such as
those dealing with infrastructures and public utilities networks.
The main contributions of PAM regard a variety of issues such as:
• the organization, considering both PAM function, roles of personnel and cultural
aspects;
• the PAM decision making framework and needed methodologies, such as
those enabling Asset Life Cycle Management and Risk Asset Management;
• the Information System for supporting PAM;
• the asset performance measurement.
The next sub-sections focus on such issues, providing a short summary of the main items
to be considered when defining what PAM is. Such items have been identified through a
wide literature analysis, and have served as main background of what was developed in
this thesis work. The objective of the thesis is thereafter presented.
Organization in PAM Industrial organizations still live with the “mindset” of functional silos rather than adapting
to a process orientation, hence the information and knowledge are fragmented between
different functions and professions in the organization. Nonetheless, in asset intensive
businesses, it is recommended to integrate the different functions so that the development,
acquisition and operation of the assets are carried out effectively.
II
Integrating different functions and knowledge, the PAM function becomes often as a grey
zone in the organization. But PAM without a defined position can’t work efficiently and/or
effectively. It is essential instead to define the role of Asset Management and the relations
with other business functions, in order to avoid unproductive duplications and contrasts. In
particular, the purpose of the PAM Function is to provide resources and expertise to
support the acquisition, in-service support and disposal of the physical assets required by
the organization. More precisely, the asset management function should provide inputs to
asset planning, take a role in major acquisitions and developments, and provide the
systems and facilities needed to support assets throughout their life-cycle.
For the wide range of responsibility and contributes, the PAM function needs to be in place
along all the hierarchical levels of the organization: corporate, tactical and operational
level. Often, the three levels of asset management are recognized by three different
figures, responsible for different activities: the asset owner, the asset manager and the
asset service provider. The asset owner is responsible for setting financial, technical, and
risk criteria. The asset manager is responsible for translating these criteria into an asset
plan. The asset service provider is responsible for executing the asset plans, and providing
feedback on actual cost and performance. This structure allows each asset function to
have a focus: owners on corporate strategy, managers on planning and budgeting, and
service providers on operational excellence.
Asset owner, asset manager and service provider are only some of the roles belonging to
the PAM group. In fact, this is a multidisciplinary group in which collaboration takes place
amongst managers with suitable technical backgrounds and personnel in accounting and
finance, legal, contracting, procurement and engineering roles.
Several personnel, with different backgrounds and organizational duties, can reach the
goals of the organization only sharing a unique Asset Management Culture (being culture
“the set of shared attitudes, values, goals, and practices that characterizes an institution,
organization, or group”).
PAM decision making framework and methodologies In literature there are different definitions of PAM. Asset management is defined by the
PAS 55 as:“systematic and coordinated activities through which an organization optimally
and sustainably manages its asset systems, their associated performances, risks and
III
expenditures over their life cycles for the purpose of achieving its organizational strategic
plan” where an organizational strategic plan is defined as: “the overall long-term action
plan for the organization that is derived from and embodies its vision, mission, value,
business policies, objectives and the management of the risks”.
From the definitions of PAS 55, the characteristics of PAM approach can be deduced and
summarized in the following issues:
• holistic: it integrates management all of the aspects of the assets in contrast with
specialized and compartmentalized approaches;
• systematic: it implies that PAM promotes consistent, repeatable and methodical
actions, providing a clear support for decision making;
• systemic: it considers the assets as a system and tries to optimize the whole
system, rather than optimizing individual asset in isolation;
• optimal: it tries to establish the optimal compromise between competing factors
such as performance, cost and risk, associated with the assets over their life
cycles;
• risk-based: the assessment of risks leads all the decisions;
• sustainable: PAM considers the potential adverse impact to the organization in the
long term of short term decisions.
Therefore, PAM encompasses a broader and quite different set of activities from
“maintenance”. Maintenance is primarily concerned with keeping existing equipment in
operating condition, while PAM is concerned with applying technical and financial
judgment, and sound management practices, to decide what assets need to meet the
business aims, and then to acquiring and logistically sustaining the assets over their whole
life, through to disposal.
In this new approach, the methodologies of life-cycle management and risk management
become fundamentals.
Life cycle asset management gives a number of advantages such as enhance customer
satisfaction, improve performance and control of product or service delivery, improve
health, safety and environmental performance, optimize return on investment and/or
IV
growth, enhance long-term planning confidence and performance sustainability, improve
risk management and corporate governance.
The challenge in managing the entire asset life cycle effectively lies in the fact that costs
are isolated and addressed in a fragmented way through the various stages. During the
acquisition phase the emphasis is on implementing a technology within the boundaries of
the approved budget and prescribed time frame, ensuring that the facility acquired
conforms to the technical specifications. The primary drivers of the utilization phase are
instead the associated costs of product distribution, spares and inventory, maintenance,
training, etc..
According to life cycle asset management, life-cycle cost analysis considers costs from the
acquisition to the disposal phase and can support management decisions in order to
identify the option (new investment, repair,..) with the lowest life-cycle cost that allows to
satisfy stakeholders’ requirements.
Asset management does not regard only the minimization of costs but it is an integrated
approach to balance costs, performance and risks during the asset life cycle.
There are different categories of risks to be considered when doing PAM: physical failure
risks, operational risks, human factors, natural environmental events, factors outside the
organization’s control, supply risks, stakeholders risks. Indeed, the risk assessment is
important in different areas of the organization and became fundamental in PAM Projects.
The purpose of Risk Asset Management functions is to understand the cause, effect and
the likelihood of adverse events which may occur while an asset is managed, and then to
identify possible treatment of the risk, such as mitigation actions or contingency plans to
reduce the impact of the adverse event.
PAM information system and performance measurement Asset lifecycle management involves significant amount of acquisition, processing, and
analysis of information that enable a variety of lifecycle aspects such as planning, design,
maintenance, rehabilitation, and disposal/refurbishment or replacement of assets.
Information Systems (IS) become then necessary in order to integrate the cross functional
information.
V
The IS, in PAM context, has not only to provide support for decentralized control of
maintenance tasks, but also to act as instrument for decision support, for example, in order
to solve trade-offs between deferred maintenance and preventive maintenance, between
short-term fixes and long-term solutions.
In terms of information flows, asset management represents a two-way process, where
downstream information flows define strategies at each stage of asset lifecycle, and
upstream information flows provide feedback on effectiveness of the implementation of
these strategies. In order to know the efficiency and effectiveness of asset management,
the assessment of asset performance has become an integral part of the business today.
That measurement systems must reflect the context and the objectives of the organization.
Lack of integration between various stakeholders and their changing requirements in
strategic asset performance assessment is still a major issue for industries.
Objectives of the work This Master of Science thesis work aimed at developing and testing a model for the
maturity assessment of PAM practices. The inspiring idea was that the model should be
developed in order to be adequate to be applied in different fields, in particular in the field
of capital intensive manufacturing plants, services networks and infrastructures (water,
energy, gas, railway infrastructure,...).
More deeply, the aims of this research were three:
• to study and understand the best practices emerged after PAM introduction;
• to define a maturity assessment methodology for companies who introduces PAM;
• to test the new methodology in real cases, in order to verify its capability to be
applied in different fields.
Through literature review, PAM practices have been analyzed and classified in order to
understand which are the key factors that companies need to take in considerations in
managing their assets and how these elements influence business strategy and results.
The previous section of this executive summary has already shown some insights on the
outcomes of literature review.
VI
Thereafter, from a methodological perspective, the work aimed at studying and enhancing
the potentialities of pre-existent maturity assessment approaches. In other words, this
thesis work wanted to pursue an integration to allow a further development and test of
such pre-existent methodologies. The maturity assessment model, resulting from the
integration, tries to combine their strengths so to finally define a flexible methodology
which can be applied without sectorial bounders, both for the content assessed and for the
terminology used.
Tests in real cases eventually aimed at verifying the capability of the model for maturity
assessment to be applied in different fields. To this end, the main focus of interest for the
test study were the followings:
• the ability of the model to discern the aspects that influence the maturity of the
organization under assessment,
• the completeness of the model,
• the terms and contents used in the test, and their understanding from the target
interviewee,
• the opportunities for further improvements of the methodology itself.
The methodology A maturity model can be viewed as a set of structured levels that describe how well
different processes of an organization are able to produce the required outcomes in a
reliable and sustainable way.
This thesis work started from the comparison between two maturity models, both based on
the Capability Maturity Model Integrated (CMMI) methodology. The former has been
developed by a research group at Politecnico di Milano, Dept. of Management, Economics
and Industrial Engineering; more precisely, the methodology is the result of the research
activities carried out in the frame of TeSeM Politecnico di Milano. The latter has been
developed by a research group at TU Delft, Faculty Technology, Policy and Management
(TPM).
To better understand the Dutch approach, part of the work has been developed in the
Netherlands, where many companies, especially in the infrastructure sector, have

VII
successfully implemented PAM. In this respect, the research group of TUDelft represents
a reference point in providing consulting services and support in understanding asset
management principles.
The development reflects also other references from literature background in maturity
assessment. In the remainder of this executive summary an insight is given on the TeSeM
model and TUDelft model, as principal sources of inspiration.
TeSeM model The purpose of TeSeM model is to analyze how maintenance practices are currently set
up in an organization, especially focusing on how new practices were developed thanks to
the advancement in the use of ICT tools/devices for diagnostics, prognostics and
maintenance engineering. More deeply, this model aims at evaluating technological,
organizational and management aspects in maintenance, defining three synthetic maturity
scores summarizing company’s behaviors. As a final outcome, the maintenance maturity is
assessed both as a synthetic index, General Maturity Index (GMI), and as a set of
component indexes accordingly with PAs (Process Areas) identified, Managerial (MMI),
Organizational (OMI) and Technological (TMI).
Related questions were defined for each PA in a survey questionnaire. For every question,
its related scores are defined according to the maturity scorecard, and thus interviewing
the maintenance manager of a firm it is possible to calculate all the maturity indexes. The
GMI is obtained multiplying the three indexes (GMI = MMI x OMI x TMI).
The TeSeM maturity assessment model – and its questionnaire – were developed based
on a number of characteristics. First of all, it is an “a priori” model. This means that, for
each answer in the questionnaire, it must be clear how to evaluate it in an unquestionable
way, defining “a priori” a series of maturity levels. In this way, there will be no difference if
maturity level is assigned by different interviewers/ evaluators. Second, thank to the use of
closed-answer questions, it is adequate for a survey-like assessment and the
questionnaire is easier and quicker to fill in, and can be even used in phone interviews, or
by less skilled people. Third, maturity levels are defined in order to understand which could
be the possible further improvements to a maintenance system and this makes the model
adapted for a dynamic assessment. Last, but not least, the model is designed for flexible
adoption, in order to be as much adaptable as possible at different needs and situations.
VIII
TUDelft model The Infrastructure Maturity Model of TUDelft was developed under the request of Dutch
Highway Transport Agency (RWS) in order to assess the maturity of the company and
identify suggestions for improvement of PAM practices.
It is specifically designed on Asset Management maturity, so it pays more attention, as a
default, on organizational and managerial aspects; moreover, the human factors are really
linked to the strategy and the success of the company, and there are specific areas for the
internal and external coordination. Precisely, the model investigates seven PAs that are:
Information Management, Internal coordination, External Coordination, Market Approach,
Risk Management, Process and Roles and Culture and Leadership.
The tool that supports the interviews and the assessment is not a survey-questionnaire but
a maturity matrix in which the column are the PAs investigated and the rows the maturity
levels. By using open questions the interviewers may have the opportunity to make more
considerations about the maturity profile of the organizations, modifying the questions in
relation to the answers given by respondents and clarifying possible doubts during the
interview. In contrast, both data collection and analysis of the answers require more time
and considerations, and it is linked to the experience of the interviewers. The analysis is
particularly influenced by the knowledge of the sector and, hence, we cannot find the
flexible propriety, strength of the TeSeM questionnaire.
The new model The development of the model proposed in this thesis work has passed through the
definition of a new maturity matrix, from which a new questionnaire has been derived as
well.
The first step regarded the choice of how to develop the maturity matrix, indexes and
process areas of each index. The three indexes used in the TeSeM model fit well with the
analysis of a maintenance service but they omit important aspects that have to be
considered in the extended field of PAM Assessment. On the contrary, the seven indexes
identified in the TUDelft matrix are too linked to the field of application of the model: for
example, the internal coordination – within this matrix – regards the divisional structure of
the Road Authority and hence the need to structure a shared way to communicate
between different departments.
IX
Another consideration concerns the number of indexes, and their relationship with Process
Areas (PAs) for which PAM practices are investigated. We selected the closed questions
assessment, so for each PA we had to find a set of questions that can explain the maturity
of that PA, in relation to different levels of PAM practices (basic, good, best … practices).
Each PA was then associated to an index. This leaded to the need to solve a tradeoff
between the depth of the analysis and the number of questions included in the
questionnaire for maturity assessment. With a high number of maturity indexes, the
assessment can cover more aspects/PAs of PAM, but we need to have a lot of questions:
this might discourage the respondents. On the contrary, we had to find enough indexes
through which we could do an exhaustive work of analysis through relevant PAs.
We identified then four important maturity indexes, used in order to calculate the maturity
in different Process Areas. The indexes were also visualized in a maturity matrix (columns
of the matrix).
• Management Decisions. It refers to the main decisions that the asset manager
has to consider in managing the asset management of the firm, taking into account
the asset life cycle management, risk management and maintenance management.
• Information Management. It refers to the aspects of information management
related to ICT tools/systems, monitoring and prognostics methods, registration of
data and performance management.
• Organization and Culture. Herein, we go in depth in the organizational issues.
The asset management team, culture, communication and training are topics taken
into account under this index.
• External Coordination. This index concerns the relationships with third parties
such as stakeholders, regarding the ability to understand and follow their
requirements, and contractors, regarding the shared information and plans.
Concerning the maturity levels, we decided to use the five levels defined along the
continuum of the CMMI approach. The levels were associated to a correspondent maturity
score.
• Initial (also chaotic, ad hoc, individual heroics): the starting point for use of a new
or undocumented repeat process.
X
• Managed the process is at least documented sufficiently such that repeating the
same steps may be attempted.
• Defined: the process is defined/confirmed as a standard business process, and
decomposed to tactical and operational levels.
• Quantitatively Managed: the process is quantitatively managed in accordance
with agreed – upon metrics.
• Optimizing: process management includes deliberate process optimization and
improvement.
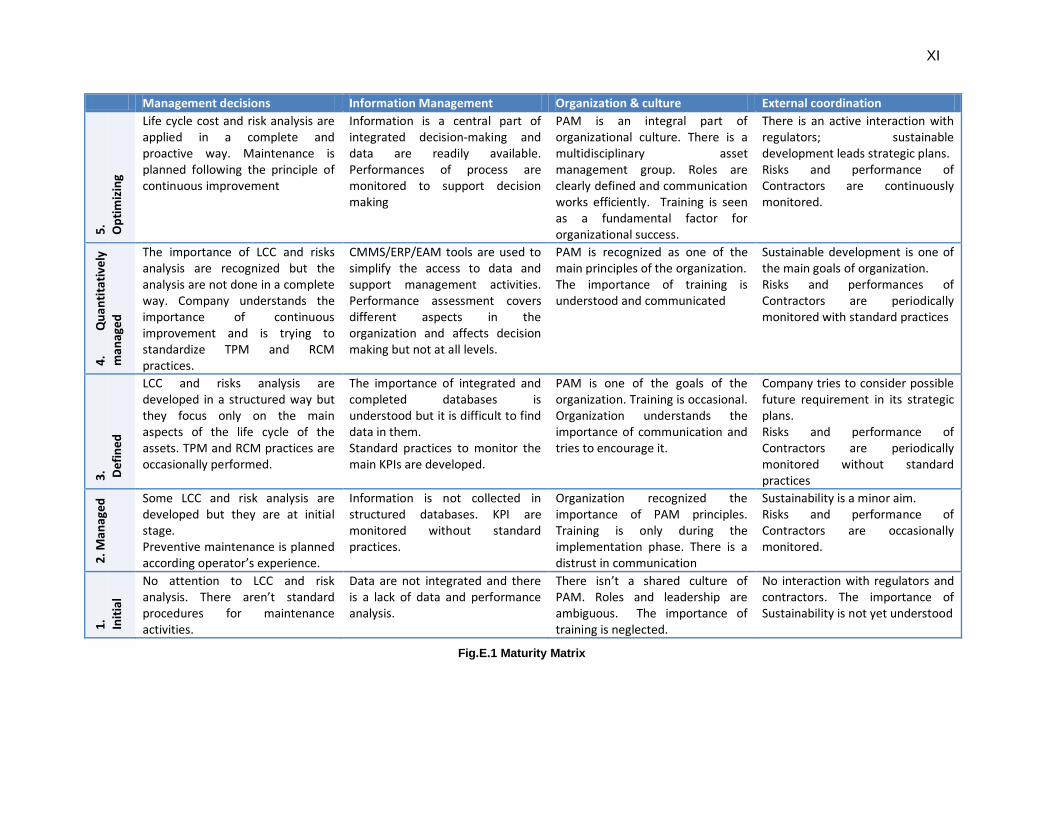
The resulting matrix – where the maturity indexes are the columns and the maturity levels
are the rows – shows the progressive growth of maturity in the PAs: the correspondent
textual description, characterizing each maturity level and index, synthesizes in fact the
main practices achieved at that level. The following figure shows the matrix.
XI
Management decisions Information Management Organization & culture External coordination 5.
O
ptim
izin
g Life cycle cost and risk analysis are applied in a complete and proactive way. Maintenance is planned following the principle of continuous improvement
Information is a central part of integrated decision-making and data are readily available. Performances of process are monitored to support decision making
PAM is an integral part of organizational culture. There is a multidisciplinary asset management group. Roles are clearly defined and communication works efficiently. Training is seen as a fundamental factor for organizational success.
There is an active interaction with regulators; sustainable development leads strategic plans. Risks and performance of Contractors are continuously monitored.
4.
Qua
ntita
tivel
y m
anag
ed
The importance of LCC and risks analysis are recognized but the analysis are not done in a complete way. Company understands the importance of continuous improvement and is trying to standardize TPM and RCM practices.
CMMS/ERP/EAM tools are used to simplify the access to data and support management activities. Performance assessment covers different aspects in the organization and affects decision making but not at all levels.
PAM is recognized as one of the main principles of the organization. The importance of training is understood and communicated
Sustainable development is one of the main goals of organization. Risks and performances of Contractors are periodically monitored with standard practices
3.
Def
ined
LCC and risks analysis are developed in a structured way but they focus only on the main aspects of the life cycle of the assets. TPM and RCM practices are occasionally performed.
The importance of integrated and completed databases is understood but it is difficult to find data in them. Standard practices to monitor the main KPIs are developed.
PAM is one of the goals of the organization. Training is occasional. Organization understands the importance of communication and tries to encourage it.
Company tries to consider possible future requirement in its strategic plans. Risks and performance of Contractors are periodically monitored without standard practices
2. M
anag
ed Some LCC and risk analysis are
developed but they are at initial stage. Preventive maintenance is planned according operator’s experience.
Information is not collected in structured databases. KPI are monitored without standard practices.
Organization recognized the importance of PAM principles. Training is only during the implementation phase. There is a distrust in communication
Sustainability is a minor aim. Risks and performance of Contractors are occasionally monitored.
1.
Initi
al
No attention to LCC and risk analysis. There aren’t standard procedures for maintenance activities.
Data are not integrated and there is a lack of data and performance analysis.
There isn’t a shared culture of PAM. Roles and leadership are ambiguous. The importance of training is neglected.
No interaction with regulators and contractors. The importance of Sustainability is not yet understood
Fig.E.1 Maturity Matrix
XII
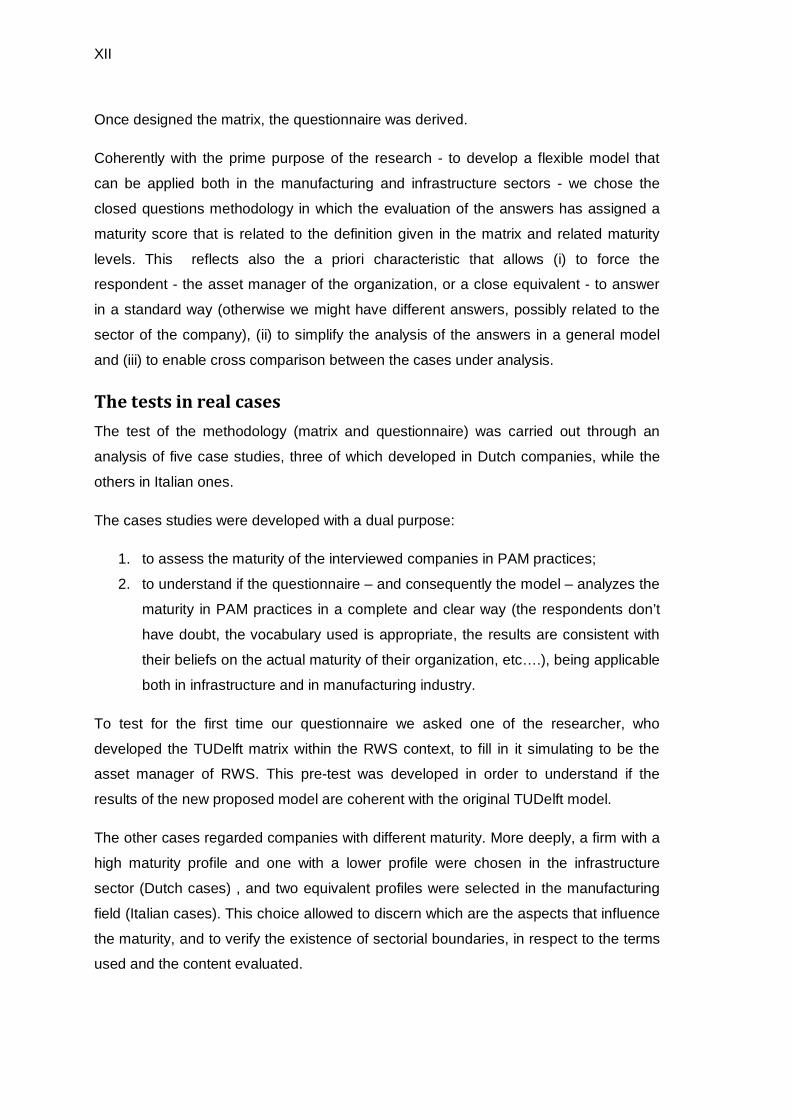
Once designed the matrix, the questionnaire was derived.
Coherently with the prime purpose of the research - to develop a flexible model that
can be applied both in the manufacturing and infrastructure sectors - we chose the
closed questions methodology in which the evaluation of the answers has assigned a
maturity score that is related to the definition given in the matrix and related maturity
levels. This reflects also the a priori characteristic that allows (i) to force the
respondent - the asset manager of the organization, or a close equivalent - to answer
in a standard way (otherwise we might have different answers, possibly related to the
sector of the company), (ii) to simplify the analysis of the answers in a general model
and (iii) to enable cross comparison between the cases under analysis.
The tests in real cases The test of the methodology (matrix and questionnaire) was carried out through an
analysis of five case studies, three of which developed in Dutch companies, while the
others in Italian ones.
The cases studies were developed with a dual purpose:
1. to assess the maturity of the interviewed companies in PAM practices;
2. to understand if the questionnaire – and consequently the model – analyzes the
maturity in PAM practices in a complete and clear way (the respondents don’t
have doubt, the vocabulary used is appropriate, the results are consistent with
their beliefs on the actual maturity of their organization, etc….), being applicable
both in infrastructure and in manufacturing industry.
To test for the first time our questionnaire we asked one of the researcher, who
developed the TUDelft matrix within the RWS context, to fill in it simulating to be the
asset manager of RWS. This pre-test was developed in order to understand if the
results of the new proposed model are coherent with the original TUDelft model.
The other cases regarded companies with different maturity. More deeply, a firm with a
high maturity profile and one with a lower profile were chosen in the infrastructure
sector (Dutch cases) , and two equivalent profiles were selected in the manufacturing
field (Italian cases). This choice allowed to discern which are the aspects that influence
the maturity, and to verify the existence of sectorial boundaries, in respect to the terms
used and the content evaluated.

XIII
In developing the case studies, we asked to the respondents to fill in the questionnaire,
underling doubts and cue of reflections. At the end, regarding the final/overall maturity
of the company, we showed our matrix the respondents (except the lowest mature,
since it was not considered ready for a self-assessment) and we asked them to
indicate at which level they were, by their opinions.
Main results The main outcomes of the research are:
• the maturity model itself that thanks to the use of standardized and well
recognized terms, can be applied both in manufacturing plants and
infrastructures;
• the “library” of PAM practices, now available in an unique source linked to
maturity levels;
• the empirical evidence gained during the case studies.
In particular, the model assumes that PAM practices follow pre-defined roadmaps that
pass through the implementation (the chaotic maturity level ML1), the partial
management of the process (ML2), the standardization (ML3), the quantitatively
management (ML4) and the optimization (ML5) phases. The pre-defined roadmaps
emerges both from the descriptions in the maturity matrix and from the order of the
answers in the questionnaire.
In fact, for each step of the roadmap, a set of PAM practices are defined. The
respondent, reading the answers, can both make a self-assessment on his/her
organization and envision what might be the possible developments to improve its PAM
practices as if he had available a “library” of practices that guides the reflection.
Coherently with the aims of the tests, the results gained during the case studies refer
to:
• the maturity assessment of PAM practices;
• the evaluation of the methodology.
Regarding the first aspect, the five following factors emerged as the key to discern the
maturity levels in PAM practices:
XIV
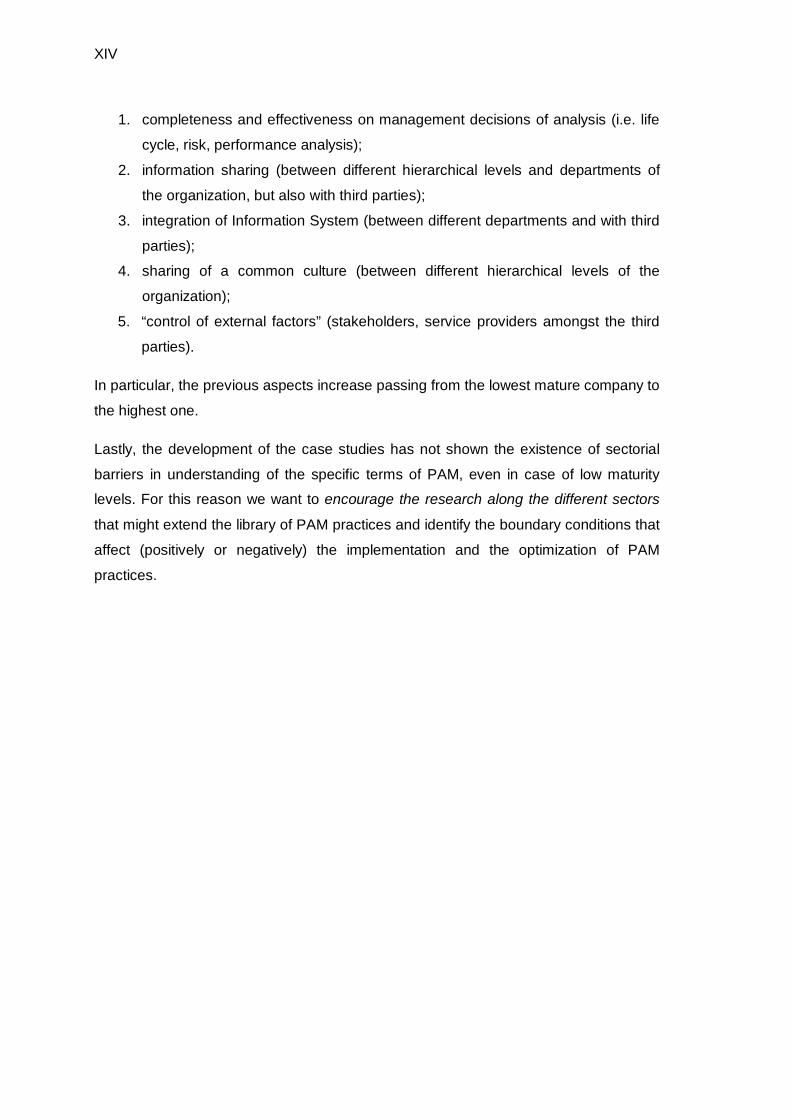
1. completeness and effectiveness on management decisions of analysis (i.e. life
cycle, risk, performance analysis);
2. information sharing (between different hierarchical levels and departments of
the organization, but also with third parties);
3. integration of Information System (between different departments and with third
parties);
4. sharing of a common culture (between different hierarchical levels of the
organization);
5. “control of external factors” (stakeholders, service providers amongst the third
parties).
In particular, the previous aspects increase passing from the lowest mature company to
the highest one.
Lastly, the development of the case studies has not shown the existence of sectorial
barriers in understanding of the specific terms of PAM, even in case of low maturity
levels. For this reason we want to encourage the research along the different sectors
that might extend the library of PAM practices and identify the boundary conditions that
affect (positively or negatively) the implementation and the optimization of PAM
practices.
XV
Executive Summary
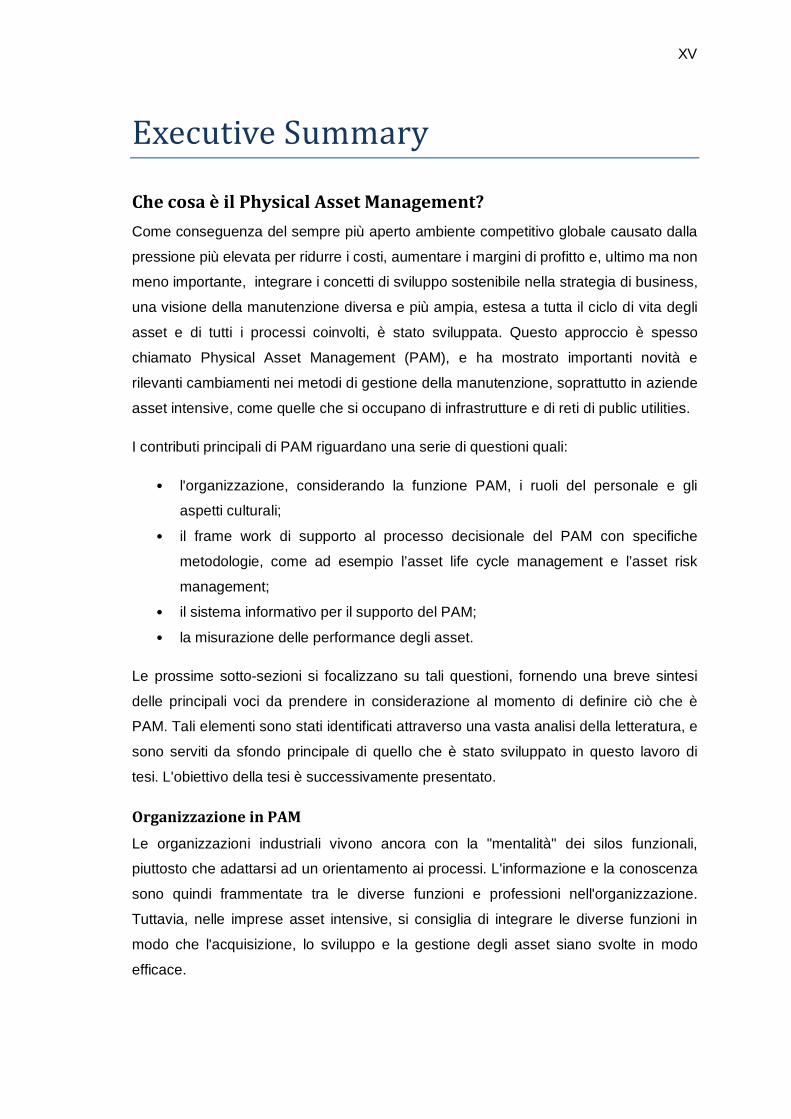
Che cosa è il Physical Asset Management? Come conseguenza del sempre più aperto ambiente competitivo globale causato dalla
pressione più elevata per ridurre i costi, aumentare i margini di profitto e, ultimo ma non
meno importante, integrare i concetti di sviluppo sostenibile nella strategia di business,
una visione della manutenzione diversa e più ampia, estesa a tutta il ciclo di vita degli
asset e di tutti i processi coinvolti, è stato sviluppata. Questo approccio è spesso
chiamato Physical Asset Management (PAM), e ha mostrato importanti novità e
rilevanti cambiamenti nei metodi di gestione della manutenzione, soprattutto in aziende
asset intensive, come quelle che si occupano di infrastrutture e di reti di public utilities.
I contributi principali di PAM riguardano una serie di questioni quali:
• l'organizzazione, considerando la funzione PAM, i ruoli del personale e gli
aspetti culturali;
• il frame work di supporto al processo decisionale del PAM con specifiche
metodologie, come ad esempio l’asset life cycle management e l’asset risk
management;
• il sistema informativo per il supporto del PAM;
• la misurazione delle performance degli asset.
Le prossime sotto-sezioni si focalizzano su tali questioni, fornendo una breve sintesi
delle principali voci da prendere in considerazione al momento di definire ciò che è
PAM. Tali elementi sono stati identificati attraverso una vasta analisi della letteratura, e
sono serviti da sfondo principale di quello che è stato sviluppato in questo lavoro di
tesi. L'obiettivo della tesi è successivamente presentato.
Organizzazione in PAM Le organizzazioni industriali vivono ancora con la "mentalità" dei silos funzionali,
piuttosto che adattarsi ad un orientamento ai processi. L'informazione e la conoscenza
sono quindi frammentate tra le diverse funzioni e professioni nell'organizzazione.
Tuttavia, nelle imprese asset intensive, si consiglia di integrare le diverse funzioni in
modo che l'acquisizione, lo sviluppo e la gestione degli asset siano svolte in modo
efficace.
XVI
Integrando diverse funzioni e conoscenze, la funzione PAM diventa spesso come una
zona grigia all'interno dell'organizzazione. Ma il PAM senza una posizione definita non
può lavorare in modo efficiente e/o efficace. E 'essenziale, quindi definire il ruolo della
funzione Asset Management e le relazioni con le altre funzioni aziendali, al fine di
evitare duplicazioni improduttive e contrasti. In particolare, lo scopo della Funzione
PAM è quello di fornire risorse e competenze per sostenere l'acquisizione, il supporto
durante la fase di servizio e di smaltimento degli asset dell'organizzazione. Più
precisamente, la funzione dell’asset management dovrà fornire input alla
pianificazione, assumere un ruolo importante nella fase di acquisizione e sviluppo, e
fornire i sistemi e le strutture necessarie per supportare le attività per tutto il ciclo di vita
degli asset.
Per la vasta gamma di responsabilità e contribuiti, la funzione PAM ha bisogno di
essere attiva, lungo tutti i livelli gerarchici dell'organizzazione: strategico, tattico e
operativo. Spesso, i tre livelli di gestione degli asset sono riconosciuti da tre figure
diverse, responsabili delle rispettive attività: il proprietario dell’asset (asset owner),
l’asset manager e il fornitore di servizi dell’asset (asset service provider). L’asset owner
è responsabile per la definizione dei criteri finanziari, tecnici, e di rischio. L’asset
manager è responsabile della traduzione di questi criteri in un piano di attività. L’asset
service provider è responsabile per l'esecuzione dei piani delle attività, e del
monitoraggio dei costi e delle prestazioni effettive. Questa struttura permette ad ogni
funzione di focalizzarsi su un aspetto preciso: l’asset owner sulla strategia aziendale,
l’asset manager sulla pianificazione e il budgeting, e l’asset service provider
sull’eccellenza operativa.
Asset owner, asset manager e asset service provider sono solo alcuni dei ruoli
appartenenti al gruppo PAM. In realtà, questo è un gruppo multidisciplinare in cui
collaborano manager con adeguato background tecnico e personale in ruoli contabile e
finanziari, legali, contrattuali, appalti e ingegneria.
Diverse persone, con diversi sfondi e doveri organizzativi, possono raggiungere gli
obiettivi dell’organizzazione solo condividendo un’unica Cultura di Asset Management
(essendo la cultura "l'insieme di atteggiamenti, valori, obiettivi e pratiche che
caratterizzano una istituzione, organizzazione o gruppo").
XVII
Frame work e metodologie decisionali del PAM In letteratura esistono diverse definizioni di PAM. L’asset management è definito dalla
PAS 55 come: “L’insieme delle azioni e pratiche sistematiche e coordinate tramite le
quali un’organizzazione gestisce in modo sostenibile e ottimizzato i suoi asset fisici,
controllandone le performance, i fattori di rischio e i costi lungo l’intero ciclo di vita con
l’obiettivo di raggiungere i propri obiettivi organizzativi e strategici”
Dalle definizioni di PAS 55, le caratteristiche dell’approccio PAM possono essere
dedotte e riassunte nei seguenti punti:
• globale: si integra la gestione di tutti gli aspetti degli asset in contrasto con
approcci specialistici e compartimenti;
• sistematico: ciò implica che PAM promuove azioni coerenti, ripetibili e
metodiche, fornendo un chiaro sostegno per il processo decisionale;
• sistemica: considera gli asset come un sistema e cerca di ottimizzare il sistema,
piuttosto che ottimizzare le singole attività isolate;
• ottimale: si cerca di stabilire il compromesso ottimale tra fattori concorrenti quali
le prestazioni, costi e rischi, associati agli asset lungo il loro ciclo di vita;
• in base al rischio: la valutazione dei rischi guida tutte le decisioni;
• sostenibile: il PAM considera il potenziale impatto negativo nel lungo termine
delle decisioni a breve termine.
Pertanto, il PAM comprende una gamma più ampia e molto diversa di attività rispetto
alla gestione della "manutenzione". La manutenzione è principalmente mantenere la
macchina esistente in condizioni di funzionamento, mentre il PAM si occupa di
applicare i principi tecnici e finanziari, e le pratiche di gestione, per decidere quali asset
sono necessari per soddisfare gli obiettivi di business, e quindi di acquisire, e
logisticamente sostenere gli asset lungo tutta la loro vita, fino allo smaltimento.
In questo nuovo approccio, le metodologie di gestione del ciclo di vita (asset life cycle
management) e di gestione dei rischi diventano fondamentali.
L’asset life cycle management offre una serie di vantaggi, quali la soddisfazione dei
clienti, il miglioramento delle prestazioni e il controllo della consegna del prodotto o
dell’erogazione servizio, il miglioramento della salute, della sicurezza e delle
prestazioni ambientali, l’ottimizzazione del rendimento degli investimenti e/o la crescita,
l’aumento della fiducia nella pianificazione a lungo termine e delle prestazioni legate
XVIII
alla sostenibilità, il miglioramento della gestione dei rischi e della corporate
governance.
La sfida nella gestione dell'intero ciclo di vita degli asset si trova effettivamente nel fatto
che i costi sono isolati e affrontati in modo frammentario attraverso le varie fasi.
Durante la fase di acquisizione si pone l'accento sull'attuazione di una tecnologia entro
i confini del bilancio approvato e del periodo di tempo prescritto, assicurando che
l'impianto acquistato sia conforme alle specifiche tecniche. I driver principali della fase
di utilizzo sono invece i costi connessi alla distribuzione dei prodotti, parti di ricambio e
di inventario, manutenzione, addestramento, ecc.
Secondo il life cycle management, occorre considerare i costi globali dall'acquisizione
alla fase di smaltimento, al fine di individuare l'opzione (nuovo investimento,
riparazione, ..) con il più basso costo del ciclo di vita che consente di soddisfare le
esigenze delle parti interessate.
L’asset management non riguarda solo la minimizzazione dei costi, ma si tratta di un
approccio integrato per bilanciare i costi, le prestazioni e i rischi durante il ciclo di vita
utile dell’asset.
Ci sono diverse categorie di rischi da considerare nell’approccio PAM: rischi di guasto
fisico, rischi operativi, fattori umani, eventi ambientali naturali, fattori al di fuori del
controllo dell'organizzazione, rischi di approvvigionamento, rischi per le parti
interessate. Infatti, la valutazione del rischio è importante in diverse aree
dell'organizzazione e diviene fondamentale nei progetti PAM. Lo scopo della funzione
di Risk Asset Management è quello di capire la causa, l'effetto e la probabilità di eventi
avversi che possono verificarsi durante la gestione di un asset, al fine di identificare
possibili trattamenti del rischio, come ad esempio le azioni di mitigazione o piani di
emergenza per ridurre l'impatto dell'evento avverso.
Sistema informativo e misurazione delle prestazioni nel PAM L’Asset Life Cycle Management comporta una notevole quantità di acquisizione,
elaborazione e analisi delle informazioni che consentono di gestire una varietà di
aspetti del ciclo di vita tra i quali la pianificazione, la progettazione, la manutenzione, la
riabilitazione e lo smaltimento/ristrutturazione o sostituzione degli asset. I Sistemi
Informativi (IS) diventano quindi necessari, al fine di integrare le informazioni tra le
diverse funzioni.
XIX
Il IS, nel contesto PAM, non ha solo il compito di fornire il supporto per il controllo
decentralizzato delle attività di manutenzione, ma anche di agire come strumento di
supporto alle decisioni, per esempio, al fine di risolvere i compromessi tra
manutenzione differita e manutenzione preventiva, tra correzioni a breve termine e
soluzioni a lungo termine.
In termini di flussi informativi, il PAM rappresenta un processo a due vie, in cui le sono
presenti flussi di informazioni verso valle (da livello strategico e livello operativo
dell’organizzazione) per definire le strategie in ogni fase del ciclo di vita e le risorse
necessarie e flussi di informazioni verso monte (da livello operativo a livello strategico)
che forniscono un feedback sull’efficacia dell'attuazione di queste strategie. Per
conoscere l'efficienza e l'efficacia della gestione degli asset, la valutazione delle
performance degli asset è diventata parte integrante del business di oggi. Questi
sistemi di misurazione devono riflettere il contesto e gli obiettivi dell'organizzazione. La
mancanza di integrazione tra vari soggetti e le loro esigenze mutevoli nella valutazione
strategica delle performance degli asset è ancora un grosso problema per le aziende.
Obiettivi del lavoro Il lavoro di tesi specialistica è finalizzato allo sviluppo e sperimentazione di un modello
per la valutazione della maturità delle pratiche di PAM. L'idea ispiratrice voleva che il
modello dovesse essere sviluppato per essere adatto ad applicazioni in diversi settori,
in particolare nel settore degli impianti industriali ad alta intensità di capitali, reti di
servizi e infrastrutture (acqua, energia, gas, ferroviaria, ... ).
Più in profondità, gli obiettivi di questa ricerca sono stati tre:
• studiare e capire le migliori pratiche emerse dopo l'introduzione del PAM;
• definire una metodologia di valutazione di maturità per le aziende che
introducono il PAM;
• testare la nuova metodologia in casi reali, per verificare la sua capacità di
applicazione in diversi campi.
Attraverso la revisione della letteratura, le pratiche di PAM sono state analizzate e
classificate in modo da capire quali sono i fattori chiave che le aziende hanno bisogno
di prendere in considerazione nella gestione dei propri asset e come questi elementi
influenzano la strategia di business e i risultati. La sezione precedente di questa sintesi
ha già mostrato alcuni spunti sui risultati della revisione della letteratura.
XX
Dal punto di vista metodologico, il lavoro è finalizzato allo studio e alla valorizzazione
delle potenzialità dei approcci preesistenti di valutazione. In altre parole, questa tesi ha
voluto perseguire un’integrazione per consentire un ulteriore sviluppo e test di tali
metodologie preesistenti. Il modello di valutazione di maturità, risultante
dall'integrazione, cerca di unire le forze in modo da definire finalmente una
metodologia flessibile che possa essere applicata senza limiti settoriali, sia per il
contenuto e che per la terminologia utilizzata.
I test in casi reali, infine, hanno voluto verificare la capacità, del modello di valutazione
della maturità, di essere applicato in diversi campi. A tal fine, gli obiettivi principali di
interesse per lo studio dei casi sono stati i seguenti:
• la capacità del modello di discernere gli aspetti che influenzano la maturità
dell'organizzazione in esame,
• la completezza del modello,
• la loro comprensione dei termini e dei contenuti utilizzati nel test da parte
dell’intervistato,
• le possibilità di ulteriori miglioramenti della stessa metodologia.
La metodologia Un modello di maturità può essere visto come un insieme di livelli strutturati che
descrivono il modo in cui i diversi processi di un'organizzazione sono in grado di
produrre i risultati richiesti in modo affidabile e sostenibile.
Questo lavoro di tesi è iniziato dal confronto tra due modelli di maturità, entrambi basati
sulla metodologia del Capability Maturity Model Integrated (CMMI). Il primo è stato
sviluppato da un gruppo di ricerca presso il Politecnico di Milano, Dipartimento di
Ingegneria Gestionale, più precisamente, la metodologia è il risultato delle attività di
ricerca svolte nell'ambito dell’Osservatorio TeSeM del Politecnico di Milano. Il secondo
è stato sviluppato da un gruppo di ricerca presso Delft University of Technology (TU
Delft), Facoltà di Technology, Policy and Management (TPM).
Per capire meglio l'approccio olandese, una parte del lavoro è stato sviluppato nei
Paesi Bassi, dove molte aziende, in particolare nel settore delle infrastrutture, hanno
implementato con successo il PAM. A questo proposito, il gruppo di ricerca della
TUDelft rappresenta un punto di riferimento nella fornitura di servizi di consulenza e
supporto per la comprensione dei principi dell’asset management.

XXI
Lo sviluppo riflette anche altri riferimenti presenti nella letteratura della valutazione
della maturità. Nella parte restante di questa sintesi è data una panoramica sul modello
TeSeM e modello TUDelft, come principali fonti di ispirazione.
Modello TeSeM Lo scopo del modello TeSeM è quello di analizzare come le pratiche di manutenzione
sono attualmente impostate in una organizzazione, con particolare attenzione su come
le nuove pratiche siano state sviluppate grazie al progresso nell'uso di strumenti ICT/
dispositivi per la diagnostica, prognostica e ingegneria di manutenzione. Più in
profondità, questo modello si propone di valutare aspetti tecnologici, organizzativi e di
gestione di manutenzione, attraverso la definizione di tre punteggi sintetici che
riassumono i comportamenti aziendali. Come risultato finale, la maturità nella gestione
della manutenzione è valutata sia con un indice sintetico, l’Indice di Maturità Generale
(GMI), sia come combinazione di un insieme di indici, Indice di Maturità Manageriale
(MMI), organizzativa (OMI) e Tecnologica (TMI) corrispondenti a PA (aree di processo)
identificate.
Per ogni PA sono state formulate relative domande in un questionario di rilevazione.
Per ogni domanda, sono definiti i punteggi secondo la score card di maturità e, quindi,
intervistando il responsabile della manutenzione di una società, è possibile calcolare
tutti gli indici di maturità. Il GMI si ottiene moltiplicando i tre indici (GMI = MMI x OMI x
TMI).
Il modello di valutazione della maturità del TeSeM - e il suo questionario - sono stati
sviluppati sulla base di una serie di caratteristiche. Prima di tutto, è un modello "a
priori". Ciò significa che, per ogni risposta nel questionario, deve essere chiaro come
valutare in modo indiscutibile, il livello di maturità. In questo modo, non ci sarà alcuna
differenza se il livello di maturità è assegnato da diversi intervistatori/valutatori. In
secondo luogo, grazie all'utilizzo di domande a risposta chiusa, è utilizzabile per un
sondaggio/survey e il questionario è più facile e veloce da compilare, può essere
anche utilizzato in interviste telefoniche, o con personale meno qualificato. In terzo
luogo, i livelli di maturità sono definiti, al fine di capire quali potrebbero essere i possibili
miglioramenti ulteriori in un sistema di manutenzione e questo rende il modello adatto
per una valutazione dinamica. Ultimo, ma non meno importante, il modello è progettato
per adozione flessibile, in modo da essere il più possibile adattabile alle diverse
esigenze e situazioni.
XXII
Modello TUDelft Il modello di maturità della TUDelft è stato sviluppato sotto richiesta dell'Autorità
stradale Olandese (RWS), al fine di valutare la maturità della società e individuare
proposte di miglioramento delle pratiche di PAM.
È progettato specificamente per le pratiche Asset Management, e quindi focalizza
maggiormente la sua attenzione, come impostazione predefinita, sugli aspetti
organizzativi e gestionali, e sui fattori umani per il loro legame alla strategia e al
successo della società; inoltre, sono presenti aree specifiche per la coordinamento
interno ed esterno. Precisamente, il modello indaga sette PAs che sono: gestione delle
informazioni, coordinamento interno, coordinamento esterno, meccanismo di mercato,
risk management, processi e ruoli e cultura e leadership.
Lo strumento che supporta le interviste e la valutazione non è un questionario per
survey, ma una matrice di maturità in cui le colonne sono la PAs indagate e le righe i
livelli di maturità. Utilizzando domande aperte gli intervistatori hanno l'opportunità di
fare maggiori considerazioni sul profilo di maturità delle organizzazioni, modificando le
domande in relazione alle risposte date dagli intervistati e chiarire eventuali dubbi
durante l'intervista. Di contro, sia la raccolta dei dati che l'analisi delle risposte
richiedono più tempo e considerazioni, legate all'esperienza degli intervistatori. L'analisi
è particolarmente influenzata dalla conoscenza del settore e, pertanto, non si può
trovare la flessibilità, forza del questionario TeSeM.
Il nuovo modello Lo sviluppo del modello proposto in questa tesi è passato attraverso la definizione di
una nuova matrice di maturità da cui è stato derivato un nuovo questionario.
Il primo passo consiste nella scelta di come sviluppare la matrice di maturità, quindi
quali indici e aree di processo considerare per ciascun indice. I tre indici utilizzati nel
modello TeSeM si adattano bene all'analisi dei servizi di manutenzione ma omettono
aspetti importanti che devono essere considerati nella valutazione dell’esteso campo
del PAM. Al contrario, i sette indici individuati nella matrice TUDelft sono troppo legati
al campo di applicazione del modello: per esempio, il coordinamento interno -
all'interno di questa matrice - riguarda la struttura divisionale dell'Autorità stradale e
quindi la necessità di strutturare un modo condiviso la comunicazione tra i diversi
reparti.
XXIII
Un'altra considerazione riguarda il numero di indici, e il loro rapporto con le aree di
processo (PA), per cui vengono indagate le pratiche PAM. Abbiamo scelto la
valutazione a domande chiuse, quindi per ogni PA abbiamo dovuto formulare una serie
di domande che possano spiegare la maturità della PA, in relazione ai diversi livelli di
maturità delle pratiche PAM (di base, buone, pratiche migliori ...). Ciascuna PA è stata
poi associata ad un indice. Questo ha portato alla necessità di risolvere un
compromesso tra la profondità dell'analisi e il numero di domande inserite nel
questionario per la valutazione maturità. Con un elevato numero di indici di maturità, la
valutazione può coprire più aspetti/PAs del PAM, ma abbiamo bisogno di avere un
numero considerevole di domande e questo potrebbe scoraggiare gli intervistati. Di
contro, abbiamo dovuto trovare un numero sufficiente di indici attraverso i quali
abbiamo potuto sviluppare un lavoro di analisi esaustivo attraverso le principali PAs.
Abbiamo quindi individuato quattro indici di maturità fondamentali, utilizzati per
calcolare la maturità in diverse aree di processo. Gli indici sono stati anche visualizzati
in una matrice di maturità (colonne della matrice).
• Gestione delle decisioni. Si riferisce alle principali decisioni che l’asset manager
deve prendere in considerazione nella gestione degli asset della società,
tenendo conto della gestione del ciclo di vita, gestione dei rischi e gestione
della manutenzione.
• Gestione del flusso informativo. Si riferisce agli aspetti di gestione delle
informazioni relative agli strumenti/sistemi ICT, metodi di monitoraggio e
prognostici, registrazione dei dati e gestione delle prestazioni.
• Organizzazione e cultura. Qui, andiamo in profondità nelle questioni
organizzative. La funzione e team del PAM, la cultura, la comunicazione e la
formazione sono i temi presi in considerazione nell'ambito di questo indice.
• Coordinamento esterno. Questo indice riguarda i rapporti con i terzi, quali le
parti interessate, per quanto riguarda la capacità di comprendere e seguire le
loro esigenze, e fornitori, in merito alle informazioni condivise e ai piani.
Per quanto riguarda i livelli di maturità, abbiamo deciso di utilizzare i cinque livelli
definiti lungo l'approccio continuo del CMMI. I livelli sono stati associati ad un
corrispondente punteggio di maturità.
• Iniziale (anche caotico, ad hoc, eroismi individuali): il punto di partenza per
l'utilizzo di un processo nuovo o non documentato.
XXIV
• Gestito: il processo è almeno sufficientemente documentato, in modo tale che
possa essere replicato ripetendo la stessa procedura.
• Definito: il processo è definito/confermato come un processo standard di
business e decomposto a livello tattico e operativo.
• Quantitativamente gestito: il processo è quantitativamente gestito secondo
metriche concordate.
• Ottimizzazione: la gestione del processo comprende l'ottimizzazione e il
miglioramento del processo stesso.
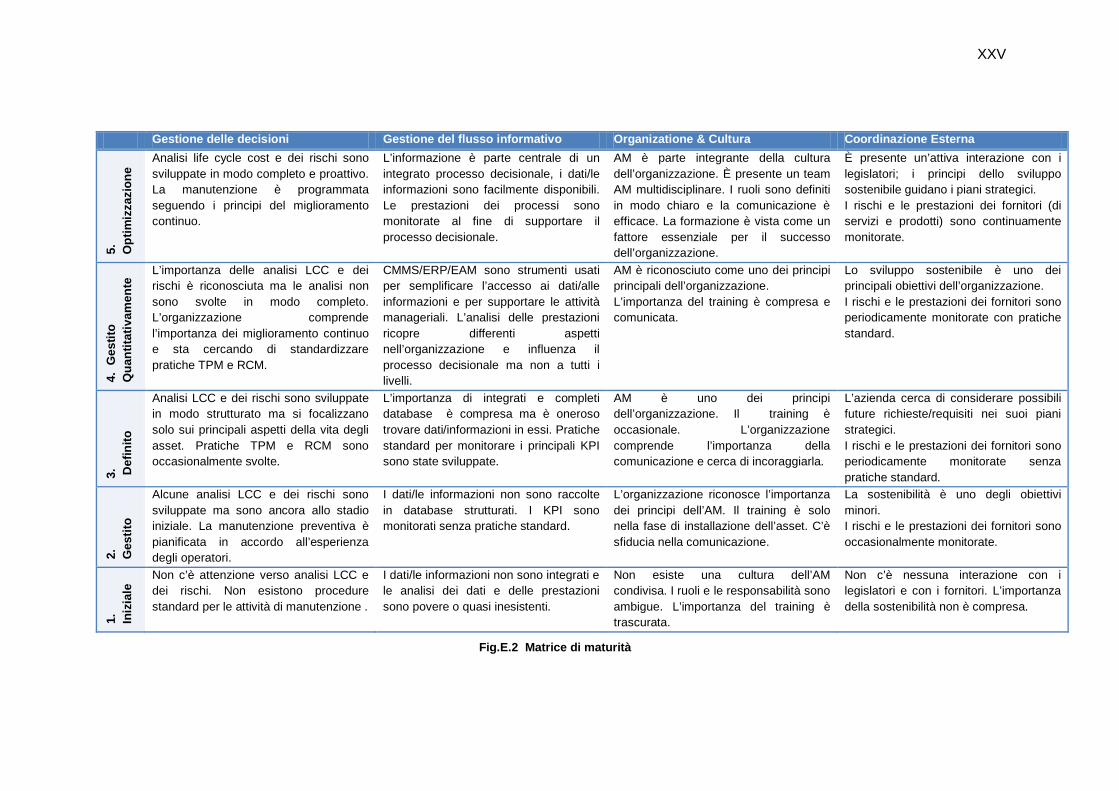
La matrice risultante - in cui gli indici di maturità sono le colonne ed i livelli di maturità
sono le righe - mostra la crescita progressiva della maturità nella PA: la descrizione
corrispondente testuale, che caratterizza ogni livello di maturità e l'indice, sintetizza
infatti le principali pratiche conseguite in quel livello. La figura seguente mostra la
matrice.
XXV
Gestione delle decisioni Gestione del flusso informativo Organizatione & Cultura Coordinazione Esterna
5.
Opt
imiz
zazi
one
Analisi life cycle cost e dei rischi sono sviluppate in modo completo e proattivo. La manutenzione è programmata seguendo i principi del miglioramento continuo.
L’informazione è parte centrale di un integrato processo decisionale, i dati/le informazioni sono facilmente disponibili. Le prestazioni dei processi sono monitorate al fine di supportare il processo decisionale.
AM è parte integrante della cultura dell’organizzazione. È presente un team AM multidisciplinare. I ruoli sono definiti in modo chiaro e la comunicazione è efficace. La formazione è vista come un fattore essenziale per il successo dell’organizzazione.
È presente un’attiva interazione con i legislatori; i principi dello sviluppo sostenibile guidano i piani strategici. I rischi e le prestazioni dei fornitori (di servizi e prodotti) sono continuamente monitorate.
4. G
estit
o Q
uant
itativ
amen
te L’importanza delle analisi LCC e dei
rischi è riconosciuta ma le analisi non sono svolte in modo completo. L’organizzazione comprende l’importanza dei miglioramento continuo e sta cercando di standardizzare pratiche TPM e RCM.
CMMS/ERP/EAM sono strumenti usati per semplificare l’accesso ai dati/alle informazioni e per supportare le attività manageriali. L’analisi delle prestazioni ricopre differenti aspetti nell’organizzazione e influenza il processo decisionale ma non a tutti i livelli.
AM è riconosciuto come uno dei principi principali dell’organizzazione. L’importanza del training è compresa e comunicata.
Lo sviluppo sostenibile è uno dei principali obiettivi dell’organizzazione. I rischi e le prestazioni dei fornitori sono periodicamente monitorate con pratiche standard.
3.
Def
inito
Analisi LCC e dei rischi sono sviluppate in modo strutturato ma si focalizzano solo sui principali aspetti della vita degli asset. Pratiche TPM e RCM sono occasionalmente svolte.
L’importanza di integrati e completi database è compresa ma è oneroso trovare dati/informazioni in essi. Pratiche standard per monitorare i principali KPI sono state sviluppate.
AM è uno dei principi dell’organizzazione. Il training è occasionale. L’organizzazione comprende l’importanza della comunicazione e cerca di incoraggiarla.
L’azienda cerca di considerare possibili future richieste/requisiti nei suoi piani strategici. I rischi e le prestazioni dei fornitori sono periodicamente monitorate senza pratiche standard.
2.
Ges
tito
Alcune analisi LCC e dei rischi sono sviluppate ma sono ancora allo stadio iniziale. La manutenzione preventiva è pianificata in accordo all’esperienza degli operatori.
I dati/le informazioni non sono raccolte in database strutturati. I KPI sono monitorati senza pratiche standard.
L’organizzazione riconosce l’importanza dei principi dell’AM. Il training è solo nella fase di installazione dell’asset. C’è sfiducia nella comunicazione.
La sostenibilità è uno degli obiettivi minori. I rischi e le prestazioni dei fornitori sono occasionalmente monitorate.
1.
Iniz
iale
Non c’è attenzione verso analisi LCC e dei rischi. Non esistono procedure standard per le attività di manutenzione .
I dati/le informazioni non sono integrati e le analisi dei dati e delle prestazioni sono povere o quasi inesistenti.
Non esiste una cultura dell’AM condivisa. I ruoli e le responsabilità sono ambigue. L’importanza del training è trascurata.
Non c’è nessuna interazione con i legislatori e con i fornitori. L’importanza della sostenibilità non è compresa.
Fig.E.2 Matrice di maturità

XXVI
Una volta progettata la matrice, è stato derivato il questionario.
Coerentemente con l'obiettivo principale della ricerca - sviluppare un modello flessibile che
possa essere applicato sia nel settore manifatturiero e che nelle infrastrutture - abbiamo
scelto la metodologia a domande chiuse in cui alla valutazione delle risposte è assegnata
un punteggio di maturità legato alle definizioni contenute nei livelli di maturità dei relativi
matrici. Ciò riflette anche la caratteristica a priori che permette di (i) forzare l’intervistato –
l’asset manager dell'organizzazione, o equivalente - a rispondere in modo standard
(altrimenti potremmo avere risposte diverse, forse in relazione al settore del azienda), (ii)
semplificare l'analisi delle risposte in un modello generale e (iii) consentire un confronto
incrociato tra i casi analizzati.
Le prove in casi reali Il test della metodologia (matrice e questionario) è stato effettuato attraverso l'analisi di
cinque casi di studio, tre dei quali sviluppati in aziende olandesi, mentre i restanti in
italiane.
I casi di studio sono stati sviluppati con un duplice scopo:
1. valutare la maturità delle imprese intervistate nelle pratiche PAM;
2. capire se il questionario - e di conseguenza il modello - analizza la maturità nelle
pratiche PAM in modo completo e chiaro (gli intervistati non hanno dubbi, il
vocabolario utilizzato è appropriato, i risultati sono coerenti con le loro convinzioni
sulla maturità effettiva della loro organizzazione, ecc ....), e se è applicabile sia
nelle infrastrutture che nel settore manifatturiero.
Per eseguire il test per la prima volta abbiamo chiesto a uno dei ricercatori, che ha
sviluppato la matrice TUDelft nel contesto RWS, di compilare il nostro questionario
simulando di essere l’asset manager di RWS. Questo pre-test è stato sviluppato per capire
se i risultati del nuovo modello proposto siano coerenti con il modello TUDelft originale.
Gli altri casi considerano aziende con diversa maturità. Più in profondità, una società con
un alto profilo di maturità e una con un profilo più basso sono state scelte nel settore delle
infrastrutture (casi olandesi), e due profili equivalenti sono stati selezionati nel settore
manifatturiero (casi italiani). Tale scelta ha consentito di discernere quali sono gli aspetti
XXVII
che influenzano la maturità, e di verificare l'esistenza di confini settoriali, rispetto ai termini
usati e il contenuto valutato.
Nello sviluppo dei casi di studio, abbiamo chiesto agli intervistati di compilare il
questionario, sottolineando dubbi e spunti di riflessioni. Alla fine, per quanto riguarda la
maturità finale/generale della società, abbiamo mostrato la nostra matrice agli intervistati
(eccetto al rispondente della società meno matura, in quanto ritenuto non pronto per una
auto-valutazione) e abbiamo chiesto loro di indicare a quale livello si attestassero, in base
alle loro opinioni.
Principali risultati I principali risultati della ricerca sono:
• Il modello di maturità stesso che grazie all'utilizzo di termini standardizzati e ben
riconosciuti, può essere applicato in impianti di produzione e in infrastrutture;
• La "libreria" delle pratiche PAM, disponibili ora in un’unica fonte e legate al
livello di maturità;
• L'evidenza empirica acquisita durante gli studi dei casi.
In particolare, il modello assume che le pratiche PAM seguono predefiniti roadmap che
passano attraverso le fasi di attuazione (livello di maturità caotico ML1), gestione parziale
del processo (ML2), standardizzazione (ML3), gestione quantitativa (ML4) e ottimizzazione
(ML5). La roadmap predefinita emerge sia dalle descrizioni della matrice di maturità che
dall'ordine delle risposte del questionario.
Infatti, per ogni passo del percorso di maturità, un insieme di pratiche PAM sono definite.
L’intervistato, leggendo le risposte, può effettuare una auto-valutazione sulla sua
organizzazione e immaginare quali potrebbero essere i possibili sviluppi per migliorare le
pratiche PAM come se avesse a disposizione una "libreria" delle pratiche che guidi la
riflessione.
Coerentemente con le finalità delle prove, i risultati ottenuti durante lo studio dei casi si
riferiscono alla:
• valutazione delle pratiche di maturità PAM;
XXVIII
• valutazione della metodologia.
Per quanto riguarda il primo aspetto, i cinque seguenti fattori sono emersi come la chiave
per discernere i livelli di maturità nelle pratiche di PAM:
1. completezza ed efficacia delle analisi nelle decisioni di gestione (ad esempio,
analisi life cycle, del rischio e delle prestazioni);
2. scambio di informazioni (tra i diversi livelli gerarchici e dipartimenti
dell'organizzazione, ma anche con soggetti terzi);
3. integrazione del sistema informativo (tra i vari dipartimenti e con soggetti terzi);
4. condivisione di una cultura comune (tra i diversi livelli gerarchici
dell'organizzazione);
5. "Controllo dei fattori esterni" (stakeholders, fornitori di servizi tra i terzi).
In particolare, gli aspetti precedenti aumentano passando dall’azienda con più basso
profilo di maturità a quello con più alto.
Infine, lo sviluppo di casi di studio non ha dimostrato l'esistenza di barriere settoriali nella
comprensione dei termini specifici del PAM, anche in caso di bassi livelli di maturità. Per
questo motivo vogliamo incoraggiare la ricerca lungo i diversi settori al fine di estendere la
libreria di pratiche PAM e definire le condizioni al contorno che influenzano (positivamente
o negativamente) l'attuazione e l'ottimizzazione delle pratiche PAM.
Contents
Chapter.1 Research outline ..................................................................................... 7
1.1 Research objectives ....................................................................................... 7
1.2 Research context ........................................................................................... 8
1.3 Research overview ......................................................................................... 9
Chapter.2 Literature review on Physical Asset Management ............................. 11
2.1 An introduction of Physical Asset Management .......................................... 11
2.1.1 What is a Physical Asset .................................................................. 11
2.1.2 The importance of Physical Asset Management ............................. 12
2.1.3 Changes in the maintenance approach ........................................... 14
2.1.4 The sustainability issue....................................................................... 17
2.2 Physical Asset Management in the organization ........................................ 18
2.2.1 The “Grey zone” ............................................................................... 19
2.2.2 How Physical Asset Management function should be .................... 20
2.2.3 Personnel roles in Physical Asset Management ............................. 23
2.2.4 Physical Asset Management Culture ............................................... 25
2.3 What is Physical Asset Management .......................................................... 28
2.3.1 Definitions of Physical Asset Management ........................................ 29
2.3.2 Asset Management System ............................................................. 30
2.3.3 Asset Life Cycle Management ......................................................... 38
2.3.4 Risk Asset Management .................................................................. 40
2.4 Data, Information and Knowledge in Physical Asset Management ............ 43
2.4.1 Asset management data life cycle ..................................................... 44
2.4.2 Information Flows In Physical Asset Management ......................... 47
2.4.3. Asset Knowledge ............................................................................ 50
2.5 Asset Performance Assessment ................................................................... 54
2.5.1 Issues related to Key Performance Indicators ................................. 55
2.5.2. Frameworks of Key Performance Indicators .................................. 56
2.5 Concluding Remarks .................................................................................... 59
2
Maturity assessment for Physical Asset Management: Evidence from Manufacturing Plants and Infrastructures
Chapter 3. Maturity Assessment Methodology ......................................................... 61
3.1 Introduction to maturity models and their benefits ....................................... 61
3.2 The Capability Maturity Model Integrated methodology .............................. 62
3.3 The TeSeM Maintenance Maturity Assessment Model ............................... 63
3.4 The TUDelft Infrastructure Maturity Model ................................................... 68
3.5 Considerations about the two models .......................................................... 71
3.6 The Port et al. Maintenance Maturity Model ................................................ 73
3.7 Concluding remarks ..................................................................................... 75
Chapter 4. The model for maturity assessment .................................................... 77
4.1 The Maturity Matrix ....................................................................................... 78
4.2 The questionnaire ......................................................................................... 80
A) General information ................................................................................. 80
B) Management Decisions Index (MDI) ....................................................... 80
Consideration about the Management Decisions Index .............................. 98
C) Information Management Index (IMI) ...................................................... 98
D) Organization & Culture Index (OCI) ...................................................... 106
E) External Coordination Index (ECI)......................................................... 117
4.3 Concluding remarks .................................................................................... 123
Chapter. 5 Testing the model through case studies ............................................... 125
5.1 Pre – test: RWS .......................................................................................... 126
5.2 Dutch cases: INFRAen and INFRAwt ........................................................ 132
5.2.1 INFRAen ............................................................................................ 132
5.2.2 INFRAwt ............................................................................................ 140
5.3 Italian cases: PROCvr and PROCpt .......................................................... 147
5.3.1 PROCvr ............................................................................................. 147
5.3.2. PROCpt ........................................................................................... 154
5.4 Assessment of the methodological approach ............................................ 160
3
Maturity assessment for Physical Asset Management: Evidence from Manufacturing Plants and Infrastructures
Chapter 6. Conclusions.............................................................................................. 162
6.1 Research outcomes ................................................................................... 162
6.2 Future researches ...................................................................................... 165
References………. ....................................................................................................... 166
Appendix 1 – Questionnaire ............................................................................................ 174
4
Maturity assessment for Physical Asset Management: Evidence from Manufacturing Plants and Infrastructures
Index of Figures
Fig.1.1 Factors around PAM, from Mather, 2003 .......................................................... 9
Fig.2.1 Investment life cycle and driving forces of asset management (from Komonen
et al. 2012) 13
Fig.2.2 PAM as a “grey zone” between business development and operations
management (sourced from Hastings, 2010) .............................................................. 20
Fig.2.3 PAM in the organization – corporate level (sourced from Hastings, 2010) .... 21
Fig.2.4 PAM in the organization – divisional level (sourced from Hastings, 2010) ..... 22
Fig.2.5 Asset management is based on three functions (asset owner, asset manager
and asset service provider), a single process and many decisions (sourced from
Brown and Humphrey, 2005) ....................................................................................... 23
Fig.2.6 Asset Management System from PAS 55, 2008 ............................................. 31
Fig.2.7 Schematic presentation of the Asset Management decision making framework
from Komonen et al., 2006 ........................................................................................... 33
Fig.2.8 Asset Management levels: framework and holistic management of production
assets from Komonen et al., 2012 ............................................................................... 33
Fig.2.9 PAM: how to reach the strategic plan, source IAM, 2010 ............................... 35
Fig.2.10 Life Cycle phases of process asset system from Blanchard and Fabrycky,
1998 .............................................................................................................................. 39
Fig.2.11 Life cycle cost analysis from Crespo et al. (2009) ......................................... 40
Fig.2.12 Asset Management tools by position in data lifecycles from Baglee et al.,
2012 .............................................................................................................................. 47
Fig.2.13 Downstream and upstream flow of information (from Haider, 2008) ............ 48
Fig.2.14 Multi-criteria hierchical MPA framework for Engineering Asset (adapted from
Parida and Chattopadhyay, 2007). HSE = Health, Safety and Environment; ROMI =
Return on Maintenance Investment; OEE = Overall Equipment Effectiveness; MTBF =
Mean time between; MTTR = Mean time to repair ...................................................... 58
Fig.3.1 Results of the 2011 and 2012 measurement with the Infrastructure
Management Maturity Matrix at Rijkswaterstraat (from Volker et al., 2012) ............... 70
Fig.3.2 Example of dashboards in TeSeM model in which the red line represents the
average maturity of the sector while the black line the maturity of the company (from
report developed for individual company) ................................................................... 72
Fig.3.3 Elements of maintenance excellence from Port et al., 2010 ........................... 74
5
Maturity assessment for Physical Asset Management: Evidence from Manufacturing Plants and Infrastructures
Index of Tables
Table 3.1 Maturity Levels in TeSeM model ................................................................. 65
Table 3.2 Reworking of Maturity Levels in TeSeM model ........................................... 67
Table 3.3 PAs investigated in TeSeM model ............................................................... 68
Table 4.1 Process area of the new model ................................................................... 79
Table 4.2 Summarizing table - LCMi ............................................................................ 86
Table 4.3 Simulation Score – LCMi ............................................................................. 87
Table 4. 4 Summarizing table - ARMi .......................................................................... 93
Table 4.5 Summarizing table - MMi ............................................................................. 97
Table 4.6 Summarizing table IFSi .............................................................................. 102
Table 4.7 Summarizing table - APMi ......................................................................... 106
Table 4.8 Summarizing table – OCIi .......................................................................... 116
Table 4.9 Summarizing table - ECIi ........................................................................... 122
Table 4.10 Maturity Matrix .......................................................................................... 124
Table 5.1 RWS Management Decision Index ............................................................ 126
Table 5.2 RWS Information Management Index ....................................................... 127
Table 5.3 RWS Organization & Culture Index ........................................................... 127
Table 5.4 RWS External Coordination Index ............................................................. 129
Table 5.5 RWS Maturity Matrix .................................................................................. 131
Table 5.6 INFRAen Management Decision Index ..................................................... 132
Table 5.7 INFRAen Information Management Index ................................................. 134
Table 5.8 INFRAen Organization & Culture Index ..................................................... 135
Table 5.9 INFRAen External Coordination Index ...................................................... 137
Table 5.10 INFRAen Maturity Matrix .......................................................................... 139
Table 5.11 INFRAwt Management Decision Index.................................................... 140
Table 5.12 INFRAwt Information Management Index ............................................... 142
Table 5.13 INFRAwt Organization & Culture Index ................................................... 143
Table 5.14 INFRAwt External Coordination Index ..................................................... 144
Table 5.15 INFRAwt Maturity Matrix .......................................................................... 146
Table 5.16 PROCvr Management Decision Index ..................................................... 147
Table 5.17 PROCvr Information Management Index ................................................ 149
Table 5.18 PROCvr Organization & Culture Index .................................................... 150
6
Maturity assessment for Physical Asset Management: Evidence from Manufacturing Plants and Infrastructures
Table 5.19 PROCvr External Coordination Index ...................................................... 152
Table 5.20 PROCvr Maturity Matrix ........................................................................... 153
Table 5.21 PROCpt Management Decision Index .................................................... 154
Table 5.22 PROCpt Information Management Index ................................................ 155
Table 5.23 PROCpt Organization & Culture Index .................................................... 156
Table 5.24 PROCpt External Coordination Index ...................................................... 157
Table 5.25 PROCpt Maturity Matrix ........................................................................... 159

Maturity assessment for Physical Asset Management: Evidence from Manufacturing Plants and Infrastructures
Chapter.1 Research outline
This Chapter briefly introduces the research work, contextualizing it and highlighting
its purposes.
Section 1 is dedicated to a description and a formalization of the objectives of this
thesis; in Section 2, the context of the present work is cleared out; finally, in Section
3, an overview of the key steps of the research is provided.
1.1 Research objectives
This Master of Science thesis work aims at developing and testing a model for the
maturity assessment of Physical Asset Management (PAM) practices, adequate to be
applied in the field of capital intensive manufacturing plants, services networks and
infrastructures (water, energy, gas, railway infrastructure,...).
More deeply, the aims of this research are:
• to study and understand the best practices emerged after PAM introduction;
• to define a maturity assessment methodology for companies who introduces
PAM;
• to test the new methodology in real cases, in order to verify its capability to be
applied in different fields.
From a methodological perspective, the work aims at studying and enhancing the
potentialities of pre-existent maturity assessment approaches. The former has been
developed by a research group at Politecnico di Milano, Dept. of Management,
Economics and Industrial Engineering; more precisely, the methodology is the result
of the research activities carried out in the frame of TeSeM Observatory (on
Technologies and Services for Maintenance) of School of Management of Politecnico
di Milano. The latter has been developed by a research group at Delft University of
Technology (TUDelft), Faculty Technology, Policy and Management (TPM). This
thesis work wants to pursue an integration to allow a further development and test of
8 Chapter 1
Maturity assessment for Physical Asset Management: Evidence from Manufacturing Plants and Infrastructures
the cited methodologies of maturity assessment. The development reflects also other
references from literature background in maturity assessment.
1.2 Research context
Physical Asset Management (PAM) is spreading in a context in which many needs
are issued.
• Society has become increasingly intolerant of industrial incidents, particularly
in the areas of safety and environmental integrity: it is no longer considered
acceptable to cause harm to either the environment or to people and the
communities that they live in (Mather, 2003). In the last years this has been
reflected in various changes in legislation and regulation in countries around
the world and is leading companies to pay more attention to their impact on
environment and society (Mather, 2003).
• Maintenance costs are often very high and they are following an increasing
trend. One of the major factors behind this trend is that we are more
dependent on machinery than in the past. Where previously people work,
today machineries work. In fact, thanks to the development of automation and
technology people are substituted by machineries in a lot of industrial sector
(Dunn, 1987).
• Economic fluctuation and market uncertainty demand for higher profits and a
better Return on Assets (ROA) and this can lead to very difficult and risky
investment decisions. Characteristic for the capital-intensive industry is the
need for large capital investments for both starting the business and running it,
such as for machinery investments to increase capacity and the efficiency of
production processes or to replace existing production equipment. In addition,
resources are allocated to R&D to develop and produce new products and
services (Räikkönen et al., 2010).
The next picture highlights main factors correspondingly involved in PAM.
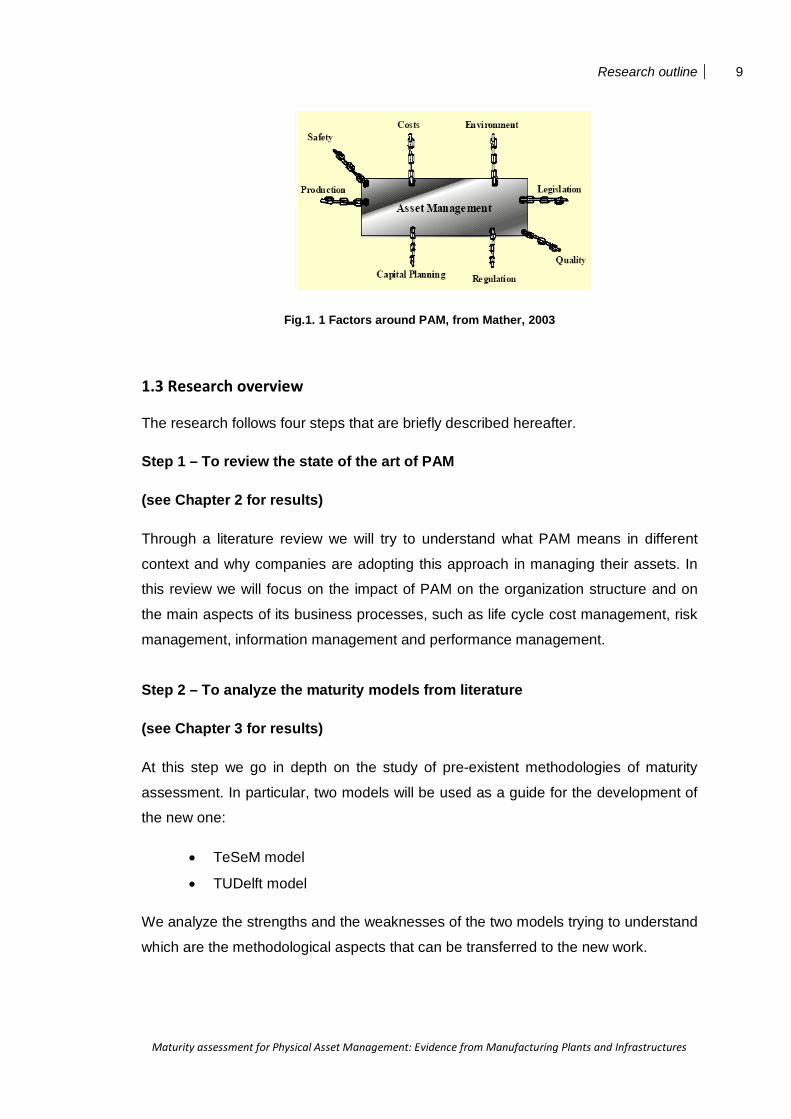
Research outline 9
Maturity assessment for Physical Asset Management: Evidence from Manufacturing Plants and Infrastructures
Fig.1. 1 Factors around PAM, from Mather, 2003
1.3 Research overview
The research follows four steps that are briefly described hereafter.
Step 1 – To review the state of the art of PAM
(see Chapter 2 for results)
Through a literature review we will try to understand what PAM means in different
context and why companies are adopting this approach in managing their assets. In
this review we will focus on the impact of PAM on the organization structure and on
the main aspects of its business processes, such as life cycle cost management, risk
management, information management and performance management.
Step 2 – To analyze the maturity models from literature
(see Chapter 3 for results)
At this step we go in depth on the study of pre-existent methodologies of maturity
assessment. In particular, two models will be used as a guide for the development of
the new one:
• TeSeM model
• TUDelft model
We analyze the strengths and the weaknesses of the two models trying to understand
which are the methodological aspects that can be transferred to the new work.
10 Chapter 1
Maturity assessment for Physical Asset Management: Evidence from Manufacturing Plants and Infrastructures
A third model, developed by Port et al.(2010), has been selected from literature
background, and it is used as an additional support.
Step 3 – To design a model for maturity assessment of PAM practices
(see Chapter 4 for results)
On the basis of CMMI (Capability Maturity Model Integrated) approach, the same of
the models studied in the previous step, a new system for the assessment of PAM
practices’ maturity is designed. A questionnaire is also designed to this end, in order
to make a characterization and a maturity assessment for a set of different case
studies. The questionnaire is the “tool” for collecting data and information needed for
maturity assessment.
Step 4 – To validate the model and analyze its use in different cases
(Chapter 5 and 6 for results)
A series of real cases are presented, in order to verify the capability of the new
methodology to be applied in different fields.
Chapter 6 presents the concluding remarks of this work, both focusing on the
outcome of the thesis as a whole, and fostering further research development for its
improvement.

Maturity assessment for Physical Asset Management: Evidence from Manufacturing Plants and Infrastructures
Chapter.2 Literature review on Physical Asset Management
This chapter offers a review of literature research about Physical Asset Management
(PAM). After an introduction about the innovative aspects of PAM, such as the
development of a new approach for maintenance and the interest in sustainability
issues (Section 1), the influences of PAM on organization is presented passing
through the definition of PAM function, PAM group and PAM Culture (Section 2). In
Section 3 different visions and definitions of PAM that can be found in literature are
discussed in order to explain what PAM means in this work. In the following sections
we will go in depth in the main aspects of PAM, ranging from asset life cycle data
management to information flows and asset knowledge (Section 4) and we conclude
with the theme of asset performance assessment (Section 5).
2.1 An introduction of Physical Asset Management
This section of the thesis investigates which are the innovative aspects of PAM and
why firms should need it.
2.1.1 What is a Physical Asset
The period of time that a physical asset may spend in each life-cycle stage is
determined by its physical characteristics and by the nature of the business venture
that the asset supports. Hence, managed assets with an approach based only on
maintenance can’t work efficiently and, on the basis of this general consideration, the
Physical Asset Management (PAM) approach is developing and spreading (Amadi-
Echendu, Managing Physical Assets is a Paradigm Shift from Maintenance 2004).
This can be deduced from some part of literature, we want to go in depth in order to
better understand, in real practice, what this does really mean.
First of all, we have to specify what the word asset means in this work because
related to its meaning we can have different visions of PAM.
12 Chapter 2
Maturity assessment for Physical Asset Management: Evidence from Manufacturing Plants and Infrastructures
A general definition can be found in the Oxford Advanced Learner’s Dictionary.
Herein an asset is described as a “valuable or useful quality, skill or person; or
something of value that could be used or sold to pay debts”. This definition embraces
different “things” and at the same time it considers the financial dimension as one
important topic (“to pay debts”).
We should make more explicit what such a “thing” is. Indeed, there are different types
of assets. Some important categories that have to be managed are (PAS 55, 2008):
• physical assets,
• human assets,
• information assets,
• intangible assets
• financial assets.
Many aspects / properties, related to each asset, are linked and they may have a
direct impact on the optimized management of each type of assets. We focus our
work on physical assets.
Amadi – Echendu (2004) considers a physical asset as an entity that is capable of
creating, sustaining or destroying value during each stage along its life-cycle (Amadi-
Echendu, Managing Physical Assets is a Paradigm Shift from Maintenance 2004).
To clarify better the Amadi-Echendu’s concept of entity, we consider that an asset is:
“plant, machinery, property, building vehicles and other items and related systems
that have a distinct and quantifiable business function or service” (PAS 55, 2008)
2.1.2 The importance of Physical Asset Management
In accordance with the previous definition of physical asset, PAM can be considered
a young science discipline, evolved from Maintenance Management (MM) to provide
a holistic approach to managing the life of the physical asset (Katičić and Šušnjar,
2011). Indeed, according to the Amadi-Echendu’s definition, referred in the previous
sub-section, this corresponds to managing, at each stage along its life-cycle, the
capability of the asset “to create, sustain or destroy value”.
The major part of the life cycle costs is defined by the decisions taken in the early
concept and design phase (Blanchard and Fabrycky, 1991). Furthermore, in capital-
intensive industry, assets typically have long life cycles and major changes may occur
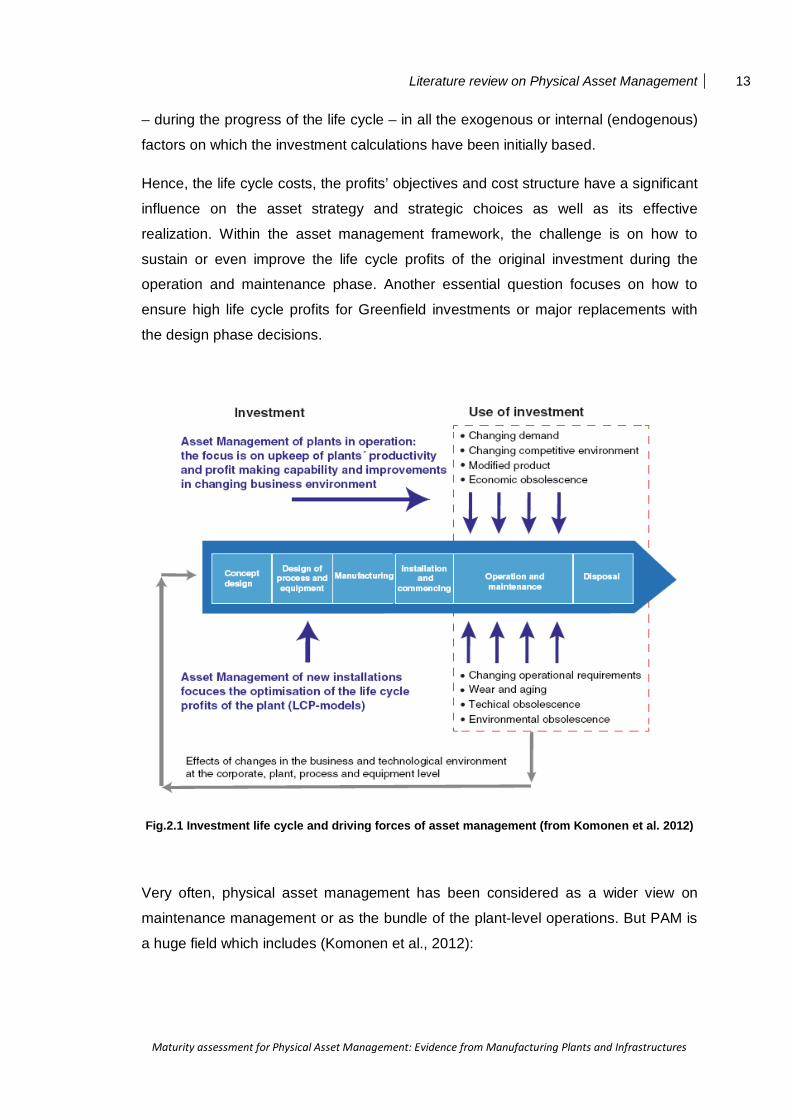
Literature review on Physical Asset Management 13
Maturity assessment for Physical Asset Management: Evidence from Manufacturing Plants and Infrastructures
– during the progress of the life cycle – in all the exogenous or internal (endogenous)
factors on which the investment calculations have been initially based.
Hence, the life cycle costs, the profits’ objectives and cost structure have a significant
influence on the asset strategy and strategic choices as well as its effective
realization. Within the asset management framework, the challenge is on how to
sustain or even improve the life cycle profits of the original investment during the
operation and maintenance phase. Another essential question focuses on how to
ensure high life cycle profits for Greenfield investments or major replacements with
the design phase decisions.
Fig.2.1 Investment life cycle and driving forces of asset management (from Komonen et al. 2012)
Very often, physical asset management has been considered as a wider view on
maintenance management or as the bundle of the plant-level operations. But PAM is
a huge field which includes (Komonen et al., 2012):

14 Chapter 2
Maturity assessment for Physical Asset Management: Evidence from Manufacturing Plants and Infrastructures
• creation, maintenance and improvement of the profit-making capability of
production assets,
• maintenance and optimization of the net asset value of production assets, and
• improvement of sustainability and safety of asset solutions.
The first two themes are both related to the need to change the existing maintenance
approach and to develop a modern one that considers assets during each phase of
their life-cycle from concept/design to disposal. While the third theme is related to the
spreading of the concept of sustainable development, that is "meeting the needs of
the present without compromising the ability of future generations to meet their own
needs” (Brundtland, 1987)".
2.1.3 Changes in the maintenance approach
Most maintenance improvement initiatives today are functional in nature (Peterson,
2002). Firms that follow Functional Excellence Models believe that:
• operation owns production and maintenance owns equipment;
• maintenance excellence means efficient service to production;
• repair efficiency is the best measure of maintenance performance;
• production runs at any cost;
• goals are set by functional managers, resulting often in contradictory and self-
defeating reward/recognition practices; further on, most measures are lagging
indicators, demonstrating past results, while few leading indicators (or none)
are considered to make a prospect on the future operation;
• purchasing excellence means having the lowest cost of items available;
• pressure is on individuals to do better; no gauges or tools of “better” exist.
So there is no attention to the system/to the whole organization and to match the
goals of the other functions. Hence, we can assert these initiatives are somewhat
limited in scope.
In an increasingly open global competitive environment caused by the higher
pressure on costs, by the pressures to increase profit margins, or, in worse case
scenarios, by the pressures to retain profit margins under lowering retail prices, a new
mentality is being developed (Mather, 2003).
Literature review on Physical Asset Management 15
Maturity assessment for Physical Asset Management: Evidence from Manufacturing Plants and Infrastructures
As a result, at a high level, we can state that a number of changes in the way of
thinking can be found – when passing from maintenance management to physical
asset management –. Herein, such relevant changes are briefly enlisted (Peterson,
2002):
1. The plant exists only for one reason — to produce as much product as
possible, to specify and delivery schedules, at the lowest sustainable price
2. To improve will require fundamental changes in discipline and culture,
beginning with the management team. Relationships and personal prejudices
will be realigned
3. Everyone in the plant is on the same team and must work toward the same
goals
• shared vision of how the plant will work in the future
• a multi-year plan for mastering new skills in asset management
• a business case that continuously creates bottom-line value
As one of the largest elements of both operational and capital spending, physical
asset management is often an obvious target for cost reductions. For example, the
maintenance costs are often very high and they are following an increasing trend.
One of the major factors behind this trend is that we are more dependent on
machinery than past. Where previously people work, today machineries work. In fact,
thanks to the development of automation and technology people are substituted by
machineries in a lot of industrial sector (Dunn, 1987).
Due to the introduction of Reliability-Centred Maintenance (RCM), Total Productive
Maintenance (TPM), Business-Centred Maintenance (BCM) and other methodologies
and concepts, maintenance has already evolved a lot during the last decades
(Waeyenbergha and Pintelon, 2006), to justify its own costs. However, a company in
the process industry that solely applies these maintenance models cannot be really
efficient as an estimated 65 percent of a company’s life cycle cost (LCC) are set
during the design phase (Barringer, 1997).
LCC considers the specification and design for reliability and maintainability of
physical assets such as a plant, machinery, equipment, buildings and structures. The
application of LCC also takes into account the processes of installation,
commissioning, operation, maintenance, modification and replacement. Last but not
16 Chapter 2
Maturity assessment for Physical Asset Management: Evidence from Manufacturing Plants and Infrastructures
least, decisions are influenced by feedback of information on design, performance
and cost, throughout the life cycle of a project (Waeyenbergha and Pintelon, 2006).
LCC helps then changing provincial perspectives for business issues, with emphasis
on enhancing economic competitiveness by working for the lowest long term Cost of
Ownership, which is not an easy answer to obtain. Let’s consider, for example, these
typical problems and conflicts observed in most companies (Barringer, 2003):
1. Project Engineering wants to minimize capital costs as the only criterion,
2. Maintenance Engineering wants to minimize repair hours as the only criterion,
3. Production wants to maximize uptime hours as the only criterion
4. Reliability Engineering wants to avoid failures as the only criterion,
5. Accounting wants to maximize project net present value as the only criterion,
and
6. Shareholders want to increase stockholder wealth as the only criterion.
Management is responsible for harmonizing these potential conflicts and, according
to the PAM concept, this may be done under the banner of operating for the lowest
long term Cost of Ownership. LCC can then be used as a management decision tool
for harmonizing the never ending conflicts by focusing on facts, money, and time.
LCC is only one of the instrument of the huge field of Life Cycle Management. In the
Life Cycle Management approach emerges the awareness that maintenance activities
have close relationships with activities in other phases of product life cycle, such as
the design, production and end of life phase. These relations create the necessity for
integration in terms of technologies as well as information throughout the product’s
life cycle so as to perform effective maintenance (Takata et al., 2004).
The effective maintenance, continue Takata et al.(2004), should involve the following
activities:
1. improving design based on evaluating maintainability in the product
development phase, and providing the design data for maintenance strategy
planning and maintenance task control;
2. selecting a maintenance strategy appropriate to each part of the product;
3. planning and executing the maintenance tasks control based on the selected
strategy;

Literature review on Physical Asset Management 17
Maturity assessment for Physical Asset Management: Evidence from Manufacturing Plants and Infrastructures
4. evaluation of maintenance result to determine whether the maintenance
strategy planning and maintenance task control are appropriate;
5. improvement of maintenance (task control and strategy planning) and
products based on the evaluation of maintenance results;
6. dismantling planning and execution at the end of the product life cycle.
Summarizing, for PAM the life cycle perspective is key and its importance, as we will
see better in next Chapter 3, is illustrated in numerous definitions of PAM. More than
that, the maintenance approach may be related to such a life cycle perspective of the
physical asset, as well as its life cycle costs. This helps motivating understanding of
the new role of maintenance within PAM.
2.1.4 The sustainability issue
Sustainable performance today has become an economically sensitive issue that has
an increasing potential to effectively and efficiently harness the emerging market
demands for sustainable products and processes. It is a commercially important and
a well thought business approach dedicated to long-term value with critical focus on
stakeholders to better embrace opportunities, to reduce sustainability costs, and to
manage hidden risks (DJSI, 2005) .
Society has become increasingly intolerant of industrial incidents, particularly in the
areas of safety and environmental integrity (Mather, 2003). It is no longer considered
acceptable to cause harm to either the environment or to people and the communities
that they live in.
In the last years this has been reflected in various changes also in the legislation and
regulation in many countries around the world and is leading companies to pay more
attention to their impact on environment and society. Companies are becoming more
aware of the need to perform their business in a sustainable manner.
Sustainable business activity in general implies:
“…adapting business strategies and activities that meets the needs of wider
stakeholders of a commercial business (e.g. manufacturing, production, process) and
also of the operator or the owner of the plant in question, through processes and
products that has well-balanced and positive economical, social, and environmental
implication.” (Liyanage, Operations and maintenance performance in production and
manufacturing assets: The sustainability perspective, 2007)

18 Chapter 2
Maturity assessment for Physical Asset Management: Evidence from Manufacturing Plants and Infrastructures
Businesses are then pressurized to incorporate economic, environmental and social
performances in their policies, culture and decision-making processes.
These performance objectives manifest in three operational focal points that are
fundamental to the manufacturing industry (Brenta and Visser, 2005):
• Projects. The concept of sustainable development must be integrated in the
planning and management over the life cycle of projects, for example in terms
of risk minimization.
• Assets. The life cycle of assets must be optimized in terms of sustainable
development performance objectives of the manufacturing facility, for example
in terms of maintenance cost minimization.
• Products. The influence of products on economies, environments and society
as a whole must be considered, for example considering the concept of
product stewardship.
PAM, with its holistic approach based on Life Cycle Management (and, subsequently,
Life Cycle Costing), has become an useful instrument in order to assure that the
operational processes are consistent, and that there is an effective sharing and
coordination of resources, information and technologies during the whole life cycle of
the assets, to adequately achieve the targets in sustainable performance.
2.2 Physical Asset Management in the organization
Historically, asset management has not been a well identified activity (Hastings,
2010) within the company’s organization.
The industry organization still lives with the “mindset” of functional silos rather than
adapting to a process orientation (Liyanage, 2012), so also the general pattern of
educational and professional specializations results in a silo effect in the areas
surrounding asset management.
Knowledge is then fragmented between different functions and professions in the
organization. Engineers have skills in design, in technical development, and in the
solution of technical problems, but this requires a focus which can create barriers
which hide some aspects of business issues. Finance and accounting specialists are
aware of fixed assets as a balance sheet entry whose technical depths are unknown.

Literature review on Physical Asset Management 19
Maturity assessment for Physical Asset Management: Evidence from Manufacturing Plants and Infrastructures
Engineering and maintenance are often viewed as costs, to be minimized, and
activities to be outsourced. Information technologists are skilled in establishing data
management and communication systems, but the structure, content and use of the
information lie elsewhere. Senior managers from political, legal, financial or marketing
backgrounds often have priorities and short term imperatives which result in the lack
of attention in the decision making for longer planning horizons (Hastings, 2010).
Nonetheless, in asset intensive businesses, it is essential to integrate the different
functions so that the development, acquisition and operation of the assets are carried
out effectively.
2.2.1 The “Grey zone”
Comprehensive and integrated PAM approaches require interdisciplinary know-how
and competence (Komonen et al., 2012).
The wide field of competence of PAM results in the difficulty to represent it clearly in
the business structure, like it happens with other business functions, such as Sales,
Operations, Finance and Human Resource Management. So, PAM is often a “grey
area”, positioned between the business (senior) management and operational level
(of maintenance) (Hastings, 2010).
Asset management without a defined position can’t work efficiently / effectively in a
company’s organization. It is essential then to define the role of Asset Management
and the relations with the other business functions, in order to avoid unproductive
duplications and contrasts.
In particular, an asset management function is needed to provide asset knowledge
and capacity for related management and decision support activities within the
context of a business (Hastings, 2010). This particularly includes such issues as:
• asset (and associated capability) development planning and implementation,
• asset continuity planning and implementation,
• logistic support facilities development and management,
• applications in asset management and maintenance,
• shutdown / turnaround planning,
• collaborative operational risk management,
• development and management of maintenance outsourcing,
• information interfacing platform,
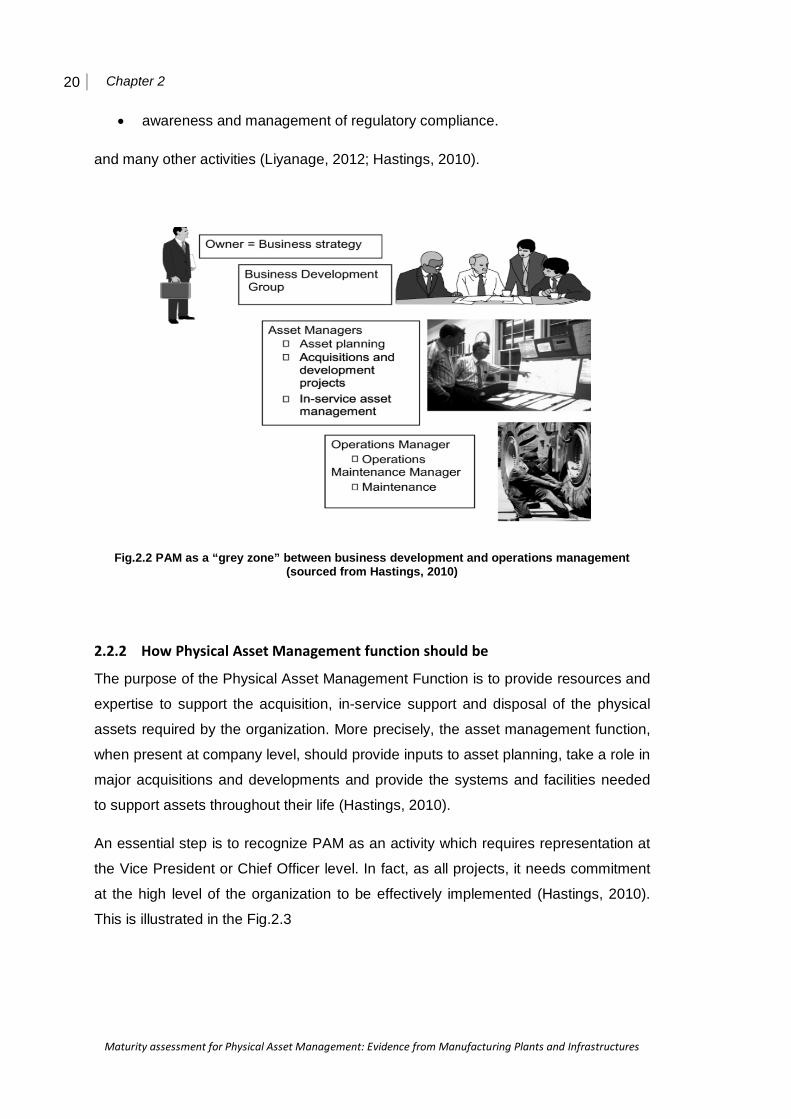
20 Chapter 2
Maturity assessment for Physical Asset Management: Evidence from Manufacturing Plants and Infrastructures
• awareness and management of regulatory compliance.
and many other activities (Liyanage, 2012; Hastings, 2010).
Fig.2.2 PAM as a “grey zone” between business development and operations management (sourced from Hastings, 2010)
2.2.2 How Physical Asset Management function should be
The purpose of the Physical Asset Management Function is to provide resources and
expertise to support the acquisition, in-service support and disposal of the physical
assets required by the organization. More precisely, the asset management function,
when present at company level, should provide inputs to asset planning, take a role in
major acquisitions and developments and provide the systems and facilities needed
to support assets throughout their life (Hastings, 2010).
An essential step is to recognize PAM as an activity which requires representation at
the Vice President or Chief Officer level. In fact, as all projects, it needs commitment
at the high level of the organization to be effectively implemented (Hastings, 2010).
This is illustrated in the Fig.2.3

Literature review on Physical Asset Management 21
Maturity assessment for Physical Asset Management: Evidence from Manufacturing Plants and Infrastructures
Fig.2.3 PAM in the organization – corporate level (sourced from Hastings, 2010)
Representation at the Chief level allows PAM to play its role in key asset related
decisions and activities affecting the business.
At this level PAM is often called “Corporate asset management”. Typical tasks at the
corporate level include (Komonen, 2012):
• portfolio management, consisting of asset management activities that are
executed to fulfill the requirements originating from the corporate strategy and
objectives;
• success factor management, which aims at identifying factors and modes of
operations creating the greatest competitive advantage;
• capacity management, incorporating the demand forecasts and competitive
analyses for various products and production units;
• life cycle management, which at a corporate level calls for the executives to
determine the expected economic lifetimes of various products and production
units;
• maintenance management, which at a corporate level includes the definition
of general policies for the maintenance function, such as outsourcing, building
up of the ERP / information system support, defining the system of KPIs (key
performance indicators), and taking care of the knowledge transfer between
different plants.
All PAM activities do not concentrate only at the top / corporate level. Indeed, to carry
out its function, Corporate asset management requires systematic decision making at
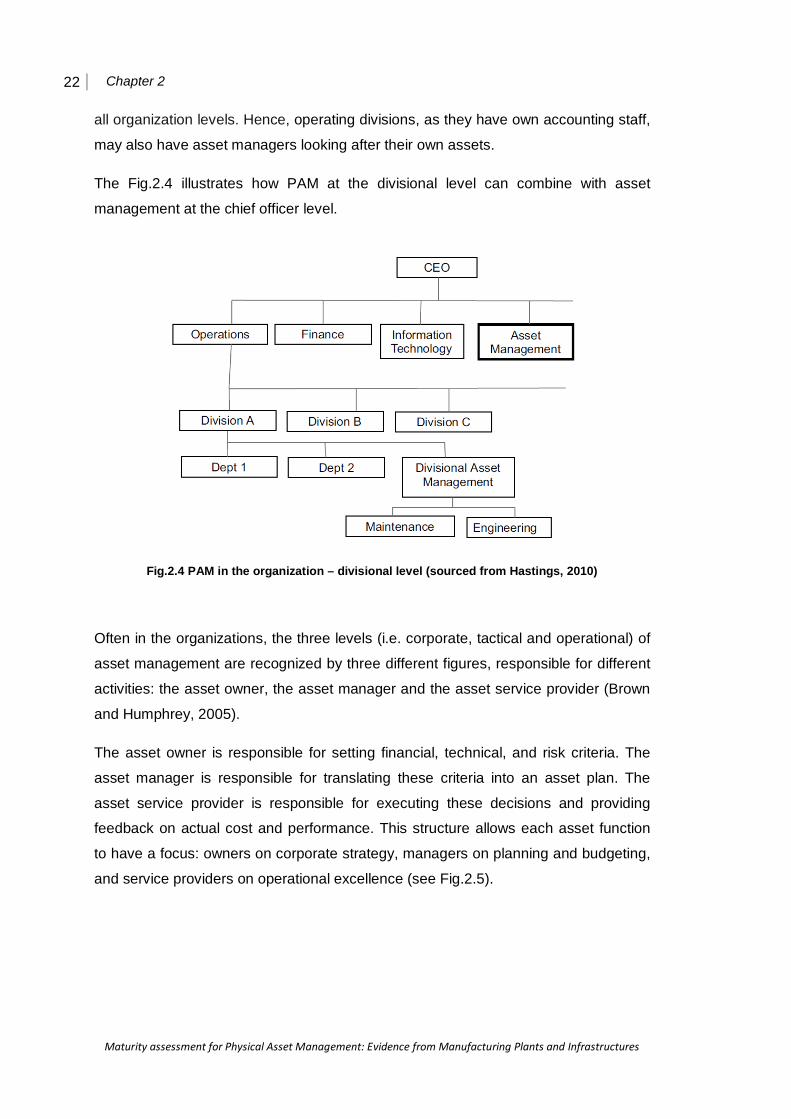
22 Chapter 2
Maturity assessment for Physical Asset Management: Evidence from Manufacturing Plants and Infrastructures
all organization levels. Hence, operating divisions, as they have own accounting staff,
may also have asset managers looking after their own assets.
The Fig.2.4 illustrates how PAM at the divisional level can combine with asset
management at the chief officer level.
Fig.2.4 PAM in the organization – divisional level (sourced from Hastings, 2010)
Often in the organizations, the three levels (i.e. corporate, tactical and operational) of
asset management are recognized by three different figures, responsible for different
activities: the asset owner, the asset manager and the asset service provider (Brown
and Humphrey, 2005).
The asset owner is responsible for setting financial, technical, and risk criteria. The
asset manager is responsible for translating these criteria into an asset plan. The
asset service provider is responsible for executing these decisions and providing
feedback on actual cost and performance. This structure allows each asset function
to have a focus: owners on corporate strategy, managers on planning and budgeting,
and service providers on operational excellence (see Fig.2.5).
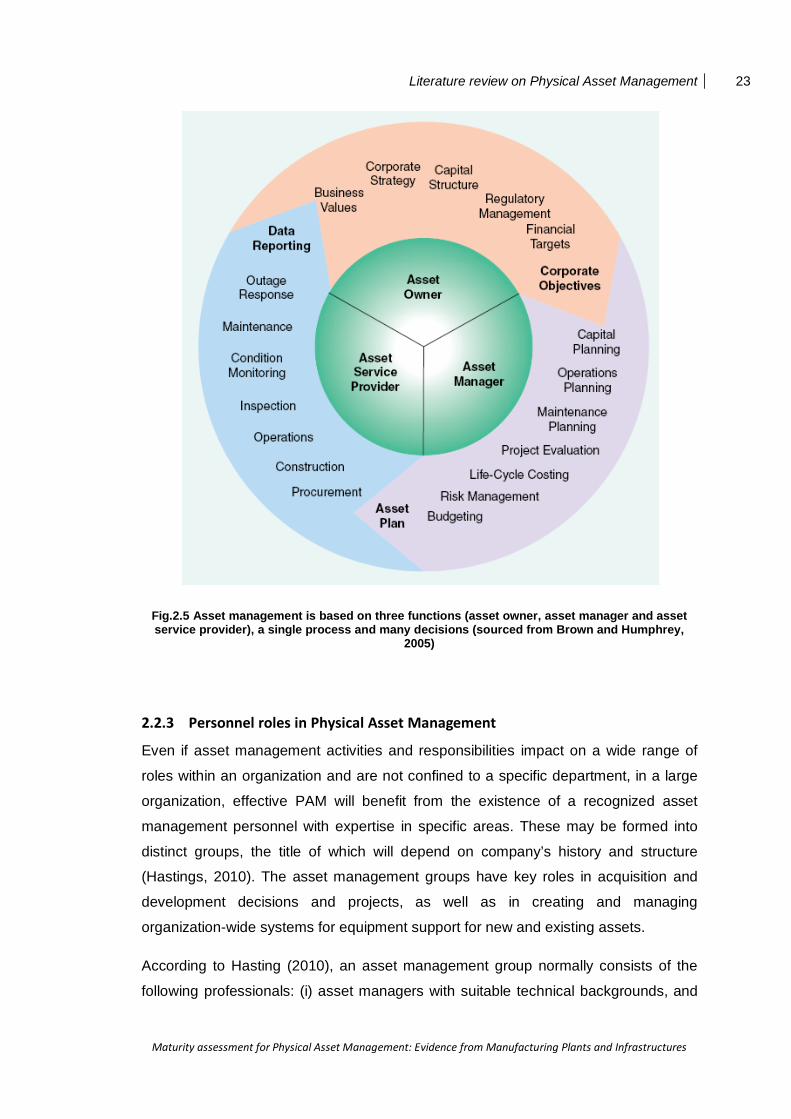
Literature review on Physical Asset Management 23
Maturity assessment for Physical Asset Management: Evidence from Manufacturing Plants and Infrastructures
Fig.2.5 Asset management is based on three functions (asset owner, asset manager and asset service provider), a single process and many decisions (sourced from Brown and Humphrey,
2005)
2.2.3 Personnel roles in Physical Asset Management
Even if asset management activities and responsibilities impact on a wide range of
roles within an organization and are not confined to a specific department, in a large
organization, effective PAM will benefit from the existence of a recognized asset
management personnel with expertise in specific areas. These may be formed into
distinct groups, the title of which will depend on company’s history and structure
(Hastings, 2010). The asset management groups have key roles in acquisition and
development decisions and projects, as well as in creating and managing
organization-wide systems for equipment support for new and existing assets.
According to Hasting (2010), an asset management group normally consists of the
following professionals: (i) asset managers with suitable technical backgrounds, and
24 Chapter 2
Maturity assessment for Physical Asset Management: Evidence from Manufacturing Plants and Infrastructures
(ii) personnel in accounting and finance, legal, contracting, procurement and
engineering roles. The financial, legal and engineering staff should be co-located to
asset management groups from their professional area. Moreover, for particular
projects, teams will be formed with personnel numbers and skills dependent on the
content and size of the project. The asset management groups form a basis from
which these teams can be formed.
The asset management groups, just referred to, can involve hundreds of personnel in
a large organization. In a smaller organization the same types of tasks are
undertaken at a different scale, of course, but the same types of decisions are (or
have to be) made. This means that the logic of the processes still carries through,
even though the tasks may be handled by a works manager, a works engineer or a
maintenance superintendent in among a range of other commitments (of course, with
a diverse set of tools, capabilities and time to dedicate).
2.2.3.1 Examples of personnel roles
Hastings (2010) identifies the following personnel roles who take part of the asset
management groups.
Asset Manager: An asset manager is involved not only with a single asset but
with a particular range of them.
Asset Managers require knowledge of relevant technologies and their
operational context. They provide management and leadership for the group,
and also provide input into business development in relation to their technical
area. Asset managers usually come from engineering or logistic backgrounds,
but they need to be familiar with the business in its broader context, and with
general accounting and financial concepts.
Asset managers have a key role to play in providing timely and sound input
into business decisions above all for those based on estimates or forecasts
made from the basis of combined technical and business knowledge.
Project Manager: They have an important role in acquisition and
developments project with their skill and experience.
Finance, accounting and costing: Personnel in these fields play an
important role in assessing costs, assessing the financial viability of projects
and in managing the finances of projects in progress.
Lawyers: Contracting and contract managers.
Literature review on Physical Asset Management 25
Maturity assessment for Physical Asset Management: Evidence from Manufacturing Plants and Infrastructures
Procurement managers and officers: They have the purpose of managing
procurement and physical assets of the organization in line with the
programmed strategy, work plan and financial plan.
Engineers: Engineers are required to provide technical knowledge essential
to take decisions relating to the organization’s physical assets. This includes
technical knowledge of design and operation, and engineering and data
analysis skills in reliability, maintenance, through life support and replacement
decisions. Engineers may take “subject matter expert” roles which run across
an organization.
Logisticians: They are required in order to apply such techniques as logistic
support analysis and level of repair analysis. Other activities regard
configuration management, cataloguing of spares, identification and coding of
maintainable items of equipment, setting inventory control parameters and
ensuring that the distribution system for assets, consumables and spare parts
is appropriate to needs.
General staff: are also required covering human resource management and
administrative functions.
2.2.4 Physical Asset Management Culture
In the previous section, we focused on the multidisciplinary aspects of the asset
management group(s). But how professionals with different background, knowledge
and goals can be working together? Organizations need a shared physical asset
management culture to this end.
Culture is an ubiquitous term that many use, but rarely with consistency in meaning
(Hofstede, 1984). Wikipedia defines it as “the set of shared attitudes, values, goals,
and practices that characterizes an institution, organization, or group” (Culture,
Wikipedia).
The Asset Management Council of Australia (AMC) defines Asset Management
Culture as: ‘‘the extent to which all levels of the organization have the knowledge,
skills and commitment to achieve the documented asset management goals of the
organization’’. The criteria used to evaluate this component are listed below:
• How are Asset Management goals deployed at all levels?
• Are these evident to all people involved?
26 Chapter 2
Maturity assessment for Physical Asset Management: Evidence from Manufacturing Plants and Infrastructures
• Are the knowledge and skills necessary for achieving Asset Management
performance goals known by the enterprise?
• Is there a plan for the provision of Asset Management knowledge and skills?
• Are the roles and responsibilities for those involved in Asset Management
clearly defined?
• How is the performance of individuals and groups recognized and supported?
It can be seen that the AMC’s definition and criteria fail to evaluate the desired shared
values, behavioral norms and beliefs present within the today’s organization, so it
does little to identify attributes that may drive excellence in engineering practices
(Murphy, 2010). Henceforth, it is important to develop a shared organizational culture,
because the success of an enterprise depends also upon people who work in there,
thanks to their knowledge and skills, and the human capital.
There is a lack of research examining the impact of human capital on physical asset
management; this is especially important today, considering that (Woodhouse, 2001)
suggests that this is the weakest link in asset management.
Intellectual capital is an important concept which includes: human capital, structural
capital and relationship capital. Furthermore, structural capital involves the
organizational infrastructure which in this case supports the process of managing
assets (this includes technology such as databases and management systems, used
for asset information management) (Dawson, 2000). Therefore, if human capital is
important to physical asset management, according to the literature and theory about
intellectual capital it may also be important to increase other issues, such as the
relationship capital between the employees, in order to improve infrastructure and
engineering asset management performance, and increase overall human capital
within the organization (Subramaniam and Youndt, 2005).
Even if the importance of the culture in the physical asset oriented enterprises was
recognized from many authors, the research on this field has been only recently
developed.
Murphy (2008) and Jung et al. (2009) propose that organizational culture may be
critical for effective engineering asset management. Specifically, Murphy (2008)
suggests that EAM (Engineering Asset Management) researchers need to identify
ideal organizational cultures for supporting and developing effective asset
management processes. He suggests few organizations are pursuing ‘best practice’
Literature review on Physical Asset Management 27
Maturity assessment for Physical Asset Management: Evidence from Manufacturing Plants and Infrastructures
engineering culture. As a follow up of this statement, he adopted qualitative research
methods to identify factors facilitating an effective EAM culture. The factors so
highlighted can be categorized into individual, group and organizational factors. The
individual factors include: openness to change and flexibility, contentiousness,
technical and engineering skills. On the other hand, the group factors are:
communication, co-operation and collaboration. Last but not least, the organizational
factors are: quality and continuous improvement, safety and environmental focus, and
business and commercial focus. Jung et al., (2009) extended the argument by
suggesting a process for managing organizational culture and organizational culture
change, because typical EAM cultures must change if they are going to meet best
practice standards and to maximize asset management performance.
There are numerous studies that suggest organizational culture impacts on the
overall effectiveness of the organization. For example, it has been suggested that
organizational culture may impact on organizational factors such as: morale, job
satisfaction and organizational commitment (Armenakis and Stanley, 2002).
Therefore, it is very important to understand how organizational culture is seen by the
employee. But, if it is difficult to define organizational culture, it is even more difficult
to examine it, due to the lack of instrument, or test it. This difficulty for defining and
testing the organizational culture could be clearly attributed to its social nature and
complexities; for example, the unspoken rules about acceptable attire, how to speak
and act in certain situations, and how to react during particular social exchanges
(Brunetto and Xarri, 2012).
Different authors agree with the need to use an approach based on mixed methods,
both qualitative and quantitative. In particular, “leadership, communication, teamwork,
commitment to innovation, and attitudes to change” can be measured using a
quantitative approach, while values and assumptions can be examined using
interviews or focus groups (Scott et al., 2003). To provide further information, Schein
(1990) suggested that quantitative measures of organizational culture are not suitable
for measuring underlying beliefs and assumptions.
In addition, Hofstede (1998) suggests that values and attitudes, which he refers to as
constructs, are not directly observable and should be measured by attaining value
statements or by examining workplace behavior.
Also Brunetto and Xerri (2012), although they develop their work considering only
quantitative indicators, recognize that overall an approach based on mixed methods

28 Chapter 2
Maturity assessment for Physical Asset Management: Evidence from Manufacturing Plants and Infrastructures
to measuring organizational culture may provide more holistic results. In their study,
that aims to validate a measure to examine the organizational culture of infrastructure
and engineering asset management organizations, they use an organizational culture
survey developed by Glaser et al. (1987) to examine teamwork and morale and they
examine it in addition to leadership, communication, commitment to innovation and
attitudes toward organizational change, combining with the prescriptions of Scott et
al. (2003).
Concluding, culture is a relevant issue in Physical Asset Management, and it is then
important to understand how much it is developed in an organization, and if there is
need to further improve it. This is not an easy task, because many factors have to be
considered (according either to the general theory of intellectual capital or to the
specific studies on culture in Physical Asset Management) and, further on, not all of
these factors can be measured quantitatively.
2.3 What is Physical Asset Management
It is now worth deepening the comprehension of PAM in respect to what it does within
an organization.
PAM is a young science discipline evolved from Maintenance Management to provide
a holistic approach to managing the life of a physical asset (Katičić, 2011). Holistic
approach means that it integrates the management of all the aspects of the assets in
contrast with specialized and compartmentalized approaches (which is what happens
with the traditional approach to maintenance management, see what said in
paragraph 2.1.3). Only considering this characteristic of PAM may however lead to a
reductive definition of it. We have then to consider others aspects of PAM approach,
such as the following features:
systematic: it implies that PAM promotes consistent, repeatable and
methodical actions, providing a clear support for decision making;
systemic: it considers the assets as a system and tries to optimized the whole
system rather than optimizing individual asset in isolation;
optimal: it tries to establish the optimal compromise between competing
factors such as performance, cost and risk, associated with the assets over
their life cycles;
risk-based: the assessment of risks leads all the decisions;
Literature review on Physical Asset Management 29
Maturity assessment for Physical Asset Management: Evidence from Manufacturing Plants and Infrastructures
sustainable: PAM considers the potential adverse impact to the organization in
the long term of short term decisions.
Different definitions of PAM can be found in literature, focusing on different aspects
out of those now discussed.
2.3.1 Definitions of Physical Asset Management
Asset management is defined by the PAS 55 as:
“systematic and coordinated activities through which an organization optimally and
sustainably manages its asset systems, their associated performances, risks and
expenditures over their life cycles for the purpose of achieving its organizational
strategic plan”.
Where an organizational strategic plan is defined as:
“the overall long-term action plan for the organization that is derived from and
embodies its vision, mission, value, business policies, objectives and the
management of the risks”
The definition shows that asset management is seen as the whole of activities that
the organization undertakes to achieve its organizational strategic plan. From this
viewpoint, assets are a central part for the operational success of the organization. In
general, one can say that PAM activities aim to get the most value out of the physical
assets in an asset intensive organization - where value is related to the organizational
goals of a company (PAS 55, 2008) .
Other authors say that asset management is an integrated approach to balance
costs, performance and risks during all asset life cycle (Wijnia, 2009) and it is often
one of the last options to maximize cost savings in a competitive global economy due
to its intrinsic complexity, especially in many developing countries (Brent et al., 2005).
A reason for the existence of different asset management concepts might therefore
be driven by the nature of the different assets. The definitions are related to the
context in which assets are and show a common general meaning so we can say that
asset management is a single approach that is implemented differently in different
industries. The way through which it is developed depends on the characteristics of
the assets and the environment of the assets, in relation to the most relevant lifecycle
phases and management of the organizations (Van der Lei et al., 2010).
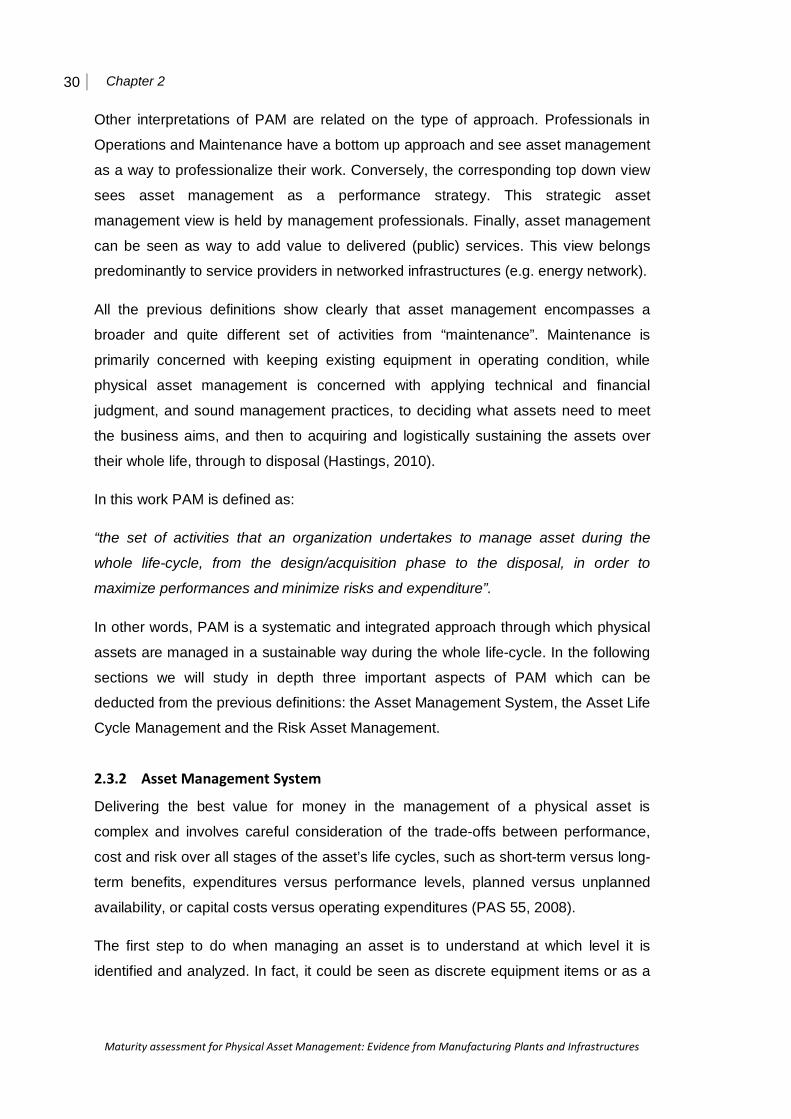
30 Chapter 2
Maturity assessment for Physical Asset Management: Evidence from Manufacturing Plants and Infrastructures
Other interpretations of PAM are related on the type of approach. Professionals in
Operations and Maintenance have a bottom up approach and see asset management
as a way to professionalize their work. Conversely, the corresponding top down view
sees asset management as a performance strategy. This strategic asset
management view is held by management professionals. Finally, asset management
can be seen as way to add value to delivered (public) services. This view belongs
predominantly to service providers in networked infrastructures (e.g. energy network).
All the previous definitions show clearly that asset management encompasses a
broader and quite different set of activities from “maintenance”. Maintenance is
primarily concerned with keeping existing equipment in operating condition, while
physical asset management is concerned with applying technical and financial
judgment, and sound management practices, to deciding what assets need to meet
the business aims, and then to acquiring and logistically sustaining the assets over
their whole life, through to disposal (Hastings, 2010).
In this work PAM is defined as:
“the set of activities that an organization undertakes to manage asset during the
whole life-cycle, from the design/acquisition phase to the disposal, in order to
maximize performances and minimize risks and expenditure”.
In other words, PAM is a systematic and integrated approach through which physical
assets are managed in a sustainable way during the whole life-cycle. In the following
sections we will study in depth three important aspects of PAM which can be
deducted from the previous definitions: the Asset Management System, the Asset Life
Cycle Management and the Risk Asset Management.
2.3.2 Asset Management System
Delivering the best value for money in the management of a physical asset is
complex and involves careful consideration of the trade-offs between performance,
cost and risk over all stages of the asset’s life cycles, such as short-term versus long-
term benefits, expenditures versus performance levels, planned versus unplanned
availability, or capital costs versus operating expenditures (PAS 55, 2008).
The first step to do when managing an asset is to understand at which level it is
identified and analyzed. In fact, it could be seen as discrete equipment items or as a
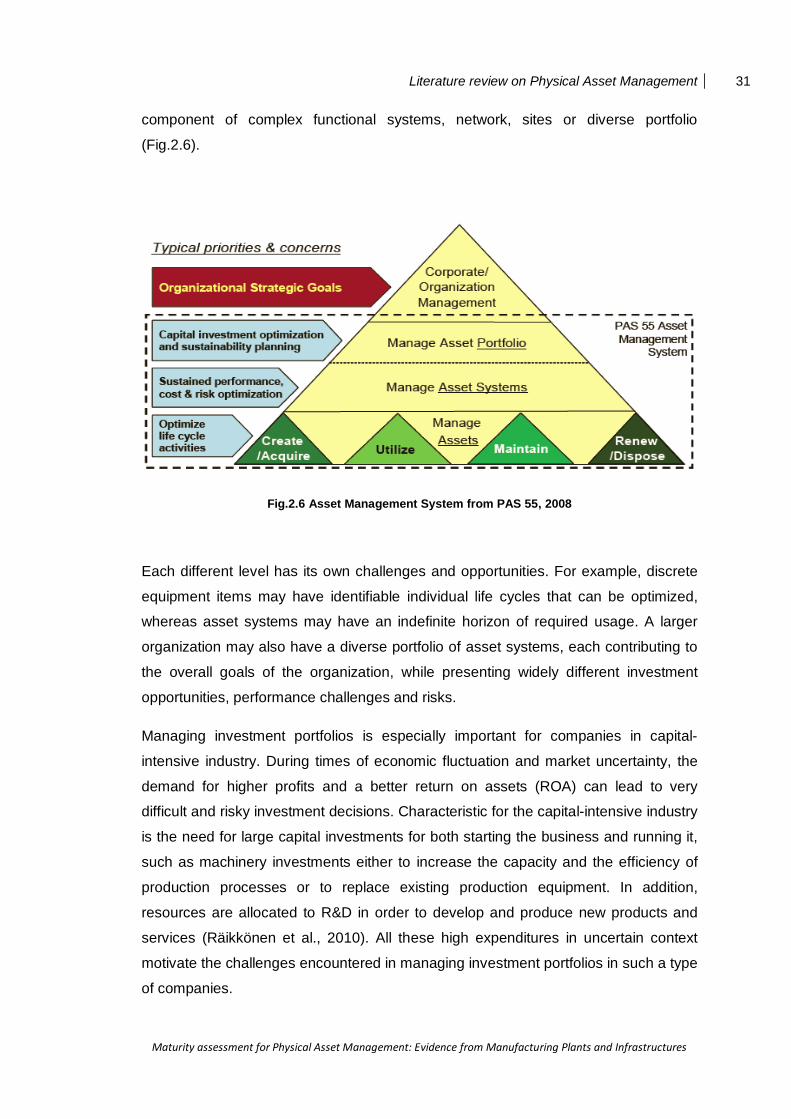
Literature review on Physical Asset Management 31
Maturity assessment for Physical Asset Management: Evidence from Manufacturing Plants and Infrastructures
component of complex functional systems, network, sites or diverse portfolio
(Fig.2.6).
Fig.2.6 Asset Management System from PAS 55, 2008
Each different level has its own challenges and opportunities. For example, discrete
equipment items may have identifiable individual life cycles that can be optimized,
whereas asset systems may have an indefinite horizon of required usage. A larger
organization may also have a diverse portfolio of asset systems, each contributing to
the overall goals of the organization, while presenting widely different investment
opportunities, performance challenges and risks.
Managing investment portfolios is especially important for companies in capital-
intensive industry. During times of economic fluctuation and market uncertainty, the
demand for higher profits and a better return on assets (ROA) can lead to very
difficult and risky investment decisions. Characteristic for the capital-intensive industry
is the need for large capital investments for both starting the business and running it,
such as machinery investments either to increase the capacity and the efficiency of
production processes or to replace existing production equipment. In addition,
resources are allocated to R&D in order to develop and produce new products and
services (Räikkönen et al., 2010). All these high expenditures in uncertain context
motivate the challenges encountered in managing investment portfolios in such a type
of companies.

32 Chapter 2
Maturity assessment for Physical Asset Management: Evidence from Manufacturing Plants and Infrastructures
Komonen et al. (2006) developed a framework based on the business objectives of
the firm and on analyzing and modeling various businesses and business
environments from the standpoint of the physical assets taking into account the
technological characteristics, economic structure and uncertainty in the industrial
sector in question.
According to such a framework, management decisions are expected to be aligned at
different levels.
• The corporate strategic decisions reflect corporate visions, values and
business objectives and incorporate the information from strategic analyses
and scenarios.
• If the firm has several production facilities or plants, the local asset-related
decisions need to be in line with the corporate asset strategy and take into
account the plant-level objectives and constraints. At this stage, the technical
and economic analysis and risk analysis create important inputs for the
decision-making.
• The plant or production asset strategy is allocated to the production systems
and equipment and forms a basis for decision-making at the shop floor level.
The Asset management decision making framework proposed by Komonen et al. is
synthesized in fig. 2.7.

Literature review on Physical Asset Management 33
Maturity assessment for Physical Asset Management: Evidence from Manufacturing Plants and Infrastructures
Fig.2. 7 Schematic presentation of the Asset Management decision making framework from Komonen et al., 2006
Fig.2.8 Asset Management levels: framework and holistic management of production assets from Komonen et al., 2012

34 Chapter 2
Maturity assessment for Physical Asset Management: Evidence from Manufacturing Plants and Infrastructures
The asset management tasks and activities and responsibilities at each level are
summarized in Fig.2.8, which also illustrates the preconditions, supporting systems
and tools needed in order to implement effective asset management at each level.
For example, the corporate executives should determine the role of each production
unit. The plant-level management should model the production system, carry out
criticality assessment, determine optimal performance and plan the road map for the
future development. At the production line, sub-process or equipment level, the
important management processes would be, e.g., modeling of processes or technical
functioning of equipment and taking care of criticality assessment (Komonen et al.,
2012).
The proposal from Komonen et al. can be considered one of the most recently
produced in the scientific literature. It can be thought as an asset management
system particularly aimed at integrating the different levels of decision making in an
industry organization. This proposal shares a similar view of PAS 55 on the need to
integrate decisions at different levels.
In particular, according to PAS 55, an integrated asset management system is
essential to coordinate and optimize the diversity and complexity of assets in line with
the organization’s objectives and priorities. An asset management system is primarily
designed to support the delivery of an organizational strategic plan in order to meet
the expectations of the variety of stakeholders, such as customers, society,
shareholders, suppliers and employees. The asset management policy, strategy,
objectives and plans are then established in accordance with the organizational
strategic plan. These, in turn, direct the optimal combination of life cycles activities to
be applied across the diverse portfolio of assets systems (in accordance with their
criticalities, condition and performance) (PAS 55, 2008).
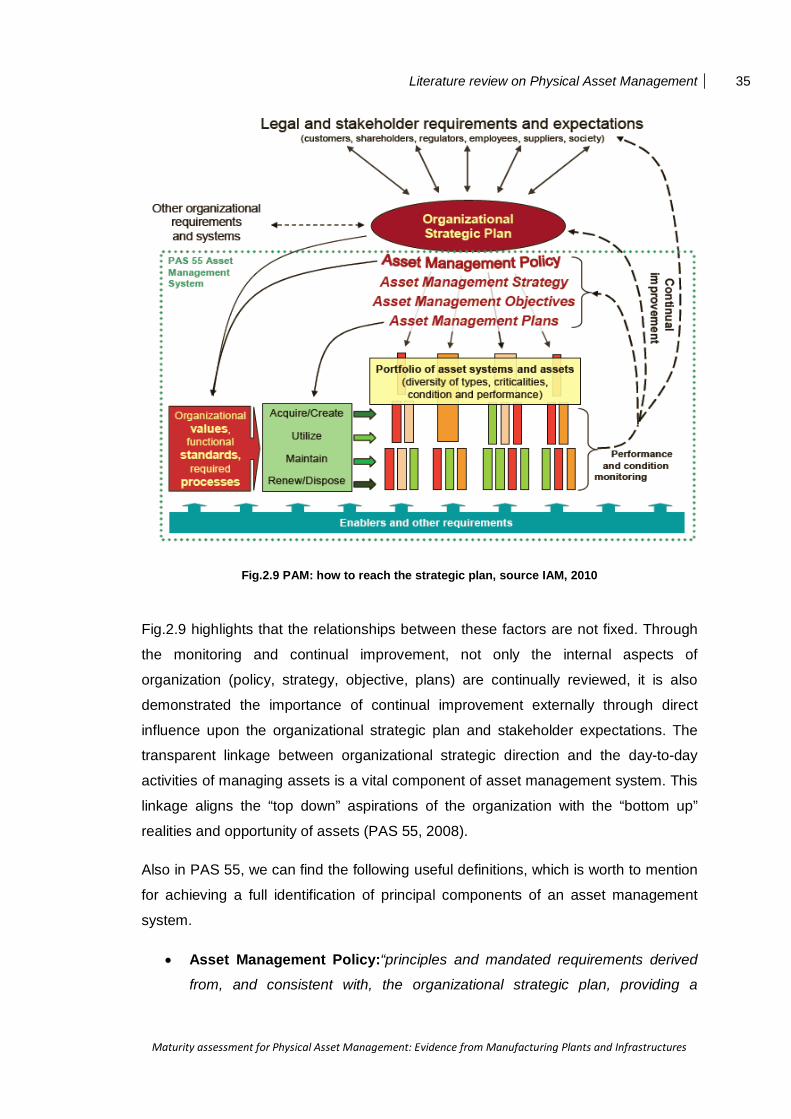
Literature review on Physical Asset Management 35
Maturity assessment for Physical Asset Management: Evidence from Manufacturing Plants and Infrastructures
Fig.2.9 PAM: how to reach the strategic plan, source IAM, 2010
Fig.2.9 highlights that the relationships between these factors are not fixed. Through
the monitoring and continual improvement, not only the internal aspects of
organization (policy, strategy, objective, plans) are continually reviewed, it is also
demonstrated the importance of continual improvement externally through direct
influence upon the organizational strategic plan and stakeholder expectations. The
transparent linkage between organizational strategic direction and the day-to-day
activities of managing assets is a vital component of asset management system. This
linkage aligns the “top down” aspirations of the organization with the “bottom up”
realities and opportunity of assets (PAS 55, 2008).
Also in PAS 55, we can find the following useful definitions, which is worth to mention
for achieving a full identification of principal components of an asset management
system.
• Asset Management Policy:“principles and mandated requirements derived
from, and consistent with, the organizational strategic plan, providing a
36 Chapter 2
Maturity assessment for Physical Asset Management: Evidence from Manufacturing Plants and Infrastructures
framework for the development and implementation of the asset management
strategy and the setting of the asset management objectives”. Other aspects
of policy may cover the assignment of authority and responsibility for specific
areas of asset management to various office holders. The asset management
policy is a means of top management to communicate to its managers,
employees and stakeholders the organization’s position and intention with
regard to asset management. It provides a high level statement of the
organization’s principles, approach and expectations relating to asset
management and identifies all legal, regulatory and statutory and other asset
management requirements, including the requirements of the organizational
strategic plan.
• Asset Management Strategy: “is a broad level plan set by senior
management as a guide to how an organization intends to achieve its aims”.
The asset strategy also specifies authorities and responsibilities for action in
relation to asset management activities. These may be incorporated in more
generally based documents such as organization charts and job descriptions,
but it is important that the asset management aspects are covered.
• Asset Management Objectives “Specific outcome or achievement required
of assets, asset type and/or asset systems in order to achieve the asset
management strategy”. The asset management objectives must be continually
reviewed, so that they are not in contrast with legal, regulatory statutory and
other asset management requirements, with financial, operational and
business requirements, and they have to consider asset-related risks and the
expectations of stakeholders.
• Asset Management Plan: as said before, it is defined as “the overall long-
term action plan for the organization that is derived from and embodies its
vision, mission, value, business policies, objectives and the management of
the risks”. It has to be optimized in a continuous process and it also provides
the allocation of suitable resources (financial, human, equipment, logistics).
Asset management plans can be for individual assets, asset type and/or asset
system. However, it is essential that the plans are linked to the asset
management policy, strategy, objectives and targets that they are intended to
achieve. The asset management plan shall include documentation of the
designated responsibility and authority and the means and the time-scale by
which asset management, objectives and targets are to be achieved.

Literature review on Physical Asset Management 37
Maturity assessment for Physical Asset Management: Evidence from Manufacturing Plants and Infrastructures
2.3.2.1 Strategic Asset Management
It is now worth providing a short, further in-depth on the relationship existent between
organizational strategic plans and the asset management strategy.
Referring again to PAS 55, asset management is defined as the whole of activities
that the organization undertakes to achieve its organizational strategic plans. This is
in contrast to the traditional idea that assets are only maintained to keep its value and
capability. Instead, all the operations and maintenance activities are now managed to
reach the vision of the company. As a result, a company can achieve business
success through PAM (Zhuang, 2011).
The asset management strategy is then closely linked to the business strategy. Some
issues deriving from the business situation which impact on asset management
strategy include the followings (Hastings, 2010):
• changes in demand for product or service;
• changes in revenue and costs;
• technological developments;
• new business developments;
• acquisitions;
• divestment, sale or phasing out;
• redeployment;
• changed operating practices;
• equipment replacement/Leasing;
• outsourcing or In-sourcing of services.
Other factors are related to how the organization wants to resolve the trade-offs in
decision making, such as for example:
• planning for a long term growth versus just doing enough to meet short term
requirements;
• having a degree of commitment to in-house repair and logistic support versus
outsourced support facilities;
• using the redundancy to achieve system reliability rather than seeking high
reliability of individual items;
• keeping a defined maintenance and replacement strategy in regard to run-to-
failure, age-based, condition-based, spend-limit based replacement decisions.
38 Chapter 2
Maturity assessment for Physical Asset Management: Evidence from Manufacturing Plants and Infrastructures
2.3.3 Asset Life Cycle Management
The life of an asset is determined both by the correct use and maintenance and by its
physical characteristics which are fixed in the design phase. For this reason an
approach based only on maintenance can’t work efficiently. Physical asset
management trays to overcome the limits through an approach which have an impact
over the whole life of the asset (Hastings, 2010).
The principal benefits of optimized life cycle asset management, identified by PAS 55,
are the followings:
• enhanced customer satisfaction from improved performance and control of
product or service delivery to the required standards;
• improved health, safety and environmental performance;
• optimized return on investment and/or growth;
• enhanced long-term planning confidence and performance sustainability;
• the ability to demonstrate best value-for-money within a constrained funding
regime;
• evidence, in the form of controlled and systematic processes, to demonstrate
legal, regulatory and statutory compliance;
• improved risk management and corporate governance and a clear audit trail
for the appropriateness of decision taken and their associated risks;
• improved corporate reputation, the benefits of which may include enhanced
shareholder value, improved marketability of product/service, greater staff
satisfaction and more efficient and effective procurement from the supply
chain;
• the ability to demonstrate that sustainable development is actively considered
within the management of the assets over their life cycles.
The definitions of the different phases differ somewhat depending on the approach
taken, being it process driven (such as in Hastings, 2010) or asset oriented (such as
in Brent et al., 2005)
The first author (Hastings, 2010) identified the following main stages in the life cycle:
• identification of business opportunities or needs;
• asset capability gap analysis and requirements analysis;
• pre-feasibility analysis, physical and financial – options selection;
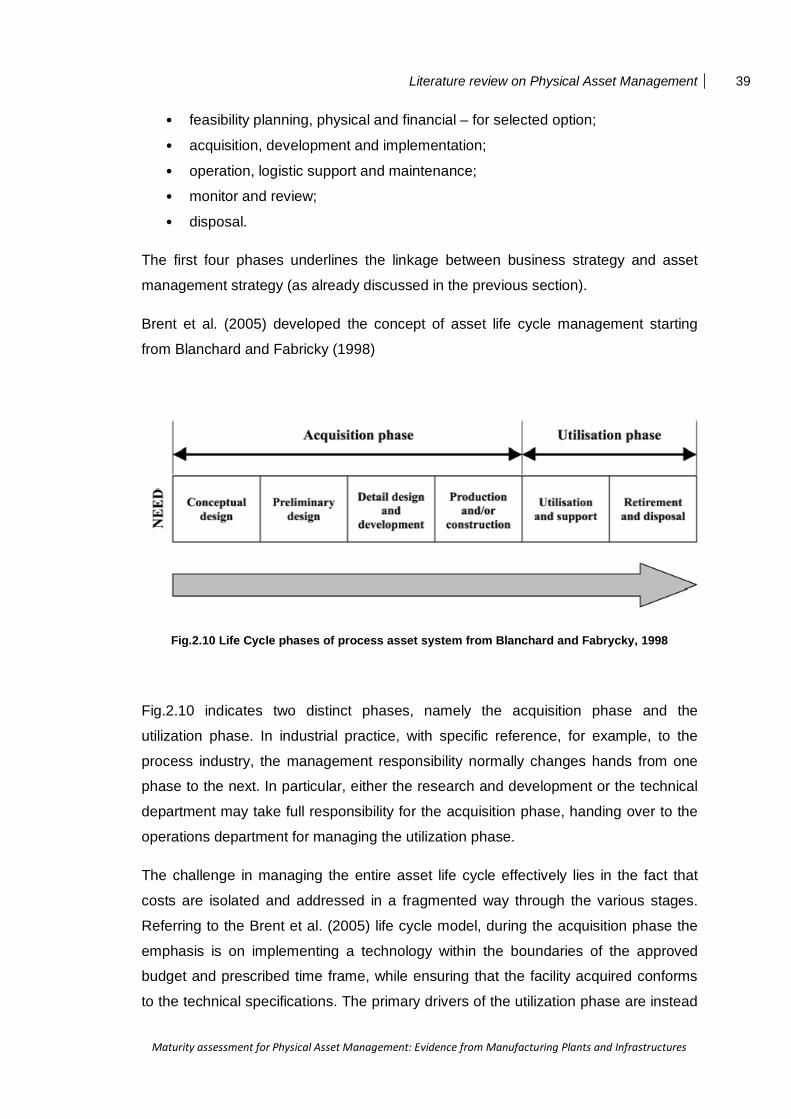
Literature review on Physical Asset Management 39
Maturity assessment for Physical Asset Management: Evidence from Manufacturing Plants and Infrastructures
• feasibility planning, physical and financial – for selected option;
• acquisition, development and implementation;
• operation, logistic support and maintenance;
• monitor and review;
• disposal.
The first four phases underlines the linkage between business strategy and asset
management strategy (as already discussed in the previous section).
Brent et al. (2005) developed the concept of asset life cycle management starting
from Blanchard and Fabricky (1998)
Fig.2.10 Life Cycle phases of process asset system from Blanchard and Fabrycky, 1998
Fig.2.10 indicates two distinct phases, namely the acquisition phase and the
utilization phase. In industrial practice, with specific reference, for example, to the
process industry, the management responsibility normally changes hands from one
phase to the next. In particular, either the research and development or the technical
department may take full responsibility for the acquisition phase, handing over to the
operations department for managing the utilization phase.
The challenge in managing the entire asset life cycle effectively lies in the fact that
costs are isolated and addressed in a fragmented way through the various stages.
Referring to the Brent et al. (2005) life cycle model, during the acquisition phase the
emphasis is on implementing a technology within the boundaries of the approved
budget and prescribed time frame, while ensuring that the facility acquired conforms
to the technical specifications. The primary drivers of the utilization phase are instead
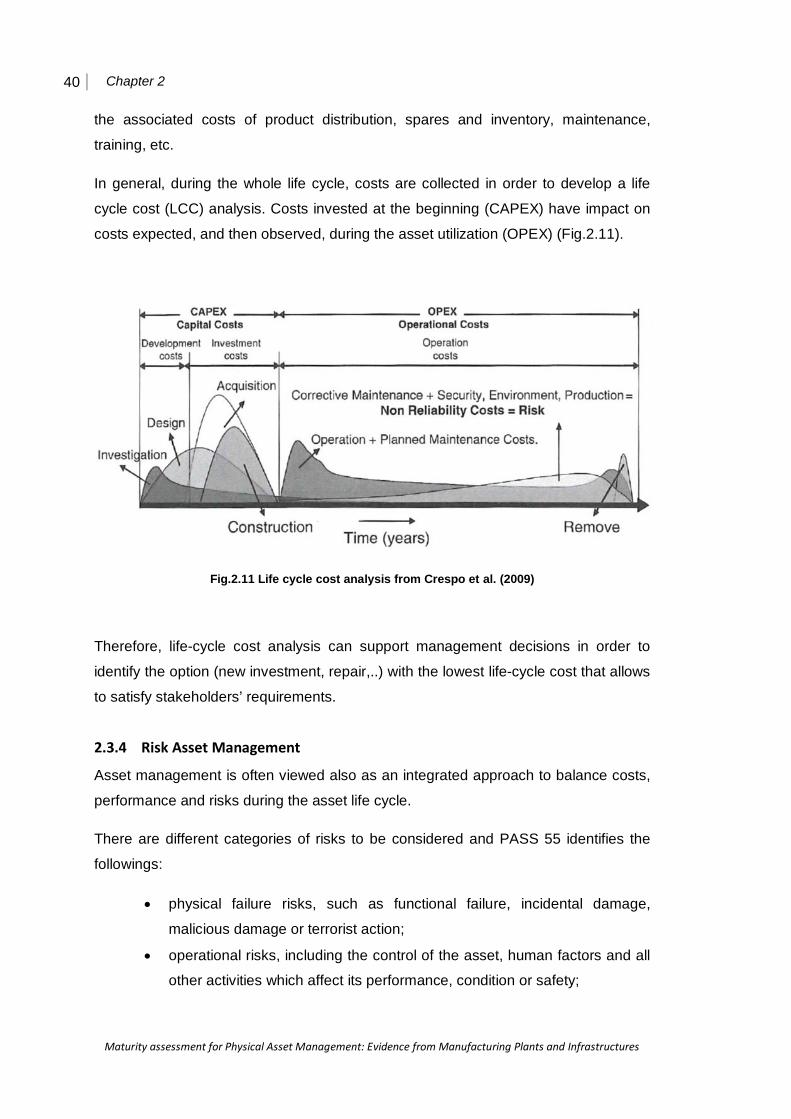
40 Chapter 2
Maturity assessment for Physical Asset Management: Evidence from Manufacturing Plants and Infrastructures
the associated costs of product distribution, spares and inventory, maintenance,
training, etc.
In general, during the whole life cycle, costs are collected in order to develop a life
cycle cost (LCC) analysis. Costs invested at the beginning (CAPEX) have impact on
costs expected, and then observed, during the asset utilization (OPEX) (Fig.2.11).
Fig.2.11 Life cycle cost analysis from Crespo et al. (2009)
Therefore, life-cycle cost analysis can support management decisions in order to
identify the option (new investment, repair,..) with the lowest life-cycle cost that allows
to satisfy stakeholders’ requirements.
2.3.4 Risk Asset Management
Asset management is often viewed also as an integrated approach to balance costs,
performance and risks during the asset life cycle.
There are different categories of risks to be considered and PASS 55 identifies the
followings:
• physical failure risks, such as functional failure, incidental damage,
malicious damage or terrorist action;
• operational risks, including the control of the asset, human factors and all
other activities which affect its performance, condition or safety;
Literature review on Physical Asset Management 41
Maturity assessment for Physical Asset Management: Evidence from Manufacturing Plants and Infrastructures
• natural environmental events (storm, floods,..);
• factors outside the organization’s control, such as failures in externally
supplied materials and services;
• stakeholders risks such as failure to meet regulatory performance
requirements or reputation damage;
• asset related design, specification, procurement, construction, installation,
commissioning, inspection, monitoring, maintenance, refurbishment,
decommissioning and disposal risks as appropriate.
Risk identification assessment and control are then important functions for proactive
asset management. Knowledge of risks is an important step in asset risk
management, but is not enough. The next step is to know what to do with these risks
(Korn, 2008).
The purpose of Risk Asset Management functions is to understand the cause, effect
and the likelihood of adverse events which may occur while an asset is managed.
Indeed, the risk assessment is important in different areas of the organization and
became fundamental in Asset Management Projects (PAS 55, 2008).
While the range of risks in a modern plant is enormous, fortunately not all are of equal
significance and usually only a relatively small percentage, about 10% (Healy, 2006),
requires the highest level of risk management to control them. Only after the
evaluation they will be identified and this means that the criticality assessment has to
be carried out for all assets and systems in the area of interest before the ‘Critical
Few’ can be identified from the rest (Healy, 2006). Criticality assessment is a
structured methodology that provides a proactive approach for the assessment of
risks in the organization.
Regarding the risk management process, there is no standard terminology. Herder
and Wijnia (2012), analyzing risk management in Infrastructure Asset Management,
identified the following three phases in the risk management process:
• establishing the context;
• risk assessment;
• risk treatment.
The ISO standard on risk management (ISO 31000: 2009) uses risk assessment as
the building of risk identification, risk analysis and risk evaluation, whereas COSO
42 Chapter 2
Maturity assessment for Physical Asset Management: Evidence from Manufacturing Plants and Infrastructures
framework (COSO, 2004) separates event identification from risk assessment (a
bundling of risk analysis and risk evaluation). However, the steps are very similar,
even though the terminology differs.
Also in PAS 55, there is explanation of a systematic approach to evaluate risks, made
of the following steps:
1. classify assets: prepare a list of assets and their components;
2. identify potential risks;
3. identify the risk controls that exist;
4. estimate the likelihood and consequences for each potential risks;
5. determine the tolerability of the risks, in other words, decide if planned or
existing controls are sufficient to keep the risk under control and to meet any
legal, statutory and other asset management requirement.
Focusing on risk assessment, there is no one method in literature. There are various
techniques varying from the ‘Wild Guess’ to the fully ‘Quantitative Risk Analysis’. The
more common systematic approaches to identifying and representing Criticality
include ‘Qualitative Assessments’, ‘Semi-Quantitative assessments’ and ‘Quantitative
Assessments’ (Healy, 2006).
Quantitative assessments are based upon historical data to ‘calculate’ the rankings
assigned to the equipment or failure mechanisms being assessed. These calculations
typically include probability of failure and cost of each failure event. Obtaining the
necessary data can be very difficult and often the data has to be pre-processed to get
it into a form suitable for the analysis and any pre-processing must be understood
and carefully carried out to prevent distortions of the final outcomes.
In some cases, especially for assessing the consequences for safety and
environmental failure mechanisms, it is not easy the quantification of the risks and
qualitative and semi-quantitative represent the only possible approaches.
In this concern, It is important to select an assessment approach in keeping with the
needs of the organization because the use of a too basic approach can result in
insufficient resolution while an overly detailed approach can increase the cost and
time for the assessment and result in a lot of redundant or unnecessary data being
generated.

Literature review on Physical Asset Management 43
Maturity assessment for Physical Asset Management: Evidence from Manufacturing Plants and Infrastructures
Depending on the level of detail included in the Criticality Analysis, the results allow
many Asset Management decisions to be based on objective criteria and they also
provide an audit trail for future review and updating (risk treatment step).
Some of the applications of the criticality analysis results, identify by Healy (2006),
include the following:
• Provide a common communication tool;
• Process system design;
• Redundancy – equipment and systems;
• Maintenance programs;
• Work management based on known risk;
• Identify spare parts requirements;
• Target maintenance budgets;
• Identify training requirements;
• Identify skill based risk;
• Quantify the maintenance commitment CSFs, KPIs (critical success factors,
key performance indicators);
• Provide a basis for system modeling;
During the risk treatment the option that provide the best net benefit unit of employed
resource should be chosen. A practical approach is to monetize the effects on all
value and perform a net present calculation but very often mitigation measures have
a timing option, so it is needed an integrated approach that takes into account both
cost and time of the actions (Herder and Wijnia, 2012)
2.4 Data, Information and Knowledge in Physical Asset Management
Bohn (1994) provides definitions to distinguish between data, information, and
knowledge. Data, derived directly from monitoring or sensing the measured level of
variable in the form of a stream of measurement, is transferred to a database, where
it is stored in a form customized for the users and suitable for limited analysis.
Information is data which is organized or given structure, and gives the current or past
status of some part of the system and may be used for optimization and decision
analysis studies to produce knowledge. Knowledge, as information combined with
experience, context, interpretation and reflection permits making predictions, casual
associations, or prescriptive decisions about what to do. Knowledge accumulates in
44 Chapter 2
Maturity assessment for Physical Asset Management: Evidence from Manufacturing Plants and Infrastructures
programs, technologies, roles, activities, software, skills as it is articulated and
becomes formalized.
Data, information and knowledge in PAM is further analyzed in next subsections,
looking at three different perspectives: asset management data life cycle, information
flows and asset knowledge.
2.4.1 Asset management data life cycle
The pressure on cost reduction increased the importance of monitoring performance,
above all maintenance performance. It is widely acknowledged that it is necessary to
support maintenance staff by supplying them with accurate and up-to-date
information regarding maintenance tasks and recent history.
In order to do this, it is important that the necessary data is captured, stored and
presented in an appropriate way. Asset management and condition data can be
captured either manually or with sensors but this potential wealth of information must
be effectively managed if it is to be of use (Baglee et al., 2012).
Baglee et al. (2012) identify a cyclic process in managed data:
Data Gathering
Data Storage
Data Analysis
Data Presentation
Data gathering: collecting data is crucial for both scheduling maintenance and for
assessing the performance of maintenance regime. This can be done through manual
inspection or online sensors, and may regard also cost data for both maintenance
and repairs followings failures, usage statistics and downtime costs resulting from
both maintenance and repairs.
Many condition sensors are available ranging from simple temperature probes,
vibration sensors, and pressure transponders to advanced systems such IR
spectrometers for automatically measuring the condition of lubricating oil. Other
important condition monitoring technologies include vibration analysis, acoustic
emission analysis, thermography and mechanical stress measurement. These
condition-specific techniques can be supplemented with the analysis of other general,
functional characteristics of the equipment, such as flow rates, temperatures and
Literature review on Physical Asset Management 45
Maturity assessment for Physical Asset Management: Evidence from Manufacturing Plants and Infrastructures
pressures. Furthermore, energy consumption is increasingly finding applications as
an indicator of condition.
These automated techniques can also supplement manual data collection using
devices such as PDAs (Personal Data Assistant) and hand held data collectors. The
increased memory capacity computational power of mobile phones will lead to them
finding application in this area (Fumagalli et al., 2010)
Data storage: once data are collect, it is important to store and manage them in a
manner which makes it easily accessible and which allows the required data to be
accessed efficiently when required.
Database systems offer many advantages in the field of asset management and
maintenance in terms of security and data accessibility. Database systems are then
an essential part in order to achieve data storage, and may find many different forms
in maintenance application, ranging from general purpose tools (i.e. tools to develop
data bases commercially available in PC platforms, such as e.g. Microsoft Excel
and/or Access) to being core part of so called CMMSs (Computerized Maintenance
Management System) or software modules of more general ERP systems.
To better integrate different systems needed in maintenance application, ranging from
shop-floor / equipment to business level, a number of standards has been proposed.
Such standards are the main background in order to develop systems’ interoperability
in maintenance, they may be both generic (such as e.g. XML) and specific standards
(MIMOSA for condition based maintenance, …).
Data analysis: analysis of data are fundamental to identify maintenance areas where
improvements are possible or necessary.
Several methodologies exist to maximize the performance of a maintenance regime
based on an analysis of the performance of the assets and the existing maintenance
regime. The primary methodologies are Total Productive Maintenance (TPM) and
Reliability Centered Maintenance (RCM), with variations being developed to suit
individual organizations. TPM/RCM include then different methods for data analysis
such as, e.g., histograms, Pareto diagrams and RCA (root cause analysis) originally
used in TPM, Weibull analysis and RBD (Reliability Block Diagram) promoted in the
frame of RCM.
46 Chapter 2
Maturity assessment for Physical Asset Management: Evidence from Manufacturing Plants and Infrastructures
Data analysis is also important in terms of extracting meaningful information from raw
sensor data using statistical techniques. The goal of any statistical analysis is in fact
to uncover facts. Various tools are available for data processing and analysis to this
end. The most widely used techniques are Artificial Neural Networks, Statistical
Learning and Probabilistic Modeling (Baglee et al., 2012). Most fault detection
systems function by studying the relationship between various sensor readings and
using some form of model to detect abnormal behavior.
Data presentation: presenting data in a convenient and appropriate way is vital in
ensuring that asset management systems are used effectively and provide a return
on their investment.
Having a good data presentation system means providing the correct data to the
correct personnel. For example, management personnel require a high level overview
indicating current performance across an appropriate reporting period while shop-
floor maintenance engineers require current data relating to the operations assets
which are their responsibility.
PDAs, other mobile devices (such as smart phones) and Dashboard Interfaces are
very useful tools for this aim, i.e. in order to achieve a customized presentation of
data/reporting to the user. In particular:
• PDA technology supports the transfer of data between the user and a central
maintenance database system. The role of the PDA is to provide a user-
friendly, comfortable and powerful mobile computing device for dealing with
different types of data processing and maintenance activities.
PDA can be used in a different way, relating to the needs of the users. For
example, technicians can follow the onscreen instructions step-by-step to
complete a maintenance task. Even in poor conditions where no network
connection is available, PDAs will become more useful since a compact
database can be pre-stored inside the PDA’s internal memory or memory
stick.
• Evolution of PDA and mobile phone technology are smart-phones, that are
available at relatively low cost and offer the ability to run easily-written
software. Furthermore they are increasingly equipped with high level systems
such as GPS receivers and broadband connectivity. Smart-phones also
feature calendar and organizer systems which can be integrated with bespoke

Literature review on Physical Asset Management 47
Maturity assessment for Physical Asset Management: Evidence from Manufacturing Plants and Infrastructures
software. These features, coupled with steadily growing memory capabilities,
make smart-phones the likely replacement for PDAs as mobile maintenance
management tools, especially in applications where remote maintenance is
required due to their mobile connectivity.
• Dashboard system is an “user interface that is to be easy to read” (Wikipedia,
Dashboard (management information systems), 2012). It has been a well
covered topic in many areas of decision support. These systems provide, for
example, management personnel with only the most essential information
required for senior managers to assess. Also technical personnel may find the
required data presentation: simple graphical displays are used in order to
illustrate and present, e.g., power consumption, maintenance and condition
monitoring data with click through access to greater detail and analysis as
required.
Fig.2.12 summarizes the previuos concepts.
Fig.2.12 Asset Management tools by position in data lifecycles from Baglee et al., 2012
2.4.2 Information Flows In Physical Asset Management
Asset lifecycle management involves significant amount of acquisition, processing,
and analysis of information that enable a variety of lifecycle aspects such as planning,
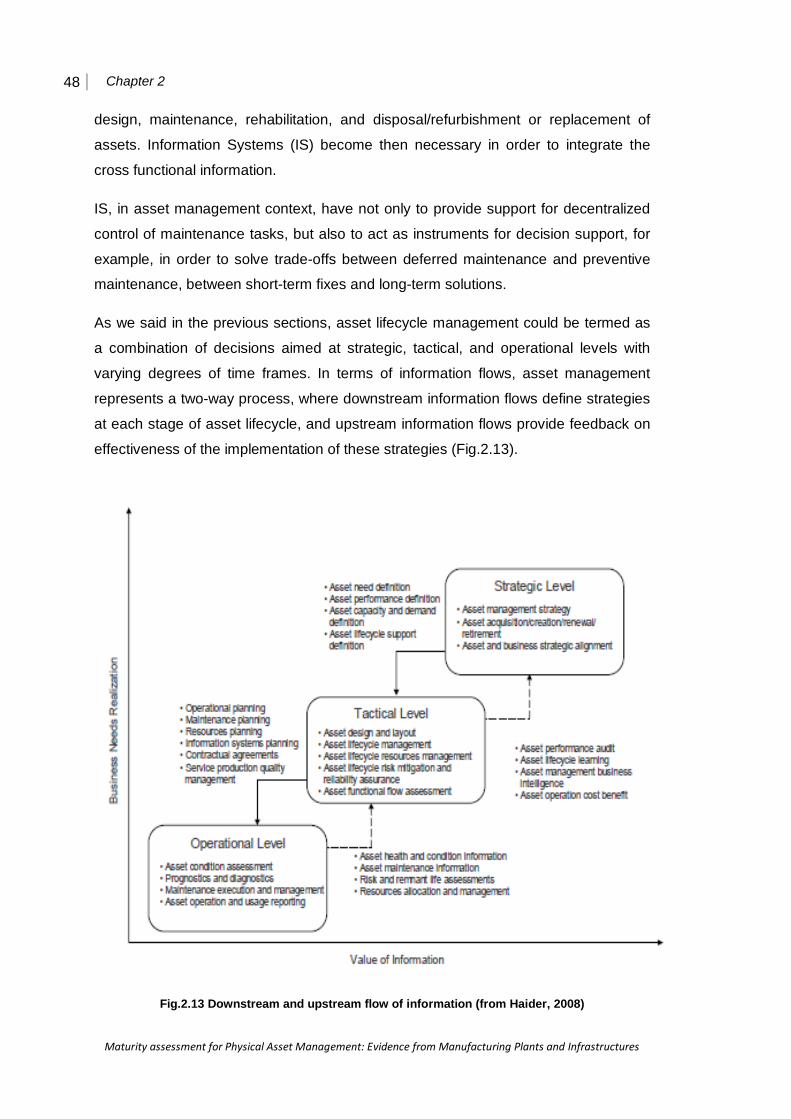
48 Chapter 2
Maturity assessment for Physical Asset Management: Evidence from Manufacturing Plants and Infrastructures
design, maintenance, rehabilitation, and disposal/refurbishment or replacement of
assets. Information Systems (IS) become then necessary in order to integrate the
cross functional information.
IS, in asset management context, have not only to provide support for decentralized
control of maintenance tasks, but also to act as instruments for decision support, for
example, in order to solve trade-offs between deferred maintenance and preventive
maintenance, between short-term fixes and long-term solutions.
As we said in the previous sections, asset lifecycle management could be termed as
a combination of decisions aimed at strategic, tactical, and operational levels with
varying degrees of time frames. In terms of information flows, asset management
represents a two-way process, where downstream information flows define strategies
at each stage of asset lifecycle, and upstream information flows provide feedback on
effectiveness of the implementation of these strategies (Fig.2.13).
Fig.2.13 Downstream and upstream flow of information (from Haider, 2008)
Literature review on Physical Asset Management 49
Maturity assessment for Physical Asset Management: Evidence from Manufacturing Plants and Infrastructures
Information in PAM acts as strategic translator as well as strategic enabler (Haider,
2008). In the first view, information enforces decisions to manage asset lifecycle,
whilst, in the other view, information enables decisions on how to best mange the
asset lifecycle.
The strategic layer takes a total cost of ownership perspective and is concerned with
the decisions such as asset design and refurbishments, asset demand management,
performance definition, planning of performance and capacity, and asset lifecycle
supportability design. These decisions depend upon the quality and availability of
information on asset performance, cost and efficiency audits, and sustainability of the
service and delivery potential through asset operation.
The other two layers work towards compliance of performance standards defined by
strategic layer with a longer time horizon. Tactical layer has a proactive scope and is
focused on establishing procedures and plans aimed at developing lifecycle
operational, maintenance, and service quality levels, risk management initiatives and
asset and lifecycle processes reliability modeling, through definition of arrangements
such as information systems, and third party contractual agreements. This layer is the
most important layer in terms of IS, as the overall process of operational asset
management is driven from this layer. The tactical layer specifies the types of, and
the interaction between different IS employed to facilitate asset lifecycle
management. Significance of this layer underscores the need to integrate asset
management systems to enable an integrated view of asset lifecycle as well as to
provide a consolidated conduit of information to help enterprise planning and risk
management.
The operational layer represents the functions necessary to keep the assets up and
running to near original condition. The focus of this layer is to manage asset
workload, provide assessments on asset operation and condition, diagnostic ability to
detect failure conditions, alarm and notifications generation, and maintenance
scheduling and execution. The objective of the operational layer is to provide an
ongoing snapshot of asset health and operating conditions to tactical and strategic
layers. Successful utilization of IS at this layer, therefore, depends upon the speedy
availability, quality, and interoperability of information.
It is clear that the IS have different roles in asset lifecycle management, ranging from
simple record keeping tools to strategic decision support aids. However, the success
of IS requires different features:

50 Chapter 2
Maturity assessment for Physical Asset Management: Evidence from Manufacturing Plants and Infrastructures
• appropriate hardware and software applications;
• quality, standardized, and interoperable information (because interoperability
is required across the different phases of the asset life cycle);
• appropriate skill set of employees to process information; and
• strategic fit between the asset lifecycle management processes and the IS.
2.4.3. Asset Knowledge According to Hastings (2010), Asset Management depends on the knowledge about
the organization’s assets, in terms of both current equipment, business role of the
assets and future business prospects. Indeed, Asset managers need to have a
practical working knowledge of the major assets at a management level so as to be
able to make sound business decisions. They need to be aware of the components
constituting the asset system and how each of them impact on the capability of the
system, and they also have to keep systematic track of the changes to equipment
configuration, such as technical upgrades and regulatory compatibilities.
A summary of points of knowledge, defined by Hastings, which an asset manager
may need to have is shown below in a number of managerial questions:
1) What asset have we got?
2) Where are they located?
3) What is the business significance of our major assets?
4) What is the profit and loss position of our major assets?
5) What is our asset utilization including peak load and seasonal factors?
6) Are there gross imbalances – that is, major shortages, surpluses or
misallocations of equipment or personnel?
7) What is the condition of each major asset?
8) Are reliability or availability issues significant?
9) How much longer can specific assets last?
10) Are there significant risks?
11) Are maintenance costs a significant factor?
12) What asset related developments and market opportunity exist?
13) What has the market got to offer in terms of assets that we might usefully
acquire?
Vanier (2001) identified the following six questions which can drive the assessment of
the current asset condition of the organization, so creating asset knowledge:
Literature review on Physical Asset Management 51
Maturity assessment for Physical Asset Management: Evidence from Manufacturing Plants and Infrastructures
• What do you own?
• What is it worth?
• What is the deferred maintenance?
• What is its condition?
• What is the remaining service life?
• What do you fix first?
More insight is provided in the remainder of this section.
1. What do you own?
The first question to be answered relates to the physical area of responsibility of an
organization. Administrative change such as restructuring, amalgamation or
downsizing makes it difficult to document the full extent of an organization's portfolio.
Tools in the IS (see previous section 2.4.2 focused on this topic) which can help to
answer the question are: Geographical Information Systems (GIS), CAD systems and
relational database management systems which provide accurate pictures of the
extent of an asset management portfolio. One such tool that is typically used to
record what assets are owned is a Computerized Maintenance Management System
(CMMS). There is a large selection of “fully commercialized” CMMSs available; many
of these systems are relational database applications that can be adapted to meet the
data handling needs of asset managers. For example, any number of CMMS
applications can manage work orders, trouble calls, equipment cribs, stores
inventories and preventive maintenance schedules, and many programs include
features such as time recording, inventory control and invoicing. The CMMS’s
capability to store inventory data is very high, but their capacity with respect to life
cycle economics, service life prediction and risk analysis is considerably less
sophisticated.
2. What is it worth?
Once an organization identifies the extent of its portfolio, the next question to be
answered is "what is the asset value?”. Unfortunately, it is not a simple matter of
providing numbers for each asset, as assets may consist of many components with
their own individual values, they may have historical values on record, or there may
be approximations based on unit areas or volumes.
52 Chapter 2
Maturity assessment for Physical Asset Management: Evidence from Manufacturing Plants and Infrastructures
In particular, there are different terms to describe the “value” of an asset: historical
value, appreciated historical value, current replacement value, “performance in use”
value, deprival cost and market value. But many organizations do not store the
“value” of that asset in their IS, but only the cost of installation or replacement.
Nonetheless, asset managers require both value and cost in order to make educated
and informed decisions about maintenance and renewal.
One of the analysis tools most utilized to understand the “value” of an asset is the Life
cycle costing (LCC). It is useful for comparing different options, for example, in order
to evaluate if it is more expensive maintaining an asset or replacing it with a new
investment, or also to decide between two possible investments one with lower cost
of installation and another one with lower cost of utilization. But LCC, to be properly
applied, may require better information on the different terms of “value” of an asset.
3. What is the deferred maintenance?
When the calendar comes to a maintenance scheduled event, we cannot stop at this
event only by considering the annual costs. It must be considered the likely effects of
postponing an operation to the next year. This is important because if the
maintenance is not completed in year one, then the costs of maintenance, repair or
replacement are significantly higher in subsequent years.
Typically, CMMS tolls can help to understand these effects studying trends and other
information stored in it, for example, data about the repair dates, repair scope, labor
costs, contract specifications and drawings.
4 What is its condition?
Often, in order to understand better the condition of an asset, a Condition Index (CI)
is calculated including different factors, such as the number of defects, physical
condition and quality of materials or workmanship. During this phase it is important to
make forecasts on the future CI, through benchmark not only with different assets, but
also for the same asset at different time.
5 What is the remaining service life?
After the extent of the asset portfolio is established, along with its value and technical
condition determined, the asset manager must also be able to establish the remaining
service life of the assets: this is needed in order to calculate the life cycle costs for
alternative maintenance, repair and renewal strategies.
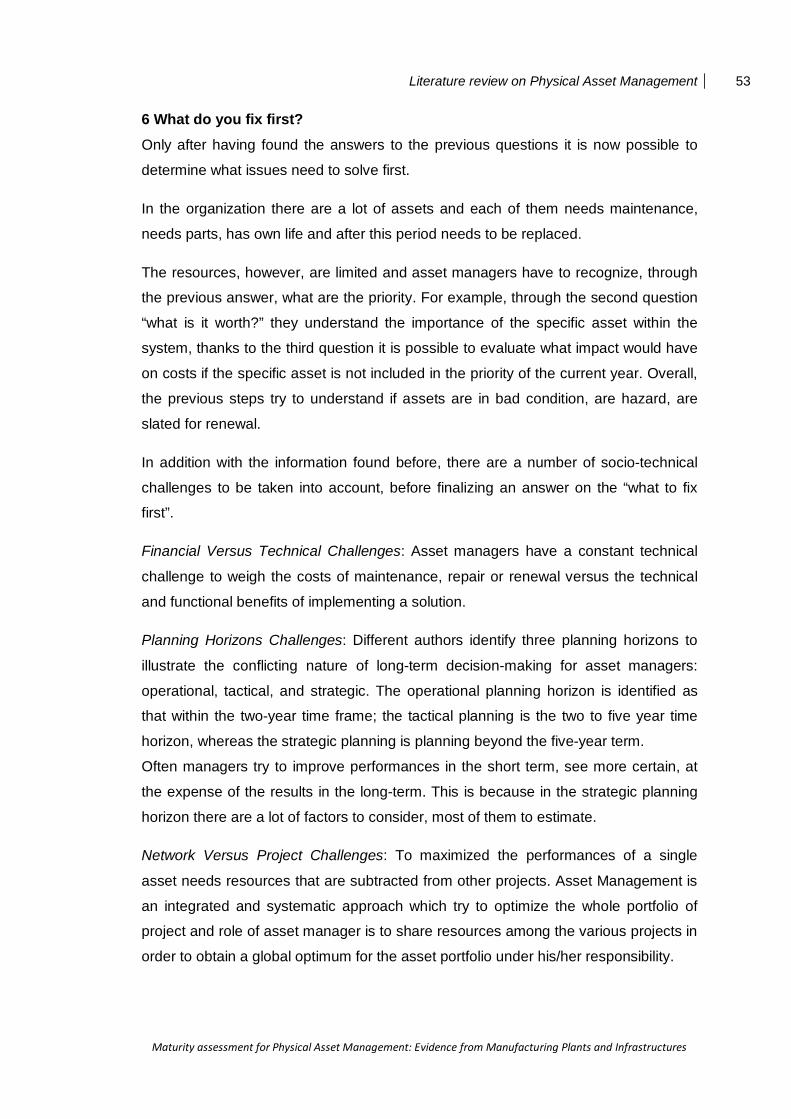
Literature review on Physical Asset Management 53
Maturity assessment for Physical Asset Management: Evidence from Manufacturing Plants and Infrastructures
6 What do you fix first?
Only after having found the answers to the previous questions it is now possible to
determine what issues need to solve first.
In the organization there are a lot of assets and each of them needs maintenance,
needs parts, has own life and after this period needs to be replaced.
The resources, however, are limited and asset managers have to recognize, through
the previous answer, what are the priority. For example, through the second question
“what is it worth?” they understand the importance of the specific asset within the
system, thanks to the third question it is possible to evaluate what impact would have
on costs if the specific asset is not included in the priority of the current year. Overall,
the previous steps try to understand if assets are in bad condition, are hazard, are
slated for renewal.
In addition with the information found before, there are a number of socio-technical
challenges to be taken into account, before finalizing an answer on the “what to fix
first”.
Financial Versus Technical Challenges: Asset managers have a constant technical
challenge to weigh the costs of maintenance, repair or renewal versus the technical
and functional benefits of implementing a solution.
Planning Horizons Challenges: Different authors identify three planning horizons to
illustrate the conflicting nature of long-term decision-making for asset managers:
operational, tactical, and strategic. The operational planning horizon is identified as
that within the two-year time frame; the tactical planning is the two to five year time
horizon, whereas the strategic planning is planning beyond the five-year term.
Often managers try to improve performances in the short term, see more certain, at
the expense of the results in the long-term. This is because in the strategic planning
horizon there are a lot of factors to consider, most of them to estimate.
Network Versus Project Challenges: To maximized the performances of a single
asset needs resources that are subtracted from other projects. Asset Management is
an integrated and systematic approach which try to optimize the whole portfolio of
project and role of asset manager is to share resources among the various projects in
order to obtain a global optimum for the asset portfolio under his/her responsibility.

54 Chapter 2
Maturity assessment for Physical Asset Management: Evidence from Manufacturing Plants and Infrastructures
Concluding, it is clear that, in order to achieve an effective PAM, Asset Knowledge
has to be operated spread through different planning horizons, considering a variety
of technical and business issues: to this end, it is fundamental obtaining the proper
information, hence the IS has a strategic role for supporting the Asset Knowledge
creation as well as its maintenance.
2.5 Asset Performance Assessment
Asset performance management is a multi – disciplinary management process, which
provides a critical support for heavy and capital – intensive industry by keeping the
assets like machinery and equipment in a safe operating condition. Managing the
asset performance is critical for long-term economic and business viability. Asset
performance assessment is a complex issue involving multiple inputs and outputs
besides various stakeholders’ dynamic requirements. Lack of integration between
various stakeholders and their changing requirements in strategic asset performance
assessment is still a major issue for industries (Parida, 2012).
From some time there has been considerable interest in performance measurement.
It is established that companies using an integrated balanced performance
measurement system perform better than those not measuring their performance
(Lynch and Cross, 1991).
From literature, it emerges that measurement systems must reflect the context and
the objectives of the organization. The nature and the design of performance
measurement systems has been changing during these years to ensure that they
reflect the environment and the strategies of organizations (Kennerly and Neely,
2003). During the last two decades, competitive and dynamic business environment
requires the asset utilization and performance optimization throughout their life cycle.
In order to know the efficiency and effectiveness of asset management, the
assessment of asset performance has become an integral part of the business today
(Parida, 2012). The introduction of technological instrument such as embedded and
wireless sensors, automated controls and data analysis management has allowed to
overcome the barriers of distance, to transfer real time date and, hence, to develop
new performance assessment systems (Toran et al., 2000). Again the IS is a
fundamental lever for the development of performance assessment systems
Literature review on Physical Asset Management 55
Maturity assessment for Physical Asset Management: Evidence from Manufacturing Plants and Infrastructures
2.5.1 Issues related to Key Performance Indicators
The management of the organization needs to convert the corporate strategy and
objectives to the specific objectives of different hierarchical levels of the organization.
The asset performance needs then to be measured and managed for achieving the
objectives.
In order to achieve the asset performance objectives, derived from corporate
objectives and strategy, critical success factors are normally identified and, starting
from these, Key Performance Indicators (KPIs) are developed for measuring the
assets performance. KPIs are periodically measured and also used in benchmarking
activity and to send feedback improving the assessment performance systems
(Parida, 2012).
For many asset intensive industries, the operation and maintenance costs of assets
are a significant portion of the total cost. Further, breakdowns and downtime have an
impact on the plant and asset capacity, product quality, and cost of production, as
well as on health, safety and environmental issues (Parida, 2012). Hence, there are a
lot of research in literature concerning KPIs maintenance performance.
Galar et al. (2011) identified the following issues about KPIs Maintenance
performance and their challenges/problems for implementation:
1) Too much data and little information: The acquisition of data has become
relatively simple and cheap through the introduction of modern and powerful
hardware systems and software. But having too much data could be useless if
they are not understandable by the users.
2) The number of performance indicators, ownership of the data and the aspects
to be covered are too high: hence, the number of indicators used for each
figure, or department, should be limited by identifying key features or "key
factors". On the other hand, scorecards with huge quantities of indicators
without user or defined personal responsible provide only hinder to the work
for which they are made.
3) Clear objectives and measures: There are situations where departments
within the same company have conflicting interests in relation to the
maintenance of their equipment. The purpose of the objectives is to ensure
that departmental efforts are aligned with business needs. The objectives
should be transmitted in a downward cascade, including all departments, and
56 Chapter 2
Maturity assessment for Physical Asset Management: Evidence from Manufacturing Plants and Infrastructures
subsequently taking appropriate steps according to the measures adopted by
the selected sensors, ensuring that everyone is going in the same direction
(i.e. aligned with business objectives / strategy).
4) Time lag between action and monitoring results: Sometimes there is a delay
between a policy change and the appearance of clear and apparent results
associated (or expected) with that change. A second delay can be found
between the appearance of results and the time taken for the measurement.
This should be taken into account when assessing asset performance.
5) The cost and reasons for data collectors: The success of any measurement
system is based on the method used for data collection. Poor or incorrect data
entered into a reporting system will result in poor and little value. Human
factors involved in the collection of data are an important aspect, as the data
collected by personnel are closely related to indicators of their ownership and
responsibility, towards achieving their own objectives. The technicians and
operators will collect data only if they believe it is worthwhile and the results
are made available for free consultation and use. If the time passes and data
have not been used for anything, have been forgotten and feedback produced
by them has not been transmitted through good communication, people will
inevitably feel a waste of time, and reduce their effort and/or attention to data
collection.
Asset performance, which include KPI maintenance performance and other aspects
(i.e. business and technical aspects), can be applied all these challenges. In fact, the
system of asset performance measurement should cover all processes related to it
within the organization.
2.5.2. Frameworks of Key Performance Indicators
In literature, one can be find a lot of authors who define a set of indicators divided into
different groups, aggregations. For example, Wireman (1998) divided indicators in
corporate, financial, efficiency and effectiveness, tactical, functional performance;
while Càceres (2004) segmented maintenance indicators according to the
organization’s area of influence, due to interactions of the maintenance department
with finance, human resources, purchasing and, of course, production to achieve
corporate objectives.

Literature review on Physical Asset Management 57
Maturity assessment for Physical Asset Management: Evidence from Manufacturing Plants and Infrastructures
Another interesting approach is proposed by Tsang’s (2002), in which the author
adopted the scorecard method developed by Kaplan and Norton. It designs the
maintenance performance measure using the following four perspectives:
- Financial (the investor’s view)
- Customers (the performance attributed valued by customers)
- Internal process (the long-term and short-term means to achieve financial and
customer objectives)
- Learning and growth
Tsang (2002) considers that by using the Balanced Score Card, the company could
link the maintenance strategy with the overall business strategy and develop
performance measures for maintenance that are linked to the organization’s success.
Kumar et al (2011) extended Tsang’s model, considering also health, safety, security
and environment and employee satisfaction to make the MPM (Maintenance
Performance Measurement) system balanced and holistic from the organizational
point of view.
In order to help managers in their decision process there must be an interconnection
between the different indicators (Galar et al., 2011).
According to Mitchell et al. (2002), a hierarchy of different parameters, all linked to
business goals, is vital for the success of a program to manage corporate physical
assets.
Also Grenčík and Legat (2007) analyze the consistency of the indicators and their
management classification levels. To select the relevant indicators, the first step is to
define the objectives at each level of the company. At the company level, the
requirement is to determine how to manage maintenance to improve overall
performance (profits, market shares, competition, etc.). At the level of production,
performance factors which have been identified through prior analysis are more
important; these include improved availability, improved intervention costs, safety,
environmental preservation, improvements in maintenance costs, value inventory,
contracted services control, etc.
Parida and Chattopadhyay (2007) developed an APA (Asset Performance
Assessment) framework in which considered different set of indicators and link them
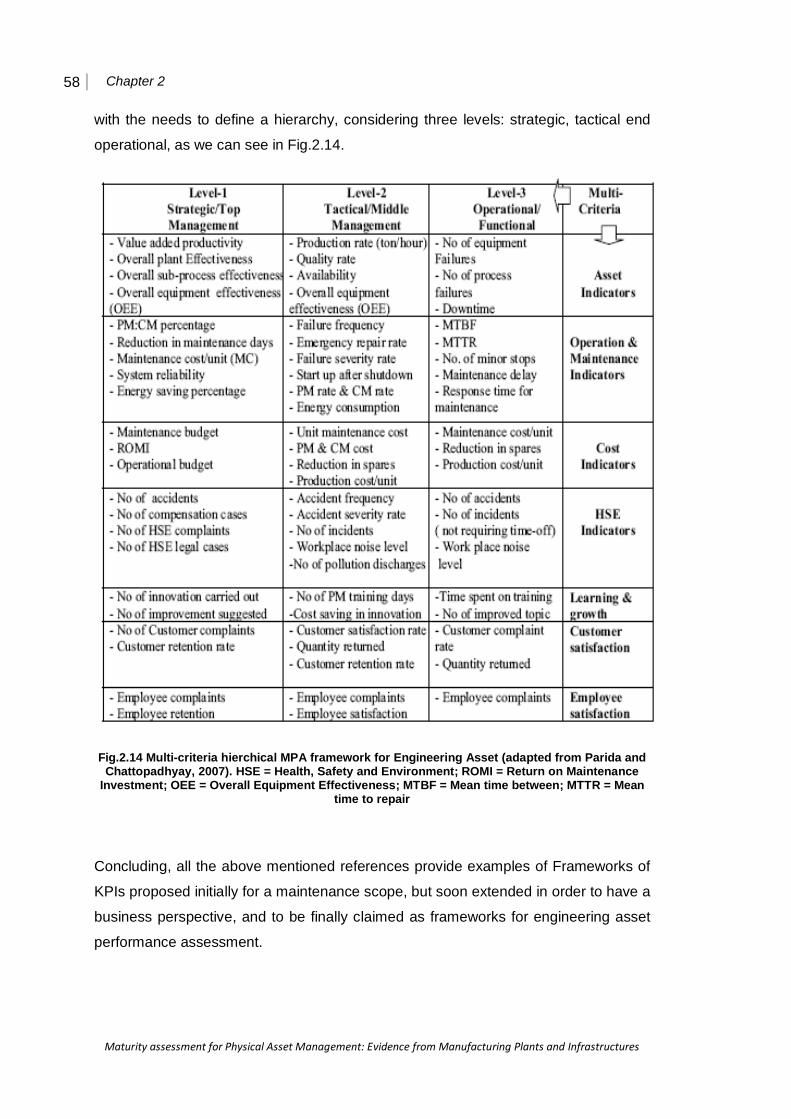
58 Chapter 2
Maturity assessment for Physical Asset Management: Evidence from Manufacturing Plants and Infrastructures
with the needs to define a hierarchy, considering three levels: strategic, tactical end
operational, as we can see in Fig.2.14.
Fig.2.14 Multi-criteria hierchical MPA framework for Engineering Asset (adapted from Parida and Chattopadhyay, 2007). HSE = Health, Safety and Environment; ROMI = Return on Maintenance
Investment; OEE = Overall Equipment Effectiveness; MTBF = Mean time between; MTTR = Mean time to repair
Concluding, all the above mentioned references provide examples of Frameworks of
KPIs proposed initially for a maintenance scope, but soon extended in order to have a
business perspective, and to be finally claimed as frameworks for engineering asset
performance assessment.
Literature review on Physical Asset Management 59
Maturity assessment for Physical Asset Management: Evidence from Manufacturing Plants and Infrastructures
2.5 Concluding Remarks
This chapter has provided a wide overview of PAM, to prepare the background for the
establishment of a maturity assessment for PAM.
As a result of the chapter, it can be synthetically stated that, when talking about PAM,
the following topics are relevant for assessing how PAM is developed (hence mature)
in a company: the organization, considering both PAM function, roles of personnel
and cultural aspects, the Asset management decision making framework and needed
methodologies such as those enabling Asset Life Cycle Management and Risk Asset
Management; the Information System for supporting Asset management; the Asset
Performance measurement. The maturity assessment for PAM should consider all
these topics

Maturity assessment for Physical Asset Management: Evidence from Manufacturing Plants and Infrastructures
Chapter 3. Maturity Assessment Methodology
In this Chapter, the methodological aspects of this research – related to the maturity
assessment – are presented.
The work starts from the comparison between two models. The first one is the
Maintenance Maturity Model, developed by TeSeM Observatory (on Technologies
and Services for Maintenance) of School of Management of Politecnico di Milano and
the second one has been developed by a research group at Delft University of
Technology (TUDelft), Faculty of Technology, Policy and Management (TPM).
In Section 1 a short introduction to maturity models is provided, focusing on benefits
of their adoption. Therefore, in Section 2, the Capability Maturity Model Integrated
(CMMI) methodology is quickly presented, describing its two possible representations
of maturity. In Section 3 we analyze the Maintenance Maturity model developed by
TeSeM Observatory – based on the CMMI methodology –, while in Section 4 the
TUDelft Model – also based on the CMMI methodology – is analyzed. Afterwards, a
comparison between the two models is developed, in Section 5. In the last Section 6,
a third model, also used as a support in developing the new one proposed in this
thesis, is finally presented.
3.1 Introduction to maturity models and their benefits
The use of maturity models provides a number of advantages. Volker et al. (2011)
summarize them, in general, in the followings.
• First of all, maturity models provide a normative description of good practices.
That is, the maturity levels set an ideal standard that organizations can strive
for.
• Another benefit of maturity models is that they are a discussion tool for
engaging interviewees and enable reflection on the current status of an
organization. The resulting identification of strengths and weaknesses can act

62 Chapter 3
Maturity assessment for Physical Asset Management: Evidence from Manufacturing Plants and Infrastructures
as a framework for prioritizing actions and can help raising awareness about a
particular strategic process among the employees and board members.
• Finally, maturity models can be used to benchmark (parts of) organizations.
Van der Lei et al. (2011) mention the positive link between the implementation of
PAM standards, such as PAS55, and the maturity level of an organization. This
implies that increased attention for quality improvements and strategic asset
management could improve performances in a company, just as much as a maturity
model or other kinds of standards could contribute to business results.
3.2 The Capability Maturity Model Integrated methodology
Both TeSeM and TUDelft models were developed basing on the CMMI (Capability
Maturity Model Integrated) methodology.
The first version of a capability maturity model (CMM) was developed by the Carnegie
Mellon University as a tool to objectively assess the ability of contractors in
performing a project. It was based on data from software projects for the U.S.
department of Defense and a process maturity framework for software processes.
Gradually, it has been extended as an appraisal method into a broader array of areas,
such as the IPD-CMM (Integrated Product Development Capability Maturity Model),
P-CMM (People Capability Maturity Model), SW-CMM (Capability Maturity Model for
Software), SE-CMM (Systems Engineering Capability Maturity Model), SA-CMM
(Software Acquisition Capability Maturity Model), and CMMI (Capability Maturity
Model Integration).
A maturity model can be viewed as a set of structured levels that describe how well
different processes of an organization are able to produce the required outcomes in a
reliable and sustainable way.
There are two possible representations in CMMI approach (Minzoni, 2004):
Staged Representation (SR): 5 Maturity Levels (MLs) are defined, and they
are related to the whole activity that must be evaluated; for each of them, a
few Process Areas (PAs) are defined, and they have to be improved to reach
the specific ML. So, if a generic firm is at a level 3 of maturity, it has to
improve a set of predefined PAs in order to pass to level 4. This means that

Maturity Assessment Methodology 63
Maturity assessment for Physical Asset Management: Evidence from Manufacturing Plants and Infrastructures
this representation provides a predefined roadmap for improvement, in which
every stage/ML contains a set of PAs indicating where to focus in order to
make company work better. Continuous Representation (CR): 6 Capability Levels (CLs) are defined,
instead of MLs; a CL represents a measure assigned to a lone PA; in this way,
maximum flexibility for firms to choose which processes to point at is provided.
The adjective “continuous” means that there are no stages in which to focus
on different goals, and procedures to follow are organized in order to support
the development of every single process area. In this representation, unlike in
the staged one, goals are not specifically defined. Here, every process has a
different capability level, and the whole of them make up a so-called Capability
Profile.
3.3 The TeSeM Maintenance Maturity Assessment Model
The purpose of this model (Macchi et. al, 2011) is to analyze how maintenance
practices are currently set up in an organization, especially focusing on how new
practices were developed thanks to the advancement in the use of ICT tools/devices
for diagnostics, prognostics and maintenance engineering.
The model was developed based on the CMMI methodology, in particularly the
continuous approach was preferred because the authors suppose that there is not a
pre-defined roadmap in maintenance management (considering also the possibility to
have different good practices in different company’s sectors and sizes). Continuous
Representation offers the maximum flexibility for prioritizing process improvements
and aligning them with the business objectives. Henceforth, the authors proposed a
“modified” continuous representation in which they defined five maturity levels
(instead of six capability levels) with a similar meaning of the “original” CMMI model.
In particular, maintenance is analyzed considering a number of Process Areas (PAs),
as suggested by the CMMI methodology.
More specifically, the TeSeM model aims at evaluating technological, organizational
and management aspects in maintenance, defining three synthetic maturity scores
summarizing company’s behaviors. As a final outcome, the maintenance maturity is
assessed both as a synthetic index, General Maturity Index (GMI), and as a set of

64 Chapter 3
Maturity assessment for Physical Asset Management: Evidence from Manufacturing Plants and Infrastructures
component indexes accordingly with PAs identified, Managerial (MMI), Organizational
(OMI) and Technological (TMI).
Managerial Maturity Index (MMI) assess al the PAs concerned with the planning
and control cycle.
Organizational Maturity Index (OMI) refers to all those PAs concerned with
knowledge management and improvement of internal and external relationship
(within the maintenance internal structure and with parties external to the
maintenance department, i.e. with other enterprise functions or third parties).
Technological Maturity Index (TMI) takes into account all the PAs related to the
support of information systems, ICT tools, diagnostic/prognostic tools,
maintenance engineering tools: the main concern is to assess how tools/devices
are being adopted in the company’s practices.
Related questions were defined for each PA in a survey questionnaire. For every
question, its related scores are defined according to the maturity scorecard, and thus
interviewing the maintenance manager of a firm it is possible to calculate all the
maturity indexes. The GMI is obtained multiplying the three indexes (GMI = MMI x
OMI x TMI).
In Table 3.1 is shown the scorecard defining the scale of the maturity levels

Maturity Assessment Methodology 65
Maturity assessment for Physical Asset Management: Evidence from Manufacturing Plants and Infrastructures
Maturity Level Description
ML 5
Optimizing
Process is managed by ensuring the continuous improvement;
causes of defects and problems in the processes are identified,
taking actions in order to prevent problems from occurring in the
future
ML 4
Quantitatively
Managed
Process performances is measured, and causes of special
variations are detected; quantitative analyses are conducted,
indeed a good balance is reached between the quantitative and
qualitative analysis; process management is fulfilled thanks to
organizational responsibilities and fully functional technical
systems
ML 3
Defined
The processes is planned; semi-quantitative analyses are done
periodically to define good practices/management procedures;
process management depends on some specific constraints for
the for the organizational responsibility or the technical systems
ML 2
Managed
The process is partially planned; performance analysis is mostly
dependent on individual practioners’ experience and
competences; process management is weak because of
deficiencies in the organizational or in the technical systems
ML 1
Initial The process is weakly controlled, or not controlled at all
Table 3.1 Maturity Levels in TeSeM model
From the questionnaire and the scores assigned to the answers included in the
questionnaire, a matrix (Table 3.12) can be defined in which the maturity levels are
decomposed in each component index. This matrix does not change the substance of
the original TeSeM Model but it represents a useful presentation for a synthetic
perception of the method and it helps the comparison with the TUDelft Infrastructure
Maturity Model, which will be described in section 3.4.
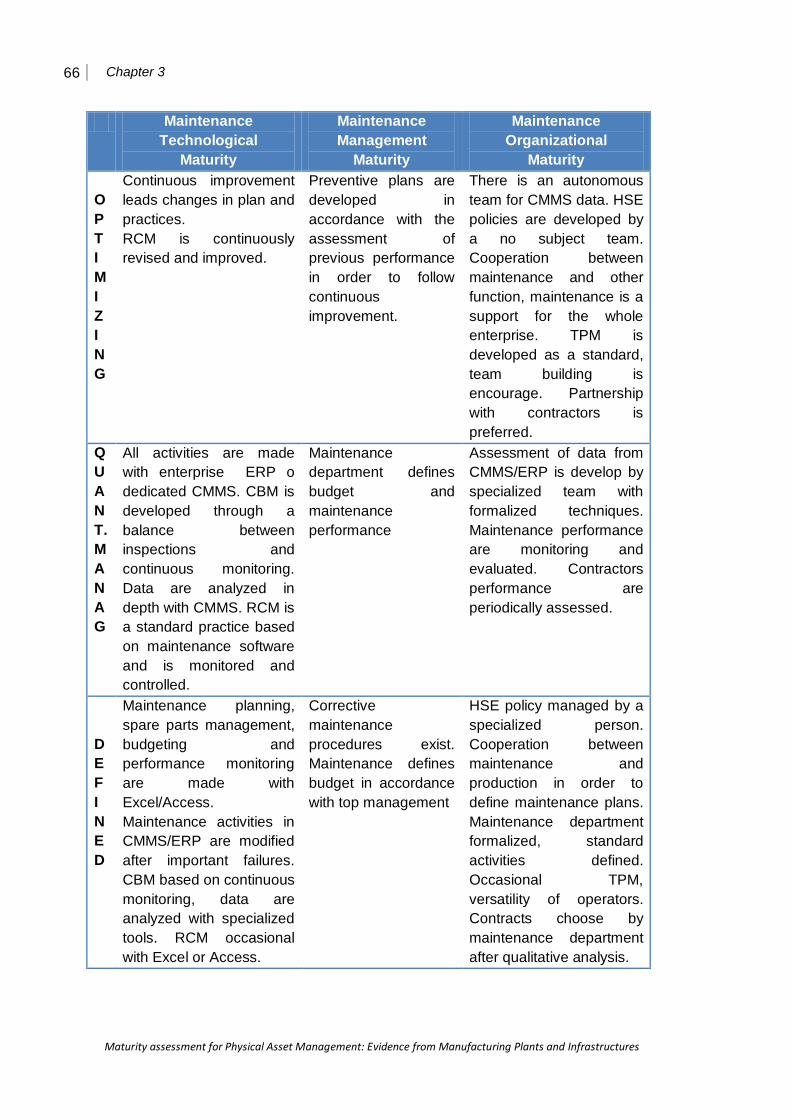
66 Chapter 3
Maturity assessment for Physical Asset Management: Evidence from Manufacturing Plants and Infrastructures
Maintenance Technological
Maturity
Maintenance Management
Maturity
Maintenance Organizational
Maturity OPT I M I Z I NG
Continuous improvement leads changes in plan and practices. RCM is continuously revised and improved.
Preventive plans are developed in accordance with the assessment of previous performance in order to follow continuous improvement.
There is an autonomous team for CMMS data. HSE policies are developed by a no subject team. Cooperation between maintenance and other function, maintenance is a support for the whole enterprise. TPM is developed as a standard, team building is encourage. Partnership with contractors is preferred.
QUANT. MANAG
All activities are made with enterprise ERP o dedicated CMMS. CBM is developed through a balance between inspections and continuous monitoring. Data are analyzed in depth with CMMS. RCM is a standard practice based on maintenance software and is monitored and controlled.
Maintenance department defines budget and maintenance performance
Assessment of data from CMMS/ERP is develop by specialized team with formalized techniques. Maintenance performance are monitoring and evaluated. Contractors performance are periodically assessed.
DEF I N E D
Maintenance planning, spare parts management, budgeting and performance monitoring are made with Excel/Access. Maintenance activities in CMMS/ERP are modified after important failures. CBM based on continuous monitoring, data are analyzed with specialized tools. RCM occasional with Excel or Access.
Corrective maintenance procedures exist. Maintenance defines budget in accordance with top management
HSE policy managed by a specialized person. Cooperation between maintenance and production in order to define maintenance plans. Maintenance department formalized, standard activities defined. Occasional TPM, versatility of operators. Contracts choose by maintenance department after qualitative analysis.

Maturity Assessment Methodology 67
Maturity assessment for Physical Asset Management: Evidence from Manufacturing Plants and Infrastructures
Maintenance Technological
Maturity
Maintenance Management
Maturity
Maintenance Organizational
Maturity M AN A G E
Support tools on paper with regard maintenance planning, spare parts management, budgeting, performance monitoring. Maintenance activities loaded on CMMS/ERP only after installation. CBM based on continuous monitoring but there is no database in which register the result of monitoring, no RCM
Corrective maintenance is based on operators experience. Budgeting is not an activity of maintenance department
Assessment of data(maintenance, failure, equipment condition) made by analyst/team without a structured approach, HSE policy are a second activity of Maintenance manager. Maintenance and production interact only for corrective maintenance activities. Occasional TPM not implemented yet, outsourcing managed by maintenance manager
I N I T I A L
No supports used with regard maintenance planning, spare parts management, budgeting, performance monitoring. No modifications on maintenance plan, no RCM, CBM based only on periodic inspection
No managerial practices are developed
No analyst/team specialized in assess data, analysis only occasional, no one manage HSE policy, no empowerment practices. Relationship between maintenance and production not structured. Outsourcing activities not formalized.
Table 3.2 Reworking of Maturity Levels in TeSeM model
The table below shows how the questionnaire investigated the maintenance maturity,
in terms of number of questions included for each PAs. All the questions are based
on a set of closed answers: the respondent should select the answer describing the
practice to which his / her own firm feels closer.
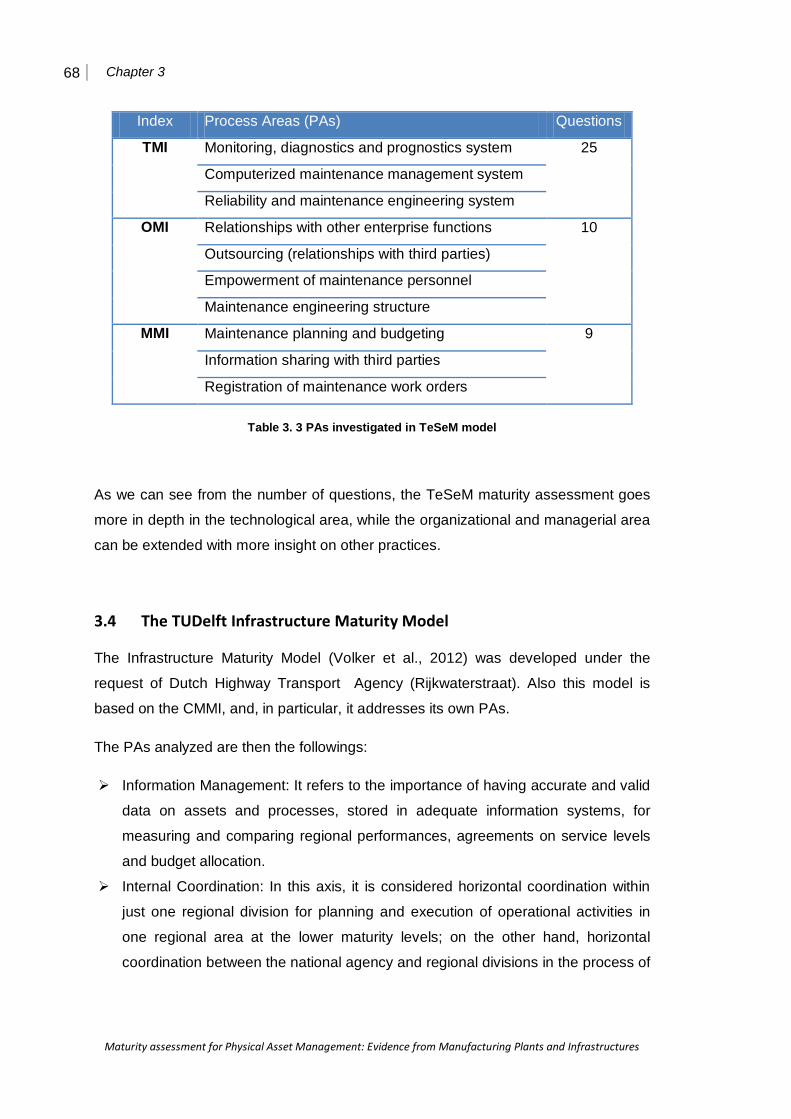
68 Chapter 3
Maturity assessment for Physical Asset Management: Evidence from Manufacturing Plants and Infrastructures
Index Process Areas (PAs) Questions
TMI Monitoring, diagnostics and prognostics system 25
Computerized maintenance management system
Reliability and maintenance engineering system
OMI Relationships with other enterprise functions 10
Outsourcing (relationships with third parties)
Empowerment of maintenance personnel
Maintenance engineering structure
MMI Maintenance planning and budgeting 9
Information sharing with third parties
Registration of maintenance work orders
Table 3. 3 PAs investigated in TeSeM model
As we can see from the number of questions, the TeSeM maturity assessment goes
more in depth in the technological area, while the organizational and managerial area
can be extended with more insight on other practices.
3.4 The TUDelft Infrastructure Maturity Model
The Infrastructure Maturity Model (Volker et al., 2012) was developed under the
request of Dutch Highway Transport Agency (Rijkwaterstraat). Also this model is
based on the CMMI, and, in particular, it addresses its own PAs.
The PAs analyzed are then the followings:
Information Management: It refers to the importance of having accurate and valid
data on assets and processes, stored in adequate information systems, for
measuring and comparing regional performances, agreements on service levels
and budget allocation.
Internal Coordination: In this axis, it is considered horizontal coordination within
just one regional division for planning and execution of operational activities in
one regional area at the lower maturity levels; on the other hand, horizontal
coordination between the national agency and regional divisions in the process of
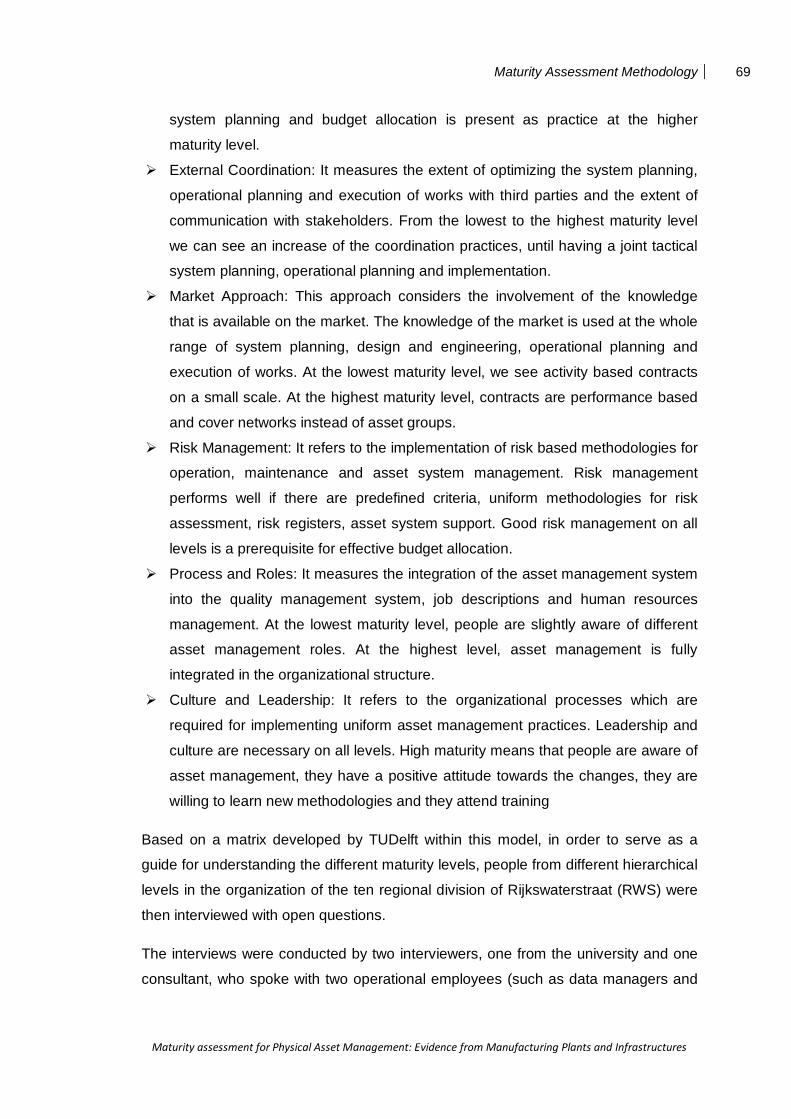
Maturity Assessment Methodology 69
Maturity assessment for Physical Asset Management: Evidence from Manufacturing Plants and Infrastructures
system planning and budget allocation is present as practice at the higher
maturity level.
External Coordination: It measures the extent of optimizing the system planning,
operational planning and execution of works with third parties and the extent of
communication with stakeholders. From the lowest to the highest maturity level
we can see an increase of the coordination practices, until having a joint tactical
system planning, operational planning and implementation.
Market Approach: This approach considers the involvement of the knowledge
that is available on the market. The knowledge of the market is used at the whole
range of system planning, design and engineering, operational planning and
execution of works. At the lowest maturity level, we see activity based contracts
on a small scale. At the highest maturity level, contracts are performance based
and cover networks instead of asset groups.
Risk Management: It refers to the implementation of risk based methodologies for
operation, maintenance and asset system management. Risk management
performs well if there are predefined criteria, uniform methodologies for risk
assessment, risk registers, asset system support. Good risk management on all
levels is a prerequisite for effective budget allocation.
Process and Roles: It measures the integration of the asset management system
into the quality management system, job descriptions and human resources
management. At the lowest maturity level, people are slightly aware of different
asset management roles. At the highest level, asset management is fully
integrated in the organizational structure.
Culture and Leadership: It refers to the organizational processes which are
required for implementing uniform asset management practices. Leadership and
culture are necessary on all levels. High maturity means that people are aware of
asset management, they have a positive attitude towards the changes, they are
willing to learn new methodologies and they attend training
Based on a matrix developed by TUDelft within this model, in order to serve as a
guide for understanding the different maturity levels, people from different hierarchical
levels in the organization of the ten regional division of Rijkswaterstraat (RWS) were
then interviewed with open questions.
The interviews were conducted by two interviewers, one from the university and one
consultant, who spoke with two operational employees (such as data managers and
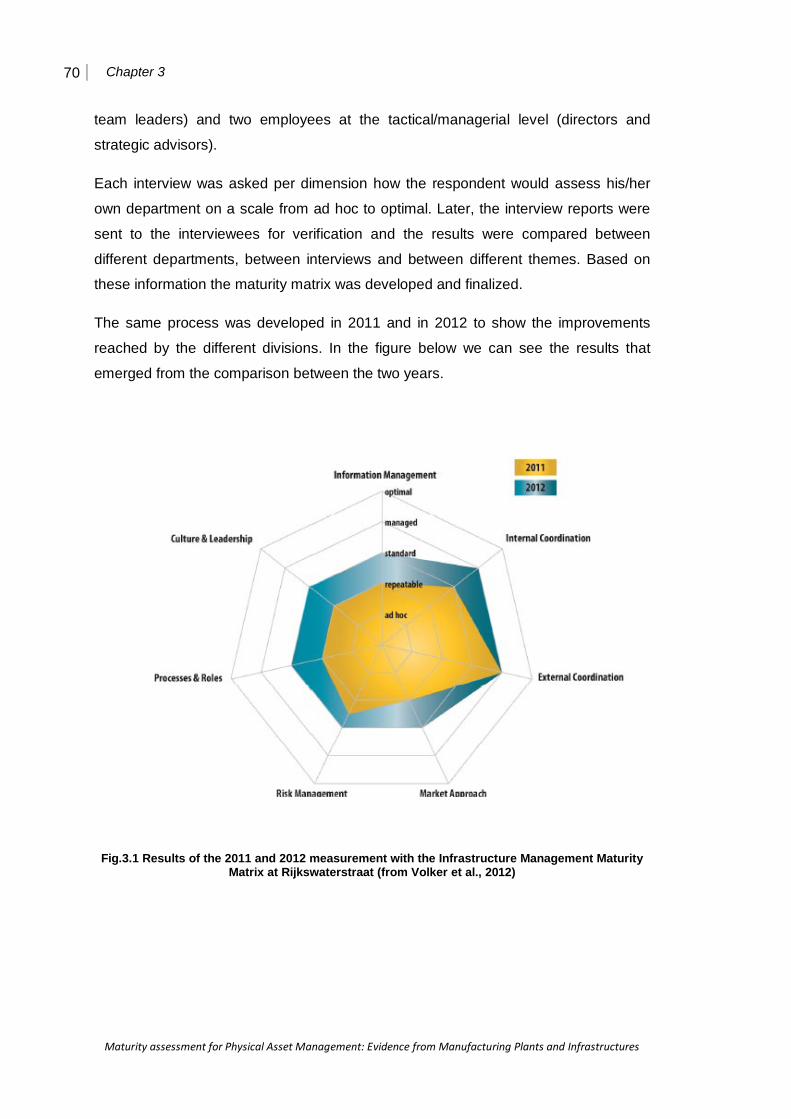
70 Chapter 3
Maturity assessment for Physical Asset Management: Evidence from Manufacturing Plants and Infrastructures
team leaders) and two employees at the tactical/managerial level (directors and
strategic advisors).
Each interview was asked per dimension how the respondent would assess his/her
own department on a scale from ad hoc to optimal. Later, the interview reports were
sent to the interviewees for verification and the results were compared between
different departments, between interviews and between different themes. Based on
these information the maturity matrix was developed and finalized.
The same process was developed in 2011 and in 2012 to show the improvements
reached by the different divisions. In the figure below we can see the results that
emerged from the comparison between the two years.
Fig.3.1 Results of the 2011 and 2012 measurement with the Infrastructure Management Maturity Matrix at Rijkswaterstraat (from Volker et al., 2012)
Maturity Assessment Methodology 71
Maturity assessment for Physical Asset Management: Evidence from Manufacturing Plants and Infrastructures
3.5 Considerations about the two models
The TeSeM maturity assessment model – and its questionnaire – were developed
based on a number of characteristics, synthesized in the remainder.
As an “a priori” model. This means that, for each answer in the questionnaire,
it must be clear how to evaluate it in an unquestionable way, defining “a priori”
a series of maturity levels. In this way, there will be no difference if maturity
level is assigned by different interviewers/ evaluators.
For a survey-like assessment: In order to define a rigorous measurement
schema to be deployed in a survey, it was deemed necessary to evaluate
maturity levels on the base of closed-answer questions. This introduces the
other advantage of efficient data collection: the questionnaire is easier and
quicker to fill in, and can be even used in phone interviews, or by less skilled
people.
For a dynamic assessment. The TeSeM research aims at focusing on the
maintenance evolution. This means that, rather than providing a threshold to
assign either a “good or bad” assessment, maturity levels must be defined in
order to understand which could be the possible further improvements to a
maintenance system.
For flexible adoption. Since the TeSeM research aims at describing the state
of the art of maintenance in different industrial sectors, the model is designed
in order to be as much adaptable as possible at different needs and situations.
This is eventually leading to offering generic descriptions and to assigning
companies a maturity level without entering in implementation details, which
could be different from one sector to another.
The result of the assessment allows to identify both a general maturity index and
three specific indexes, so to evaluate which are the areas that need to be improved
to increase the performance of the whole company. However, we can see that the
assessment go more in depth on the technological aspect and omit important areas of
the managerial and organizational indexes.
On the contrary, TU Delft matrix is specifically designed on Asset Management
maturity, so it pays more attention, as a default, on organizational and managerial
aspects; moreover, the human factors are really linked to the strategy and the

72 Chapter 3
Maturity assessment for Physical Asset Management: Evidence from Manufacturing Plants and Infrastructures
success of the company, and there are specific areas for the internal and external
coordination.
Further on, by using open questions the interviewers may have the opportunity to
make more considerations about the maturity profile of the organizations, modifying
the questions in relation to the answers given by respondents and clarifying possible
doubts during the interview. Moreover, double interviews (both at strategic and
tactical levels) allow to collect considerations about the alignment and perceptions
from different points of view.
In contrast, both data collection and analysis of the answers require more time and
considerations, and it is linked to the experience of the interviewers. The analysis is
particularly influenced by the knowledge of the sector and this was linked, in the
TUDelft experience, to the fact that the matrix was developed only for the Road
Authority. Henceforth, we cannot find the flexible propriety, strength of the TeSeM
questionnaire.
At least, as a result both models provide a maturity score for each index but the
reporting method differs: TUDelft model shows them in a radar charts, as the one
reported in section 3.4, while TeSeM with dashboards (Fig.3.2).
Fig.3.2 Example of dashboards in TeSeM model in which the red line represents the average maturity of the sector while the black line the maturity of the company (from report developed for
individual company)
As we can see from the Fig.3.2, TeSeM model provides a numerical result also for
the general maturity of the company through the dashboard of the GMI while looking
the radar charts we can only have a graphical idea of the general maturity of the
organization.

Maturity Assessment Methodology 73
Maturity assessment for Physical Asset Management: Evidence from Manufacturing Plants and Infrastructures
3.6 The Port et al. Maintenance Maturity Model
In technical and scientific literature we can find several maturity models about
maintenance and asset management. We report Port et al. (2010) model for its
holistic and integrated view.
According to these authors, the degree to which a company achieves maintenance
excellence indicates its level of maturity. In particular, a maturity profile is a matrix
that describes the organization’s characteristic performance in each of the relevant
elements for maintenance excellence: Fig.3. 3 presents an example of a profile that
covers the spectrum of elements needed for maintenance excellence.
More specifically, for each element, the authors developed a matrix that describes
organization characteristics.
In the “leadership and people” element, an organization moves from reactive
to proactive, and depends more heavily on its employees and shifts from a
directed to a more autonomous workforce.
The element of “Methods and processes” is about how firm manages
maintenance. It includes the activities that people in the organization actually
do. As processes become more effective, people become more productive.
Poor methods and processes produce much of the waste effort typical of low-
performing maintenance organizations.
The element of “Systems and technology” represents the tools used by the
people implementing the processes and methods organization choose. These
are the enablers, and they get most of the attention in maintenance
management. Generally, emphasizing technology without excellence in
managing methods, processes and people will bring only limited success.
The element of “materials and physical plant” expresses how well firm
manages processes, methods and people. The management of all these
aspects reflects on the reliability of the asset, on spare parts management but
also on long term plans.
Concluding, it can be asserted that the Port et al. maturity model brings the following
interesting contributions:
1. it proposes other indexes that can be considered in a maturity assessment;
2. it identifies, for each index, PAs and relative practices that can be linked to
maturity levels.
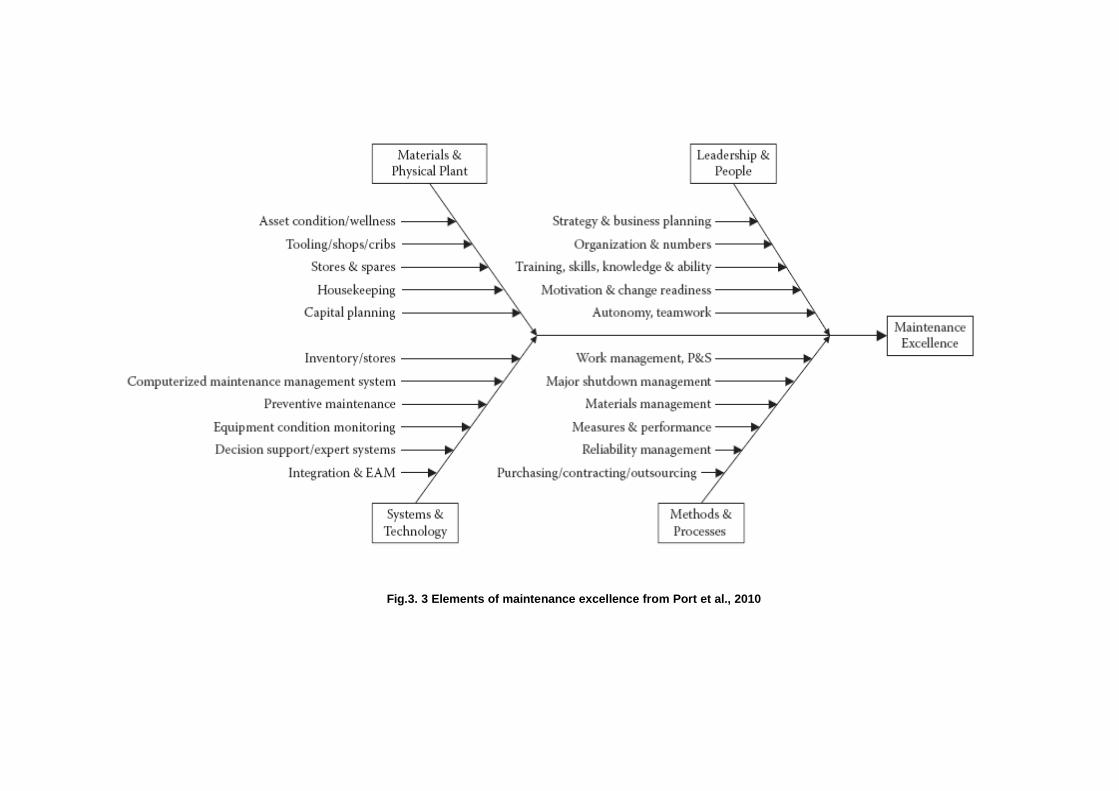
Fig.3. 3 Elements of maintenance excellence from Port et al., 2010

Maturity Assessment Methodology 75
Maturity assessment for Physical Asset Management: Evidence from Manufacturing Plants and Infrastructures
3.7 Concluding remarks
The Maturity Assessment model, proposed in this work (as presented in next chapter
4), will integrate the main lessons learnt (and advantages) of the TeSeM and TUDelft
model, including additional concerns as provided by the Port’s model. This is the main
outcome for what regards the methodological perspective.
For its development, the maturity assessment model will then require to be as flexible
as possible in order to include practices of PAM, independently from the sectors of
application. This is the main wish and intention inspiring the whole thesis work. The
following actions should be justified in this direction, both for the model development
– more generic than the TUDelft original one, more complete than the TeSeM original
one –, and for the model use – in order to assess maturity in companies of different
sectors, ranging from infrastructure to manufacturing –.

77
Maturity assessment for Physical Asset Management: Evidence from Manufacturing Plants and Infrastructures
Chapter 4. The model for maturity assessment
In the model, proposed by this thesis work, the strengths of the two models presented
in the previous Chapter 3 are combined.
The prime purpose of the research is to develop a flexible model that can be applied
both in the manufacturing and infrastructure sectors. The development of the model
will pass through the definition of a new maturity matrix (see Section 4.1), from which
a new questionnaire with closed questions will be derived as well (Section 4.2).
We chose the closed questions methodology for the a priori characteristic that
allows different advantages: (i) to force a respondent to answer in a standard way
(otherwise we might have different answers, possibly related to the sector of the
company), (ii) to simplify the analysis of the answers in a general model; (iii) to enable
cross comparison between the cases under analysis.
The questionnaire should be filled in by the asset manager of the organization, or a
close equivalent if this position is not present.
Even if we choose a specific respondent, the asset manager, we must not forget that
asset management is also about process. Instead of a hierarchical organization
where decisions and budgets follow the chain of command into functional silos,
physical asset management is a single process that links asset owners, asset
managers, and asset service providers in a manner that allows all spending decisions
to be aligned with corporate objectives supported by asset data (Brown and
Humphrey, 2005). Henceforth, in the development of the maturity model we must not
only consider the asset plan aspects, typical of asset manager organizational duties,
but also the links with the other figures, such as information flow and culture aspects,
performance assessment, life cycle and risk based management. Ideas to this regard,
in order to develop the model – i.e. on typical PAM practices –, can be generated and
sourced from literature accordingly to the review already provided in the previous
Chapter 2.

78 Chapter 4
Maturity assessment for Physical Asset Management: Evidence from Manufacturing Plants and Infrastructures
4.1 The Maturity Matrix
In accordance to what already discussed and learnt in Chapter 3, the first step
regards the choice of how to develop the maturity matrix, indexes and process areas
of each index.
As said before, the three indexes used in the TeSeM model fit well with the analysis
of a maintenance service but they omit important aspects that have to be considered
in the extended field of PAM Assessment. On the contrary, the seven indexes
identified in the TUDelft matrix are too linked to the field of application of the model:
for example, the internal coordination – within this matrix – regards the divisional
structure of the Road Authority and hence the need to structure a shared way to
communicate between different departments.
Another consideration concerns the number of indexes, which become the columns of
the matrix, and their relationship with Process Areas (PAs) for which PAM practices
are investigated. We select the closed questions assessment, so for each PA we
have to find a set of questions that can explain the maturity of that PA, in relation to
different levels of PAM practices (basic, good, best … practices). Each PA is then
associated to an index. This leads to the need to solve a tradeoff between the depth
of the analysis and the number of questions included in the questionnaire for maturity
assessment. With a high number of columns in the matrix/indexes, the assessment
can cover more aspects/PAs of PAM, but we need to have a lot of questions: this
might discourage the respondents. On the contrary, we have to find enough
columns/indexes through which we can do an exhaustive work of analysis through
relevant PAs.
We identify four important maturity indexes/columns of the matrix, used to calculate
the maturity in different Process Areas.
Management Decisions. It refers to the main decisions that the asset
manager has to consider in managing the asset management of the firm,
taking into account the asset life cycle management, risk management and
maintenance management.
Information Management. It refers to the aspects of information
management related to ICT tools/systems, monitoring and prognostics
methods, registration of data and performance management.
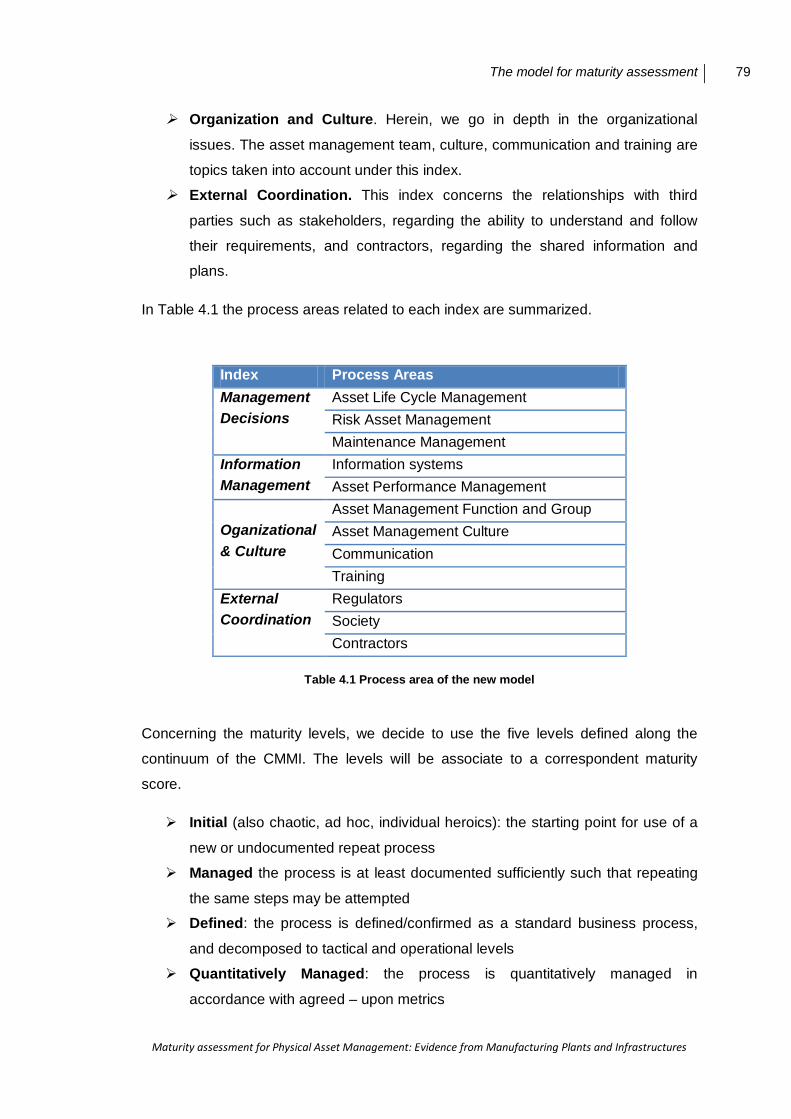
The model for maturity assessment 79
Maturity assessment for Physical Asset Management: Evidence from Manufacturing Plants and Infrastructures
Organization and Culture. Herein, we go in depth in the organizational
issues. The asset management team, culture, communication and training are
topics taken into account under this index.
External Coordination. This index concerns the relationships with third
parties such as stakeholders, regarding the ability to understand and follow
their requirements, and contractors, regarding the shared information and
plans.
In Table 4.1 the process areas related to each index are summarized.
Index Process Areas Management Decisions
Asset Life Cycle Management Risk Asset Management Maintenance Management
Information Management
Information systems Asset Performance Management
Oganizational & Culture
Asset Management Function and Group Asset Management Culture Communication Training
External Coordination
Regulators Society Contractors
Table 4.1 Process area of the new model
Concerning the maturity levels, we decide to use the five levels defined along the
continuum of the CMMI. The levels will be associate to a correspondent maturity
score.
Initial (also chaotic, ad hoc, individual heroics): the starting point for use of a
new or undocumented repeat process
Managed the process is at least documented sufficiently such that repeating
the same steps may be attempted
Defined: the process is defined/confirmed as a standard business process,
and decomposed to tactical and operational levels
Quantitatively Managed: the process is quantitatively managed in
accordance with agreed – upon metrics
80 Chapter 4
Maturity assessment for Physical Asset Management: Evidence from Manufacturing Plants and Infrastructures
Optimizing: process management includes deliberate process optimization
and improvement.
4.2 The questionnaire
Here after we present how we decide to develop the questionnaire, explaining the
choice of the questions and the calculation of the indexes. In particular, the evaluation
of the answers has assigned a maturity score: this is related to the definition given in
the matrix and related maturity levels (i.e. hence it may be, in case of maximum range
completely used, from 1 to 5).
The questionnaire is divided in five parts (A – E). The first one is an introduction to the
survey, the others one are linked to the columns/indexes of the matrix.
A) General information
Here we ask to the asset manger to give some information about the company, such
as place of assets, sector, and concept of PAM.
B) Management Decisions Index (MDI)
In this column of our matrix, we consider three aspects/PAs of PAM:
Asset life cycle cost management
Asset risk management
Asset maintenance management
For each of them, we calculate a maturity score, starting from the score achieved in
each answer. The maturity of the Management Decisions Index will be the average of
the three scores.
B.I) Asset life cycle cost management
The main objective of the LCC analysis is to quantify the total cost of ownership of a
product/asset throughout its full life cycle, which includes research and development,
construction, operation and maintenance, and disposal. The predicted LCC is a useful
information for decision making in purchasing a product, in optimizing design, in
scheduling maintenance, or in planning revamping (Kawauchi and Rausand, 1999).

The model for maturity assessment 81
Maturity assessment for Physical Asset Management: Evidence from Manufacturing Plants and Infrastructures
The results of costs analysis in asset management decision making can be used for
different purposes. The first question wants to inquire these uses (in the remainder,
the questions are put in evidence by formatting in italics).
B.I.1) The result of costs analysis in asset management decision making, in your
organization, are used for:
□ Acquisition and development of projects
□ Support process system design.
□ Identify better investment options (investment, repair,..)
□ Identify redundancy – equipment and systems.
□ Plan Maintenance programs.
As we said in the literature review, a complete life cycle cost analysis has to consider
operation costs (OPEX) and capital costs (CAPEX). The following question wants to
investigate the completeness of costs analysis.
B.I.2) Which types of assets’ costs does your organization consider to support
decision making for PAM?
When assets are acquired from suppliers
□ Purchase price
□ Installation costs
□ Operational costs
□ Disposal Costs
□ Others:__________________
When assets are designed by internal functions of the organization
□ R&D
□ Design Costs
□ Installation Costs
□ Operational Costs
□ Disposal Costs
□ Others:___________________
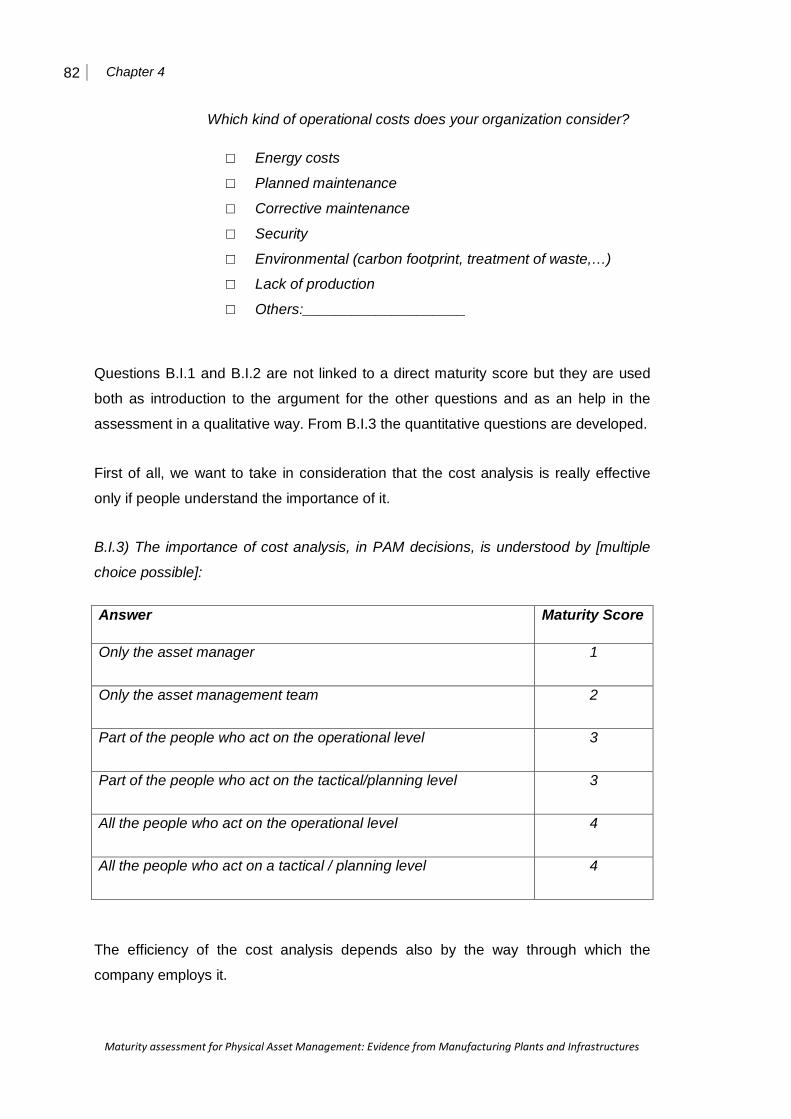
82 Chapter 4
Maturity assessment for Physical Asset Management: Evidence from Manufacturing Plants and Infrastructures
Which kind of operational costs does your organization consider?
□ Energy costs
□ Planned maintenance
□ Corrective maintenance
□ Security
□ Environmental (carbon footprint, treatment of waste,…)
□ Lack of production
□ Others:____________________
Questions B.I.1 and B.I.2 are not linked to a direct maturity score but they are used
both as introduction to the argument for the other questions and as an help in the
assessment in a qualitative way. From B.I.3 the quantitative questions are developed.
First of all, we want to take in consideration that the cost analysis is really effective
only if people understand the importance of it.
B.I.3) The importance of cost analysis, in PAM decisions, is understood by [multiple
choice possible]:
Answer Maturity Score
Only the asset manager
1
Only the asset management team
2
Part of the people who act on the operational level
3
Part of the people who act on the tactical/planning level
3
All the people who act on the operational level
4
All the people who act on a tactical / planning level
4
The efficiency of the cost analysis depends also by the way through which the
company employs it.

The model for maturity assessment 83
Maturity assessment for Physical Asset Management: Evidence from Manufacturing Plants and Infrastructures
B.I.4) Is cost analysis, relating to PAM decisions, structured in your organization?
Answer Maturity score
No
1
Yes, only occasionally, just a cost analysis without making a LCC analysis
2
Yes, only occasionally, making LCC analysis for some PAM decision makings
3
Yes, a structured methodology for LCC analysis exists, which is regularly applied for the most important PAM decision makings
4
Other:_________________________
To use a LCC analysis as support for decision-making, we must consider not only
cost but also data related to effectiveness. The effectiveness may comprise many
system characteristics, like production capacity, product quality etc., and also system
performance characteristics, like system availability, the safety integrity level of
shutdown systems, etc. Regulations, codes and standards, and project specifications
may specify the system effectiveness in many cases.
B.I.5) In your organization, during LCC analysis related to PAM, do you collect data
about:
□ Failures & reliability of asset
□ Capacity of assets
□ Quality of the process (product or service delivered)
□ Safety
□ Environmental impact
□ Other:__________________
All the information needs to be integrated in order to manage them in an effective way
in the information system.

84 Chapter 4
Maturity assessment for Physical Asset Management: Evidence from Manufacturing Plants and Infrastructures
B.I.6) Are these data from question B.I.5 managed within an integrated information
system?
Answers Maturity Score
No, the information system providing the data is not integrated; data / information are quite dispersed, manual integration is strongly needed
1
Yes, the information system providing the data is partly integrated; data / information are dispersed, manual integration is present but the effort is reduced
2
Yes, an integrated information system, providing data / information as a platform, is already present; people work more at the level of decision making (i.e. transforming data / information available to knowledge enabling decisions).
4
During life cycle costs analysis a lot of information is required. Data need to be
updated and without uncertainty. To this end, it is important that organizations clarify
who has the organizational duty to fill the data in the information systems.
B.I.7) Who has the organizational duty to fill the data / information, relating to PAM
decision making, in the information system?
Answers Maturity Score
Only the asset manager
1
There are dedicated persons (indicate the functional area of the operators, more than one functional area is applicable: _________________________________________)
2
The asset management team
3
All the operators can fill the databases (indicate the functional area of the operators, more than one functional area is applicable:_________________________________________)
4
All the operators can fill the databases (indicate the functional area of the operators, more than one functional area is applicable:_________________________________________) and it is checked for consistency.
5

The model for maturity assessment 85
Maturity assessment for Physical Asset Management: Evidence from Manufacturing Plants and Infrastructures
In assigning the scores for the previous question we assume that if more people can
fill and update data, the information flow should be faster and more effective.
Someone can argue that if more people can access to databases the probability of
mistakes increases. For this reason the best solution includes also a check for the
consistency.
Another important aspect regarding LCC is the uncertainty that we have around data.
In fact, almost all of them come from estimates and in order to have an effective LCC
analysis is fundamental that these estimates are accurate and constantly updated.
B.I.8) Where do estimates, used in PAM cost analysis, come from? [Multiple choice]
Answers Maturity Score
Experience of managers/operators/project team
1
Suppliers 2
Analysis of historical data based on the simple average of data.
2
Analysis of historical data based on more sophisticated tools/based on previous projects
3
Parametric techniques based on statistical- distribution analysis of historic databases.
4
Quantitative models developed in order to take into account the random/stochastic nature of events and relying on the use of specialized statistical techniques to “simulate” future decisions.
5
B.I.9) Are these estimates periodically updated?
Answers Maturity Score
No
1
After important events (overhaul, incidents, new machine installation)
2
Periodically updated (namely how often:_______________)
3

86 Chapter 4
Maturity assessment for Physical Asset Management: Evidence from Manufacturing Plants and Infrastructures
LCC analysis includes a lot of activities, some of them very often are carried out from
third parties. Hence, sharing information becomes fundamental.
B.I.10) Sharing information with third parties. Contractors: [multiple choice]
Answers Maturity Score
Have to deliver information and there is a person/a team with the organizational duty of update PAM information systems
2
Can access to PAM information systems
3
Can update PAM information systems
4
Can insert1 data in PAM information systems
5
A summarizing table, reporting all the possible answers given in this part of the
questionnaire, is presented in Table 4.2.
Table 4.2 Summarizing table - LCMi
The formula of LCMi (Life Cycle Management index), for a generic i-th firm, is then
expressed as an arithmetical average of all the questions to which a maturity score is
assigned, i.e.:
1 Insert means that contractors can add new types of information, such as new performance indicators, new information about assets.

The model for maturity assessment 87
Maturity assessment for Physical Asset Management: Evidence from Manufacturing Plants and Infrastructures
𝐿𝐶𝑀𝑖 =∑ 𝐵. 𝐼�������
7
Where:
- q is the index of the question
- B.I.iq is the score obtained by the firm i in the question indexed as q.
Observation: As reported, not every question has five possible answers (five maturity
levels). In the next table, it is represented the score that can be reached by a firm that
answers at these questions with the same score and where it is not possible with the
lower one as close as possible.
Table 4.3 Simulation Score – LCMi
B.II) Risk asset management
As we said in the literature review, the purpose of Risk Asset Management is to
understand the cause, the effect and the likelihood of adverse events which may
occur while an organization is managed. Indeed, PAM is often viewed as an
integrated approach to balance costs, performance and risks during all asset life
cycle, hence risk asset management became fundamental.
There are different types of risks to consider in the organization.

88 Chapter 4
Maturity assessment for Physical Asset Management: Evidence from Manufacturing Plants and Infrastructures
B.II.1) What types of risks does your organization consider?
□ Operational risks caused by:
□ Functional failure
□ Incidental damage
□ Human Factors
□ Others:_______________
□ Natural environmental risks (storms, floods,...)
□ Financial risks
□ Stakeholders risks (such as failure to meet regulatory performance
requirements or reputation damage)
□ Suppliers risks
□ Others:____________________________
Risk management analysis can be adopted in order to support different decisions, or
to simply provide communication through the interested parties.
B.II.2) The results of risk management analysis are used to:
□ Provide a common communication tool.
□ Support process system design.
□ Identify redundancy – equipment and systems.
□ Plan Maintenance programs.
□ Identify spare parts requirements.
□ Target maintenance budgets.
□ Identify training requirements.
□ Identify skill based risk.
□ Quantify the maintenance commitment KSF’s, KPI’s.
□ Provide a basis for system modeling.
□ Indentify the better options (investment, repair,…)
□ Other:_____________________
Also in this case, these first questions are not used in the assessment directly but
they are used for qualitative considerations. Instead, next questions have maturity
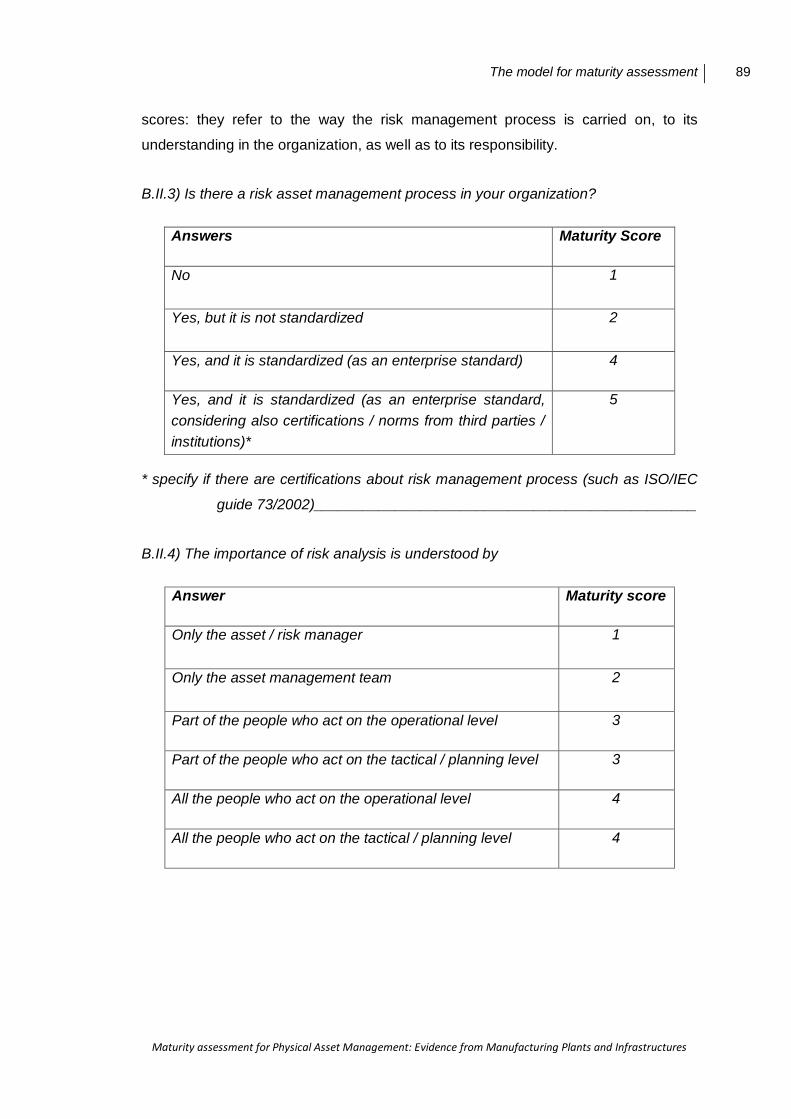
The model for maturity assessment 89
Maturity assessment for Physical Asset Management: Evidence from Manufacturing Plants and Infrastructures
scores: they refer to the way the risk management process is carried on, to its
understanding in the organization, as well as to its responsibility.
B.II.3) Is there a risk asset management process in your organization?
Answers Maturity Score
No
1
Yes, but it is not standardized
2
Yes, and it is standardized (as an enterprise standard) 4
Yes, and it is standardized (as an enterprise standard, considering also certifications / norms from third parties / institutions)*
5
* specify if there are certifications about risk management process (such as ISO/IEC
guide 73/2002)_______________________________________________
B.II.4) The importance of risk analysis is understood by
Answer Maturity score
Only the asset / risk manager
1
Only the asset management team
2
Part of the people who act on the operational level 3
Part of the people who act on the tactical / planning level 3
All the people who act on the operational level 4
All the people who act on the tactical / planning level 4

90 Chapter 4
Maturity assessment for Physical Asset Management: Evidence from Manufacturing Plants and Infrastructures
B.II.5) Who is responsible for Risk analysis?
Answer Maturity score
There is none responsible for it
1
Asset manager
2
Risk manager
3
There is a function responsible for it 4
Regarding the assessment of this question, we have to develop some considerations.
In particular, we assume that it is preferable to have a risk manager than a general
asset manager because it means that there is a dedicated figure for risk asset
management. Moreover if there is a function we can assume that there are dedicated
persons that try to achieve the continuous improvement. In fact as a Risk
Management Standards (AIRMC, 2002) says some of the roles of the Risk
management function are:
designing and reviewing processes for risk management;
coordinating the various functional activities which advise on risk
management issues within the organization;
developing risk response processes, including contingency and
business continuity programs;
preparing reports on risk for the board and the stakeholders;
and all these duties are part continuous improvement concept.
There are a lot of methods that can be used to assess risks, from qualitative to
quantitative approaches. In general quantitative analyses are preferred because they
are considered more objective. However in some cases it is impossible to quantify in
a correct way a risk, so in these situations qualitative analysis can be more useful.

The model for maturity assessment 91
Maturity assessment for Physical Asset Management: Evidence from Manufacturing Plants and Infrastructures
B.II.6) Risk assessment is developed through
Answers Maturity Score
Only qualitative analysis
1
Only quantitative analysis
3
There is a balance between qualitative and quantitative analysis
5
One of the most used output from risk management analysis is the risk matrix. A risk
matrix is a simple graphical tool that combines:
the chance for an occurrence of an event (Probability) (usually an estimate)
the Consequence if the event occurred (usually an estimate)
put the twos together as: Risk = Probability * Consequence
Risk matrix is an important tool to categorized risks, prioritize actions, define the
acceptable level of risk.
B.II.7) Do you have a risk matrix or other similar tool to express, in a visual way, the
risk of different entities under concern?
□ No
□ Yes*
*which tool? ________________________________________________________
Observation: For the evaluation of yes/no questions, such as question B.II.7, we
decide to consider the maturity score only in case of “no” as answer (ML = 1). In other
cases, considering another value can falsify the mean. For example, for a firm with
high maturity, adding 2 as score in the formula of ARMi (Asset Risk Management
index)can considerably decrease the result.
In the LCC section we made some consideration about the need of sharing
information and knowledge and the need of updated data. Same considerations can
be done regarding risk management.
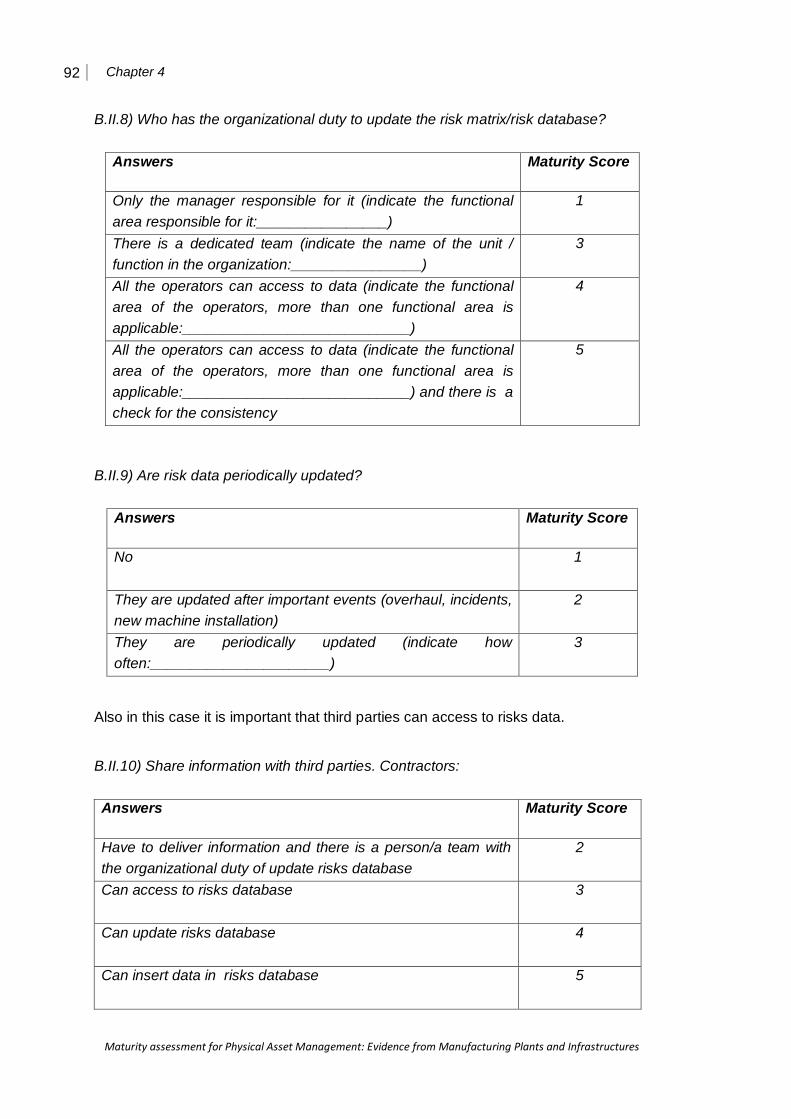
92 Chapter 4
Maturity assessment for Physical Asset Management: Evidence from Manufacturing Plants and Infrastructures
B.II.8) Who has the organizational duty to update the risk matrix/risk database?
Answers Maturity Score
Only the manager responsible for it (indicate the functional area responsible for it:________________)
1
There is a dedicated team (indicate the name of the unit / function in the organization:________________)
3
All the operators can access to data (indicate the functional area of the operators, more than one functional area is applicable:____________________________)
4
All the operators can access to data (indicate the functional area of the operators, more than one functional area is applicable:____________________________) and there is a check for the consistency
5
B.II.9) Are risk data periodically updated?
Answers Maturity Score
No
1
They are updated after important events (overhaul, incidents, new machine installation)
2
They are periodically updated (indicate how often:______________________)
3
Also in this case it is important that third parties can access to risks data.
B.II.10) Share information with third parties. Contractors:
Answers Maturity Score
Have to deliver information and there is a person/a team with the organizational duty of update risks database
2
Can access to risks database
3
Can update risks database
4
Can insert data in risks database
5
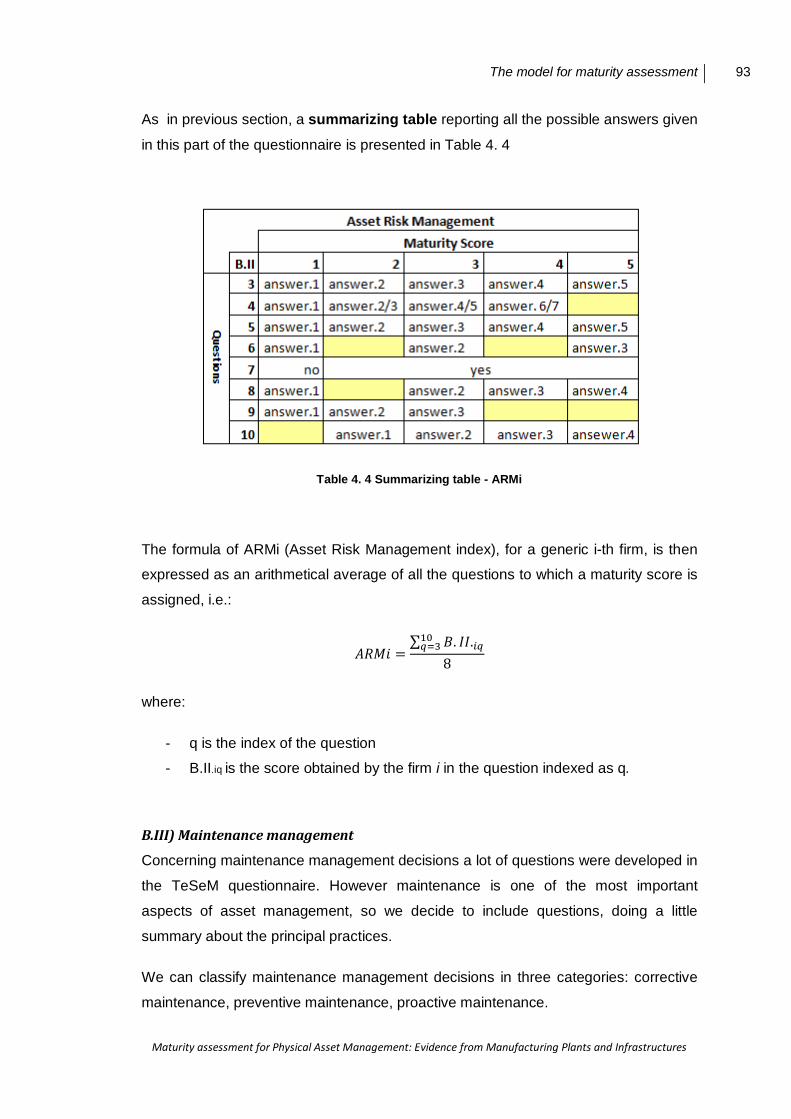
The model for maturity assessment 93
Maturity assessment for Physical Asset Management: Evidence from Manufacturing Plants and Infrastructures
As in previous section, a summarizing table reporting all the possible answers given
in this part of the questionnaire is presented in Table 4. 4
Table 4. 4 Summarizing table - ARMi
The formula of ARMi (Asset Risk Management index), for a generic i-th firm, is then
expressed as an arithmetical average of all the questions to which a maturity score is
assigned, i.e.:
𝐴𝑅𝑀𝑖 =∑ 𝐵. 𝐼𝐼.�������
8
where:
- q is the index of the question
- B.II.iq is the score obtained by the firm i in the question indexed as q.
B.III) Maintenance management
Concerning maintenance management decisions a lot of questions were developed in
the TeSeM questionnaire. However maintenance is one of the most important
aspects of asset management, so we decide to include questions, doing a little
summary about the principal practices.
We can classify maintenance management decisions in three categories: corrective
maintenance, preventive maintenance, proactive maintenance.
94 Chapter 4
Maturity assessment for Physical Asset Management: Evidence from Manufacturing Plants and Infrastructures
Corrective Maintenance: It consists of the actions taken to restore a failed system to
operational status; this usually involves replacing or repairing the component that is
responsible for the failure of the overall system. Corrective maintenance is performed
at unpredictable intervals, with the objective to restore the system to satisfactory
operation within the shortest possible time.
Observation: Corrective maintenance is an activity of the operational level under the
responsibility of the asset service provider. For this reason we decide to omit
questions about this argument. Different are the considerations about preventive and
proactive maintenance that are included in maintenance planning activities and so are
also at the tactical / planning level.
Preventive Maintenance. Unlike corrective maintenance, this is the practice of
replacing components or subsystems before they fail, in order to promote continuous
system operation, reducing failure or degradation probability. In this way, in fact,
downtimes are briefer and production losses are fewer. This can be done:
1) At fixed time or utilization intervals, without considering the equipment
condition (Cyclic preventive maintenance);
2) Monitoring the condition of the equipment, defining if it has to be
maintained or not (Condition-Based Maintenance).
3) Predicting, thanks to mathematical models of the evolution of equipment
behavior, its Remaining Useful Life (RUL) and planning the maintenance
actions according to the expected moment in which it should fail
(Predictive maintenance).
To choose between different options of preventive maintenance (or, at least, to
decide that corrective is better), designing the maintenance plan is needed.
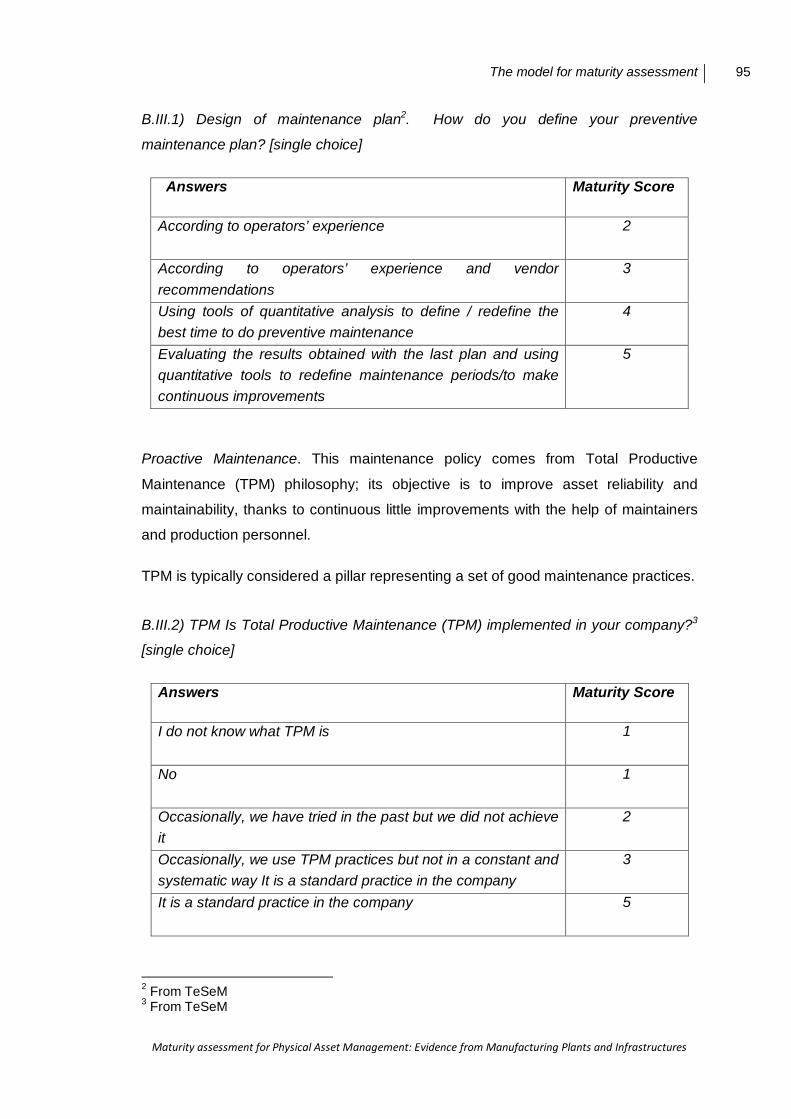
The model for maturity assessment 95
Maturity assessment for Physical Asset Management: Evidence from Manufacturing Plants and Infrastructures
B.III.1) Design of maintenance plan2. How do you define your preventive
maintenance plan? [single choice]
Answers Maturity Score
According to operators’ experience
2
According to operators’ experience and vendor recommendations
3
Using tools of quantitative analysis to define / redefine the best time to do preventive maintenance
4
Evaluating the results obtained with the last plan and using quantitative tools to redefine maintenance periods/to make continuous improvements
5
Proactive Maintenance. This maintenance policy comes from Total Productive
Maintenance (TPM) philosophy; its objective is to improve asset reliability and
maintainability, thanks to continuous little improvements with the help of maintainers
and production personnel.
TPM is typically considered a pillar representing a set of good maintenance practices.
B.III.2) TPM Is Total Productive Maintenance (TPM) implemented in your company?3
[single choice]
Answers Maturity Score
I do not know what TPM is
1
No
1
Occasionally, we have tried in the past but we did not achieve it
2
Occasionally, we use TPM practices but not in a constant and systematic way It is a standard practice in the company
3
It is a standard practice in the company
5
2 From TeSeM 3 From TeSeM

96 Chapter 4
Maturity assessment for Physical Asset Management: Evidence from Manufacturing Plants and Infrastructures
Another important approach/pillar to maximize maintenance performances is
Reliability Center Maintenance (RCM). RCM is a logical, structured framework for
determining the optimum mix of applicable and effective maintenance activities
needed to sustain the operational reliability of systems and equipment while ensuring
their safe and economical operation and support (Criscimagna, 2002).
B.III.3) RCM. Do you perform Reliability Centered Maintenance (RCM) in your
company? [single choice]4
Answers Maturity Score
I do not know what RCM is
1
No
1
Yes, but only in some department
3
Yes, in the whole organization
5
B.III.3.1) If yes, how does RCM is performed?
Answers Maturity Score
Occasionally, recording results on (ex. Microsoft Excel)
3
Occasionally, recording results on an electronic database
3
It is a standard practice based on software tools for maintenance engineering
4
RCM processes are performed, monitored and controlled (the quality of the process is verified)
4
RCM processes are constantly improved according to the feedback coming from the process quality measurements
5
4 Adapted from TeSeM
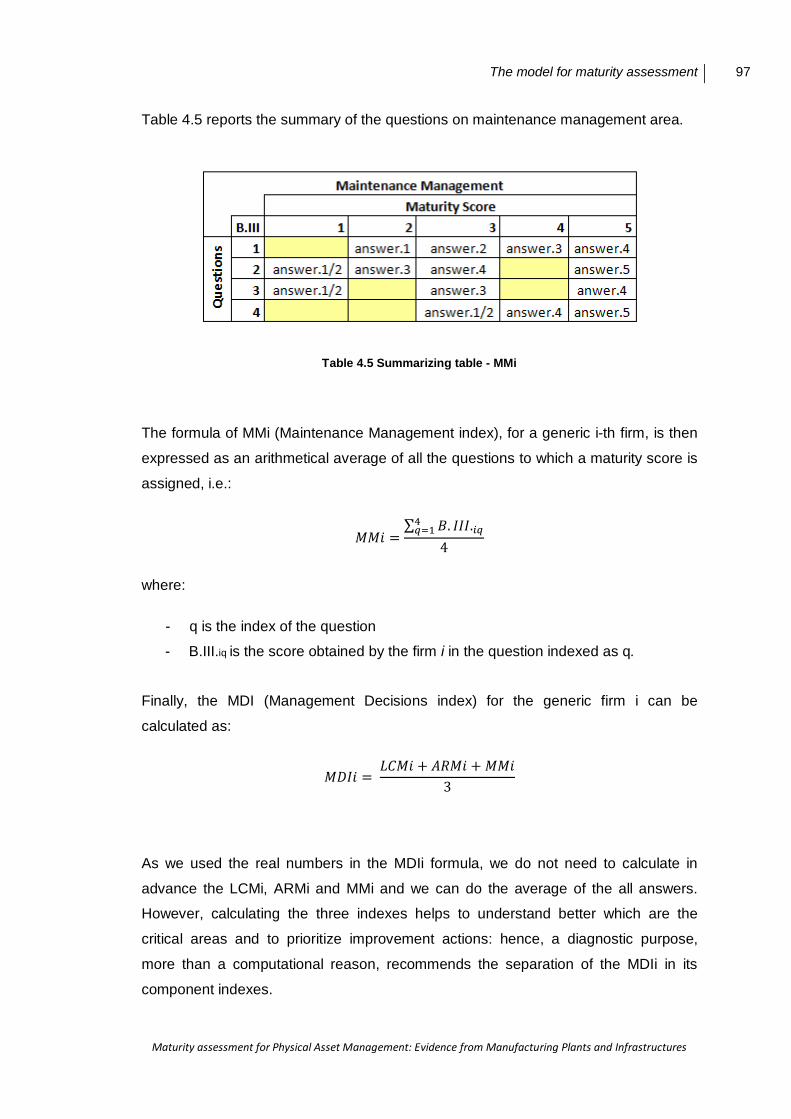
The model for maturity assessment 97
Maturity assessment for Physical Asset Management: Evidence from Manufacturing Plants and Infrastructures
Table 4.5 reports the summary of the questions on maintenance management area.
Table 4.5 Summarizing table - MMi
The formula of MMi (Maintenance Management index), for a generic i-th firm, is then
expressed as an arithmetical average of all the questions to which a maturity score is
assigned, i.e.:
𝑀𝑀𝑖 =∑ 𝐵. 𝐼𝐼𝐼.������
4
where:
- q is the index of the question
- B.III.iq is the score obtained by the firm i in the question indexed as q.
Finally, the MDI (Management Decisions index) for the generic firm i can be
calculated as:
𝑀𝐷𝐼𝑖 = 𝐿𝐶𝑀𝑖 + 𝐴𝑅𝑀𝑖 + 𝑀𝑀𝑖
3
As we used the real numbers in the MDIi formula, we do not need to calculate in
advance the LCMi, ARMi and MMi and we can do the average of the all answers.
However, calculating the three indexes helps to understand better which are the
critical areas and to prioritize improvement actions: hence, a diagnostic purpose,
more than a computational reason, recommends the separation of the MDIi in its
component indexes.

98 Chapter 4
Maturity assessment for Physical Asset Management: Evidence from Manufacturing Plants and Infrastructures
Consideration about the Management Decisions Index
This index, and the correspondent column of our maturity matrix, is probably the most
important one, because it includes a lot of aspects that can be linked to other
columns. For example:
the need of integrated and update database for LCC and risk management
can be linked to the information flow column;
the need to share information with contractors includes aspects of external
coordination column;
the need to share knowledge between operators includes aspects related to
the organizational & culture column.
For these reasons we can expect that organization cannot reach a high global
maturity score without having a high decision process score. On the other side, a
company cannot have a high decision process score without having high score in the
other indexes, because it depends from information, knowledge and relationships with
third parties. Hence, it is clear also from this consideration the holistic character of
PAM.
C) Information Management Index (IMI)
In this section we explain how the maturity index is calculated for what concern
managing information and performance assessment.
In the TeSeM model there are a lot of questions about this layer, most of them are
specific to the maintenance issues. In this part we have tried to adapt the existent
questionnaire to Asset Management.
Information system can be then interpreted as doing the activities, required in the
PAM scope, with the support of more or less standard information tools.
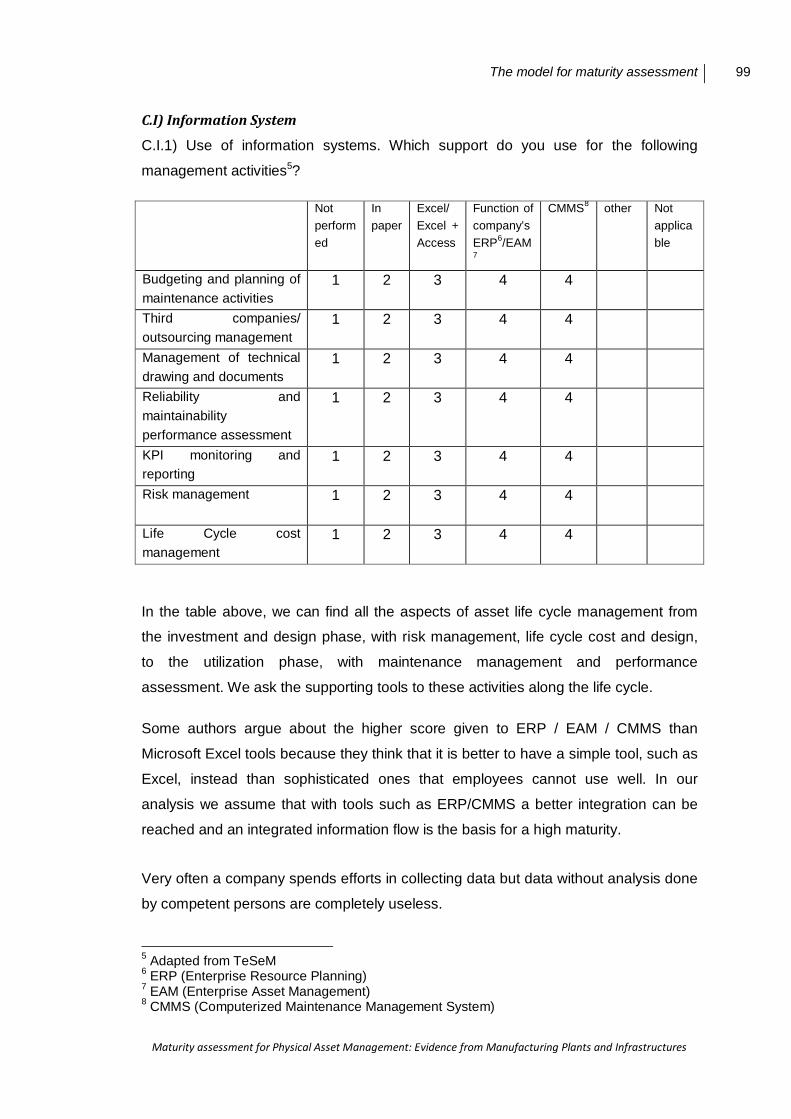
The model for maturity assessment 99
Maturity assessment for Physical Asset Management: Evidence from Manufacturing Plants and Infrastructures
C.I) Information System
C.I.1) Use of information systems. Which support do you use for the following
management activities5?
Not performed
In paper
Excel/ Excel + Access
Function of company’s ERP6/EAM7
CMMS8 other Not applicable
Budgeting and planning of maintenance activities
1 2 3 4 4
Third companies/ outsourcing management
1 2 3 4 4
Management of technical drawing and documents
1 2 3 4 4
Reliability and maintainability performance assessment
1 2 3 4 4
KPI monitoring and reporting
1 2 3 4 4
Risk management
1 2 3 4 4
Life Cycle cost management
1 2 3 4 4
In the table above, we can find all the aspects of asset life cycle management from
the investment and design phase, with risk management, life cycle cost and design,
to the utilization phase, with maintenance management and performance
assessment. We ask the supporting tools to these activities along the life cycle.
Some authors argue about the higher score given to ERP / EAM / CMMS than
Microsoft Excel tools because they think that it is better to have a simple tool, such as
Excel, instead than sophisticated ones that employees cannot use well. In our
analysis we assume that with tools such as ERP/CMMS a better integration can be
reached and an integrated information flow is the basis for a high maturity.
Very often a company spends efforts in collecting data but data without analysis done
by competent persons are completely useless.
5 Adapted from TeSeM 6 ERP (Enterprise Resource Planning) 7 EAM (Enterprise Asset Management) 8 CMMS (Computerized Maintenance Management System)
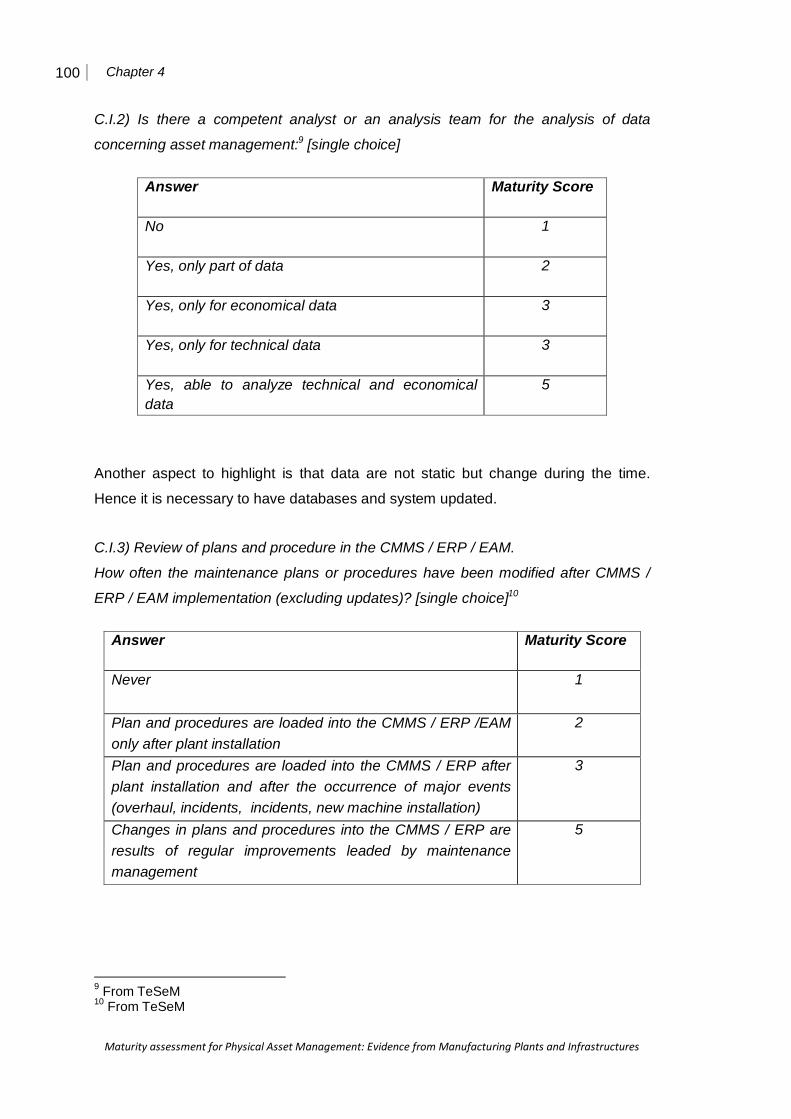
100 Chapter 4
Maturity assessment for Physical Asset Management: Evidence from Manufacturing Plants and Infrastructures
C.I.2) Is there a competent analyst or an analysis team for the analysis of data
concerning asset management:9 [single choice]
Answer Maturity Score
No
1
Yes, only part of data 2
Yes, only for economical data
3
Yes, only for technical data
3
Yes, able to analyze technical and economical data
5
Another aspect to highlight is that data are not static but change during the time.
Hence it is necessary to have databases and system updated.
C.I.3) Review of plans and procedure in the CMMS / ERP / EAM.
How often the maintenance plans or procedures have been modified after CMMS /
ERP / EAM implementation (excluding updates)? [single choice]10
Answer Maturity Score
Never
1
Plan and procedures are loaded into the CMMS / ERP /EAM only after plant installation
2
Plan and procedures are loaded into the CMMS / ERP after plant installation and after the occurrence of major events (overhaul, incidents, incidents, new machine installation)
3
Changes in plans and procedures into the CMMS / ERP are results of regular improvements leaded by maintenance management
5
9 From TeSeM 10 From TeSeM

The model for maturity assessment 101
Maturity assessment for Physical Asset Management: Evidence from Manufacturing Plants and Infrastructures
The following questions regard then the data life cycle, an important topic for PAM, as
discussed in the literature review.
C.I.4) Data on assets condition are collected
Answer Maturity Score
Without systematic procedures
1
Only after important events (overhaul, incidents, new machine installation)
2
After Periodic inspections
3
Through continuous monitoring
5
C.I.5) Where does your company storage data about asset condition?
Answer Maturity Score
Company does not have a structured database
1
There are different database not shared by separate functions
2
There is a shared database but it is difficult to find data in it
3
There is an integrated and easily used database
5
C.I.6) How are analysis about asset condition developed?
Answer Maturity Score
Analysis about data are poor / almost non existent
1
Data are analyzed occasionally without a standard way
2
Data are used in TPM/RCM/statistical analysis
5

102 Chapter 4
Maturity assessment for Physical Asset Management: Evidence from Manufacturing Plants and Infrastructures
Not only data but also tools are dynamic one. New tools are developed in order to
help managers and operators in managing a huge quantity of information and
extending supported functionality.
C.I.7) Do you use tools such as PDAs (personal data assistant), smart-phone,.. to
support asset management activities11?
□ No
□ Sometimes
□ Yes
The Table 4.6 reports all the possible answers given in this part of the questionnaire.
Table 4.6 Summarizing table IFSi
One of the possible formulas of IFSi (Information System index), for a generic i-th
firm, is then expressed as an arithmetical average of all the questions to which a
maturity score is assigned, i.e.:
𝐼𝐹𝑆𝑖 =∑ 𝐶. 𝐼������
6
where:
- q is the index of the question
- C.I.iq is the score obtained by the firm i in the question indexed q.
11 Adapted from TeSeM
The model for maturity assessment 103
Maturity assessment for Physical Asset Management: Evidence from Manufacturing Plants and Infrastructures
However, we assume that the question C.I.5 is one of the most important in this
section because it reflects the real situation of the company about information system:
for example, a company can in fact have sophisticated information tools but they are
not well structured and it is time consuming to find data in them, because of a scarce
integration. Hence, we decide to assign a higher weight to this question. The adapted
formula of IFSi became:
𝐼𝐹𝑆𝑖 =𝐶. 𝐼. 1� + 𝐶. 𝐼. 2�+ 𝐶. 𝐼. 3� + 4+ 𝐶. 𝐼. 6�
5 𝑥 0,4 + 𝐶. 𝐼. 5� 𝑥 0,6
C.II) Asset Performance Management
The performance monitoring represents the upstream information flows discussed in
the paragraph 2.4.2 which provides feedback on effectiveness of the implementation
of asset management strategies.
There are a lot of KPIs related to physical asset management that can be monitored
by organizations.
C.II.1) What KPIs related to physical asset management are used in your
organization? [multiple choice]
□ Reliability
□ Availability
□ Maintainability
□ Safety
□ Security
□ Health
□ Environmental
□ Quality of the business results (quality of products / service…)
□ Economics
□ Politics (relationship with stakeholders as regulators..)
□ Customer Satisfaction
□ Employees Satisfaction
□ Training
□ Others [indicate them]:________________
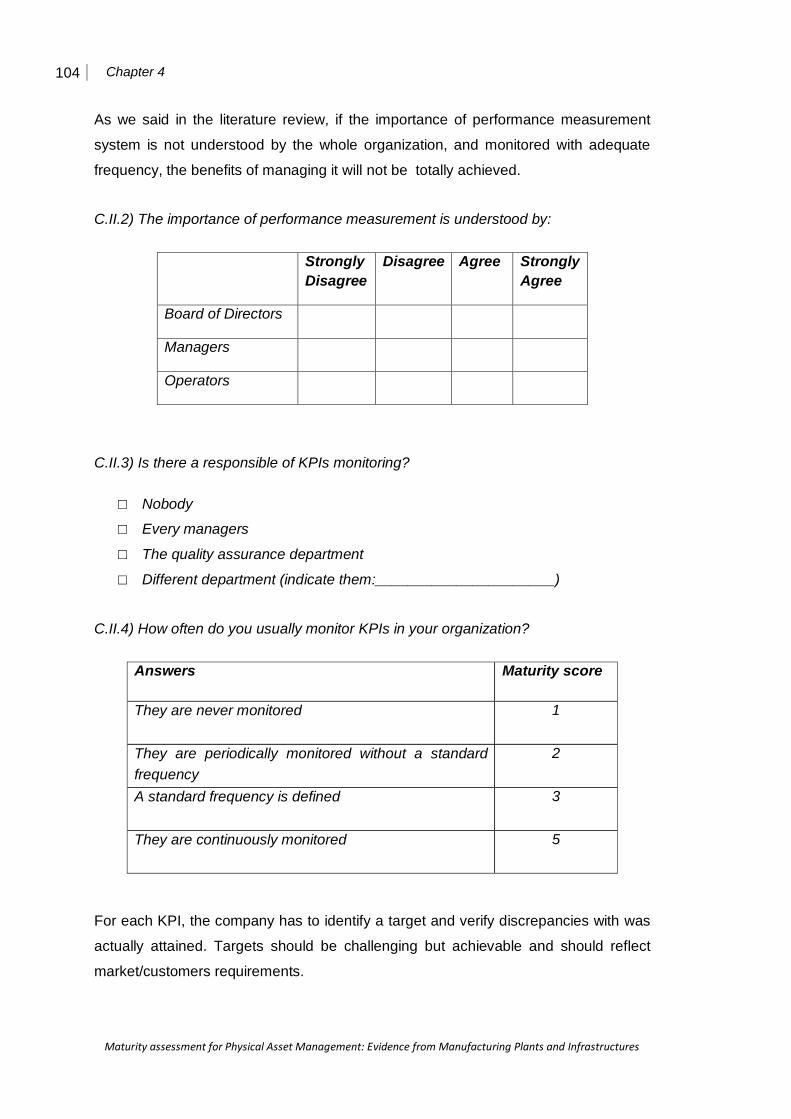
104 Chapter 4
Maturity assessment for Physical Asset Management: Evidence from Manufacturing Plants and Infrastructures
As we said in the literature review, if the importance of performance measurement
system is not understood by the whole organization, and monitored with adequate
frequency, the benefits of managing it will not be totally achieved.
C.II.2) The importance of performance measurement is understood by:
Strongly Disagree
Disagree Agree Strongly Agree
Board of Directors
Managers
Operators
C.II.3) Is there a responsible of KPIs monitoring?
□ Nobody
□ Every managers
□ The quality assurance department
□ Different department (indicate them:______________________)
C.II.4) How often do you usually monitor KPIs in your organization?
Answers Maturity score
They are never monitored
1
They are periodically monitored without a standard frequency
2
A standard frequency is defined
3
They are continuously monitored
5
For each KPI, the company has to identify a target and verify discrepancies with was
actually attained. Targets should be challenging but achievable and should reflect
market/customers requirements.

The model for maturity assessment 105
Maturity assessment for Physical Asset Management: Evidence from Manufacturing Plants and Infrastructures
C.II.5) How often are the target of KPIs set in your organization?
Answers Maturity score
Only once
1
After important events (overhaul, incidents, new machine installation,..)
2
Periodically (indicate how often:_________________)
3
Periodically (indicate how often:_________________) but they are revised during this period
4
C.II.6) Do standard procedures exist to deal with discrepancies between the actual
performances and the target performance?
Answers Maturity score
No, discrepancies analysis is not developed
1
No, discrepancies analysis is occasionally developed without standard practices
2
Yes, there are standard practices
3/4*
*in this case the maturity is also influenced by the next question:
C.II.7) If discrepancies analysis is developed, does it affect decisions?
NO Sometimes Yes Of board directors
Of Manager
Of operators
In particular, if discrepancies analysis affects decisions at the all levels of the
organization, the maturity score of C.II.6 will be 4, in other cases 3.

106 Chapter 4
Maturity assessment for Physical Asset Management: Evidence from Manufacturing Plants and Infrastructures
Here after the summarizing table about the asset performance assessment section in
shown (Table 4.7)
Table 4.7 Summarizing table - APMi
The formula of the APMi (Asset performance management), for a generic i-th firm, is
then expressed as an arithmetical average of all the questions to which a maturity
score is assigned, i.e.:
𝐴𝑃𝑀𝑖 =𝐶. 𝐼𝐼. 4� + 𝐶. 𝐼𝐼. 5� + 𝐶. 𝐼𝐼. 6�
3
where:
- q is the index of the question
- C.II.iq is the score obtained by the firm i in the question indexed as q
Hence the formula of the Information Management Index is:
𝐼𝐹𝑀𝑖 =𝐼𝐹𝑆𝑖 + 𝐴𝑃𝑀𝑖
2
D) Organization & Culture Index (OCI)
D.I) Organization
One of the important aspects to consider, analyzing PAM maturity, is to understand if
asset management is recognized in the organization as a function. As it is said in the
literature review, the purpose of the Asset Management Function is to provide
resources and expertise to support the acquisition, in-service support and disposal of
the physical assets required by the organization. An asset management function will
be needed at company level, providing inputs to asset planning, taking a role in major
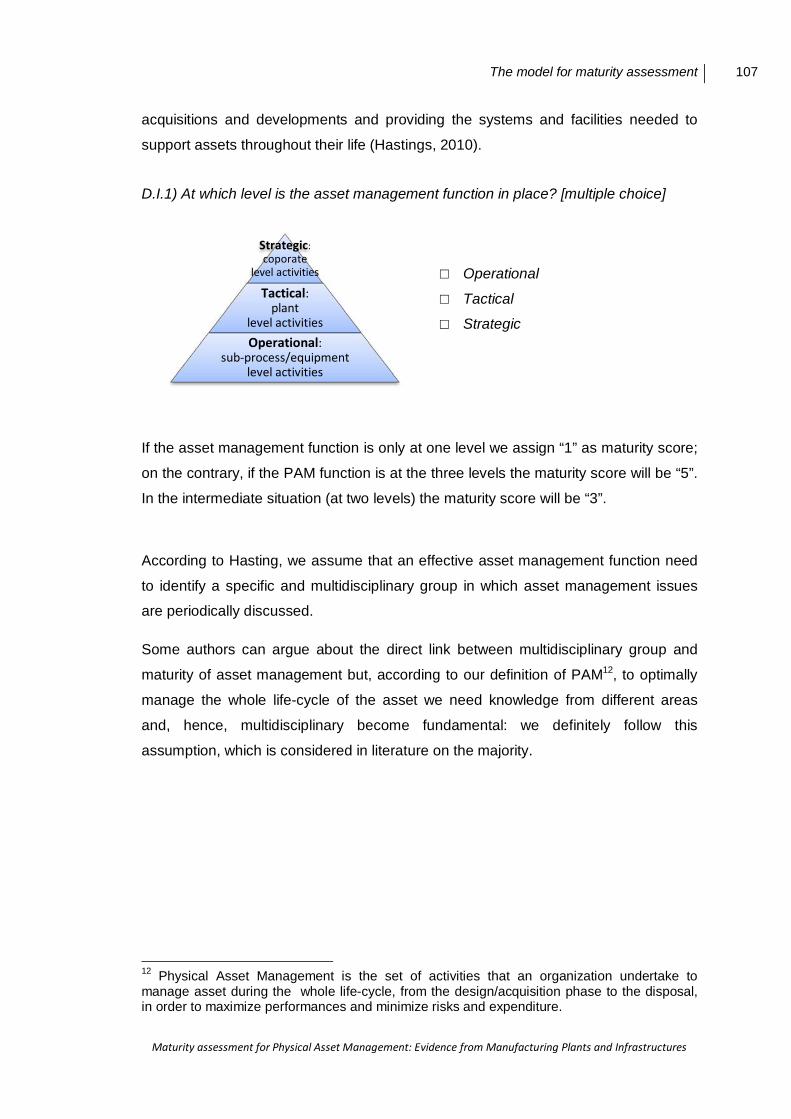
The model for maturity assessment 107
Maturity assessment for Physical Asset Management: Evidence from Manufacturing Plants and Infrastructures
acquisitions and developments and providing the systems and facilities needed to
support assets throughout their life (Hastings, 2010).
D.I.1) At which level is the asset management function in place? [multiple choice]
□ Operational
□ Tactical
□ Strategic
If the asset management function is only at one level we assign “1” as maturity score;
on the contrary, if the PAM function is at the three levels the maturity score will be “5”.
In the intermediate situation (at two levels) the maturity score will be “3”.
According to Hasting, we assume that an effective asset management function need
to identify a specific and multidisciplinary group in which asset management issues
are periodically discussed.
Some authors can argue about the direct link between multidisciplinary group and
maturity of asset management but, according to our definition of PAM12, to optimally
manage the whole life-cycle of the asset we need knowledge from different areas
and, hence, multidisciplinary become fundamental: we definitely follow this
assumption, which is considered in literature on the majority.
12 Physical Asset Management is the set of activities that an organization undertake to manage asset during the whole life-cycle, from the design/acquisition phase to the disposal, in order to maximize performances and minimize risks and expenditure.
Strategic: coporate
level activities
Tactical: plant
level activities Operational:
sub-process/equipment level activities

108 Chapter 4
Maturity assessment for Physical Asset Management: Evidence from Manufacturing Plants and Infrastructures
D.I.2) Is there an asset management group within your organization?
Answer Maturity score
No
1
No, but there are specialists dedicated to AM duties
3
Yes
5
The following question is not directly used in the computation but it is important to
understand if this group is multidisciplinary as the good asset management practices
prescribe.
D.I.2.1) If yes, which professions are taking part of this group / these specialists?
[multiple choice]
□ Asset manager
□ Project manager
□ Finance, accounting, costing
□ Lawyers
□ Procurement managers and officers
□ Engineers
□ Logisticians
□ Maintenance personnel
□ General staff
□ Others:_______________________________
Again, the question D.I.2.2 is used only in a qualitative analysis in order to assess if the asset management group has recognized as a group/function with different responsibilities.

The model for maturity assessment 109
Maturity assessment for Physical Asset Management: Evidence from Manufacturing Plants and Infrastructures
D.I.2.2) Which are the organizational duties for which the asset management group is
responsible? [multiple choice]
Asset Management Group Fully responsible
Contribute to the achievement of the results
Not responsible
Acquisition or development projects
In-service logistic support and procurement
Organization-wide asset systems and practices
Asset status knowledge and reporting
Strategic assessment and development
Sustainable development (economic, environmental, social issues)
Other:______________________ ___________________________
D.II) Culture
This part of the questionnaire takes as starting point a previous work done in Australia
by Brunetto and Xerri (2012). In their work the authors developed a survey about
Culture Asset Management and asked to all people within the company to fulfill it with
the aim to examine attitudes and beliefs of employees about AM and to provide
information that could be used to improve total asset management strategies. As our
questionnaire has different aims, it will be addressed specifically to asset managers.
However, we found very useful ideas in their work about some aspects of culture
asset management such as roles, policies, training, and communication.
Next question regards the definition of policies and goals. Three different approaches
can be identified that a company can choose to make policy decisions:
Top down approach
Bottom up approach
Shared process
110 Chapter 4
Maturity assessment for Physical Asset Management: Evidence from Manufacturing Plants and Infrastructures
The top-down approach to policy decisions, also known as autocratic leadership, is
the process of upper management or the chief executive officer reaching independent
conclusions that change or improve the workplace or business systems. Lower-level
managers can have some input into recommendations for their sections or contribute
department data, but the top-down approach does not give them authority to make
any decisions. This approach does not provide discussions between top management
and employees, and it also saves the company time in explaining why the ideas of
some staff members are used and not others. Businesses that are heavily regulated
or have many legal issues to consider may find this style of management to be an
advantage to them.
Alternatively, bottom-up process of implementation is the opposite of the top-down
approach. Employees are the impetus for change in the bottom-up style (Deeb,
2012).
Both approaches have advantages and disadvantages. We think that a shared
process has to be preferred because company may include suggestions from
employees before formulating final plans and, even if this method can be more time-
consuming, it can align goals at the different levels of the organization.
D.II.1) Policies and goals are defined after a
□ Top down approach
□ Bottom up approach
□ Shared process
In D.II.1 we decide to use an opposite approach compare than yes/no question: if the
answer will be shared process, we will have “5” while in the other cases we do not
consider the answer because as we said before top down and bottom up approaches
have advantages and disadvantages and we cannot judge a priori which is the best
solution.
Below there are some questions that are not linked to specific practices but are
interesting to understand how organization explain policies and the attitudes of the
employees regarding changing.
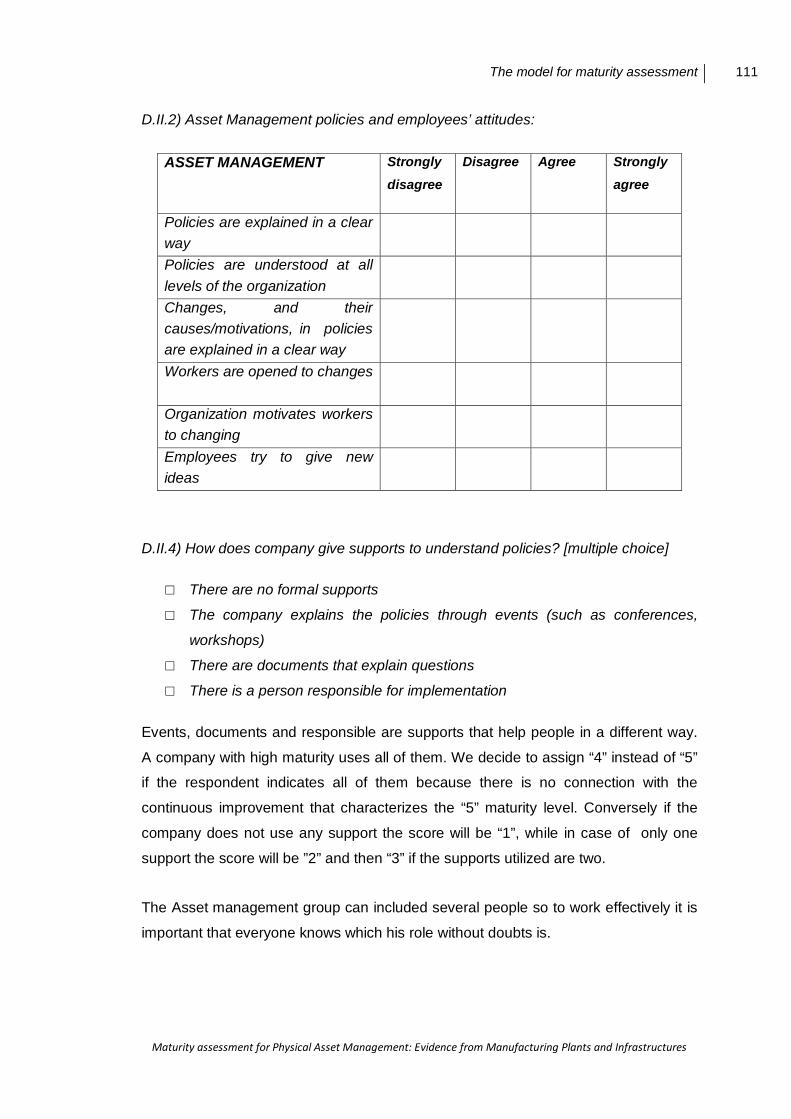
The model for maturity assessment 111
Maturity assessment for Physical Asset Management: Evidence from Manufacturing Plants and Infrastructures
D.II.2) Asset Management policies and employees’ attitudes:
ASSET MANAGEMENT Strongly disagree
Disagree Agree Strongly agree
Policies are explained in a clear way
Policies are understood at all levels of the organization
Changes, and their causes/motivations, in policies are explained in a clear way
Workers are opened to changes
Organization motivates workers to changing
Employees try to give new ideas
D.II.4) How does company give supports to understand policies? [multiple choice]
□ There are no formal supports
□ The company explains the policies through events (such as conferences,
workshops)
□ There are documents that explain questions
□ There is a person responsible for implementation
Events, documents and responsible are supports that help people in a different way.
A company with high maturity uses all of them. We decide to assign “4” instead of “5”
if the respondent indicates all of them because there is no connection with the
continuous improvement that characterizes the “5” maturity level. Conversely if the
company does not use any support the score will be “1”, while in case of only one
support the score will be ”2” and then “3” if the supports utilized are two.
The Asset management group can included several people so to work effectively it is
important that everyone knows which his role without doubts is.
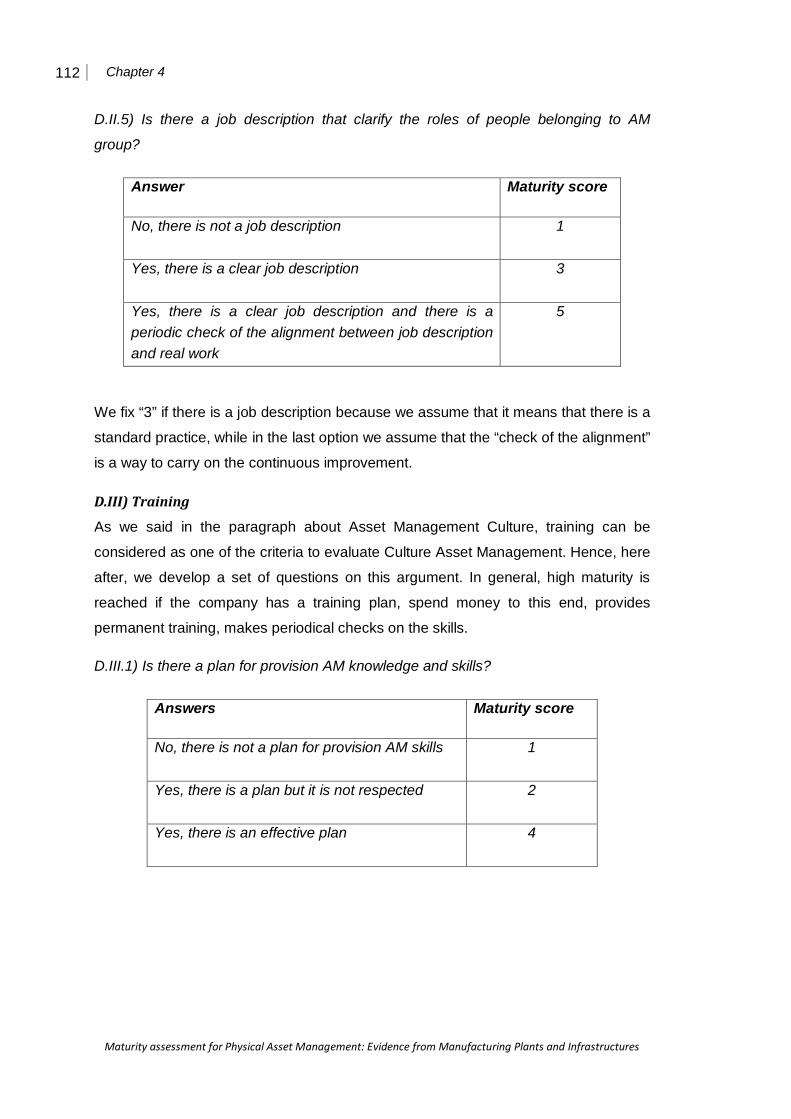
112 Chapter 4
Maturity assessment for Physical Asset Management: Evidence from Manufacturing Plants and Infrastructures
D.II.5) Is there a job description that clarify the roles of people belonging to AM
group?
Answer Maturity score
No, there is not a job description
1
Yes, there is a clear job description
3
Yes, there is a clear job description and there is a periodic check of the alignment between job description and real work
5
We fix “3” if there is a job description because we assume that it means that there is a
standard practice, while in the last option we assume that the “check of the alignment”
is a way to carry on the continuous improvement.
D.III) Training
As we said in the paragraph about Asset Management Culture, training can be
considered as one of the criteria to evaluate Culture Asset Management. Hence, here
after, we develop a set of questions on this argument. In general, high maturity is
reached if the company has a training plan, spend money to this end, provides
permanent training, makes periodical checks on the skills.
D.III.1) Is there a plan for provision AM knowledge and skills?
Answers Maturity score
No, there is not a plan for provision AM skills
1
Yes, there is a plan but it is not respected
2
Yes, there is an effective plan
4
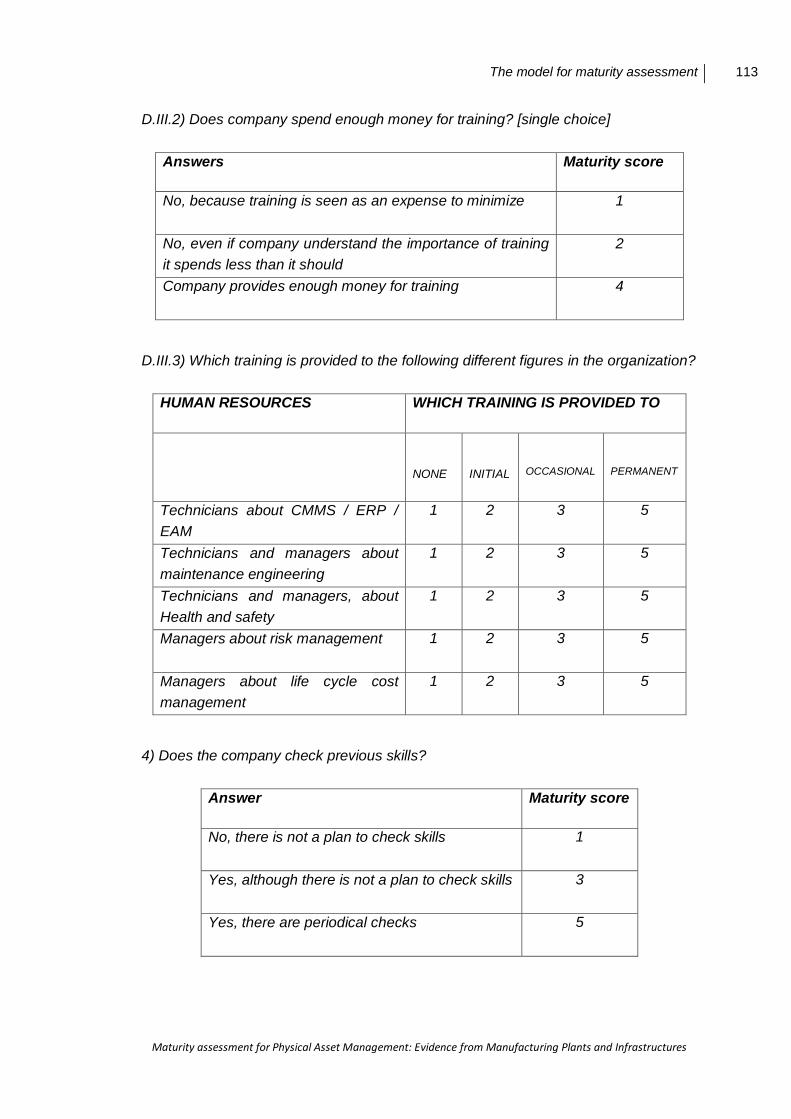
The model for maturity assessment 113
Maturity assessment for Physical Asset Management: Evidence from Manufacturing Plants and Infrastructures
D.III.2) Does company spend enough money for training? [single choice]
Answers Maturity score
No, because training is seen as an expense to minimize
1
No, even if company understand the importance of training it spends less than it should
2
Company provides enough money for training
4
D.III.3) Which training is provided to the following different figures in the organization?
HUMAN RESOURCES WHICH TRAINING IS PROVIDED TO
NONE
INITIAL
OCCASIONAL
PERMANENT
Technicians about CMMS / ERP / EAM
1 2 3 5
Technicians and managers about maintenance engineering
1 2 3 5
Technicians and managers, about Health and safety
1 2 3 5
Managers about risk management
1 2 3 5
Managers about life cycle cost management
1 2 3 5
4) Does the company check previous skills?
Answer Maturity score
No, there is not a plan to check skills
1
Yes, although there is not a plan to check skills
3
Yes, there are periodical checks
5

114 Chapter 4
Maturity assessment for Physical Asset Management: Evidence from Manufacturing Plants and Infrastructures
D. IV) Communication
Brunetto and Xerri (2012) emphasized the important of communication during
changes, and we think that it is vital also to develop and reinforce a shared culture.
Communication can then be analyzed relating to:
Communication Mode. It refers to the method used to convey a message from
one organizational member to another that can be formal or informal.
Relationships based on formal communication are characterized by policies,
written memos or organizational meetings and should facilitate the
development of informal communication relationships.
On the other hand, informal communication is referred to as spur-of-the-
moment communication, and it is considered to be verbal or face-to-face
communication. Informal communication is developed by people who know
each other and who will interact to help each other and can be used as a tool
to assist in encouraging and facilitating employees/supervisors within an
organization to develop social exchange relationships in which to transfer
important knowledge to support work-based problem-solving and creativity in
the workplace.
Therefore, it is important that organizations establish effective formal
communication networks to facilitate and support the informal communication
networks in place to provide employees access to knowledge to assist in
solving work-based problems. Frequency. Johlke and Duhan (2000) outline that communication frequency
can be measured by the amount of contact between organizational members.
A higher frequency of communication between supervisor and subordinate is
suggested to improve the link between the employee and the organization and
it is thought to be correlated with improved employee job satisfaction and firm
performance.
In the questionnaire, formal communications are considered in terms of written
procedures and meetings.
D.IV.1) Does the company have/use written procedures?
□ Yes
□ No

The model for maturity assessment 115
Maturity assessment for Physical Asset Management: Evidence from Manufacturing Plants and Infrastructures
D.IV.1.1) If yes, are they revised periodically?
Answers Maturity score
Never
1
After important events (overhaul, incidents, new machine installation)
2
Continuous improvements
5
D.IV.2) Does Asset Management group periodically organize meetings regarding
asset management issue?
□ No
□ Yes
D.IV.2.1) If yes, how the frequency of meetings is established?
Answers Maturity Score
After important events (overhaul, incidents, new machine installation)
1
With management availability
2
With a constant frequency but it can be increased
3
With a constant frequency that cannot be
increased
4
D.IV.2.2) How often are meetings organized?
□ Once a week
□ Once a month
□ Every two months
□ Twice a year
□ Once a year
□ _____________ [indicate how often]
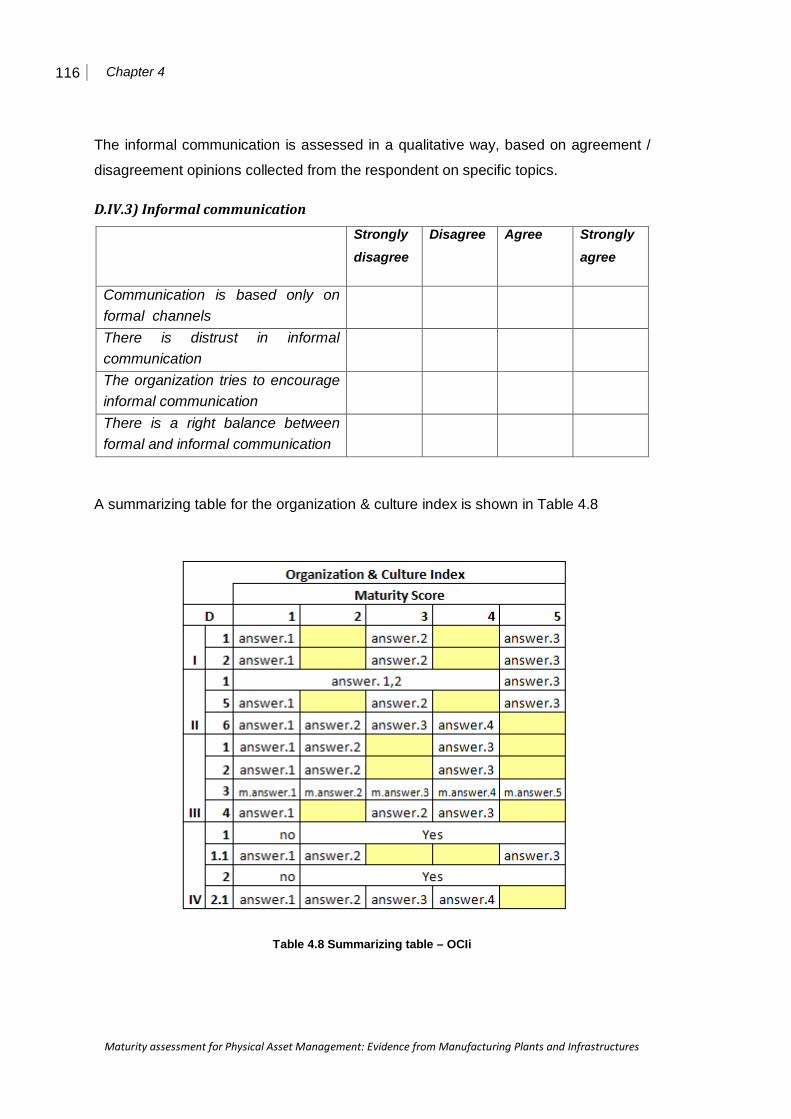
116 Chapter 4
Maturity assessment for Physical Asset Management: Evidence from Manufacturing Plants and Infrastructures
The informal communication is assessed in a qualitative way, based on agreement /
disagreement opinions collected from the respondent on specific topics.
D.IV.3) Informal communication
Strongly disagree
Disagree Agree Strongly agree
Communication is based only on formal channels
There is distrust in informal communication
The organization tries to encourage informal communication
There is a right balance between formal and informal communication
A summarizing table for the organization & culture index is shown in Table 4.8
Table 4.8 Summarizing table – OCIi

The model for maturity assessment 117
Maturity assessment for Physical Asset Management: Evidence from Manufacturing Plants and Infrastructures
And the formula of the OCI (Organization & Culture Index) for a generic i-th firm, is
then expressed as an arithmetical average of all the questions to which a maturity
score is assigned, i.e.:
𝑂𝐶𝐼𝑖 =
∑ 𝐷. 𝐼.���� �
2 + ∑ 𝐷. 𝐼𝐼.����
3 + ∑ 𝐷. 𝐼𝐼𝐼.����
4 + ∑ 𝐷. 𝐼𝑉.����
44
= 𝑂𝑅𝐺𝑖 + 𝐶𝑈𝐼𝑖 + 𝑇𝑅𝐼𝑖 + 𝐶𝑂𝑀ì
4
where:
- q is the index of the question
- D.i.iq is the score obtained by the firm i in the question indexed as q
- ORGi is the organization index
- CUI is the culture index
- TRI is the training index
- COMi is the communication index
E) External Coordination Index (ECI)
This column/index of the matrix concerns the relationship between the company and
third parties, such as regulators, society and suppliers.
E.I) Regulators
Companies has to interrelate with a lot of types of regulatory requirements, and may
approach them by anticipating requirements and interacting with regulators.
E.I.1) How much do you consider regulators that influence your organization?
Answers Maturity Score
Company considers only present rules
1
Company tries to anticipate possible future requirements by itself
3
Company tries to interact with regulators in order to understand what would be possible future requirements
5

118 Chapter 4
Maturity assessment for Physical Asset Management: Evidence from Manufacturing Plants and Infrastructures
E.II) Society
As it said in Chapter 2 of this thesis, PAM is linked to theme of sustainability. The
meaning of sustainable development is “meeting the needs of present without
compromising the ability of future generations to meet their needs” (Brundtland,
1987). Sustainability issues may be either a relevant part or not/may assume a minor
role in strategic plans of the company; alike, the organization may have developed
more or less projects targeting sustainability.
E.II.1) Are sustainability issues considered in the strategic plans of the company?
Answers Maturity Score
No
1
Yes, but as a minor aims
2
Yes, sustainability is one of the main goal
4/5*
*The maturity score depends also from the answer at E.II.2
E.II.2) What projects concerning sustainability are you developing in your
organization?
□ To reduce maintenance costs
□ To reduce environmental impact
□ To reduce water consumption
□ To reduce energy consumption
□ To treat/reduce waste
□ To improve working condition
□ To support community improvement
□ _________________
E.III) Outsourcing
Service providers often see asset management as a means of extending their service
offering (Herder and Wijnia, 2009). Hence outsourcing became an important aspect to
analyze in assessing the maturity in PAM practices, having a look / insight on the
support from service provides along the whole asset life cycle.
The model for maturity assessment 119
Maturity assessment for Physical Asset Management: Evidence from Manufacturing Plants and Infrastructures
E.II.1) How many contracts do you have? (order of magnitude)
_____________________________________
E.III.2) Which service does your organization outsource?
□ Design
□ Construction
□ Operation
□ Maintenance 13
Focusing on maintenance, maintenance outsourcing consists in externalizing a set of
activities, related to execution of maintenance interventions, information
management, spare parts management and maintenance engineering, to a third
party. Maintenance service providers offer activities that go beyond corrective and
preventive maintenance (Kumar et al., 2005).
E.III.2.1) Which services are offered by your maintenance providers?
□ Assistance in defining product specification;
□ Assistance during the installation and commissioning phase of a
product/system;
□ Assistance in defining the operational strategy;
□ Field service – maintenance tasks;
□ Remote diagnostics;
□ Expert assistance for at site diagnostics and repair;
□ Help desk, online help, telephone support;
□ Advanced training;
□ Logistic support optimization;
□ Assistance in product End-Of-Life management;
□ IT
□ Other:_________________________
The previous questions (E.III.1, E.III.2 and E.III.2.1) are important in order to
understand if the service providers are integrated along the whole life cycle of the
assets (during the design and the operational phases, in defining assets strategy,..) 13 These are the fields considered in the acronym DCOM (Design, Construction, Operate and maintain) ordinary used in infrastructure assets management.

120 Chapter 4
Maturity assessment for Physical Asset Management: Evidence from Manufacturing Plants and Infrastructures
but they are not linked to a maturity score because we cannot quantify the answers in
a numerical result.
To perform the services listed above the sharing of information becomes a key factor.
E.III.3) How does your organization share information with its service providers?
Answers Maturity Score
There is no database shared between company and contractors
1
Contractors have their databases and only some information are shared
2
There is some shared databases but contracts cannot update them
3
There is an integrated database, easily accessible for both parts
5
Outsourcing has several advantages but also it brings some risks, that should not be
underestimated. The main risks of outsourcing are:
Hidden costs
Less flexibility
Skills erosion
Contractual problems
Conflict of interest
Suppliers problems
These risks are linked to the uncertainties around costs, contracts and future
evolutions of markets.
In a multi-provider situation, it can be difficult to assign every firm its responsibilities,
because of the strong interactions existing among different firms’ work. This can turn
into a difficult definition of a good performance scorecard as a basis of an agreement
on the level of services offered (such as a Service Level Agreement). Moreover,
conflicts can emerge if a provider offers a predefined level of performances and does
maintenance itself, deciding how and when to operate on customer’s assets: in these
situations, there could be done too much interventions, and too short machine parts
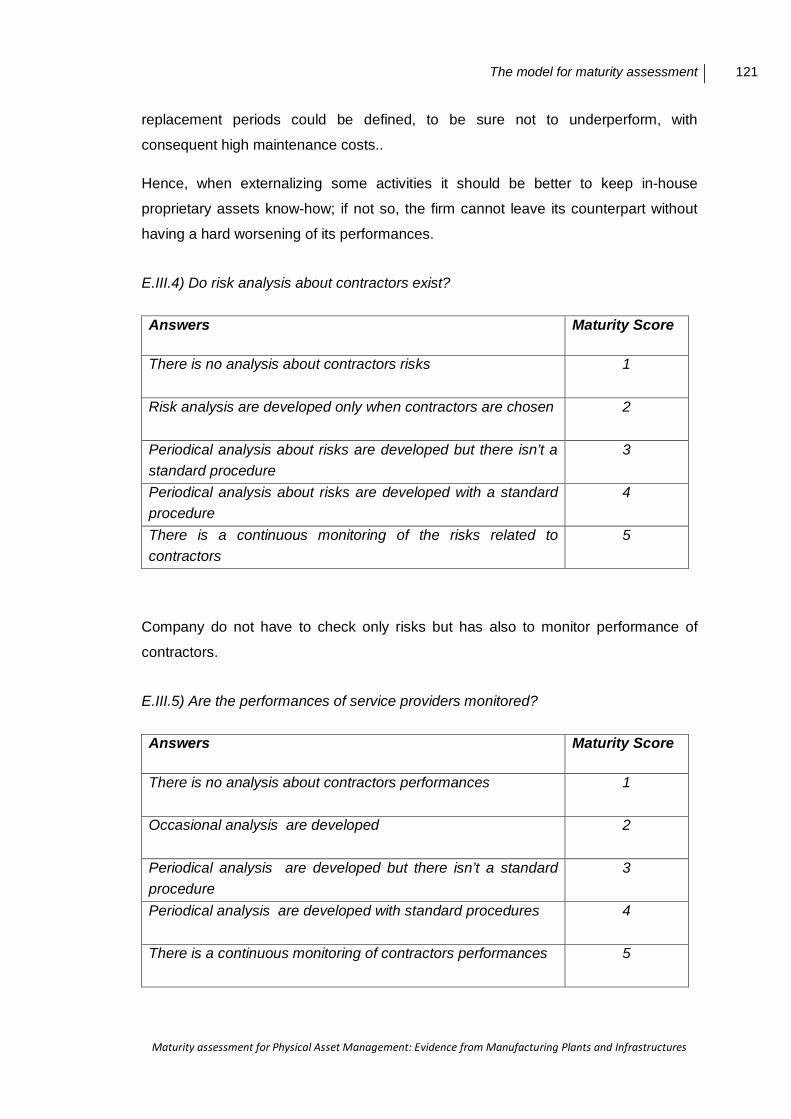
The model for maturity assessment 121
Maturity assessment for Physical Asset Management: Evidence from Manufacturing Plants and Infrastructures
replacement periods could be defined, to be sure not to underperform, with
consequent high maintenance costs..
Hence, when externalizing some activities it should be better to keep in-house
proprietary assets know-how; if not so, the firm cannot leave its counterpart without
having a hard worsening of its performances.
E.III.4) Do risk analysis about contractors exist?
Answers Maturity Score
There is no analysis about contractors risks
1
Risk analysis are developed only when contractors are chosen
2
Periodical analysis about risks are developed but there isn’t a standard procedure
3
Periodical analysis about risks are developed with a standard procedure
4
There is a continuous monitoring of the risks related to contractors
5
Company do not have to check only risks but has also to monitor performance of
contractors.
E.III.5) Are the performances of service providers monitored?
Answers Maturity Score
There is no analysis about contractors performances
1
Occasional analysis are developed
2
Periodical analysis are developed but there isn’t a standard procedure
3
Periodical analysis are developed with standard procedures
4
There is a continuous monitoring of contractors performances
5
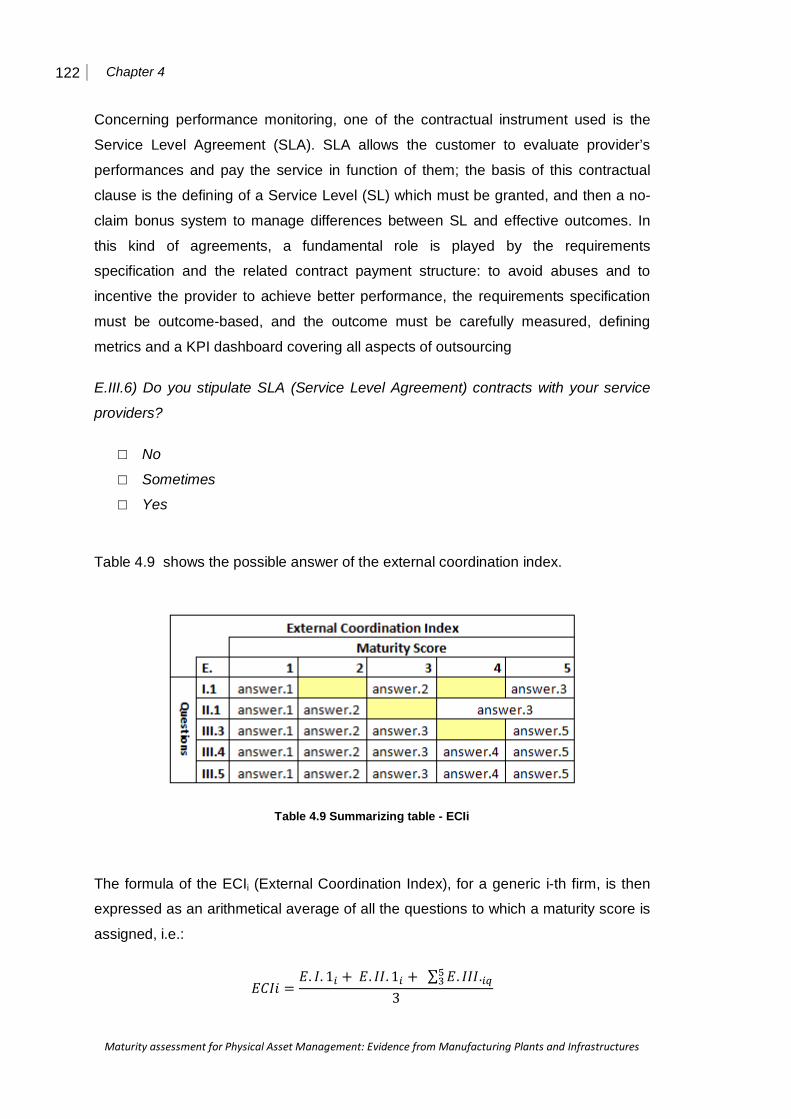
122 Chapter 4
Maturity assessment for Physical Asset Management: Evidence from Manufacturing Plants and Infrastructures
Concerning performance monitoring, one of the contractual instrument used is the
Service Level Agreement (SLA). SLA allows the customer to evaluate provider’s
performances and pay the service in function of them; the basis of this contractual
clause is the defining of a Service Level (SL) which must be granted, and then a no-
claim bonus system to manage differences between SL and effective outcomes. In
this kind of agreements, a fundamental role is played by the requirements
specification and the related contract payment structure: to avoid abuses and to
incentive the provider to achieve better performance, the requirements specification
must be outcome-based, and the outcome must be carefully measured, defining
metrics and a KPI dashboard covering all aspects of outsourcing
E.III.6) Do you stipulate SLA (Service Level Agreement) contracts with your service
providers?
□ No
□ Sometimes
□ Yes
Table 4.9 shows the possible answer of the external coordination index.
Table 4.9 Summarizing table - ECIi
The formula of the ECIi (External Coordination Index), for a generic i-th firm, is then
expressed as an arithmetical average of all the questions to which a maturity score is
assigned, i.e.:
𝐸𝐶𝐼𝑖 =𝐸. 𝐼. 1� + 𝐸. 𝐼𝐼. 1� + ∑ 𝐸. 𝐼𝐼𝐼.���
�
3
The model for maturity assessment 123
Maturity assessment for Physical Asset Management: Evidence from Manufacturing Plants and Infrastructures
where:
- q is the index of the question
- E.i.iq is the score obtained by the firm i in the question indexed as q.
4.3 Concluding remarks
It is worth underlining the importance to include in each section of the questionnaire
some questions that are not linked directly to a maturity score. There questions have
the following functions:
to introduce the argument of subsequent questions, so helping the respondent
to understand better what the section is about;
to help the analysis of the maturity assessment not in automatic way, as with
the closed questions, but through considerations and reasoning (leading to a
sort of mixed analysis between closed questions and qualitative reasoning).
to give some suggestions to the respondent, such as about possible uses of some tools (LCC, risk analysis,…).
These functions are completed with the maturity assessment method based on the
close questions and scores associated to their answers, as explained during the
whole chapter.
Moreover, also the matrix itself is an important tool for the maturity assessment: as it
will be seen in Chapter 5, the matrix is going to be used to finally present the maturity
achieved in the different indexes by each company studied. The matrix is a summary
table, where each column shows the progressive growth of maturity of PAM practices:
the correspondent textual description, characterizing each maturity level, synthesizes
in fact the main practices achieved at that level, see next table.
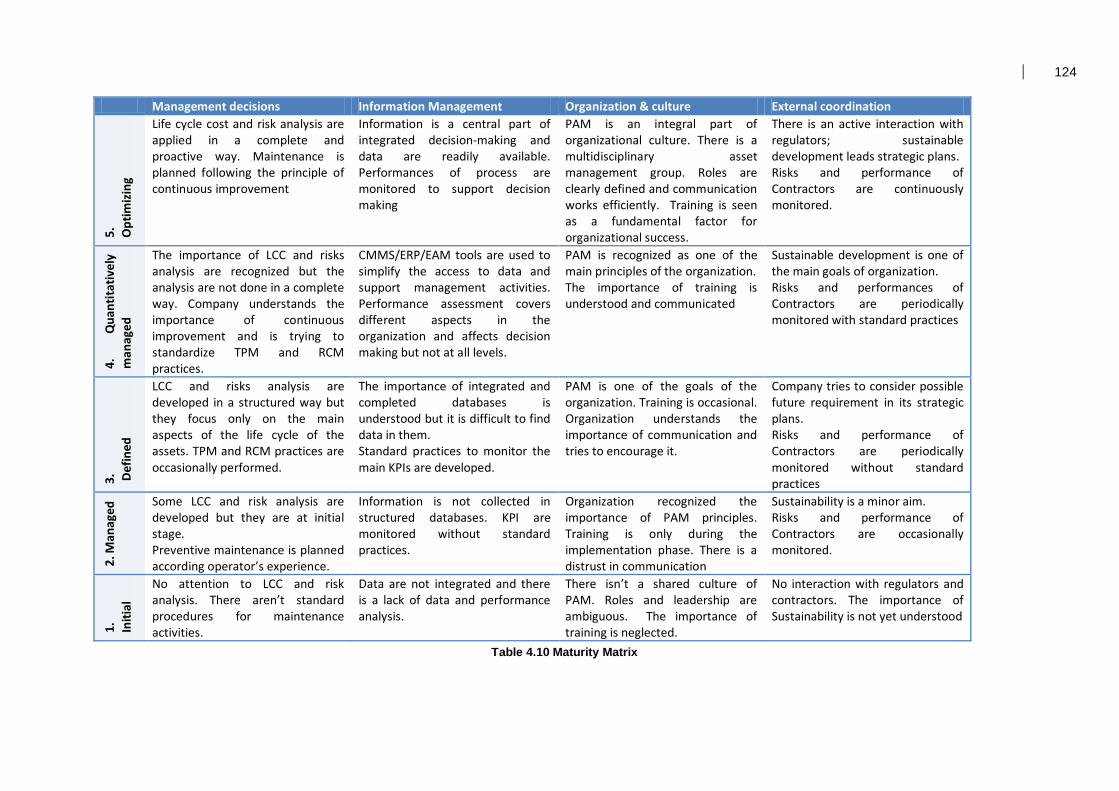
124
Management decisions Information Management Organization & culture External coordination 5.
O
ptim
izin
g Life cycle cost and risk analysis are applied in a complete and proactive way. Maintenance is planned following the principle of continuous improvement
Information is a central part of integrated decision-making and data are readily available. Performances of process are monitored to support decision making
PAM is an integral part of organizational culture. There is a multidisciplinary asset management group. Roles are clearly defined and communication works efficiently. Training is seen as a fundamental factor for organizational success.
There is an active interaction with regulators; sustainable development leads strategic plans. Risks and performance of Contractors are continuously monitored.
4.
Qua
ntita
tivel
y m
anag
ed
The importance of LCC and risks analysis are recognized but the analysis are not done in a complete way. Company understands the importance of continuous improvement and is trying to standardize TPM and RCM practices.
CMMS/ERP/EAM tools are used to simplify the access to data and support management activities. Performance assessment covers different aspects in the organization and affects decision making but not at all levels.
PAM is recognized as one of the main principles of the organization. The importance of training is understood and communicated
Sustainable development is one of the main goals of organization. Risks and performances of Contractors are periodically monitored with standard practices
3.
Def
ined
LCC and risks analysis are developed in a structured way but they focus only on the main aspects of the life cycle of the assets. TPM and RCM practices are occasionally performed.
The importance of integrated and completed databases is understood but it is difficult to find data in them. Standard practices to monitor the main KPIs are developed.
PAM is one of the goals of the organization. Training is occasional. Organization understands the importance of communication and tries to encourage it.
Company tries to consider possible future requirement in its strategic plans. Risks and performance of Contractors are periodically monitored without standard practices
2. M
anag
ed Some LCC and risk analysis are
developed but they are at initial stage. Preventive maintenance is planned according operator’s experience.
Information is not collected in structured databases. KPI are monitored without standard practices.
Organization recognized the importance of PAM principles. Training is only during the implementation phase. There is a distrust in communication
Sustainability is a minor aim. Risks and performance of Contractors are occasionally monitored.
1.
Initi
al
No attention to LCC and risk analysis. There aren’t standard procedures for maintenance activities.
Data are not integrated and there is a lack of data and performance analysis.
There isn’t a shared culture of PAM. Roles and leadership are ambiguous. The importance of training is neglected.
No interaction with regulators and contractors. The importance of Sustainability is not yet understood
Table 4.10 Maturity Matrix
125
Maturity assessment for Physical Asset Management: Evidence from Manufacturing Plants and Infrastructures
Chapter. 5 Testing the model through case studies
Now that both the PAM Maturity Matrix and the questionnaire with the maturity score
have been set up, it is possible to test their application. This is carried out through an
analysis of five case studies, three of which developed in Dutch companies, while the
others in Italian ones.
In this Chapter, the different case studies are presented: in Section 1, a pre-test on
RWS, the Dutch National Highway Agency, is described. This pre-test is developed in
order to understand if the results of the new proposed model are coherent with TUDelft
model which, as said in Chapter 3, was previously applied and agreed with RWS’s
people.
In Section 2, Dutch case studies are described while in section 3 Italian case studies
are presented.
The cases studies are developed with a dual purpose:
1. to assess the maturity of the interviewed companies in PAM practices;
2. to understand if the questionnaire – and consequently the model – analyzes the
maturity in PAM practices in a complete and clear way (the respondents don’t
have doubt, the vocabulary used is appropriate, the results are consistent with
their beliefs on the actual maturity of their organization, etc….), being applicable
both in infrastructure and in manufacturing industry.
More precisely, the case studies concerns one company for the energy infrastructure,
one company for the water Infrastructure and two companies from the process sector,
with capital intensive plants. In sections 2 and 3 we focus specifically on the first aim,
while in section 4 we collect the considerations about the second purpose from all the
case studies analyzed.
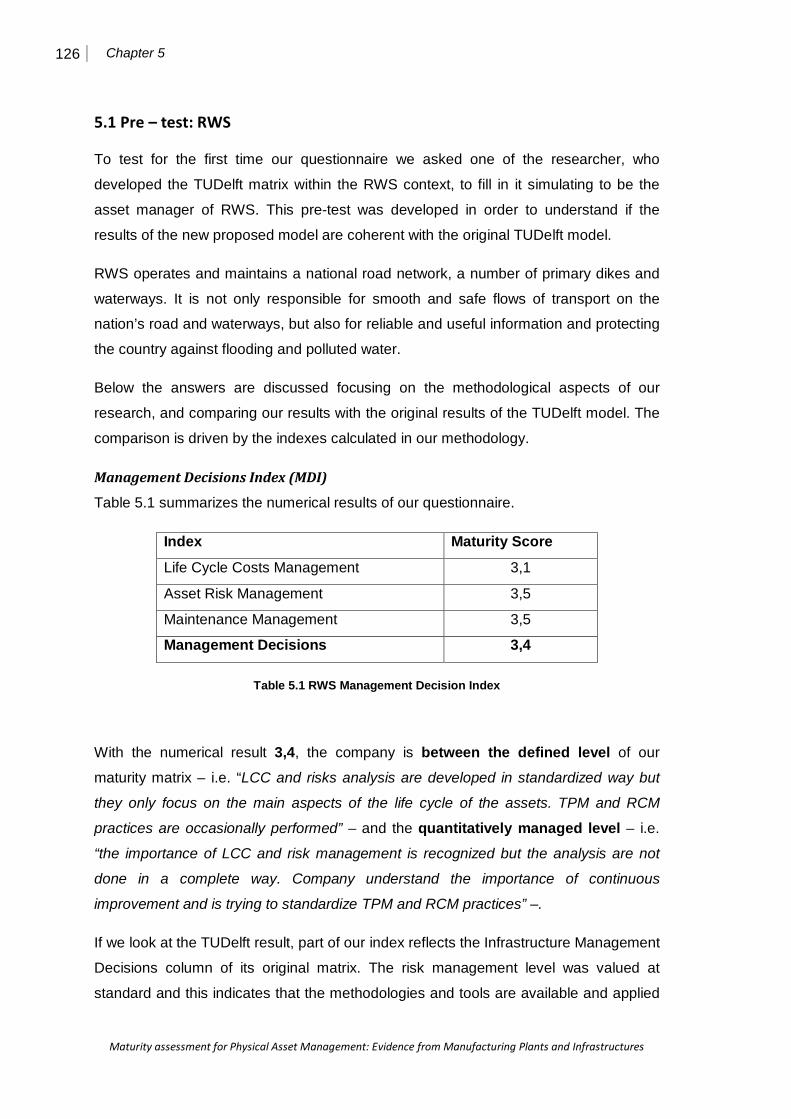
126 Chapter 5
Maturity assessment for Physical Asset Management: Evidence from Manufacturing Plants and Infrastructures
5.1 Pre – test: RWS
To test for the first time our questionnaire we asked one of the researcher, who
developed the TUDelft matrix within the RWS context, to fill in it simulating to be the
asset manager of RWS. This pre-test was developed in order to understand if the
results of the new proposed model are coherent with the original TUDelft model.
RWS operates and maintains a national road network, a number of primary dikes and
waterways. It is not only responsible for smooth and safe flows of transport on the
nation’s road and waterways, but also for reliable and useful information and protecting
the country against flooding and polluted water.
Below the answers are discussed focusing on the methodological aspects of our
research, and comparing our results with the original results of the TUDelft model. The
comparison is driven by the indexes calculated in our methodology.
Management Decisions Index (MDI)
Table 5.1 summarizes the numerical results of our questionnaire.
Index Maturity Score
Life Cycle Costs Management 3,1
Asset Risk Management 3,5
Maintenance Management 3,5
Management Decisions 3,4
Table 5.1 RWS Management Decision Index
With the numerical result 3,4, the company is between the defined level of our
maturity matrix – i.e. “LCC and risks analysis are developed in standardized way but
they only focus on the main aspects of the life cycle of the assets. TPM and RCM
practices are occasionally performed” – and the quantitatively managed level – i.e.
“the importance of LCC and risk management is recognized but the analysis are not
done in a complete way. Company understand the importance of continuous
improvement and is trying to standardize TPM and RCM practices” –.
If we look at the TUDelft result, part of our index reflects the Infrastructure Management
Decisions column of its original matrix. The risk management level was valued at
standard and this indicates that the methodologies and tools are available and applied
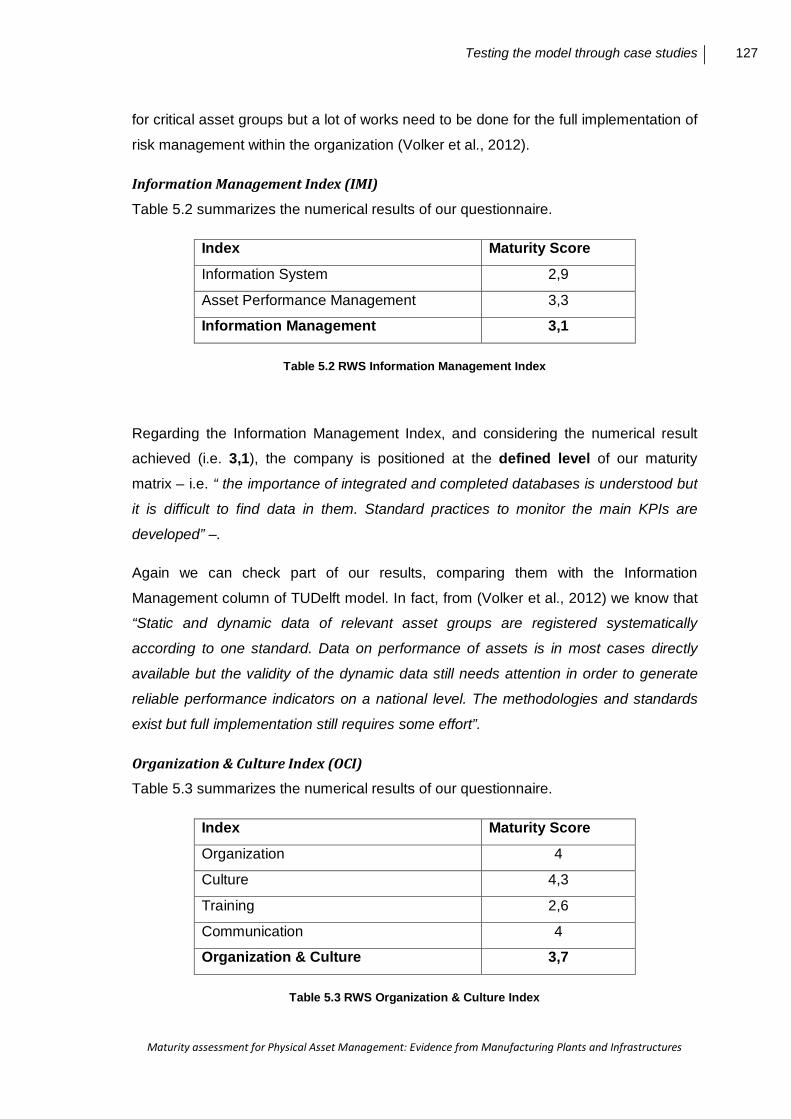
Testing the model through case studies 127
Maturity assessment for Physical Asset Management: Evidence from Manufacturing Plants and Infrastructures
for critical asset groups but a lot of works need to be done for the full implementation of
risk management within the organization (Volker et al., 2012).
Information Management Index (IMI)
Table 5.2 summarizes the numerical results of our questionnaire.
Index Maturity Score
Information System 2,9
Asset Performance Management 3,3
Information Management 3,1
Table 5.2 RWS Information Management Index
Regarding the Information Management Index, and considering the numerical result
achieved (i.e. 3,1), the company is positioned at the defined level of our maturity
matrix – i.e. “ the importance of integrated and completed databases is understood but
it is difficult to find data in them. Standard practices to monitor the main KPIs are
developed” –.
Again we can check part of our results, comparing them with the Information
Management column of TUDelft model. In fact, from (Volker et al., 2012) we know that
“Static and dynamic data of relevant asset groups are registered systematically
according to one standard. Data on performance of assets is in most cases directly
available but the validity of the dynamic data still needs attention in order to generate
reliable performance indicators on a national level. The methodologies and standards
exist but full implementation still requires some effort”.
Organization & Culture Index (OCI)
Table 5.3 summarizes the numerical results of our questionnaire.
Index Maturity Score
Organization 4
Culture 4,3
Training 2,6
Communication 4
Organization & Culture 3,7
Table 5.3 RWS Organization & Culture Index
128 Chapter 5
Maturity assessment for Physical Asset Management: Evidence from Manufacturing Plants and Infrastructures
The table reports the numerical results come from the questionnaire considering only
the questions directly related to the maturity score. As we said in the previous chapter
4, there are other kinds of question in the questionnaire that can enable to extend the
assessment: indeed, the Organization and Culture Index needs further considerations
regarding also the qualitative aspects that cannot be quantified in a score, in particular
regarding the cultural aspect.
From question D.II.2 we learn that PAM policies are not understood at all levels of the
organization. So the high score, for the effect of the score 5 achieved from question
D.II.3, is not proper: we can suppose that, even if RWS gives support to understand
policies, they are not effective at all levels of the organization.
From these considerations, we decided to integrate the qualitative analysis of cultural
aspect and hence assign the maturity level 3,5 at the culture sub-index (instead of 4,3
as achieved using the questions assigned with a score). Hence, the OCI becomes 3,5
(instead of 3,7).
With the numerical result of 3,5, the maturity level of RWS can be better understood: it
is between the defined level – i.e. “PAM is one of the goal of the organization.
Training is occasional. Organization understands the importance of communication and
tries to encourage it” – and the quantitatively managed level of our matrix – i.e. “PAM
is recognized as one of the main principles of the organization. The importance of
training is understood and communicated”.
The corresponding column of the TUDelft matrix, the Culture and leadership, shows
that, relating to the TUDelft approach, the maturity of RWS in this field is at the
standard level. In Volker et al. (2012) the authors explain that “the asset management
principles have been positively received and people generally support the overall asset
management objectives as being sound and logical. In fact, it helped them to explain
what funds are required to deliver a certain performance and risk level. An integrated
asset management training program is now broadly available. People are trained in
areas such as reliability centered maintenance, risk management, system engineering
and life cycle costing. The Infrastructure Maturity Matrix level was set at ‘standard’.
Although organizational change and trainings were well received, these processes take
time to anchor”.
Hence, in our assessment the maturity is higher. Analyzing the answers, it emerges
that the TUDelft’s considerations are confirmed also by our questionnaire: people are
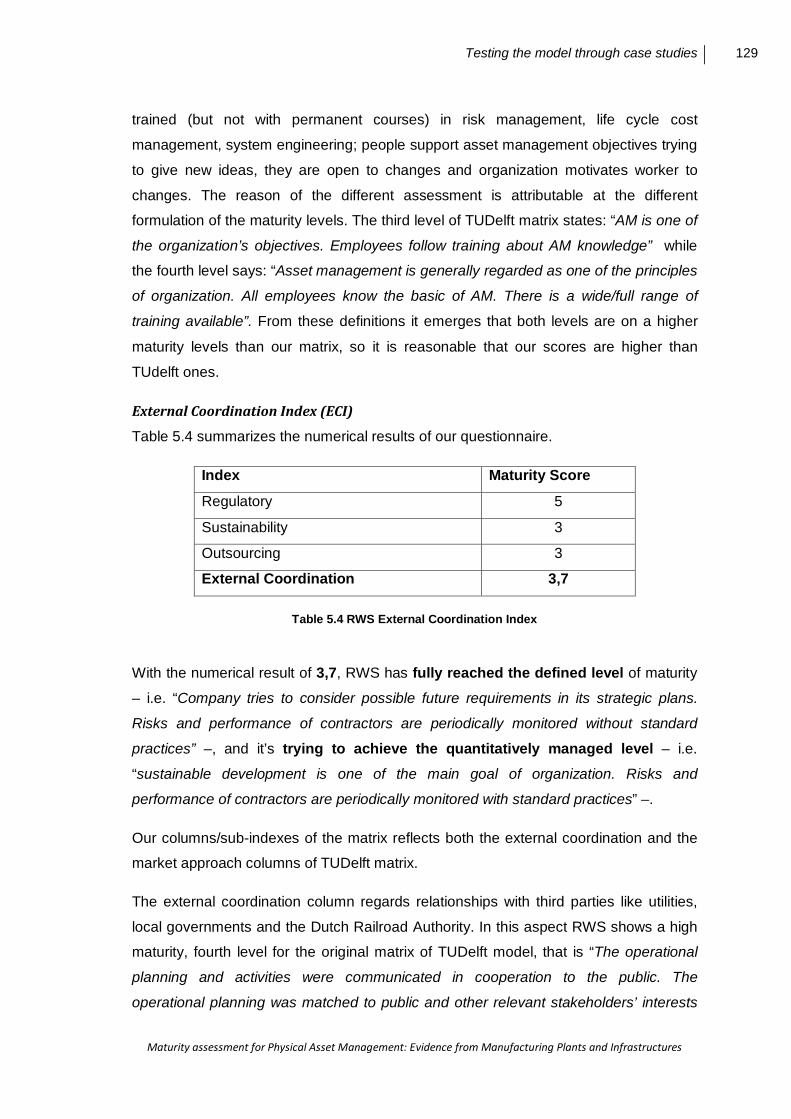
Testing the model through case studies 129
Maturity assessment for Physical Asset Management: Evidence from Manufacturing Plants and Infrastructures
trained (but not with permanent courses) in risk management, life cycle cost
management, system engineering; people support asset management objectives trying
to give new ideas, they are open to changes and organization motivates worker to
changes. The reason of the different assessment is attributable at the different
formulation of the maturity levels. The third level of TUDelft matrix states: “AM is one of
the organization’s objectives. Employees follow training about AM knowledge” while
the fourth level says: “Asset management is generally regarded as one of the principles
of organization. All employees know the basic of AM. There is a wide/full range of
training available”. From these definitions it emerges that both levels are on a higher
maturity levels than our matrix, so it is reasonable that our scores are higher than
TUdelft ones.
External Coordination Index (ECI)
Table 5.4 summarizes the numerical results of our questionnaire.
Index Maturity Score
Regulatory 5
Sustainability 3
Outsourcing 3
External Coordination 3,7
Table 5.4 RWS External Coordination Index
With the numerical result of 3,7, RWS has fully reached the defined level of maturity
– i.e. “Company tries to consider possible future requirements in its strategic plans.
Risks and performance of contractors are periodically monitored without standard
practices” –, and it’s trying to achieve the quantitatively managed level – i.e.
“sustainable development is one of the main goal of organization. Risks and
performance of contractors are periodically monitored with standard practices” –.
Our columns/sub-indexes of the matrix reflects both the external coordination and the
market approach columns of TUDelft matrix.
The external coordination column regards relationships with third parties like utilities,
local governments and the Dutch Railroad Authority. In this aspect RWS shows a high
maturity, fourth level for the original matrix of TUDelft model, that is “The operational
planning and activities were communicated in cooperation to the public. The
operational planning was matched to public and other relevant stakeholders’ interests
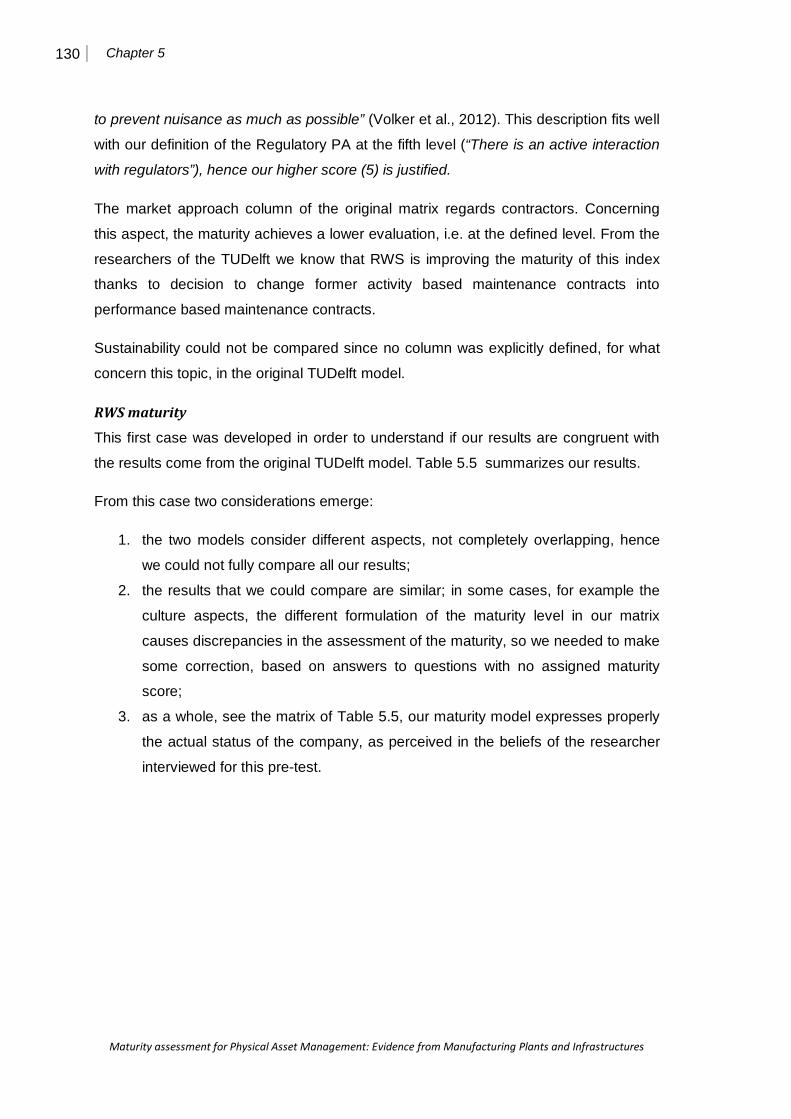
130 Chapter 5
Maturity assessment for Physical Asset Management: Evidence from Manufacturing Plants and Infrastructures
to prevent nuisance as much as possible” (Volker et al., 2012). This description fits well
with our definition of the Regulatory PA at the fifth level (“There is an active interaction
with regulators”), hence our higher score (5) is justified.
The market approach column of the original matrix regards contractors. Concerning
this aspect, the maturity achieves a lower evaluation, i.e. at the defined level. From the
researchers of the TUDelft we know that RWS is improving the maturity of this index
thanks to decision to change former activity based maintenance contracts into
performance based maintenance contracts.
Sustainability could not be compared since no column was explicitly defined, for what
concern this topic, in the original TUDelft model.
RWS maturity
This first case was developed in order to understand if our results are congruent with
the results come from the original TUDelft model. Table 5.5 summarizes our results.
From this case two considerations emerge:
1. the two models consider different aspects, not completely overlapping, hence
we could not fully compare all our results;
2. the results that we could compare are similar; in some cases, for example the
culture aspects, the different formulation of the maturity level in our matrix
causes discrepancies in the assessment of the maturity, so we needed to make
some correction, based on answers to questions with no assigned maturity
score;
3. as a whole, see the matrix of Table 5.5, our maturity model expresses properly
the actual status of the company, as perceived in the beliefs of the researcher
interviewed for this pre-test.
131
Management decisions Information Management Organization & culture External coordination 5.
O
ptim
izin
g Life cycle cost and risk analysis are applied in a complete and proactive way. Maintenance is planned following the principle of continuous improvement
Information is a central part of integrated decision-making and data are readily available. Performances of process are monitored to support decision making
PAM is an integral part of organizational culture. There is a multidisciplinary asset management group. Roles are clearly defined and communication works efficiently. Training is seen as a fundamental factor for organizational success.
There is an active interaction with regulators; sustainable development leads strategic plans. Risks and performance of Contractors are continuously monitored.
4. Q
uant
itativ
ely
man
aged
The importance of LCC and risks analysis are recognized but the analysis are not done in a complete way. Company understands the importance of continuous improvement and is trying to standardize TPM and RCM practices.
CMMS/ERP/EAM tools are used to simplify the access to data and support management activities. Performance assessment covers different aspect in the organization and affects decision making but not at all levels.
PAM is recognized as one of the main principles of the organization. The importance of training is understood and communicated
Sustainable development is one of the main goals of organization. Risks and performances of Contractors are periodically monitored with standard practices
3.
Def
ined
LCC and risks analysis are developed in a structured way but they focus only on the main aspects of the life cycle of the assets. TPM and RCM practices are occasionally performed.
The importance of integrated and completed databases is understood but it is difficult to find data in them. Standard practices to monitor the main KPIs are developed.
PAM is one of the goals of the organization. Training is occasional. Organization understands the importance of communication and tries to encourage it.
Company tries to consider possible future requirement in its strategic plans. Risks and performance of Contractors are periodically monitored without standard practices
2.
Man
aged
Some LCC and risk analysis are developed but they are at initial stage. Preventive maintenance is planned according to operator’s experience.
Information is not collected in structured databases. KPI are monitored without standard practices.
Organization recognized the importance of PAM principles. Training is only during the implementation phase. There is a distrust in communication
Sustainability is a minor aim. Risks and performance of Contractors are occasionally monitored.
1.
Initi
al
No attention to LCC and risk analysis. There aren’t standard procedures for maintenance activities.
Data are not integrated and there is a lack of data and performance analysis.
There isn’t a shared culture of PAM. Roles and leadership are ambiguous. The importance of training is neglected.
No interaction with regulators and contractors. The importance of Sustainability is not yet understood
Table 5.5 RWS Maturity Matrix

132 Chapter 5
Maturity assessment for Physical Asset Management: Evidence from Manufacturing Plants and Infrastructures
5.2 Dutch cases: INFRAen and INFRAwt
5.2.1 INFRAen
INFRAen is a Dutch Energy company responsible for part of the Dutch electricity
distributions and gas distributions networks.
The company, in managing of its assets, follows the Dutch standard (NTA 8120) based
on the British PAS 55 and, as prescribed in them, has the asset management function
on the tactical level.
In the following sections we will try to assess the maturity of INFRAen Physical Asset
Management (PAM) practices in the four different aspects of our matrix: management
decisions, information management, organization & culture, and external coordination.
Management decision Index (MDI)
The Table 5.6 summarizes the numerical results of our questionnaire.
Index Maturity Score
Asset Life Cycle Management 3
Asset Risk Management 3,71
Maintenance Management 4
Management Decisions 3,57
Table 5.6 INFRAen Management Decision Index
With this maturity score, INFRAen has plenty reached the defined maturity level, and it is trying to improve its practices in order to reach the quantitatively managed
level of our matrix.
Going in depth to the answers to the questionnaire, we know that INFRAen recognized
Life Cycle Management as one of the pillars of physical asset management (PAM),
even if the importance of life cycle costs (LCC) analysis is not understood yet by all the
people who act at the tactical level. Moreover, LCC analysis are only occasionally
performed for some PAM decisions, such as: concerning acquisition and development
of projects, identification of better investment options (investment, repair), identification
of redundancy of equipment and systems, planning of maintenance programs.
Testing the model through case studies 133
Maturity assessment for Physical Asset Management: Evidence from Manufacturing Plants and Infrastructures
In terms of issues considered, LCC analysis is almost complete – it does not consider
only the disposal costs –; further on, LCC considers also aspects related to the
efficiency of the assets, such as failure and reliability, capacity and quality of assets,
safety and environmental impact. All the information is integrated in an information
system that allows people to access easily to data and work more on the level of
decision making, elaborating data and enabling decision. Also contractors can access
to PAM information systems but they cannot update or insert new information.
The estimates, updated every years, come from the experience of managers and
operators, suppliers and sophisticated analysis of historical data based on previous
projects.
Relating to the risk asset management, INFRAen uses standardized and certificated
process (as we said before, the NTA 8120 standard). In particular, within this process,
INFRAen considers different types of risks (operational risks to suppliers and financial-
stakeholders risks), in order to provide a support in the following activities / decisions:
plan maintenance program, target maintenance budget, identification of better options
(investment, repair,..), and also to provide a common communication tool.
The importance of risk analysis is understood by all the company within the strategic
and the tactical level, and the assessment considers both qualitative and quantitative
analysis. The results of the analysis are showed through the risk matrix, updated by the
board level that uses this tool also in order to explain the vision and the strategy of the
company; also a risk database in Microsoft Excel is updated by different departments.
Another important aspect concerns the sharing of the information with contractors. In
fact, within INFRAen, information from contractors are taken in consideration into the
risk analysis and contractors can easily access to risk database.
Last but not least, concerning aspects of maintenance management, INFRAen uses
both knowledge from experience (of operators and vendors) and sophisticated
quantitative tools in redefining preventive maintenance periods and making continuous
improvements. Indeed, it performs proactive maintenance: it is trying to standardize
TPM practices in the whole organization, and some assets are RCM driven, RCM
process are constantly improved according to the feedback coming from the process
quality measurements. For the other assets, RCM is performed only recording results
on Microsoft Excel databases.
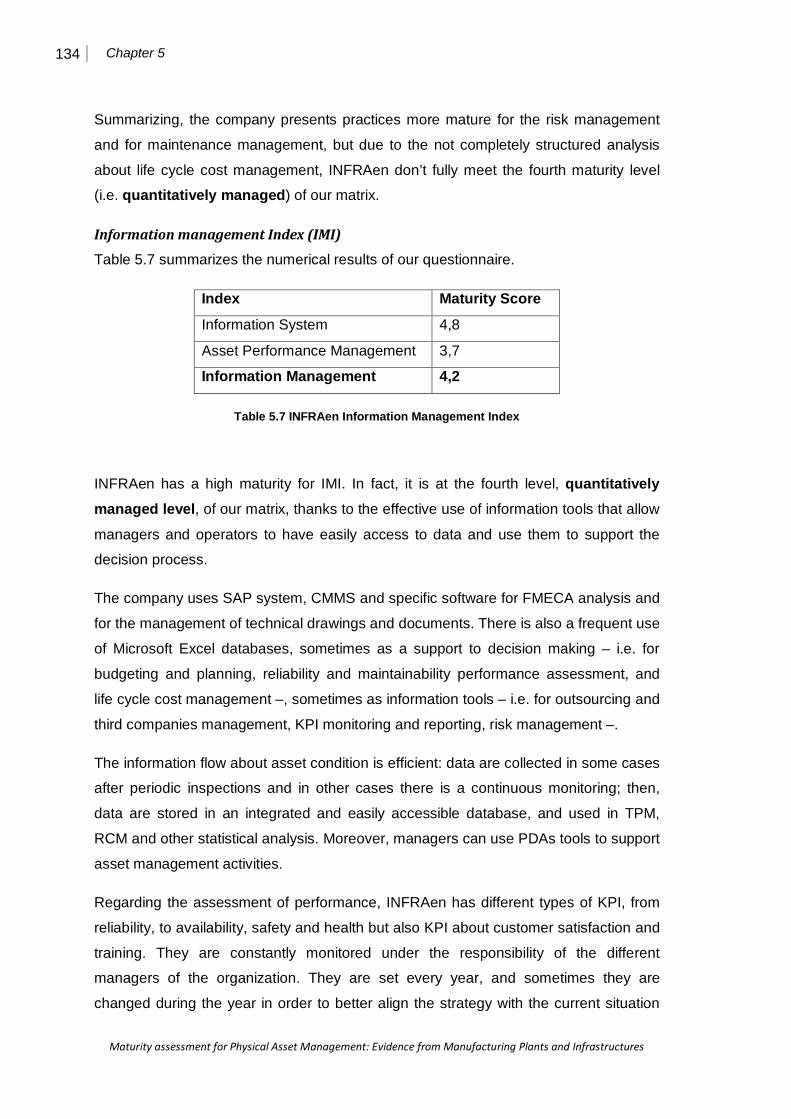
134 Chapter 5
Maturity assessment for Physical Asset Management: Evidence from Manufacturing Plants and Infrastructures
Summarizing, the company presents practices more mature for the risk management
and for maintenance management, but due to the not completely structured analysis
about life cycle cost management, INFRAen don’t fully meet the fourth maturity level
(i.e. quantitatively managed) of our matrix.
Information management Index (IMI)
Table 5.7 summarizes the numerical results of our questionnaire.
Index Maturity Score
Information System 4,8
Asset Performance Management 3,7
Information Management 4,2
Table 5.7 INFRAen Information Management Index
INFRAen has a high maturity for IMI. In fact, it is at the fourth level, quantitatively managed level, of our matrix, thanks to the effective use of information tools that allow
managers and operators to have easily access to data and use them to support the
decision process.
The company uses SAP system, CMMS and specific software for FMECA analysis and
for the management of technical drawings and documents. There is also a frequent use
of Microsoft Excel databases, sometimes as a support to decision making – i.e. for
budgeting and planning, reliability and maintainability performance assessment, and
life cycle cost management –, sometimes as information tools – i.e. for outsourcing and
third companies management, KPI monitoring and reporting, risk management –.
The information flow about asset condition is efficient: data are collected in some cases
after periodic inspections and in other cases there is a continuous monitoring; then,
data are stored in an integrated and easily accessible database, and used in TPM,
RCM and other statistical analysis. Moreover, managers can use PDAs tools to support
asset management activities.
Regarding the assessment of performance, INFRAen has different types of KPI, from
reliability, to availability, safety and health but also KPI about customer satisfaction and
training. They are constantly monitored under the responsibility of the different
managers of the organization. They are set every year, and sometimes they are
changed during the year in order to better align the strategy with the current situation
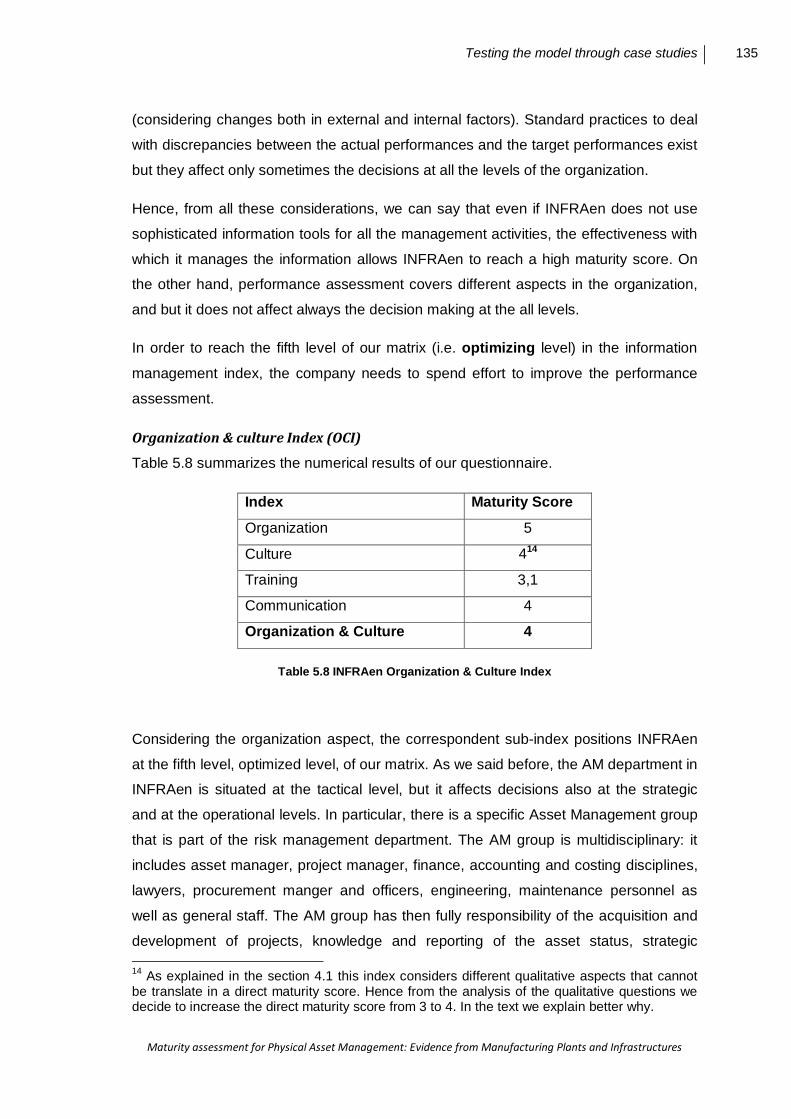
Testing the model through case studies 135
Maturity assessment for Physical Asset Management: Evidence from Manufacturing Plants and Infrastructures
(considering changes both in external and internal factors). Standard practices to deal
with discrepancies between the actual performances and the target performances exist
but they affect only sometimes the decisions at all the levels of the organization.
Hence, from all these considerations, we can say that even if INFRAen does not use
sophisticated information tools for all the management activities, the effectiveness with
which it manages the information allows INFRAen to reach a high maturity score. On
the other hand, performance assessment covers different aspects in the organization,
and but it does not affect always the decision making at the all levels.
In order to reach the fifth level of our matrix (i.e. optimizing level) in the information
management index, the company needs to spend effort to improve the performance
assessment.
Organization & culture Index (OCI)
Table 5.8 summarizes the numerical results of our questionnaire.
Index Maturity Score
Organization 5
Culture 414
Training 3,1
Communication 4
Organization & Culture 4
Table 5.8 INFRAen Organization & Culture Index
Considering the organization aspect, the correspondent sub-index positions INFRAen
at the fifth level, optimized level, of our matrix. As we said before, the AM department in
INFRAen is situated at the tactical level, but it affects decisions also at the strategic
and at the operational levels. In particular, there is a specific Asset Management group
that is part of the risk management department. The AM group is multidisciplinary: it
includes asset manager, project manager, finance, accounting and costing disciplines,
lawyers, procurement manger and officers, engineering, maintenance personnel as
well as general staff. The AM group has then fully responsibility of the acquisition and
development of projects, knowledge and reporting of the asset status, strategic 14 As explained in the section 4.1 this index considers different qualitative aspects that cannot be translate in a direct maturity score. Hence from the analysis of the qualitative questions we decide to increase the direct maturity score from 3 to 4. In the text we explain better why.
136 Chapter 5
Maturity assessment for Physical Asset Management: Evidence from Manufacturing Plants and Infrastructures
assessment and development. It also contributes to the achievement of the results in
in-service logistic support and procurement and in sustainable development. So we can
say that the AM department contributes to a large number of projects and has relations
with almost all the other departments. In particular for the development of new projects
the AM group has to deal with the other departments, such as finance, procurement...
in order to understand which can be the possible consequences and to identify the best
option.
Regarding the culture aspect, we have to do some considerations. If we consider only
the questions related to the maturity score, we know that goals and policies of AM are
defined by the board of directors, basing the strategy on the performances achieved in
the previous year at the operational level. There is then a job description for people
belonging the AM group, although this description is not particularly clear in all the
aspects.
From these answers the maturity score should be 3 (defined level, being “AM one of
the goal of the organization”). However, from the qualitative questions not associated to
maturity score, we know that policies are explained in a clear and effective way, though
different types of supports such as written documents, events and people. Workers are
open to changes and try to give new ideas encouraging by the organization. Also the
respondent points out that INFRAen spends a lot of effort in developing a share asset
management culture as “AM is one of the main goals of the organization”. Hence from
these considerations, we rescale the maturity assessment, assigning the maturity score
4 to the culture index (quantitatively managed level).
For what concern the training aspect, the company understands the importance of
training and provides enough money, but even if there is a plan for provision AM
knowledge and skills, it is not always respected. Moreover, in some skills such as
CMMS and enterprise system, maintenance engineering, health and safety, training is
only occasional; while for managers training on life cycle cost management is only
initial: it is worth underlining that this aspect is clearly linked with the low maturity of the
company in the LCC analysis, as we discussed in the first section (i.e. for what concern
maturity in MDI). For all these reasons, training results at third level (defined level) of
our maturity matrix.
Last but not least. INFRAen recognized the need of communication inside the AM
group and between the AM group and other departments, both through informal and
formal channel. Regarding the formal communication, it has written procedures that

Testing the model through case studies 137
Maturity assessment for Physical Asset Management: Evidence from Manufacturing Plants and Infrastructures
are continually improved. The AM group also organizes once a month meeting to
discuss issues about AM decisions. For all these reasons, communication results at
fourth level (quantitatively managed) of our maturity matrix.
Summarizing, we can say that AM is part of the organizational culture, but there are
some deficiencies, such as the absence of a clear job description or the lack of a
structured and efficient plan for training. These are some reasons for not allowing the
company to reach the fifth level of maturity of our matrix, while achieving certainly the
fourth (quantitatively managed).
External coordination Index (ECI)
Table 5.9 summarizes the numerical results of our questionnaire.
Index Maturity Score
Regulators 5
Sustainability 5
Outsourcing 4,4
External Coordination 4,7
Table 5.9 INFRAen External Coordination Index
For the service delivered, electricity and gas distribution, INFRAen has to deal with a
lot of regulatory requirements which change during the time. In order to fulfill these
requirements, understand possible future requirements and consequently define the
best strategy, the company tries constantly to interact with regulators.
Sustainability is one of the main goals of the company. INFRAen is developing projects
to reduce maintenance costs, environmental impact, energy consumption, improve
working condition and support improvement.
For what concern outsourcing, INFRAen has only one direct contractor which in turn
outsourced services and has different contractors. Depending on the assets, then
maintenance, design and construction are done by INFRAen or are outsourced. The
maintenance service providers offer different services such as:
• assistance in defining product specification;
• assistance during the installation and commissioning phase, field service;
• expert assistance for at site diagnostics and repairing;

138 Chapter 5
Maturity assessment for Physical Asset Management: Evidence from Manufacturing Plants and Infrastructures
• help desk, on line support and telephone support;
• logistic support optimization;
• IT tools.
Hence the service providers interact during the whole life cycle of the assets from the
design to the operational phase. As we said before, within the IMI analysis, INFRAen
knows the importance of sharing information with third parties; in fact it is trying to
create an integrated database, easily accessible for both parts. However we have to
note that there are still some parts of the shared database that contractors cannot
update.
The high maturity of the company for outsourcing can be seen also by the periodical
and standardized analysis, developed about contractor risks, and by the continuous
monitoring of the contractors performances: to this last regard, it is worth underlining
that Service Level agreement contracts are used to make the control more effective
and efficient.
Globally, the ECI is close to reach the best level of maturity, i.e. optimized level of our
matrix.
INFRAen maturity
The maturity of INFRAen in the asset management practices is quite high, on the
average it is at the fourth level of our matrix: this means that the process are
quantitatively managed in accordance with agreed –upon metrics. In some aspects, the
company is also trying to increase its maturity, applying the principle of the continuous
improvement, hence reaching as a result the fifth level, optimized level, of our maturity
matrix.
The Table 5.10 shows all the indexes and resumes the maturity of INFRAen.
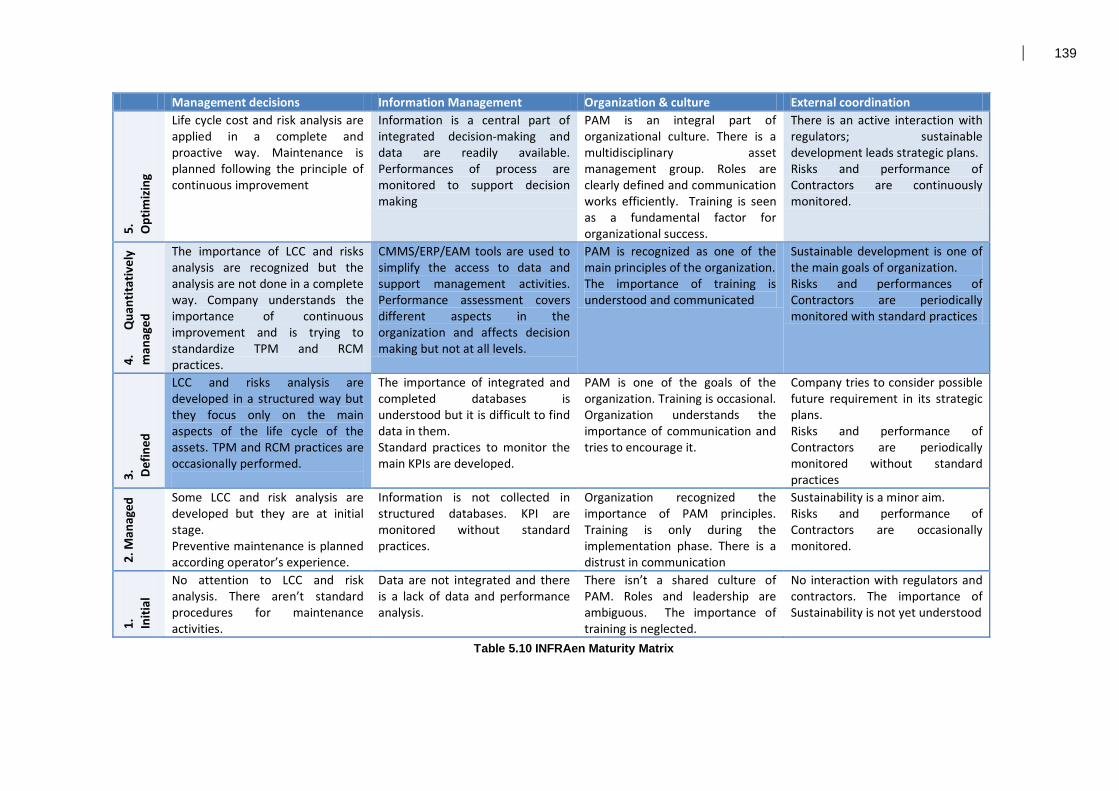
139
Management decisions Information Management Organization & culture External coordination
5.
Opt
imiz
ing
Life cycle cost and risk analysis are applied in a complete and proactive way. Maintenance is planned following the principle of continuous improvement
Information is a central part of integrated decision-making and data are readily available. Performances of process are monitored to support decision making
PAM is an integral part of organizational culture. There is a multidisciplinary asset management group. Roles are clearly defined and communication works efficiently. Training is seen as a fundamental factor for organizational success.
There is an active interaction with regulators; sustainable development leads strategic plans. Risks and performance of Contractors are continuously monitored.
4.
Qua
ntita
tivel
y m
anag
ed
The importance of LCC and risks analysis are recognized but the analysis are not done in a complete way. Company understands the importance of continuous improvement and is trying to standardize TPM and RCM practices.
CMMS/ERP/EAM tools are used to simplify the access to data and support management activities. Performance assessment covers different aspects in the organization and affects decision making but not at all levels.
PAM is recognized as one of the main principles of the organization. The importance of training is understood and communicated
Sustainable development is one of the main goals of organization. Risks and performances of Contractors are periodically monitored with standard practices
3.
Def
ined
LCC and risks analysis are developed in a structured way but they focus only on the main aspects of the life cycle of the assets. TPM and RCM practices are occasionally performed.
The importance of integrated and completed databases is understood but it is difficult to find data in them. Standard practices to monitor the main KPIs are developed.
PAM is one of the goals of the organization. Training is occasional. Organization understands the importance of communication and tries to encourage it.
Company tries to consider possible future requirement in its strategic plans. Risks and performance of Contractors are periodically monitored without standard practices
2. M
anag
ed Some LCC and risk analysis are
developed but they are at initial stage. Preventive maintenance is planned according operator’s experience.
Information is not collected in structured databases. KPI are monitored without standard practices.
Organization recognized the importance of PAM principles. Training is only during the implementation phase. There is a distrust in communication
Sustainability is a minor aim. Risks and performance of Contractors are occasionally monitored.
1.
Initi
al
No attention to LCC and risk analysis. There aren’t standard procedures for maintenance activities.
Data are not integrated and there is a lack of data and performance analysis.
There isn’t a shared culture of PAM. Roles and leadership are ambiguous. The importance of training is neglected.
No interaction with regulators and contractors. The importance of Sustainability is not yet understood
Table 5.10 INFRAen Maturity Matrix

140 Chapter 5
Maturity assessment for Physical Asset Management: Evidence from Manufacturing Plants and Infrastructures
5.2.2 INFRAwt
INFRAwt is the Water Company in the area of Amsterdam and surroundings. It
supplies drinking water from the tap, and ensures the discharge of waste water,
maintains the water level and keeps the surface water clean.
The company is not following any standards about asset management practices, but it
wants to introduce soon the PAS 55.
In the following sections we will go in depth in the assessment of the four aspects of
our matrix.
Management Decisions Index (MDI)
The Table 5.11 summarizes the numerical results of our questionnaire.
Index Maturity Score
Asset Life Cycle Management 2,1
Asset Risk Management 3,3
Maintenance Management 3
Management Decisions 2,8
Table 5.11 INFRAwt Management Decision Index
An in depth in the three aspects is needed to motivate the scores so far achieved.
Life cycle costs analysis are used for different purposes in INFRAwt, such as: as a
support in acquisition and development of projects and in the evaluation of investment
options; for design, retrofitting and optimization of system; for planning maintenance
programs.
Considering the type of costs taken into consideration by the firm, at a first sight it
seems that the LCC analysis is quite complete. Going more in depth, while trying to
understand why the maturity of the company in this column is so low, the situation that
emerges is that INFRAwt considers different types of costs and voices of effectiveness,
but these data are not collected with a constant frequency and in a structured way.
Moreover, the information system is not integrated, data are dispersed and there is not
the sharing of databases about life cycle costs with contractors. Instead of this,
contractors have to deliver information to the project leader, who later will update them
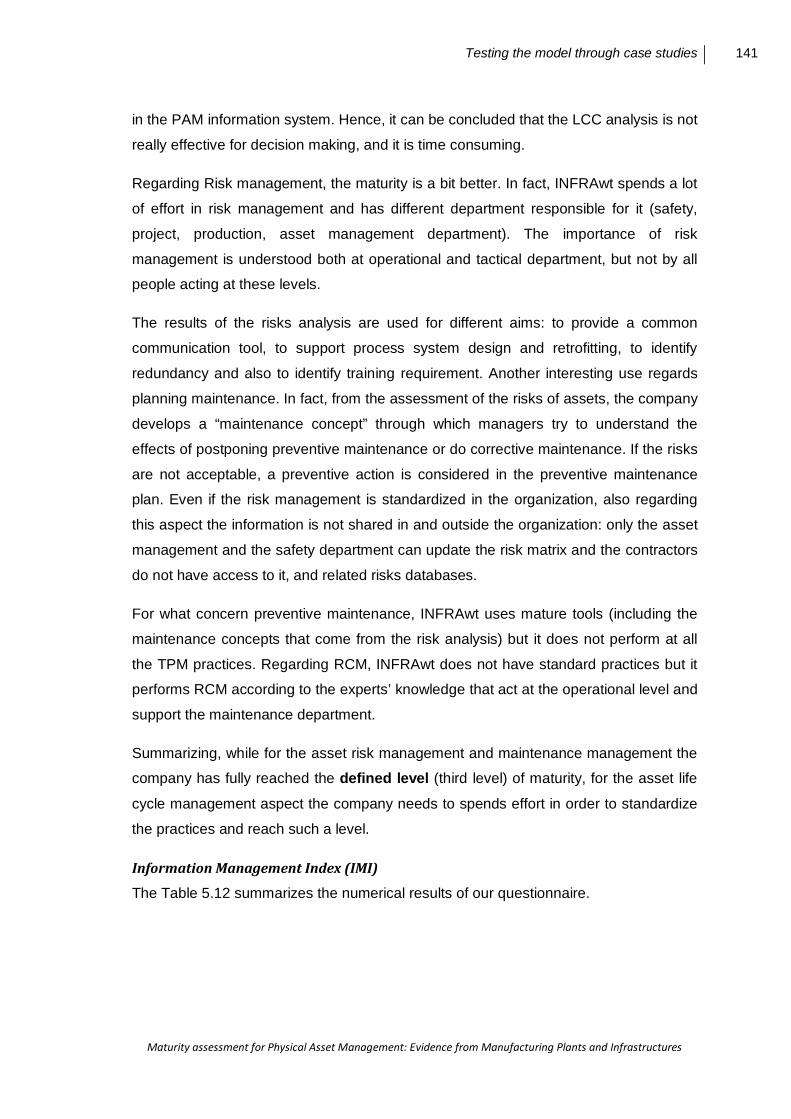
Testing the model through case studies 141
Maturity assessment for Physical Asset Management: Evidence from Manufacturing Plants and Infrastructures
in the PAM information system. Hence, it can be concluded that the LCC analysis is not
really effective for decision making, and it is time consuming.
Regarding Risk management, the maturity is a bit better. In fact, INFRAwt spends a lot
of effort in risk management and has different department responsible for it (safety,
project, production, asset management department). The importance of risk
management is understood both at operational and tactical department, but not by all
people acting at these levels.
The results of the risks analysis are used for different aims: to provide a common
communication tool, to support process system design and retrofitting, to identify
redundancy and also to identify training requirement. Another interesting use regards
planning maintenance. In fact, from the assessment of the risks of assets, the company
develops a “maintenance concept” through which managers try to understand the
effects of postponing preventive maintenance or do corrective maintenance. If the risks
are not acceptable, a preventive action is considered in the preventive maintenance
plan. Even if the risk management is standardized in the organization, also regarding
this aspect the information is not shared in and outside the organization: only the asset
management and the safety department can update the risk matrix and the contractors
do not have access to it, and related risks databases.
For what concern preventive maintenance, INFRAwt uses mature tools (including the
maintenance concepts that come from the risk analysis) but it does not perform at all
the TPM practices. Regarding RCM, INFRAwt does not have standard practices but it
performs RCM according to the experts’ knowledge that act at the operational level and
support the maintenance department.
Summarizing, while for the asset risk management and maintenance management the
company has fully reached the defined level (third level) of maturity, for the asset life
cycle management aspect the company needs to spends effort in order to standardize
the practices and reach such a level.
Information Management Index (IMI)
The Table 5.12 summarizes the numerical results of our questionnaire.
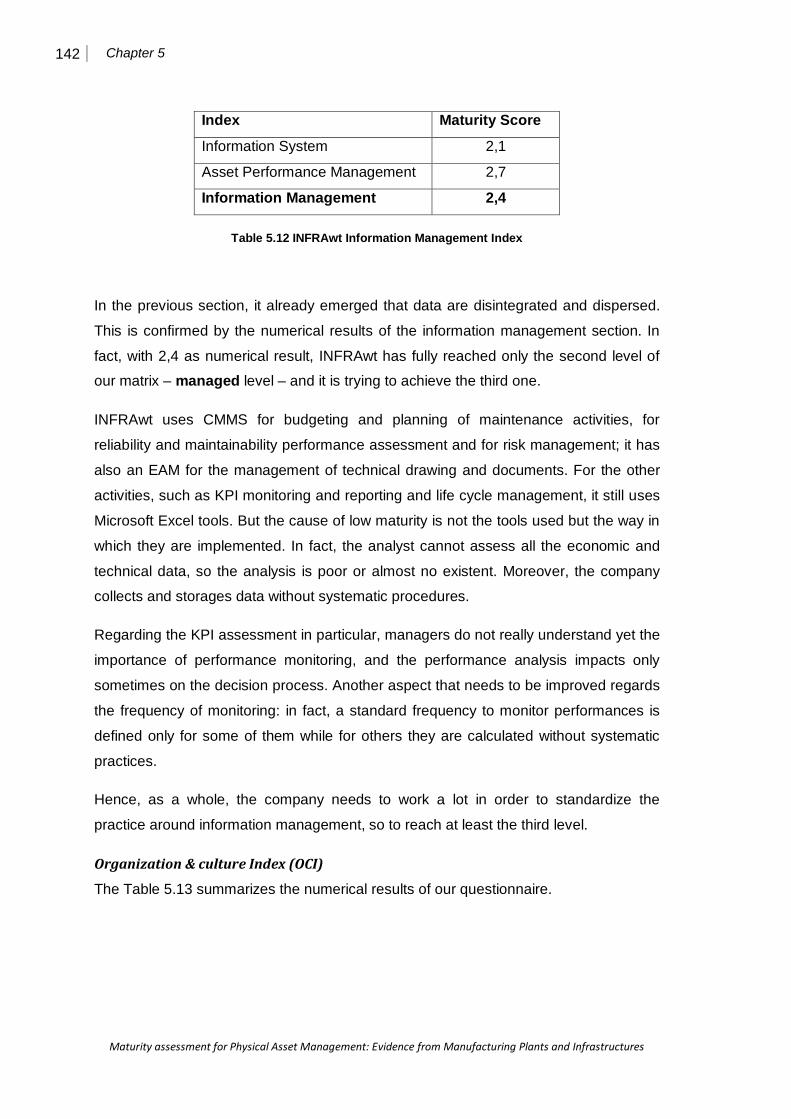
142 Chapter 5
Maturity assessment for Physical Asset Management: Evidence from Manufacturing Plants and Infrastructures
Index Maturity Score
Information System 2,1
Asset Performance Management 2,7
Information Management 2,4
Table 5.12 INFRAwt Information Management Index
In the previous section, it already emerged that data are disintegrated and dispersed.
This is confirmed by the numerical results of the information management section. In
fact, with 2,4 as numerical result, INFRAwt has fully reached only the second level of
our matrix – managed level – and it is trying to achieve the third one.
INFRAwt uses CMMS for budgeting and planning of maintenance activities, for
reliability and maintainability performance assessment and for risk management; it has
also an EAM for the management of technical drawing and documents. For the other
activities, such as KPI monitoring and reporting and life cycle management, it still uses
Microsoft Excel tools. But the cause of low maturity is not the tools used but the way in
which they are implemented. In fact, the analyst cannot assess all the economic and
technical data, so the analysis is poor or almost no existent. Moreover, the company
collects and storages data without systematic procedures.
Regarding the KPI assessment in particular, managers do not really understand yet the
importance of performance monitoring, and the performance analysis impacts only
sometimes on the decision process. Another aspect that needs to be improved regards
the frequency of monitoring: in fact, a standard frequency to monitor performances is
defined only for some of them while for others they are calculated without systematic
practices.
Hence, as a whole, the company needs to work a lot in order to standardize the
practice around information management, so to reach at least the third level.
Organization & culture Index (OCI)
The Table 5.13 summarizes the numerical results of our questionnaire.

Testing the model through case studies 143
Maturity assessment for Physical Asset Management: Evidence from Manufacturing Plants and Infrastructures
Index Maturity Score
Organization 2,5
Culture 315
Training 3
Communication 4,5
Organization & Culture Index 3,25
Table 5.13 INFRAwt Organization & Culture Index
For what concern the organization, even if asset management is one of the goal of
INFRAwt strategy, it is not in placed at the strategic level and it is only in part of the
operational level. There is an AM group but only the asset manager and maintenance
personnel are taking part of it. This small group (not multidisciplinary as should be)
contributes to the achievement of the results in the acquisition or development of
projects, in organization wide asset systems and practices, in asset status knowledge,
reporting and sustainable development, without being fully responsible for these
activities.
Looking at culture aspect, policies and goals are defined through a shared (very long)
process. The organization tries to explain them in a clear way, but they are not always
understood at the all levels of the organization (supports exist, such as documents,
events and people but they are not so efficient in achieving results). Workers are not
open to changes, maybe because also organization does not motivates them to
changes.
For what concern training, there is no plan for provision of AM skills, and training is just
occasional, being only training about health and safety a permanent issue.
The need of communication is well understood by the company, that tries to encourage
it also through informal channels.
As a whole, OCI reaches a defined level of maturity, mainly because of weaknesses in
the organization aspect. It is worth underlining that communication is not aligned with
the actual level reached by other aspects, being – we can say – “oversized” with
respect to them.
15 As for INFRAen, the numerical result is modified. In this case, the maturity score (4) is decreased.
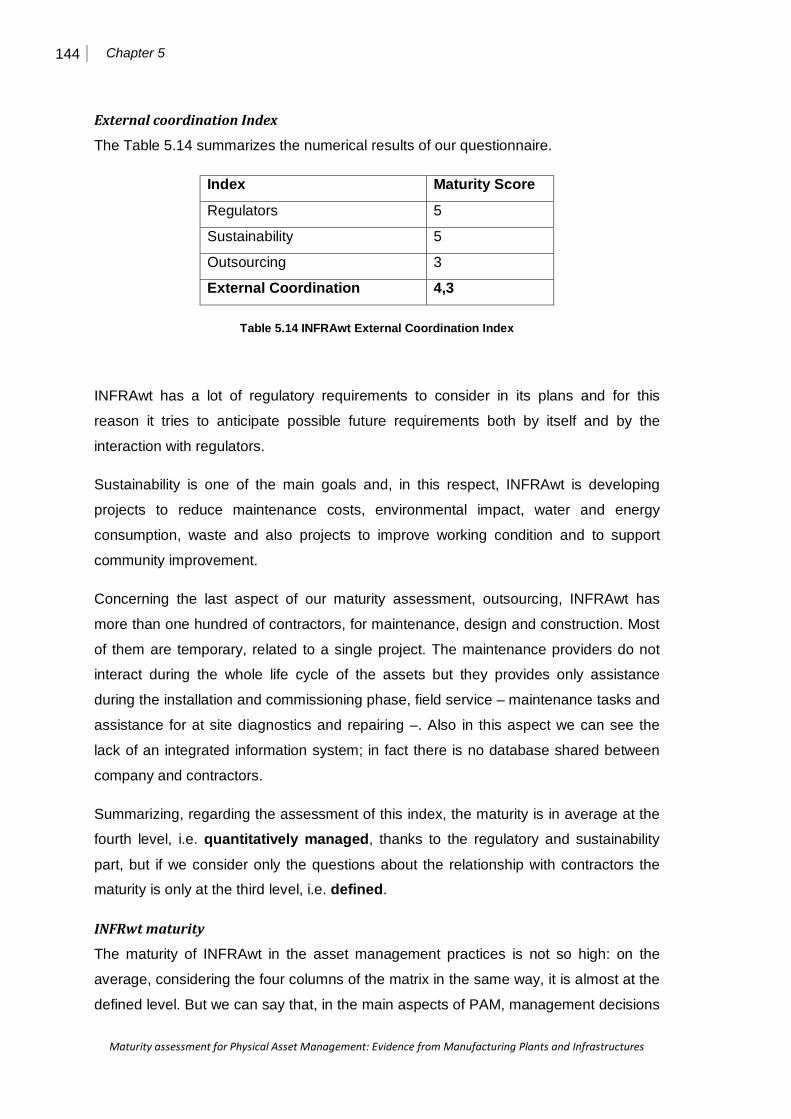
144 Chapter 5
Maturity assessment for Physical Asset Management: Evidence from Manufacturing Plants and Infrastructures
External coordination Index
The Table 5.14 summarizes the numerical results of our questionnaire.
Index Maturity Score
Regulators 5
Sustainability 5
Outsourcing 3
External Coordination 4,3
Table 5.14 INFRAwt External Coordination Index
INFRAwt has a lot of regulatory requirements to consider in its plans and for this
reason it tries to anticipate possible future requirements both by itself and by the
interaction with regulators.
Sustainability is one of the main goals and, in this respect, INFRAwt is developing
projects to reduce maintenance costs, environmental impact, water and energy
consumption, waste and also projects to improve working condition and to support
community improvement.
Concerning the last aspect of our maturity assessment, outsourcing, INFRAwt has
more than one hundred of contractors, for maintenance, design and construction. Most
of them are temporary, related to a single project. The maintenance providers do not
interact during the whole life cycle of the assets but they provides only assistance
during the installation and commissioning phase, field service – maintenance tasks and
assistance for at site diagnostics and repairing –. Also in this aspect we can see the
lack of an integrated information system; in fact there is no database shared between
company and contractors.
Summarizing, regarding the assessment of this index, the maturity is in average at the
fourth level, i.e. quantitatively managed, thanks to the regulatory and sustainability
part, but if we consider only the questions about the relationship with contractors the
maturity is only at the third level, i.e. defined.
INFRwt maturity
The maturity of INFRAwt in the asset management practices is not so high: on the
average, considering the four columns of the matrix in the same way, it is almost at the
defined level. But we can say that, in the main aspects of PAM, management decisions

Testing the model through case studies 145
Maturity assessment for Physical Asset Management: Evidence from Manufacturing Plants and Infrastructures
and information management, the maturity is still weak, being at the second level of our
maturity matrix (managed): so INFRAwt needs to work hard in trying to improve its
asset management process.
The Table 5.15 resumes the maturity levels of INFRAwt.

146
Management decisions Information Management Organization & culture External coordination 5.
O
ptim
izin
g Life cycle cost and risk analysis are applied in a complete and proactive way. Maintenance is planned following the principle of continuous improvement
Information is a central part of integrated decision-making and data are readily available. Performances of process are monitored to support decision making
PAM is an integral part of organizational culture. There is a multidisciplinary asset management group. Roles are clearly defined and communication works efficiently. Training is seen as a fundamental factor for organizational success.
There is an active interaction with regulators; sustainable development leads strategic plans. Risks and performance of Contractors are continuously monitored.
4.
Qua
ntita
tivel
y m
anag
ed
The importance of LCC and risks analysis are recognized but the analysis are not done in a complete way. Company understands the importance of continuous improvement and is trying to standardize TPM and RCM practices.
CMMS/ERP/EAM tools are used to simplify the access to data and support management activities. Performance assessment covers different aspect in the organization and affects decision making but not at all levels.
PAM is recognized as one of the main principles of the organization. The importance of training is understood and communicated
Sustainable development is one of the main goals of organization. Risks and performances of Contractors are periodically monitored with standard practices
3.
Def
ined
LCC and risks analysis are developed in a structured way but they focus only on the main aspects of the life cycle of the assets. TPM and RCM practices are occasionally performed.
The importance of integrated and completed databases is understood but it is difficult to find data in them. Standard practices to monitor the main KPIs are developed.
PAM is one of the goals of the organization. Training is occasional. Organization understands the importance of communication and tries to encourage it.
Company tries to consider possible future requirement in its strategic plans. Risks and performance of Contractors are periodically monitored without standard practices
2. M
anag
ed Some LCC and risk analysis are
developed but they are at initial stage. Preventive maintenance is planned according to operator’s experience.
Information is not collected in structured databases. KPI are monitored without standard practices.
Organization recognized the importance of PAM principles. Training is only during the implementation phase. There is a distrust in communication
Sustainability is a minor aim. Risks and performance of Contractors are occasionally monitored.
1.
Initi
al
No attention to LCC and risk analysis. There aren’t standard procedures for maintenance activities.
Data are not integrated and there is a lack of data and performance analysis.
There isn’t a shared culture of PAM. Roles and leadership are ambiguous. The importance of training is neglected.
No interaction with regulators and contractors. The importance of Sustainability is not yet understood
Table 5.15 INFRAwt Maturity Matrix
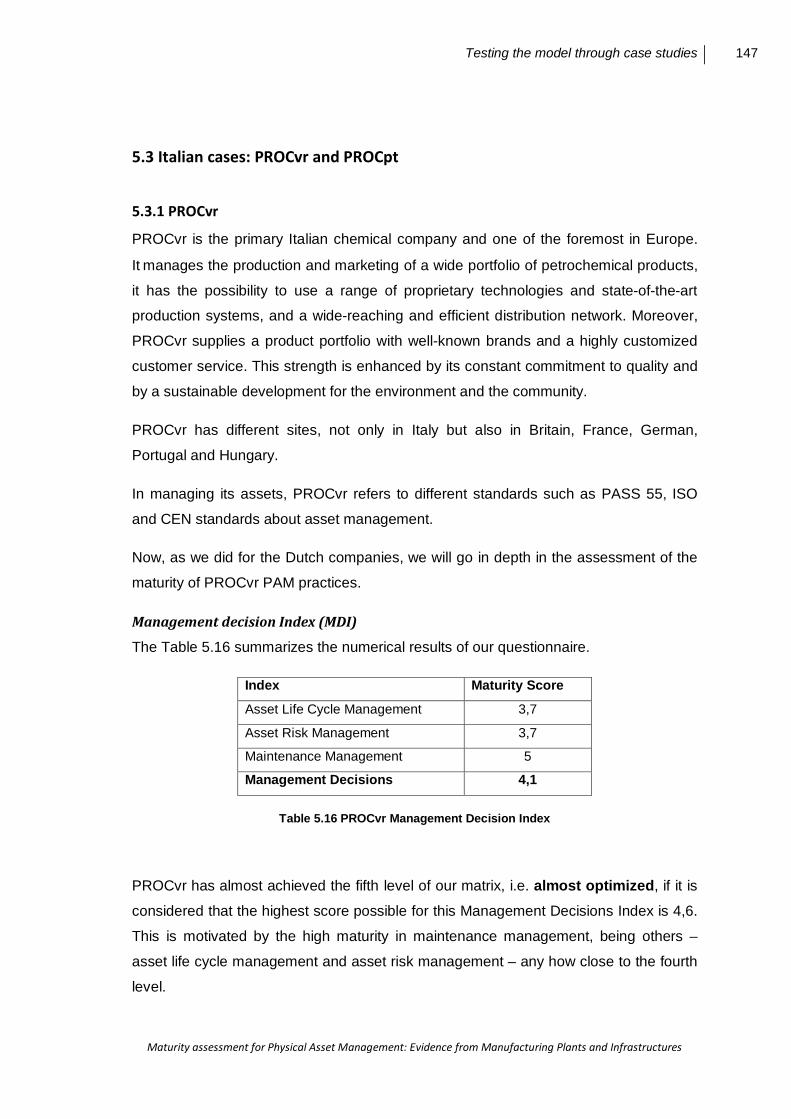
Testing the model through case studies 147
Maturity assessment for Physical Asset Management: Evidence from Manufacturing Plants and Infrastructures
5.3 Italian cases: PROCvr and PROCpt
5.3.1 PROCvr
PROCvr is the primary Italian chemical company and one of the foremost in Europe.
It manages the production and marketing of a wide portfolio of petrochemical products,
it has the possibility to use a range of proprietary technologies and state-of-the-art
production systems, and a wide-reaching and efficient distribution network. Moreover,
PROCvr supplies a product portfolio with well-known brands and a highly customized
customer service. This strength is enhanced by its constant commitment to quality and
by a sustainable development for the environment and the community.
PROCvr has different sites, not only in Italy but also in Britain, France, German,
Portugal and Hungary.
In managing its assets, PROCvr refers to different standards such as PASS 55, ISO
and CEN standards about asset management.
Now, as we did for the Dutch companies, we will go in depth in the assessment of the
maturity of PROCvr PAM practices.
Management decision Index (MDI)
The Table 5.16 summarizes the numerical results of our questionnaire.
Index Maturity Score
Asset Life Cycle Management 3,7
Asset Risk Management 3,7
Maintenance Management 5
Management Decisions 4,1
Table 5.16 PROCvr Management Decision Index
PROCvr has almost achieved the fifth level of our matrix, i.e. almost optimized, if it is
considered that the highest score possible for this Management Decisions Index is 4,6.
This is motivated by the high maturity in maintenance management, being others –
asset life cycle management and asset risk management – any how close to the fourth
level.
148 Chapter 5
Maturity assessment for Physical Asset Management: Evidence from Manufacturing Plants and Infrastructures
In managing its assets, PROCvr tries to understand the impact of the present decisions
on the whole life cycle of the assets. To this end, Life cycle costs (LCC) analysis are
completed and structured, and they consider also aspects related to the efficiency
(failures, reliability, capacity, quality,...). The importance of these analysis is understood
by all the people who act on a tactical/planning level, but only by part of the people who
act on the operational level. Thanks to an integrated information system, people work
more at the level of decision making and the results of costs analysis are used for
different purposes in asset management decision making, such as: to support
acquisition and development of projects; to support process system design, for
retrofitting/optimization; to identify better investment options and redundancy in the
system, and to plan maintenance programs.
There are persons from more enterprise functions (R&D, maintenance, engineering
and technology) with the organizational duty to fill the data/information on the
information systems, and they have also to update the information delivered from
contractors.
Estimates, used in LCC analysis, are updated every year, and come from experience
of managers, operators, project team, suppliers, analysis of historical data but also
from more sophisticated tools like parametric techniques based on statistical-
distribution analysis of historic databases, and quantitative models developed in order
to take into account the random/stochastic nature of events and relying on the use of
specialized statistical techniques to “simulate” future decisions.
The high maturity of the company is confirmed also by the answers in the risk asset
management section. In fact, risk analysis are developed considering several kind of
risks (operational, financial, environmental, reputational, supplier...), and they are done
in standardized way. The results of risk management analysis are used to provide a
common communication tool; to support process system design/retrofitting; to identify
better investment options, and redundancy in the systems; for spare parts and training
requirements; to plan maintenance programs; to quantify maintenance commitment
CSFs (critical success factors) and KPIs (Key Performance Indicators); to provide a
basis for system modeling and, last but not least, to define the insurance premium.
The company spends a lot of effort in risk management: its importance is understood
by the asset management team, by the safety department, by part of the people who
act on the operational level and by part of people at the tactical level. The industrial
direction is the function responsible for risk analysis, but there are also other functions
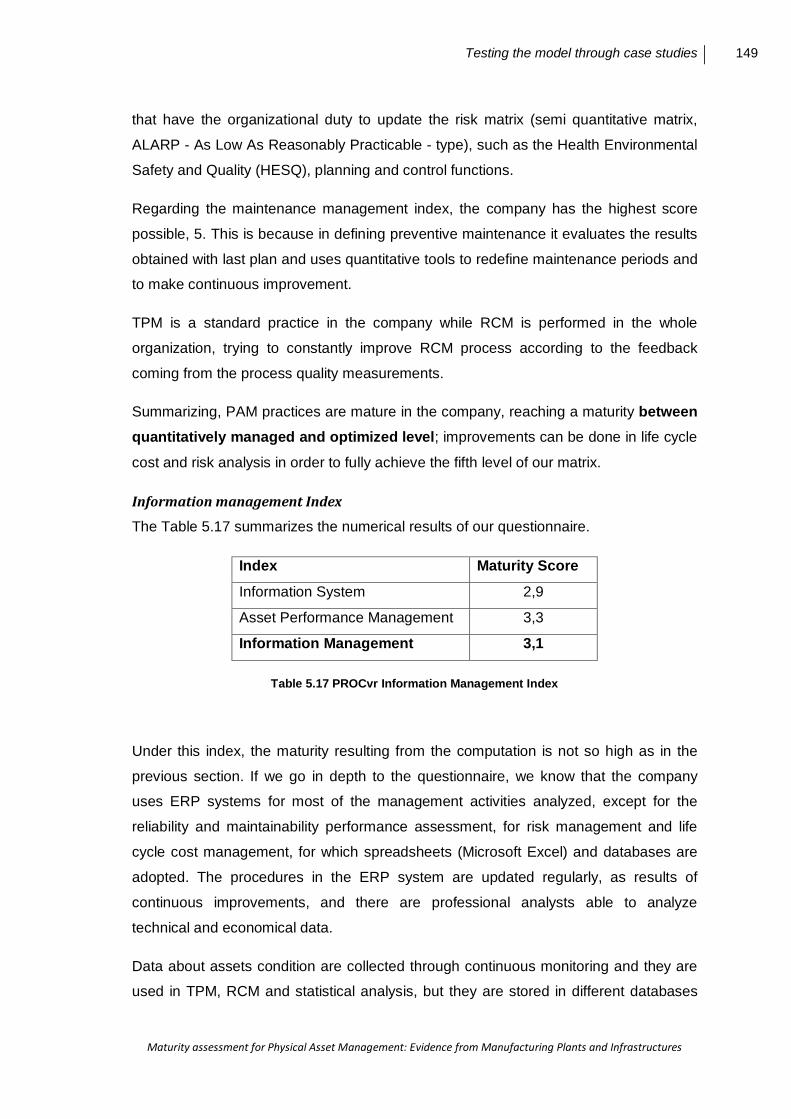
Testing the model through case studies 149
Maturity assessment for Physical Asset Management: Evidence from Manufacturing Plants and Infrastructures
that have the organizational duty to update the risk matrix (semi quantitative matrix,
ALARP - As Low As Reasonably Practicable - type), such as the Health Environmental
Safety and Quality (HESQ), planning and control functions.
Regarding the maintenance management index, the company has the highest score
possible, 5. This is because in defining preventive maintenance it evaluates the results
obtained with last plan and uses quantitative tools to redefine maintenance periods and
to make continuous improvement.
TPM is a standard practice in the company while RCM is performed in the whole
organization, trying to constantly improve RCM process according to the feedback
coming from the process quality measurements.
Summarizing, PAM practices are mature in the company, reaching a maturity between
quantitatively managed and optimized level; improvements can be done in life cycle
cost and risk analysis in order to fully achieve the fifth level of our matrix.
Information management Index
The Table 5.17 summarizes the numerical results of our questionnaire.
Index Maturity Score
Information System 2,9
Asset Performance Management 3,3
Information Management 3,1
Table 5.17 PROCvr Information Management Index
Under this index, the maturity resulting from the computation is not so high as in the
previous section. If we go in depth to the questionnaire, we know that the company
uses ERP systems for most of the management activities analyzed, except for the
reliability and maintainability performance assessment, for risk management and life
cycle cost management, for which spreadsheets (Microsoft Excel) and databases are
adopted. The procedures in the ERP system are updated regularly, as results of
continuous improvements, and there are professional analysts able to analyze
technical and economical data.
Data about assets condition are collected through continuous monitoring and they are
used in TPM, RCM and statistical analysis, but they are stored in different databases
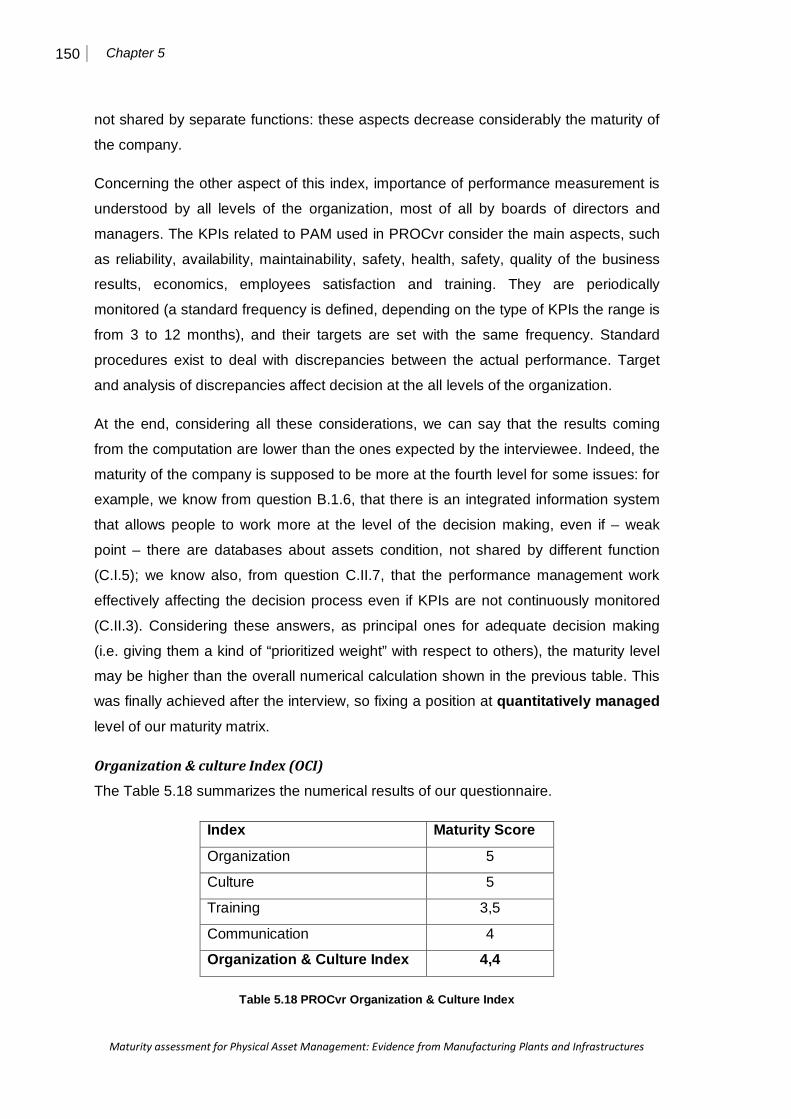
150 Chapter 5
Maturity assessment for Physical Asset Management: Evidence from Manufacturing Plants and Infrastructures
not shared by separate functions: these aspects decrease considerably the maturity of
the company.
Concerning the other aspect of this index, importance of performance measurement is
understood by all levels of the organization, most of all by boards of directors and
managers. The KPIs related to PAM used in PROCvr consider the main aspects, such
as reliability, availability, maintainability, safety, health, safety, quality of the business
results, economics, employees satisfaction and training. They are periodically
monitored (a standard frequency is defined, depending on the type of KPIs the range is
from 3 to 12 months), and their targets are set with the same frequency. Standard
procedures exist to deal with discrepancies between the actual performance. Target
and analysis of discrepancies affect decision at the all levels of the organization.
At the end, considering all these considerations, we can say that the results coming
from the computation are lower than the ones expected by the interviewee. Indeed, the
maturity of the company is supposed to be more at the fourth level for some issues: for
example, we know from question B.1.6, that there is an integrated information system
that allows people to work more at the level of the decision making, even if – weak
point – there are databases about assets condition, not shared by different function
(C.I.5); we know also, from question C.II.7, that the performance management work
effectively affecting the decision process even if KPIs are not continuously monitored
(C.II.3). Considering these answers, as principal ones for adequate decision making
(i.e. giving them a kind of “prioritized weight” with respect to others), the maturity level
may be higher than the overall numerical calculation shown in the previous table. This
was finally achieved after the interview, so fixing a position at quantitatively managed
level of our maturity matrix.
Organization & culture Index (OCI)
The Table 5.18 summarizes the numerical results of our questionnaire.
Index Maturity Score
Organization 5
Culture 5
Training 3,5
Communication 4
Organization & Culture Index 4,4
Table 5.18 PROCvr Organization & Culture Index
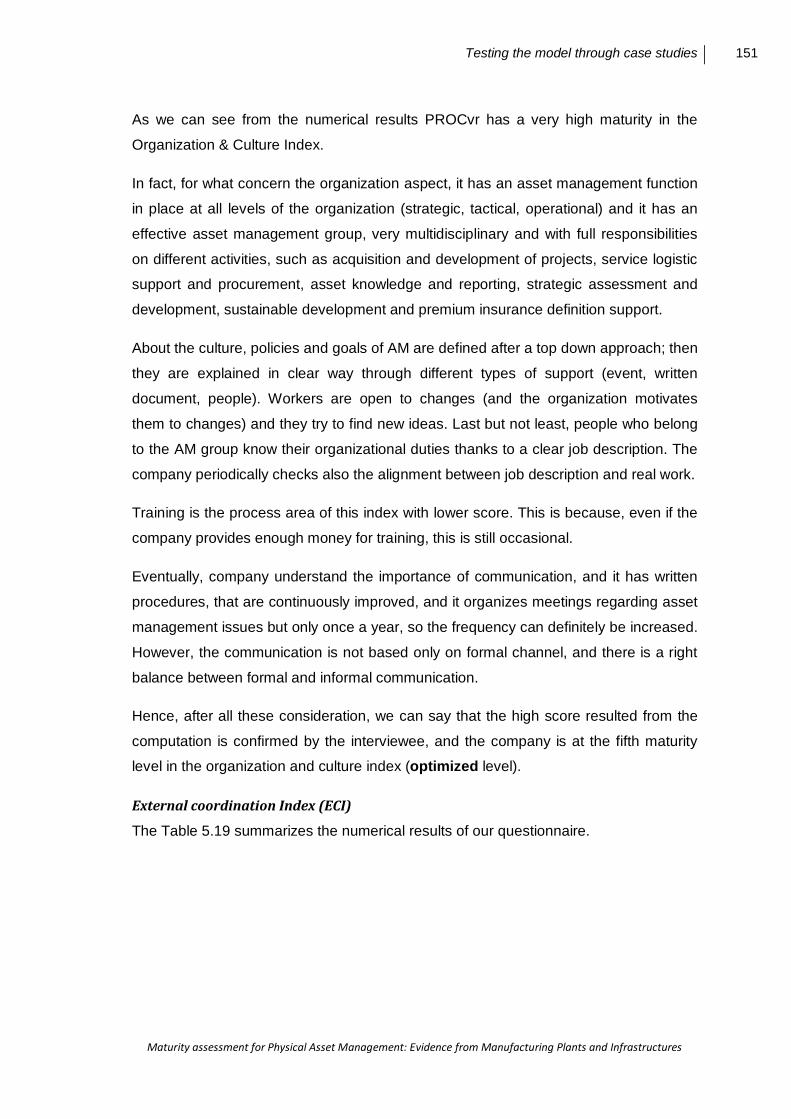
Testing the model through case studies 151
Maturity assessment for Physical Asset Management: Evidence from Manufacturing Plants and Infrastructures
As we can see from the numerical results PROCvr has a very high maturity in the
Organization & Culture Index.
In fact, for what concern the organization aspect, it has an asset management function
in place at all levels of the organization (strategic, tactical, operational) and it has an
effective asset management group, very multidisciplinary and with full responsibilities
on different activities, such as acquisition and development of projects, service logistic
support and procurement, asset knowledge and reporting, strategic assessment and
development, sustainable development and premium insurance definition support.
About the culture, policies and goals of AM are defined after a top down approach; then
they are explained in clear way through different types of support (event, written
document, people). Workers are open to changes (and the organization motivates
them to changes) and they try to find new ideas. Last but not least, people who belong
to the AM group know their organizational duties thanks to a clear job description. The
company periodically checks also the alignment between job description and real work.
Training is the process area of this index with lower score. This is because, even if the
company provides enough money for training, this is still occasional.
Eventually, company understand the importance of communication, and it has written
procedures, that are continuously improved, and it organizes meetings regarding asset
management issues but only once a year, so the frequency can definitely be increased.
However, the communication is not based only on formal channel, and there is a right
balance between formal and informal communication.
Hence, after all these consideration, we can say that the high score resulted from the
computation is confirmed by the interviewee, and the company is at the fifth maturity
level in the organization and culture index (optimized level).
External coordination Index (ECI)
The Table 5.19 summarizes the numerical results of our questionnaire.
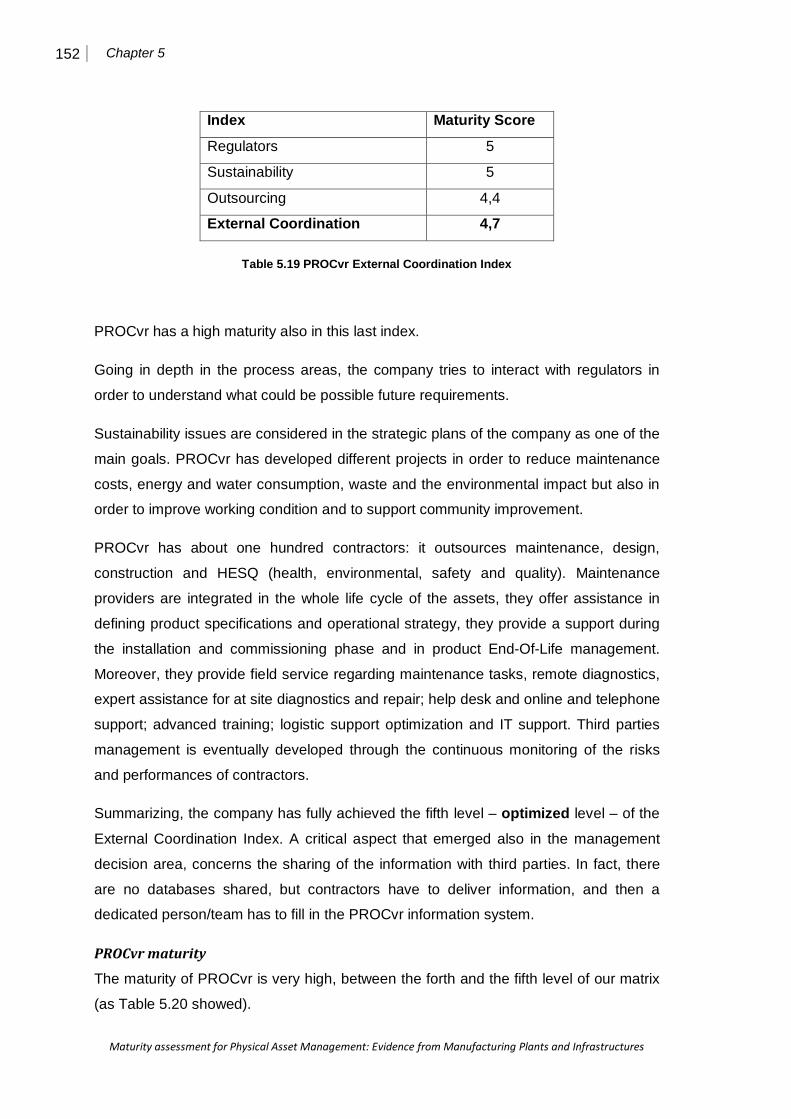
152 Chapter 5
Maturity assessment for Physical Asset Management: Evidence from Manufacturing Plants and Infrastructures
Index Maturity Score
Regulators 5
Sustainability 5
Outsourcing 4,4
External Coordination 4,7
Table 5.19 PROCvr External Coordination Index
PROCvr has a high maturity also in this last index.
Going in depth in the process areas, the company tries to interact with regulators in
order to understand what could be possible future requirements.
Sustainability issues are considered in the strategic plans of the company as one of the
main goals. PROCvr has developed different projects in order to reduce maintenance
costs, energy and water consumption, waste and the environmental impact but also in
order to improve working condition and to support community improvement.
PROCvr has about one hundred contractors: it outsources maintenance, design,
construction and HESQ (health, environmental, safety and quality). Maintenance
providers are integrated in the whole life cycle of the assets, they offer assistance in
defining product specifications and operational strategy, they provide a support during
the installation and commissioning phase and in product End-Of-Life management.
Moreover, they provide field service regarding maintenance tasks, remote diagnostics,
expert assistance for at site diagnostics and repair; help desk and online and telephone
support; advanced training; logistic support optimization and IT support. Third parties
management is eventually developed through the continuous monitoring of the risks
and performances of contractors.
Summarizing, the company has fully achieved the fifth level – optimized level – of the
External Coordination Index. A critical aspect that emerged also in the management
decision area, concerns the sharing of the information with third parties. In fact, there
are no databases shared, but contractors have to deliver information, and then a
dedicated person/team has to fill in the PROCvr information system.
PROCvr maturity
The maturity of PROCvr is very high, between the forth and the fifth level of our matrix
(as Table 5.20 showed).
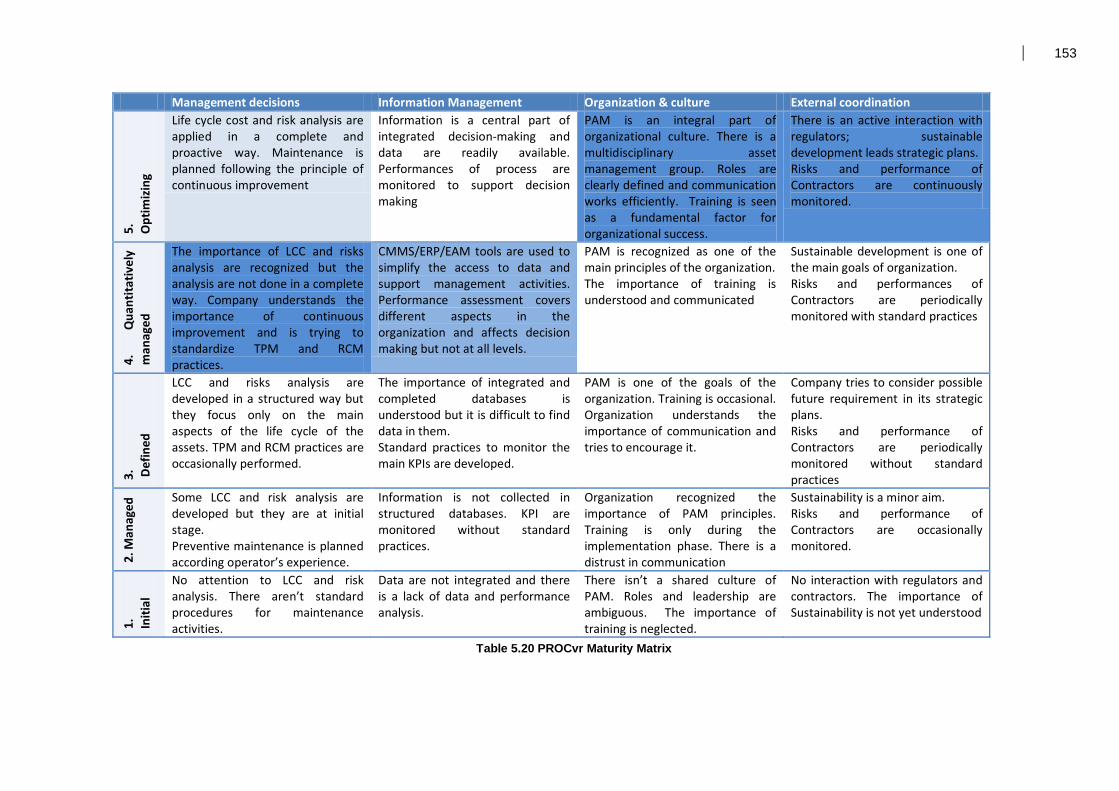
153
Management decisions Information Management Organization & culture External coordination
5.
Opt
imiz
ing
Life cycle cost and risk analysis are applied in a complete and proactive way. Maintenance is planned following the principle of continuous improvement
Information is a central part of integrated decision-making and data are readily available. Performances of process are monitored to support decision making
PAM is an integral part of organizational culture. There is a multidisciplinary asset management group. Roles are clearly defined and communication works efficiently. Training is seen as a fundamental factor for organizational success.
There is an active interaction with regulators; sustainable development leads strategic plans. Risks and performance of Contractors are continuously monitored.
4.
Qua
ntita
tivel
y m
anag
ed
The importance of LCC and risks analysis are recognized but the analysis are not done in a complete way. Company understands the importance of continuous improvement and is trying to standardize TPM and RCM practices.
CMMS/ERP/EAM tools are used to simplify the access to data and support management activities. Performance assessment covers different aspects in the organization and affects decision making but not at all levels.
PAM is recognized as one of the main principles of the organization. The importance of training is understood and communicated
Sustainable development is one of the main goals of organization. Risks and performances of Contractors are periodically monitored with standard practices
3.
Def
ined
LCC and risks analysis are developed in a structured way but they focus only on the main aspects of the life cycle of the assets. TPM and RCM practices are occasionally performed.
The importance of integrated and completed databases is understood but it is difficult to find data in them. Standard practices to monitor the main KPIs are developed.
PAM is one of the goals of the organization. Training is occasional. Organization understands the importance of communication and tries to encourage it.
Company tries to consider possible future requirement in its strategic plans. Risks and performance of Contractors are periodically monitored without standard practices
2. M
anag
ed Some LCC and risk analysis are
developed but they are at initial stage. Preventive maintenance is planned according operator’s experience.
Information is not collected in structured databases. KPI are monitored without standard practices.
Organization recognized the importance of PAM principles. Training is only during the implementation phase. There is a distrust in communication
Sustainability is a minor aim. Risks and performance of Contractors are occasionally monitored.
1.
Initi
al
No attention to LCC and risk analysis. There aren’t standard procedures for maintenance activities.
Data are not integrated and there is a lack of data and performance analysis.
There isn’t a shared culture of PAM. Roles and leadership are ambiguous. The importance of training is neglected.
No interaction with regulators and contractors. The importance of Sustainability is not yet understood
Table 5.20 PROCvr Maturity Matrix
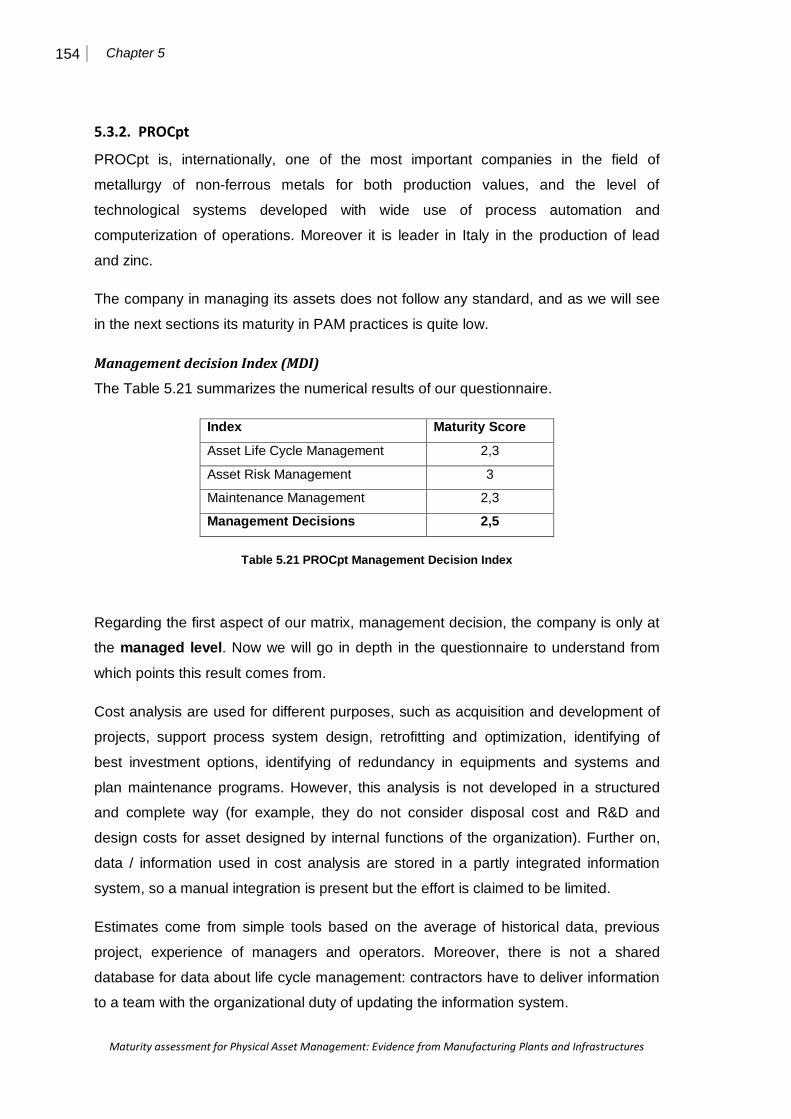
154 Chapter 5
Maturity assessment for Physical Asset Management: Evidence from Manufacturing Plants and Infrastructures
5.3.2. PROCpt
PROCpt is, internationally, one of the most important companies in the field of
metallurgy of non-ferrous metals for both production values, and the level of
technological systems developed with wide use of process automation and
computerization of operations. Moreover it is leader in Italy in the production of lead
and zinc.
The company in managing its assets does not follow any standard, and as we will see
in the next sections its maturity in PAM practices is quite low.
Management decision Index (MDI)
The Table 5.21 summarizes the numerical results of our questionnaire.
Index Maturity Score
Asset Life Cycle Management 2,3
Asset Risk Management 3
Maintenance Management 2,3
Management Decisions 2,5
Table 5.21 PROCpt Management Decision Index
Regarding the first aspect of our matrix, management decision, the company is only at
the managed level. Now we will go in depth in the questionnaire to understand from
which points this result comes from.
Cost analysis are used for different purposes, such as acquisition and development of
projects, support process system design, retrofitting and optimization, identifying of
best investment options, identifying of redundancy in equipments and systems and
plan maintenance programs. However, this analysis is not developed in a structured
and complete way (for example, they do not consider disposal cost and R&D and
design costs for asset designed by internal functions of the organization). Further on,
data / information used in cost analysis are stored in a partly integrated information
system, so a manual integration is present but the effort is claimed to be limited.
Estimates come from simple tools based on the average of historical data, previous
project, experience of managers and operators. Moreover, there is not a shared
database for data about life cycle management: contractors have to deliver information
to a team with the organizational duty of updating the information system.
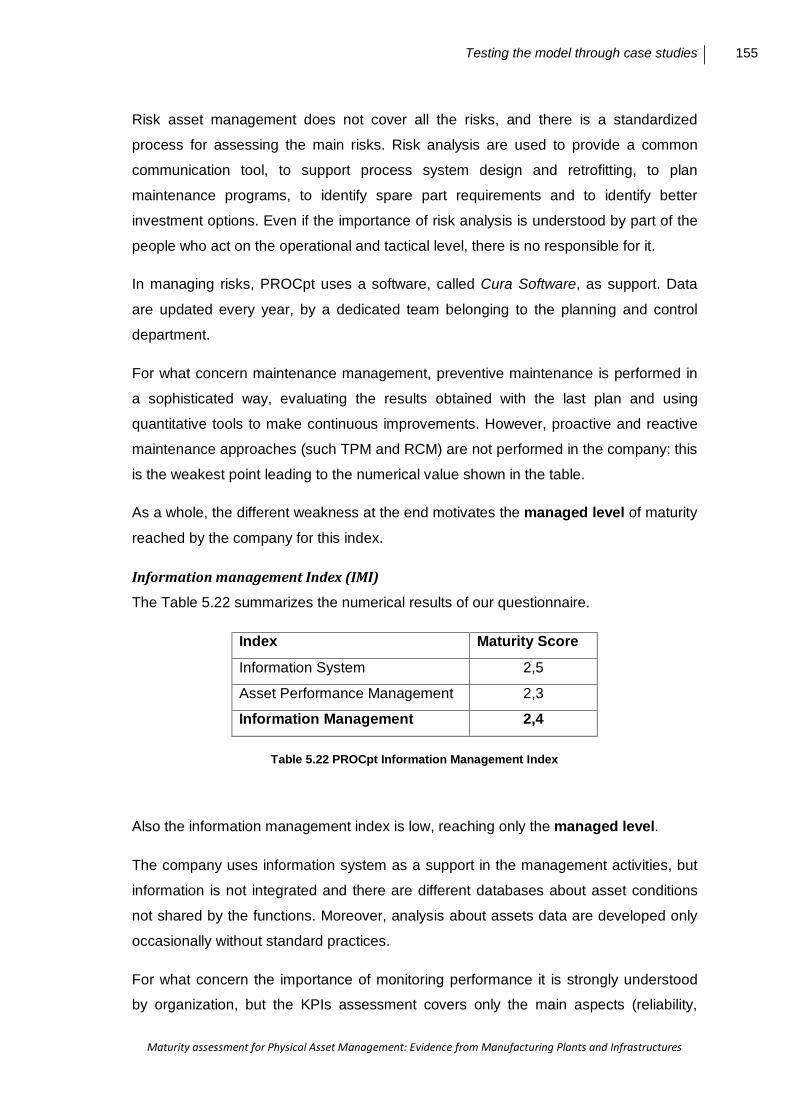
Testing the model through case studies 155
Maturity assessment for Physical Asset Management: Evidence from Manufacturing Plants and Infrastructures
Risk asset management does not cover all the risks, and there is a standardized
process for assessing the main risks. Risk analysis are used to provide a common
communication tool, to support process system design and retrofitting, to plan
maintenance programs, to identify spare part requirements and to identify better
investment options. Even if the importance of risk analysis is understood by part of the
people who act on the operational and tactical level, there is no responsible for it.
In managing risks, PROCpt uses a software, called Cura Software, as support. Data
are updated every year, by a dedicated team belonging to the planning and control
department.
For what concern maintenance management, preventive maintenance is performed in
a sophisticated way, evaluating the results obtained with the last plan and using
quantitative tools to make continuous improvements. However, proactive and reactive
maintenance approaches (such TPM and RCM) are not performed in the company: this
is the weakest point leading to the numerical value shown in the table.
As a whole, the different weakness at the end motivates the managed level of maturity
reached by the company for this index.
Information management Index (IMI)
The Table 5.22 summarizes the numerical results of our questionnaire.
Index Maturity Score
Information System 2,5
Asset Performance Management 2,3
Information Management 2,4
Table 5.22 PROCpt Information Management Index
Also the information management index is low, reaching only the managed level.
The company uses information system as a support in the management activities, but
information is not integrated and there are different databases about asset conditions
not shared by the functions. Moreover, analysis about assets data are developed only
occasionally without standard practices.
For what concern the importance of monitoring performance it is strongly understood
by organization, but the KPIs assessment covers only the main aspects (reliability,

156 Chapter 5
Maturity assessment for Physical Asset Management: Evidence from Manufacturing Plants and Infrastructures
availability, safety, health, economics) and omits other important indicators, such as
maintainability, environmental impact, training, employ satisfaction and customer
satisfaction. KPIs are monitored with a standard frequency by different department (i.e.
maintenance, environment and security, planning and control), but the targets are
settled only after important events, such as overhaul, incidents, or new machine
installation.
Organization & culture Index (OCI)
The Table 5.23 summarizes the numerical results of our questionnaire.
Index Maturity Score
Organization 3
Culture 1,5
Training 3
Communication 3
Organization & Culture Index 2,6
Table 5.23 PROCpt Organization & Culture Index
The low maturity of PROCpt is confirmed – as managed level, but trying to reach the
quantitatively managed level – also for what concern this index.
Focusing on the organization, AM function is in place only at the strategic and tactical
levels, not at operational level. Further on, there are specialists dedicated to AM duties,
but they do not belong to an effective AM team/group.
The culture is the weakest point in OCI. AM policies and goals are defined after a top
down process and then they are explained in a clear way through events (conferences
and workshops). But, even if the company tries to motivate workers to changes, they
are not opened and proactive to change. Last but not least, there is no job description
that clearly defines organizational duties.
The company understands then the importance of training, but it spends less than it
should and, moreover, there is no plan for provision AM knowledge. Permanent training
for technicians and managers is provided, regarding a number of topics: CMMS/ERP,
maintenance engineering, health and safety. Instead, regarding risk management
training is only occasional while nothing is provided regarding life cycle cost
management.
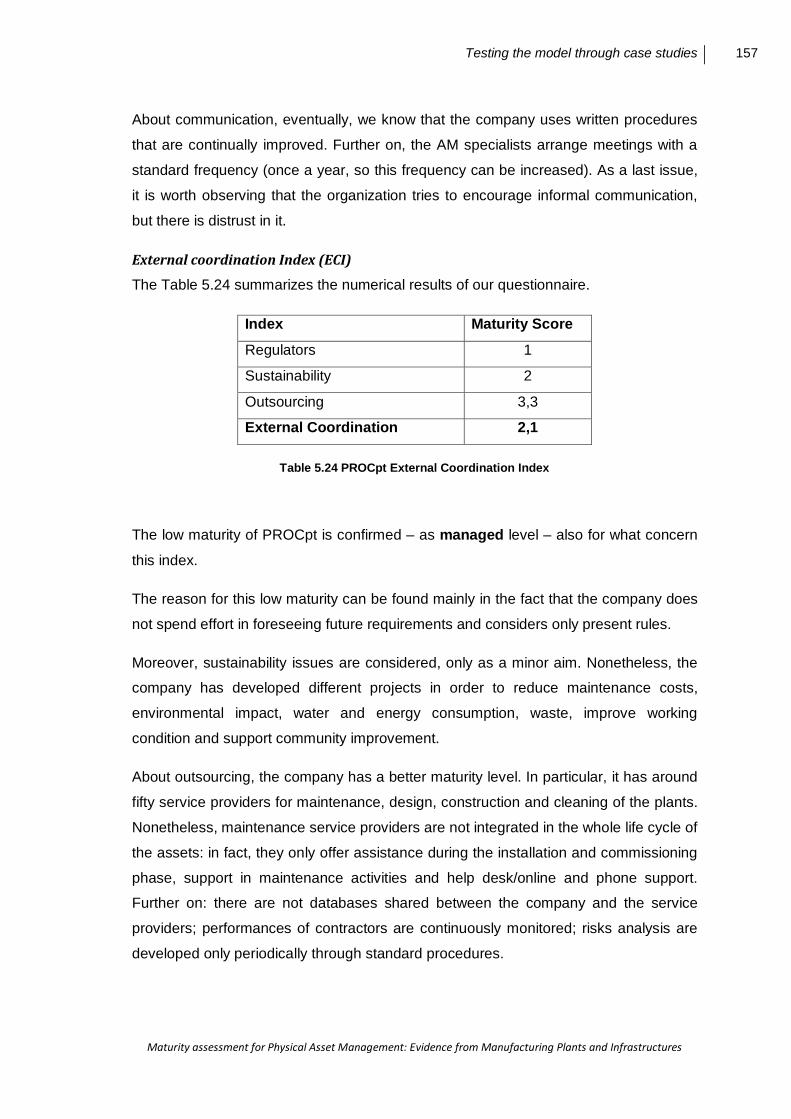
Testing the model through case studies 157
Maturity assessment for Physical Asset Management: Evidence from Manufacturing Plants and Infrastructures
About communication, eventually, we know that the company uses written procedures
that are continually improved. Further on, the AM specialists arrange meetings with a
standard frequency (once a year, so this frequency can be increased). As a last issue,
it is worth observing that the organization tries to encourage informal communication,
but there is distrust in it.
External coordination Index (ECI)
The Table 5.24 summarizes the numerical results of our questionnaire.
Index Maturity Score
Regulators 1
Sustainability 2
Outsourcing 3,3
External Coordination 2,1
Table 5.24 PROCpt External Coordination Index
The low maturity of PROCpt is confirmed – as managed level – also for what concern
this index.
The reason for this low maturity can be found mainly in the fact that the company does
not spend effort in foreseeing future requirements and considers only present rules.
Moreover, sustainability issues are considered, only as a minor aim. Nonetheless, the
company has developed different projects in order to reduce maintenance costs,
environmental impact, water and energy consumption, waste, improve working
condition and support community improvement.
About outsourcing, the company has a better maturity level. In particular, it has around
fifty service providers for maintenance, design, construction and cleaning of the plants.
Nonetheless, maintenance service providers are not integrated in the whole life cycle of
the assets: in fact, they only offer assistance during the installation and commissioning
phase, support in maintenance activities and help desk/online and phone support.
Further on: there are not databases shared between the company and the service
providers; performances of contractors are continuously monitored; risks analysis are
developed only periodically through standard procedures.
158 Chapter 5
Maturity assessment for Physical Asset Management: Evidence from Manufacturing Plants and Infrastructures
PROCpt maturity
PAM is clearly a new concept in the PROCpt context: the company is then quite far
from its achievement, and in fact would need to spend a lot of effort in standardizing
practices to improving PAM.
Table 5.25 correspondingly summarizes the results of the previous sections.
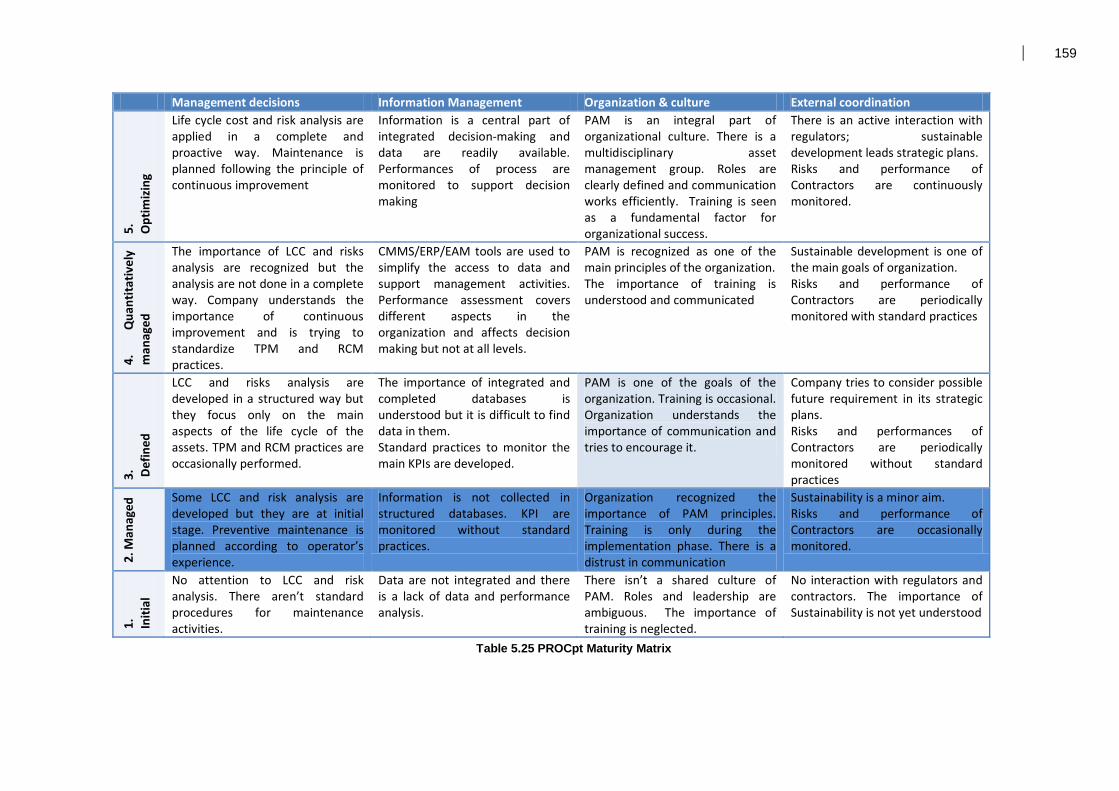
159
Management decisions Information Management Organization & culture External coordination
5.
Opt
imiz
ing
Life cycle cost and risk analysis are applied in a complete and proactive way. Maintenance is planned following the principle of continuous improvement
Information is a central part of integrated decision-making and data are readily available. Performances of process are monitored to support decision making
PAM is an integral part of organizational culture. There is a multidisciplinary asset management group. Roles are clearly defined and communication works efficiently. Training is seen as a fundamental factor for organizational success.
There is an active interaction with regulators; sustainable development leads strategic plans. Risks and performance of Contractors are continuously monitored.
4.
Qua
ntita
tivel
y m
anag
ed
The importance of LCC and risks analysis are recognized but the analysis are not done in a complete way. Company understands the importance of continuous improvement and is trying to standardize TPM and RCM practices.
CMMS/ERP/EAM tools are used to simplify the access to data and support management activities. Performance assessment covers different aspects in the organization and affects decision making but not at all levels.
PAM is recognized as one of the main principles of the organization. The importance of training is understood and communicated
Sustainable development is one of the main goals of organization. Risks and performance of Contractors are periodically monitored with standard practices
3.
Def
ined
LCC and risks analysis are developed in a structured way but they focus only on the main aspects of the life cycle of the assets. TPM and RCM practices are occasionally performed.
The importance of integrated and completed databases is understood but it is difficult to find data in them. Standard practices to monitor the main KPIs are developed.
PAM is one of the goals of the organization. Training is occasional. Organization understands the importance of communication and tries to encourage it.
Company tries to consider possible future requirement in its strategic plans. Risks and performances of Contractors are periodically monitored without standard practices
2. M
anag
ed Some LCC and risk analysis are
developed but they are at initial stage. Preventive maintenance is planned according to operator’s experience.
Information is not collected in structured databases. KPI are monitored without standard practices.
Organization recognized the importance of PAM principles. Training is only during the implementation phase. There is a distrust in communication
Sustainability is a minor aim. Risks and performance of Contractors are occasionally monitored.
1.
Initi
al
No attention to LCC and risk analysis. There aren’t standard procedures for maintenance activities.
Data are not integrated and there is a lack of data and performance analysis.
There isn’t a shared culture of PAM. Roles and leadership are ambiguous. The importance of training is neglected.
No interaction with regulators and contractors. The importance of Sustainability is not yet understood
Table 5.25 PROCpt Maturity Matrix
160 Chapter 5
Maturity assessment for Physical Asset Management: Evidence from Manufacturing Plants and Infrastructures
5.4 Assessment of the methodological approach
In this section we eventually focus on the second aim of our cases studies, that it is to
assess the methodological approach of our maturity model.
The assessment regards three main aspects. We want to check if:
1. the respondents have doubts about the questions, and the vocabulary used is
appropriate both for infrastructure and process companies;
2. the questionnaire is exhaustive both for infrastructure and process companies;
3. the maturity scores, resulting from the model, are congruent with the answers
given by the respondents.
Starting from the first point, the questionnaire uses a lot of terms from the PASS 55,
well known by the asset managers of the company more mature (i.e. INFRAen and
PROCvr) but not familiar to the other two companies. Indeed, during these last two
interviews, more effort and time were spent for understanding terms and concepts.
But, thanks to the support of comments and notes, that were included in the
questionnaire, the interviewees were able to understand all the questions. Another
specific problem for PROCpt – the only one who answers to the Italian version of the
questionnaire – may regard the different presentation, after translation, of specific
English terms.
For what concern the second point, the interviewees found the survey very
exhaustive: according to their feedbacks, the questionnaire asks questions about the
main aspects of PAM, from risk and maintenance management to culture and
organizational aspects, and, moreover, overcome the limits of maintenance
department. In the field of the infrastructure firms and, in general, in case of more
plants can be interesting to add another section about the coordination and
relationships between them (for example a source for inspiration to this end can be
the internal coordination column of the TUDelft matrix original model). Another
interesting issue, resulting from almost all interviewees, is that, thanks to the logic
order (i.e. based on increasing maturity) in which the answers are proposed,
companies can use the survey to understand themselves, their maturity in PAM
practices, and think about possible improvements.

Testing the model through case studies 161
Maturity assessment for Physical Asset Management: Evidence from Manufacturing Plants and Infrastructures
Regarding the third and last point of the methodological assessment, as we explained
in the previous sections, sometimes the numerical results were not congruent with the
maturity of the company, as this could be globally perceived with respect to our
matrix. This happened, most of all, when looking at the culture issue, where the
qualitative considerations cannot be easily translated in a score. Hence, unlike the
TeSeM model, in which all the answers are directly linked to a score and the
calculation of the maturity can be automatized (for example using an Excel
spreadsheet), our actual survey was designed for being more open: indeed, the
survey needs final considerations in order to confirm the results coming from the
simple computation. This means that we can also modify the maturity score and,
consequently, the position in our matrix, after confirming results with the interviewee.
The modification, of course, should clearly be motivated and agreed with the
interviewee, this was done for example in the case of the IMI of PROCvr.
At the end, regarding the final/overall maturity of the company, we showed our matrix
to some of the respondents and we asked them to indicate at which level they were,
by their opinions. PROCvr and INFRAen reflected our results while the asset
manager of INFRAwt placed his company at lower maturity levels in our matrix. For
this case, we attributed the discrepancy to the self-criticism for awareness of the
lower maturity and for the higher need of improvements.
On the other hand, we preferred not to show the maturity matrix to the respondents of
PROCpt. This was done because, correspondingly to the numerical results of maturity
assessment, we can consider that in this company the asset management is still too
much linked to the maintenance function, and we think that their vision of AM is not
yet mature to the point of making a reliable self-assessment.
162
Maturity assessment for Physical Asset Management: Evidence from Manufacturing Plants and Infrastructures
Chapter 6. Conclusions
In this thesis work a maturity model for Physical Asset Management practices has
been developed and tested through five case studies across different companies
managing manufacturing plants and infrastructures.
In Section 6.1 the main outcomes of the research are presented as a summary. The
results might be the starting point of future possible researches: in section 6.2, some
ideas for improvements and developments are then suggested.
6.1 Research outcomes
The main outcome of the research is the maturity model itself: this is a joint issue of a
methodology, inspired by CMMI (Capability Maturity Model Integrated) has theoretical
background, together with a matrix; both the two components were adapted for the
maturity assessment of PAM practices. This joint issue was thoroughly proposed (in
Chapter 4), then tested in industry (see the results of testing phase in Chapter 5).
Thanks to the use of standardized and well recognized terms, the maturity model can
be applied both in manufacturing plants and infrastructures.
In particular, the model assumes that PAM practices follow pre-defined roadmaps that
pass through implementation, standardization and optimization phases. During the
implementation phase, processes are not controlled, activities are carried out without
systematic procedures, information is not integrated and shared (we are at so called
maturity level ML1). Company needs to become aware of this chaotic situation in
order to identify inputs (information, resources, knowledge,..) of processes and to
manage, at least partially, the processes themselves (so to achieve ML2).
Standardization allows then to define repeatable processes (that is ML3): this is the
starting point for a further improvement, in order to get to a quantitative management
of the physical assets (that is ML4): it is the aware standardization that brings
effective and real actions which transform the standards in a way of work based on
quantitative management. The optimized process (that is ML5) is the last step of the

Conclusions 163
Maturity assessment for Physical Asset Management: Evidence from Manufacturing Plants and Infrastructures
roadmap reached when continuous improvement is applied in the company. The
previous concepts are summarized in Fig.6.1.
Fig.6.1 PAM Maturity Roadmap
Another outcome, strictly related to building the maturity model, is that a sort of
“library” of PAM practices is now available in an unique source. More precisely, it is
known that PAM is the set activities that a company undertakes to manage its
physical assets during their whole life-cycle. Herein, our model identifies the main
PAM practices to do those activities and, moreover, sets for them a roadmap for
improvement. According to the CMMI methodology, this is achieved through the pre-
defined (maturity) order of the answers in the questionnaire and, then, also through
the columns of our matrix, which synthesizes that order.
Concerning the road-mapping issue, it is worth reminding that the order in which the
company reaches the maturity levels in each practice (Process Area) depends by its
characteristics – for example, as a starting point of improvement, a generic firm can
have a high score in LCC (Life Cycle Costing) and a lower score in ARM (Asset Risk
164 Chapter 6
Maturity assessment for Physical Asset Management: Evidence from Manufacturing Plants and Infrastructures
Management) or have a high IMI (Information Management Index) but a lower OCI
(Organization & Culture Index) –. Nonetheless, as the holistic view related to PAM
affirms, the maturity of the whole company is influenced by the improvement of every
PA: therefore, the maturity assessment may be an useful instrument to discuss and
prioritize actions, based on a starting point, resulting from the actual maturity of PAM
practices in the company.
For what concern the results of the testing phase, in Chapter 5 we obtained the
maturity levels for the companies assessed in five case studies. Considering the
experience gained during these cases, we may underline that the following aspects
increase passing from the lowest mature (PROCpt) to the highest one (PROCvr):
1. completeness and effectiveness of analysis (i.e. life cycle, risk and
performance analysis) in order to support management decisions;
2. information sharing (between different hierarchical levels and departments of
the organization, but also with third parties);
3. integration of Information System (between different departments and with
third parties);
4. sharing of a common culture (between different hierarchical levels of the
organization);
5. control of “external factors” (stakeholders, service providers amongst the third
parties).
The combinations of these aspects might be the horizontal axis of roadmap described
in Fig.6.1 In fact, the five factors listed above represent the key to discern the five
maturity levels: depending of the level of integration, sharing and control we will
assign a different maturity score to the company assessed.
Last but not least, the definition of the “library” of PAM practices and the
characteristics of the designed maturity evaluation (a priori, survey-like, flexible)
make the model fitted for surveys in different contexts. By filling in a questionnaire, in
a relatively short time (the interview lasts about an hour), it is possible to obtain a
characterization of the state of PAM practices in a company and, extending the
survey in more enlarged contexts, this may be an useful instrument for benchmarking
and for the definition of the best PAM practices across different industries.
The survey can be supported by the fact that the companies themselves may find
benefit in filling in the questionnaire because (as pointed out in the section 5.4)

Conclusions 165
Maturity assessment for Physical Asset Management: Evidence from Manufacturing Plants and Infrastructures
the order in which the answers are listed allows to the respondent both to make a
self- assessment on his/her organization and to envision what might be the
possible developments to improve its PAM practices.
6.2 Future researches
Future works may regard possible improvements of the maturity model. In particular,
the maturity assessment proposed in this thesis does not cover the issues and the
needs of organizational contexts where more divisions/more plants operate in order to
achieve a unique business strategy. Hence, to extend the use of the maturity model,
we suggest to add another part about internal coordination in which questions may
refer to how the different plants or national/regional divisions interact each other (i.e.
sharing of information and resources) and to how policies and goals are defined (i.e.
definition of targets, budget allocation between different parts of the organization).
Another cue for the study may be to extend the external coordination part. In fact, we
must not forget that PAM strategy is strictly related to the business strategy: all the
operations and maintenance activities are managed to reach the vision of the
company and PAM becomes a key factor to achieve business success. In this
perspective, more questions about the stakeholders management, such as how
stakeholders influence company’s actions, how the company tries to understand their
requirements, etc…, are important to fully capture the meaning of PAM and to extend
the assessment from the tactical to the strategic level of the organization.
The last recommendation regards the use of the maturity model. As said in section
6.1, the main outcome of the research is the model itself that, thanks to the use of
standardized and well recognized terms, can be applied both in manufacturing plants
and infrastructures. In fact, the experience gained during the case studies has not
shown the existence of sectorial barriers in understanding of the specific terms of
PAM, even in case of low maturity levels. For this reason we want to encourage the
research along the different sectors with a dual purpose:
• extend the library of PAM practices;
• Identify the boundary conditions that affect (positively or negatively) the
implementation and the optimization of PAM practices.
166
Maturity assessment for Physical Asset Management: Evidence from Manufacturing Plants and Infrastructures
References
AIRMC, ALARM, IRM. "A risk management standard." 2002.
Amadi-Echendu J. E. "Curriculum Development and Delivecy in Physical Asset
Management." 4' Global Congress on Engineering Education. Bangkok, Thailand,
2004.
Amadi-Echendu J. E. "Managing Physical Assets is a Paradigm Shift from
Maintenance." IEEE Transactions on Engineering Management (Department of
Engineering and Technology Management, University of Pretoria, South Africa),
2004.
Armenakis Achelles A. and Stanley Harris G. "Crafting a change message to create
transformational readiness." Journal of Organizational Change Management, 2002:
Vol.15 N.2; pp.169-183.
Baglee David, Knowles Michael, and Yau Chi-Yung. "Development of Techniques to
Manage Asset." In Asset Management. The state of Art in Europe from Life Cycle
Perspective, by Paulien Herder, Ype Wijnia and Telli van der Lei, pp.143-154.
Springer, 2012.
Barringer P.E. "Life cycle cost and reliability process equipmnet." 8th Annual Energy
week conference and Exhibition. Houston, Texas, 1997.
Barringer P.E. "A Life Cycle Cost Summary." International Conference of
Maintenance Societies. Humble, Texas: Barringer & Associates, Inc., 2003.
Blanchard and Fabrycky. Systems Engineering and Analysis. Upper Saddle River,
NJ, Prentice - Hall, 1998.
Bohn R.E. "Measuring and managing technological knowledge." Sloan Management
Review, 1994: Vol.36 No.1, pp.61-73.
References 167
Maturity assessment for Physical Asset Management: Evidence from Manufacturing Plants and Infrastructures
Brent Alan C. and Schuman Charles A. "Asset life cycle management: towards
improving physical asset performance in the process industry." International Journal
of Operations & Production Management, 2005: Vol. 25 Iss: 6, pp.566 - 579.
Brenta A.C. and Visser J.K. "An environmental performance resource impact indicator
for life cycle management in the manufacturing industry." Journal of Cleaner
Production, 2005: 13, pp.557 - 565.
Brown E. and Humphrey G. "Asset Management for transmission and distribution."
IEEE, 2005.
Brundtland. Brundtland Report. World Commission on Environment and
Developement, ONU, 1987.
Brunetto Y. and Xerri M. "Examining employee attitudes toward change,
organisational culture and their relationship with infrastructure and engineering asset
management performance." 2012.
Càceres. "Como incrementar la ocmpetitividad del negocio mediante estrategias para
gerenciar el mantenimento." VI Congreso Panamericano de ingneria de
manteniemento . Mexico: D.F, 2004.
COSO. Patent Enterprise risk maangement - integrated approach: executive
summary. 2004.
Crespo Márquez A., Moreu de León P., Gómez Fernández J.F., Parra Márquez C.,
López Campos M. "The maintenance management framework: A practical view to
maintenance management." Journal of Quality in Maintenance Engineering, 2009.
Criscimagna, Ned. 2002.
http://www.theriac.org/DeskReference/viewDocument.php?id= 121.
Culture, Wikipedia. http://en.wikipedia.org/wiki/Culture.
Dawson. "Knowledge capabilities as the focus of organisational development and
strategy." Journal of Knowledge Management, 2000: 4, pp.320-327.
Deeb C, Demand Media. Top-Down Approach to Policy Decisions. 2012.
http://smallbusiness.chron.com/topdown-approach-policy-decisions-35494.htm.
DJSI. 2005. www.sustainability-index.com.
168 References
Maturity assessment for Physical Asset Management: Evidence from Manufacturing Plants and Infrastructures
Dunn R. "Advanced maintenance technologies." Plant Engineering, 1987: Vol. 40, pp.
80-2.
Fumagalli L, Di Leone F, Jantunen E, Macchi M. "Economic Value of Technologies in
an e- Maintenance Platform." Preprints of 1° IFAC Workshop, A-MEST'10. Lisboa,
Portugal: Advanced Maintenance Engineering, Services and Technology, 1-2 July
2010.
Galar D, Parida A, Kumar U, Stenström C, Berges L. "Maintenance metrics: A
hierarchical model of balanced scorecard." IEEE, 2011.
Grencik J and Legat V. "Maintenance audit and benchmarking - search for evaluation
criteria on global scale." Warszawa: PNTTE, 2007. Nr 3 (35), pp.34-39.
Haider Abrar. "Fallacies of Technological Determinism – Lessons for Asset." 2008.
Hastings Nicholas A. J. Physical Asset Management. Springer-Verlag London
Limited, 2010.
Healy Dr.J A. "Criticality in asset management." JAHCon Physical Asset Management
Pty. Ltd., WCEAM 2006, 2006: Paper 145 Page 1-15.
Herder P.M and Wijnia Y.C. "The state of asset management in the Netherlands."
Delft University of Technology, Faculty of Technology, Policy and Management,,
2009.
Herder Paulien and Wijnia Ype. "A systems view on Infrastrucuture asset
management." In Asset Management. The state of art in Europe from a life cycle
perspective, by Pauliene Herder, Ype WIJNIA Telli Van der Lei, pp.31 - 46. Springer,
2012.
Hofstede G. Culture’s consequences. Newbury Park, CA: Sage, 1984.
Hofstede G. "A case for comparing apples with orange." International Journal of
Comparative Sociology, 1998: 39 (1), pp.16-31.
Ilie L and Gavrea C. "The link between organizational culture and corporate
performane - An overview." Annals of Faculty of Economics, 2008: 4 (1), pp.322 -
329.
ISO. Patent ISO 3100: Risk Management - principles and guidelines. 2009.

References 169
Maturity assessment for Physical Asset Management: Evidence from Manufacturing Plants and Infrastructures
Jung T, Scott T, Davies H, Bower P, Whalley D, McNally R, et al. "Instruments for
Exploring Organizational Culture: A review of the literature." Public Administration
Review, 2009: 69 (6), pp.1087 - 1096.
Katičić Ljiljana and Šušnjar Ivan. "Facility and Asset Management." 2011.
Kawauchi Yoshio and Rausand Marvin. "Life Cycle Cost (LCC) analysis in oil and
chemical process industries." 1999.
Kennerly Mike and Neely Andy. "Measuring Performance in a changing business
environment." International Journal of Operations & Production Management, 2003:
Vol 23 No 2., pp.213-119.
Komonen Kari, Kortelainen Helena and Räikkonen Minna. "An asset management
framework to improve longer term returns on investments in the capital intensive
industries." VTT (Technical Research Centre of Finland); WCEAM, 2006: Paper 070
Page 1.
Komonen Kari, Kortelainen Helena and Räikkonen Minna. "Corporate Asset
Management for Industrial Companies: an Integrated Business-Driven Approach." In
Asset Management: the state of the art in Europe from a life cycle perspective, by
Paulien Herder, Jpe Wijnia Telli van der Lei, pp.47-63. Springer, 2012.
Korn Martijn S and Veldman Else. "Benefits of continuous risk management in
(physical) asset orientated companies." Building networks for a brighter future.
Rotterdam: International Conference on infrastructure systems, 2008.
Kremic T, Tukel O. I., Rom W.O. "Outsourcing decision support: a survey of benefits,
risks and decision factors." Supply Chain Management: An Internation Journal, 2006:
11/6; pp.467-482.
Kumar R., Markset T., Kumar U. "Maintenance of machinery - Negotiating contracts in
business - to- business marketing." Internationa Journale of Service Industry
Management, 2005: 15:4, pp.400-413.
Kumar U and Parida A. "Maintenance performance measurement (MPM): issues and
challenges ." Journal of Quality in Maintenance Engineering, 2006: Vol. 12 No. 3.
170 References
Maturity assessment for Physical Asset Management: Evidence from Manufacturing Plants and Infrastructures
Kumar U, Galar D, Parida A, Stenstrom C, Berges L. "Maintenance Performance
Metrics: A state if the art review." International Conference on Maintenance
Performance Measurement & Management. Sweden: Luleå, 2011. 3-34.
Lim, B. "Examining the organizational culture and organizational performance link."
Leadership & Organization Development Journal , 1995: 16 (5), pp.16-21.
Liyanage Jayantha P. "Operations and maintenance performance in production and
manufacturing assets: The sustainability perspective." Journal of Manufacturing
Technology Management, 2007: Vol. 18 No. 3, pp.304-314.
Liyanage Jayantha P. "Smart Engineering Assets Through Strategic Integration." In
Asset Management: the state of the art in Europe from a life cycle prespective, by
Paulien Herder, Ype Wijinia Telli van der Lei, pp.11-26. Springer, 2012.
Lynch RL, Cross KF. Measure Up - The Essential Guide to Measuring Business
Performance. London: Mandarin, 1991.
Martikainen J. "Portfolio Management of Strategic Investments in Metal Products."
Master’s Thesis. Helsinki University of Technology., 2002.
Mather Daryl. "The Strategic Importance of Asset Management." Reliabilityweb.com.
October 2003. http://www.reliabilityweb.com.
Minzoni M. CMMI: ottimizzare il processo per migliorare il prodotto. 2004. www.
mokabyte.it.
Mitchell JS, and Contributors. Physical Asset Management handbook. 3rd Edition.
Gulf Publishing Company, 2002.
Moon F.L, Aktan A.E., Furuta H., Dogaki M. "Governing issues and alternate
resolutions for hihway trasposrtation agency's transition to asset management."
Structure and Infrastructure Engineering, 2009: 5 (1): pp.25-39.
Muller A, Crespo - Marquez A, Lung B. "On the concept of e- maintenance: review
and current research." Reliability Engineering and System Safety, 2008: 93 (8),
pp.1165-1187.
Murphy. "Best practice engineering asset cultures: a pilot study." 3rd World Congress
on Engineering Asset Management and Intelligent Maintenance Systems Conference
References 171
Maturity assessment for Physical Asset Management: Evidence from Manufacturing Plants and Infrastructures
(WCEAM-IMS). Beijing, China : Engineering Asset Management - A Foundation for
Sustainable Development , 27-30 October 2008.
Murphy D. Glen. "Testing a tripartite contingent model of engineering cultures: A pilot
study." Reliability Engineering and System Safety, April 2010: pp.1040–1049.
Parida. "Maintenance Performance Assessment (MPA) framework for Engineering
Asset." Proceedings of the 2008 IEEE IEEM, 2008.
Parida Aditya. "Asset Performance Assessment ." In Asset Management. the state of
he art in Europe from a life cycle perspective, by Paulien Herder, Ype Winia Telli van
der Lei, 101-113. Springer, 2012.
PAS 55. BSI, British Standards Istitution, 2008.
Peterson S. Bradley. "Developing an Asset Management Strategy." Strategic Asset
Management Inc., 2002.
—. "The Future of Asset Management." WCEAM 2006 , 2006: 078-1-13.
Port T, Ashun J,Callaghan TJ. "A Framework for Asset Management." In Asset
Management Excellence Optimizing Equipment Life-Cycle Decisions, Second Edition,
by Andrew K . S . Jardine and Joel McGlynn John D . Campbell, 23-48. CRC Press,
2010.
Räikkönen Minna, Komonen Kari, Heikkilä Annika, Kunttu Susanna. "Life-Cycle
Oriented Investment Portfolio Evaluation – Introducing a Multiphase Evaluation
Method for Capital Intensive Industries." VTT (Technical Research Centre of Finland),
2010.
Rijkswaterstaat Bouwdienst, werkgroep RAMS. "Advies RAMS Normalisatie
Overheidswerken." Uniforme methodiek RAMS, Advies RAMS Normalisatie
Overheidswerken, 2008.
Schein E. "Organizational Clututr." American Psychologist, 1990: 45 (2), pp.109-119.
Scott T, Mannion R, Davies H, Marshall M. "The quantitative measurement of
organizational culture in health care: a review of the avaible instruments." Health
Services Research, 2003: 38 (3), pp.923-945.
172 References
Maturity assessment for Physical Asset Management: Evidence from Manufacturing Plants and Infrastructures
Stan Nowlan and Howard Heap. Reliability Centered Maintenance. The Asset
Partnership, 1978.
Subramaniam M. and Youndt M. "The influence of intellectual capital on the types of
innovative capabilities." Accademy of management of Management Journal, 2005:
48(3), pp.450 - 463.
Takata, Kimura, van Houten, Westkämper. "Maintenance: Changing Role in Life
Cycle Management." 2004.
Toran F, Ramirez D, Casan S, Navarro E, Pelegri J. "Instrumentation and
Meaurement Technology." 2000, IMTC ed.: Vol 2 IMTC, pp. 652-656.
Tsang Albert H.C. "Strategic dimension of maintenance management." Journal of
Quality Maintenance Engineering, 2002: vol.8 N.1, pp.7-39.
U.S. Department of Transportation. "Asset Management Primer." 1999.
Van der Lei T., Wijnia Y., Herder P. Asset Management. The State of the Art in
Europe from a Life Cycle Perpespective. Springer, 2012.
Van der Lei, Wijnia and Herder. "Towards an asset management framework of asset
characteristics, asset environment, lifecycle phases, and management." Engineering
Asset Management and Infrastructure Sustainability. Brisbane, Australia: 5th World
Congress on Engineering Asset Management (WCEAM), 2010.
Vanier, D. J. "Asset management A to Z." NRC Publications Archive (NPArC). Sep
2001. http://nparc.cisti-icist.nrc-cnrc.gc.ca/npsi/ctrl?lang=en.
Volker L, Van der Lei T, Ligtvoet A. "Developing a maturity model for Infrastructural
asset systems." 2011.
Volker L., van der Lei T., van den Boomen M., van der Velde J. "Continued Learning
in Asset Management for the Dutch." Third International Engineering Systems
Symposium. Delft University of Technology: CESUN 2012, 18-20 June 2012.
Waeyenbergha Geert and Pintelon Liliane. "A framework for industrial maintenance
concept development." International Journal of Production Economies, 2006: pp. 633-
640.

References 173
Maturity assessment for Physical Asset Management: Evidence from Manufacturing Plants and Infrastructures
Wikipedia. Dashboard (management information systems). August 23, 2012.
http://en.wikipedia.org/wiki/Dashboard_(management_information_systems).
—. Sustainable development. August 2012, 2012.
http://en.wikipedia.org/wiki/Sustainable_development.
Wireman. Developing performance indicators for managing maintenance. New York,
USA: Industrial Press, 1st edition, 1998.
Woodhouse. Asset Management. John Woodhouse Partnership Ltd., 2001.
Zhuang Qikai, van der Lei Telli, Dhiradj and Jhoan J.Smit. "Interdependencies at the
Strategic Asset Management Level: A Systems Analysis of the Utility Sector."
International Conference on Networking, Sensing and Control. Delft, The
Netherlands: IEEE, 2011, pp. 365-370.

174
Maturity assessment for Physical Asset Management: Evidence from Manufacturing Plants and Infrastructures
Appendix 1 – Questionnaire
Physical Asset Management Questionnaire
Introduction
My name is Chiara D’Alesio and I’m from Politecnico di Milano.
This questionnaire is part of my Master Thesis developed with the collaboration of
researches of the faculty of TPM (Technology, Policy and Management) of TUDelft and
researchers from DIG (Department of Management, Economics and Industrial
Engineering) of Politecnico di Milano.
Why this questionnaire?
It asks questions about the current practice of life cycle cost management, risk
management, maintenance management, organization, culture and other important
aspects of PAM (Physical Asset Management) with the aim to assess the maturity of
the company in PAM practices.
How is it set up?
5 parts with 68 closed questions
A. General Information B. Management Decision (24 questions) C. Information Flow (14 questions) D. Organization & Culture (19 questions) E. External Coordination (11 questions)
How much time will it take?
About 50/60 minutes
For more information, who contact?
Chiara D’Alesio
Mail: [email protected]
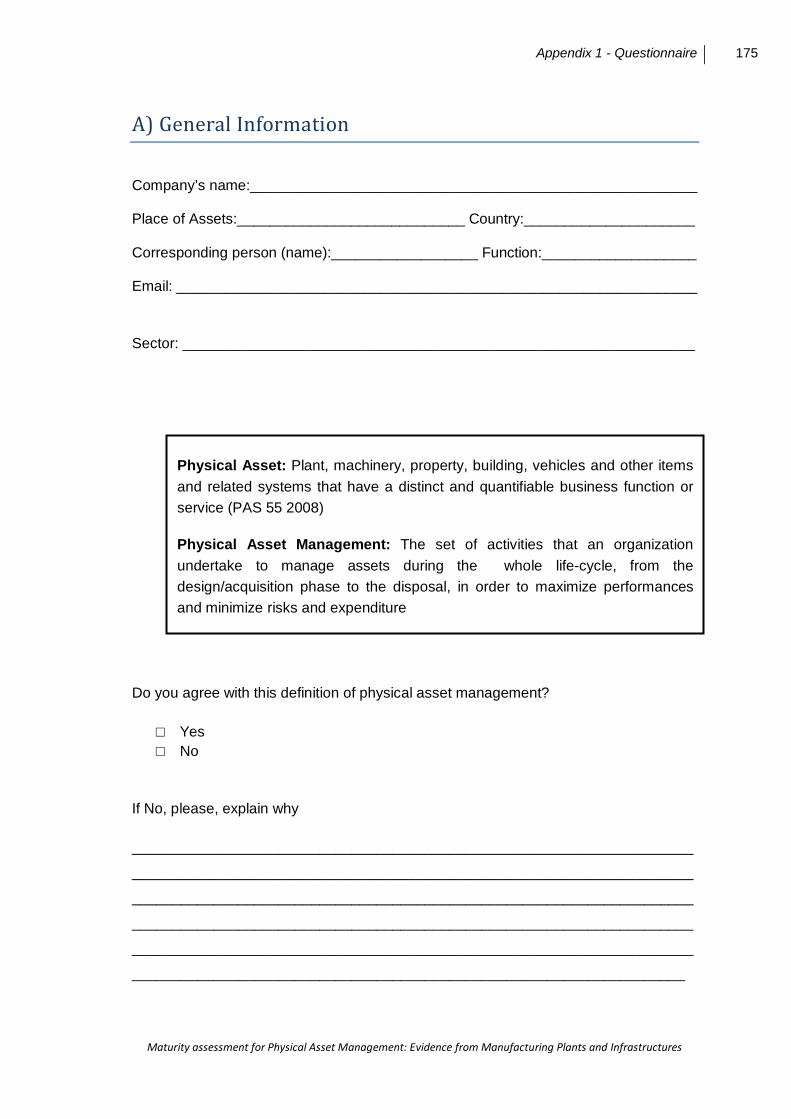
Appendix 1 - Questionnaire 175
Maturity assessment for Physical Asset Management: Evidence from Manufacturing Plants and Infrastructures
A) General Information
Company’s name:_______________________________________________________
Place of Assets:____________________________ Country:_____________________
Corresponding person (name):__________________ Function:___________________
Email: ________________________________________________________________
Sector: _______________________________________________________________
Do you agree with this definition of physical asset management?
□ Yes □ No
If No, please, explain why
_____________________________________________________________________
_____________________________________________________________________
_____________________________________________________________________
_____________________________________________________________________
_____________________________________________________________________
____________________________________________________________________
Physical Asset: Plant, machinery, property, building, vehicles and other items and related systems that have a distinct and quantifiable business function or service (PAS 55 2008)
Physical Asset Management: The set of activities that an organization undertake to manage assets during the whole life-cycle, from the design/acquisition phase to the disposal, in order to maximize performances and minimize risks and expenditure
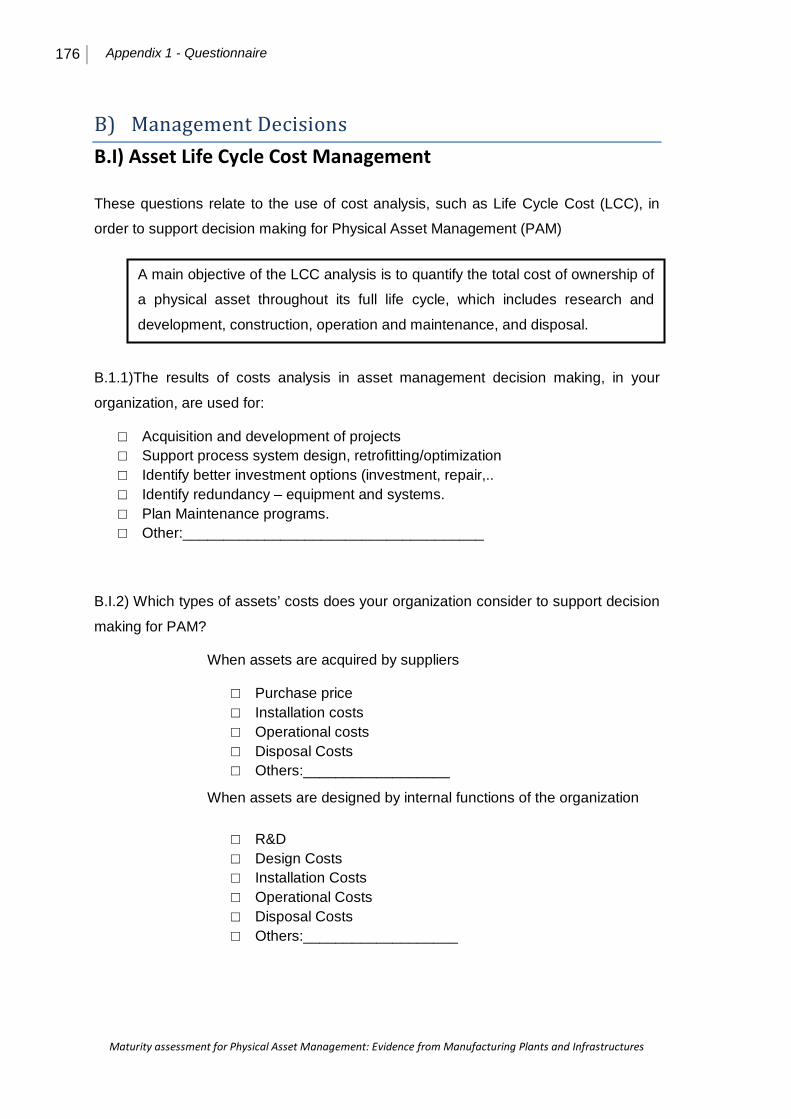
176 Appendix 1 - Questionnaire
Maturity assessment for Physical Asset Management: Evidence from Manufacturing Plants and Infrastructures
B) Management Decisions B.I) Asset Life Cycle Cost Management
These questions relate to the use of cost analysis, such as Life Cycle Cost (LCC), in
order to support decision making for Physical Asset Management (PAM)
B.1.1)The results of costs analysis in asset management decision making, in your
organization, are used for:
□ Acquisition and development of projects □ Support process system design, retrofitting/optimization □ Identify better investment options (investment, repair,.. □ Identify redundancy – equipment and systems. □ Plan Maintenance programs. □ Other:_____________________________________
B.I.2) Which types of assets’ costs does your organization consider to support decision
making for PAM?
When assets are acquired by suppliers
□ Purchase price □ Installation costs □ Operational costs □ Disposal Costs □ Others:__________________
When assets are designed by internal functions of the organization
□ R&D □ Design Costs □ Installation Costs □ Operational Costs □ Disposal Costs □ Others:___________________
A main objective of the LCC analysis is to quantify the total cost of ownership of
a physical asset throughout its full life cycle, which includes research and
development, construction, operation and maintenance, and disposal.
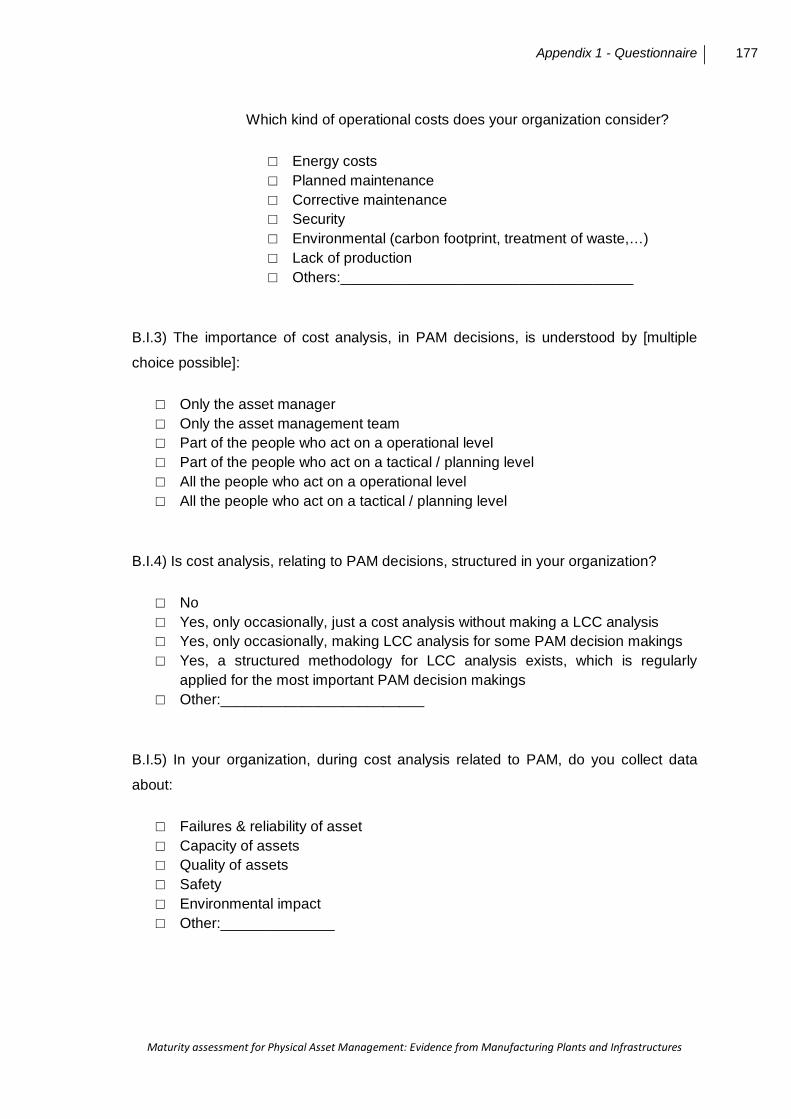
Appendix 1 - Questionnaire 177
Maturity assessment for Physical Asset Management: Evidence from Manufacturing Plants and Infrastructures
Which kind of operational costs does your organization consider?
□ Energy costs □ Planned maintenance □ Corrective maintenance □ Security □ Environmental (carbon footprint, treatment of waste,…) □ Lack of production □ Others:____________________________________
B.I.3) The importance of cost analysis, in PAM decisions, is understood by [multiple
choice possible]:
□ Only the asset manager □ Only the asset management team □ Part of the people who act on a operational level □ Part of the people who act on a tactical / planning level □ All the people who act on a operational level □ All the people who act on a tactical / planning level
B.I.4) Is cost analysis, relating to PAM decisions, structured in your organization?
□ No □ Yes, only occasionally, just a cost analysis without making a LCC analysis □ Yes, only occasionally, making LCC analysis for some PAM decision makings □ Yes, a structured methodology for LCC analysis exists, which is regularly
applied for the most important PAM decision makings □ Other:_________________________
B.I.5) In your organization, during cost analysis related to PAM, do you collect data
about:
□ Failures & reliability of asset □ Capacity of assets □ Quality of assets □ Safety □ Environmental impact □ Other:______________

178 Appendix 1 - Questionnaire
Maturity assessment for Physical Asset Management: Evidence from Manufacturing Plants and Infrastructures
B.I.6) Are the data from question B.I.5 managed within an integrated information
system?
□ No, the information system providing the data is not integrated; data / information are quite dispersed, manual integration is strongly needed;
□ Yes, the information system providing the data is partly integrated; data / information are dispersed, manual integration is present but the effort is reduced;
□ Yes, an integrated information system, providing data / information as a platform, is already present; people work more at the level of decision making (i.e. transforming data / information available to knowledge enabling decisions).
The following questions are related the need to have data/information updated and
organized in order to support PAM decision making
B.I.7) Who has the organizational duty to fill the data / information, relating to PAM
decision making, in the information system?
□ Only the asset manager □ There are dedicated persons (indicate the functional area of the operators,
more than one functional area is applicable:____________________________) □ The asset management team □ All the operators can fill the databases (indicate the functional area of the
operators, more than one functional area is applicable:______________________________________________________)
□ All the operators can fill the databases (indicate the functional area of the operators, more than one functional area is applicable:______________________________________________________) and there is a check for the consistency.
B.I.8) Where do estimates, used in PAM cost analysis, come from? [multiple choice]
□ Experience of managers/operators/project team □ Suppliers □ Analysis of historical data based on the simple average of data □ Analysis of historical data based on more sophisticated tools / based on
previous projects □ Parametric techniques based on statistical- distribution analysis of historic
databases □ Quantitative models developed in order to take into account the random /
stochastic nature of events and relying on the use of specialized statistical techniques to “simulate” future decisions.
Appendix 1 - Questionnaire 179
Maturity assessment for Physical Asset Management: Evidence from Manufacturing Plants and Infrastructures
B.I.9) Are these estimates periodically updated?
□ No □ After important events (overhaul, incidents, new machine installation, infra
projects) □ Periodically updated (namely how often:_____________)
B.I.10) Sharing information with contractors. Contractors: [multiple choice]
□ Have to deliver information and there is a person/a team with the organizational duty of update PAM information systems
□ Can access to PAM information systems □ Can update PAM information systems □ Can insert16 data in PAM information systems
B.II) Risk Asset Management
These questions relates to risk asset management
B.II.1) What types of risks does your organization consider?
□ Operational risks caused by: □ Functional failure □ Incidental damage □ Human factors □ Others:___________________
□ Natural environmental risks (storms, floods,..) □ Financial risks □ Stakeholders risks (such as failure to meet regulatory performance
requirements or reputation damage) □ Supplier risks □ Others:_______________________
16 Insert means that contractors can add new types of information, such as new performance indicators, new information about assets.
The purpose of Risk Asset Management is to understand the cause, effect and the
likelihood of adverse events which may occur while an asset is managed.
180 Appendix 1 - Questionnaire
Maturity assessment for Physical Asset Management: Evidence from Manufacturing Plants and Infrastructures
B.II.2) The results of risk management analysis are used to: [multiple choice]
□ Provide a common communication tool. □ Support process system design / retrofitting □ Identify redundancy – equipment and systems. □ Plan Maintenance programs. □ Identify spare parts requirements. □ Target maintenance budgets. □ Identify training requirements. □ Quantify the maintenance commitment KSF’s, KPI’s. □ Provide a basis for system modeling. □ Identify better options (investment, repair,…) □ Other:_______________________
B.II.3) Is there a risk asset management process in your organization?
□ No □ Yes, but it is not standardized □ Yes, but it is standardized for only some risks □ Yes, and it is standardized (as an enterprise standard) □ Yes, and it is standardized (as an enterprise standard, considering also
certifications / norms from third parties / institutions)*
* Specify if there are certifications about risk management process (such as ISO/IEC
guide 73/2002)_________________________________________________________
B.II.4) The importance of risk analysis is understood by [multiple choice possible]:
□ Only the asset/risk manager □ Only the asset management team □ Safety department □ Part of the people who act on the operational level □ Part of the people who act on the tactical / planning level □ All the people who act on the operational level □ All the people who act on the tactical / planning level
Appendix 1 - Questionnaire 181
Maturity assessment for Physical Asset Management: Evidence from Manufacturing Plants and Infrastructures
B.II.5) Who is responsible for Risk analysis?
□ There is none responsible for it □ Asset Manager □ Risk Manager □ There is a function responsible for it □ Others:______________________
B.II.6) Risk assessment is developed through:
□ Only qualitative analysis □ Only quantitative analysis □ There is a balance between qualitative and quantitative analysis
B.II.7) Do you have a risk matrix or other similar tool to express, in a visual way, the
risk of different entities under concern?
□ No □ Yes (which tool? _________________________________________________)
B.II.8) Who has the organizational duty to update the risk matrix/risk database required
to fulfill the matrix?
□ Only the manager responsible for it (indicate the functional area of the manager:_______________________________________________________)
□ There is a dedicated team (indicate the name of the unit / function in the organization: ___________________________________________________)
□ All the operators can update data (indicate the functional area of the operators, more than one functional area is applicable: ___________________________)
□ All the operators can update data (indicate the functional area of the operators, more than one functional area is applicable: ___________________________) and there is a check for the consistency.
B.II.9) Are risk data periodically updated?
□ No □ After important events (overhaul, incidents, incidents, new machine installation) □ Periodically updated (indicate how often:___________________)
182 Appendix 1 - Questionnaire
Maturity assessment for Physical Asset Management: Evidence from Manufacturing Plants and Infrastructures
B.II.10) Sharing information with contractors. Contractors:
□ Have to deliver information and there is a person/a team with the organizational duty of update risk database
□ Can access to risk database □ Can update risk database □ Can insert data in risk database
B.III) Maintenance Management
B.III.1) Design of maintenance plan. How do you define your preventive maintenance
plan? [single choice]
□ According to operators’ experience □ According to operators’ experience and vendor recommendations □ Using tools of quantitative analysis to define / redefine the best time to do
preventive maintenance □ Evaluating the results obtained with the last plan and using quantitative tools
to redefine maintenance periods/to make continuous improvements
B.III.2) Is Total Productive Maintenance (TPM) implemented in your company? [single
choice]
□ I do not know what TPM is □ No □ Occasionally, we have tried in the past but we did not achieve it □ Occasionally, we use TPM practices but not in a constant and systematic way □ It is a standard practice in the company
TOTAL PRODUCTIVE MAINTENANCE (TPM)
A proactive approach to maintenance with the objective to improve asset reliability and maintainability, thanks to continuous little improvements with the help of maintainers and production personnel.
PREVENTIVE MAINTENANCE:
Maintenance performed according to prescribed criteria to reduce the probability of failure and the degradation of the asset performance (UNI 10147).
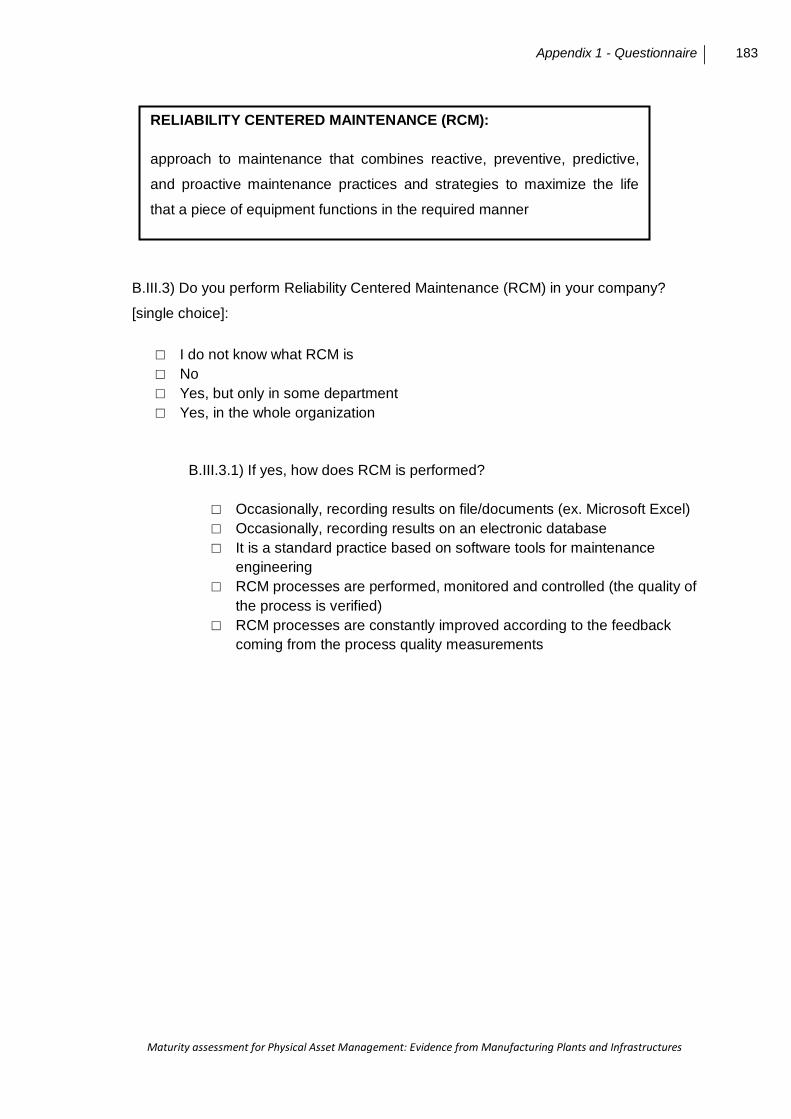
Appendix 1 - Questionnaire 183
Maturity assessment for Physical Asset Management: Evidence from Manufacturing Plants and Infrastructures
B.III.3) Do you perform Reliability Centered Maintenance (RCM) in your company?
[single choice]:
□ I do not know what RCM is □ No □ Yes, but only in some department □ Yes, in the whole organization
B.III.3.1) If yes, how does RCM is performed?
□ Occasionally, recording results on file/documents (ex. Microsoft Excel) □ Occasionally, recording results on an electronic database □ It is a standard practice based on software tools for maintenance
engineering □ RCM processes are performed, monitored and controlled (the quality of
the process is verified) □ RCM processes are constantly improved according to the feedback
coming from the process quality measurements
RELIABILITY CENTERED MAINTENANCE (RCM):
approach to maintenance that combines reactive, preventive, predictive,
and proactive maintenance practices and strategies to maximize the life
that a piece of equipment functions in the required manner
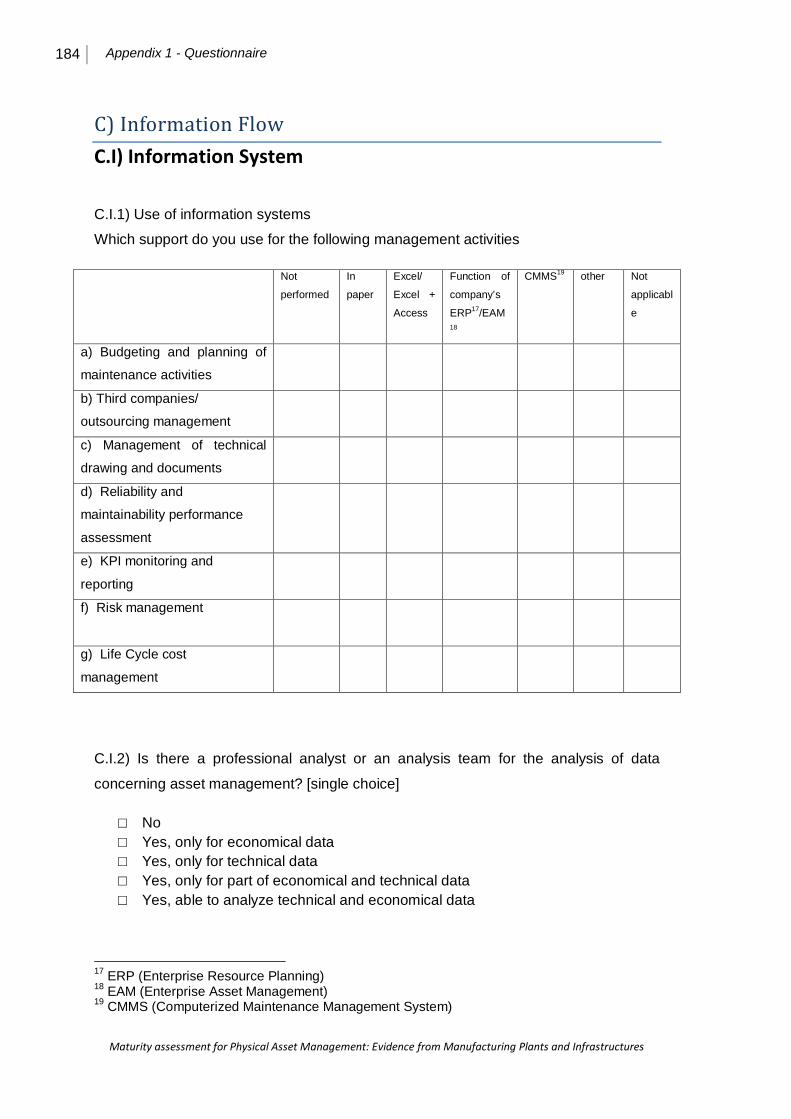
184 Appendix 1 - Questionnaire
Maturity assessment for Physical Asset Management: Evidence from Manufacturing Plants and Infrastructures
C) Information Flow C.I) Information System
C.I.1) Use of information systems
Which support do you use for the following management activities
Not
performed
In
paper
Excel/
Excel +
Access
Function of
company’s
ERP17/EAM18
CMMS19 other Not
applicabl
e
a) Budgeting and planning of
maintenance activities
b) Third companies/
outsourcing management
c) Management of technical
drawing and documents
d) Reliability and
maintainability performance
assessment
e) KPI monitoring and
reporting
f) Risk management
g) Life Cycle cost
management
C.I.2) Is there a professional analyst or an analysis team for the analysis of data
concerning asset management? [single choice]
□ No □ Yes, only for economical data □ Yes, only for technical data □ Yes, only for part of economical and technical data □ Yes, able to analyze technical and economical data
17 ERP (Enterprise Resource Planning) 18 EAM (Enterprise Asset Management) 19 CMMS (Computerized Maintenance Management System)
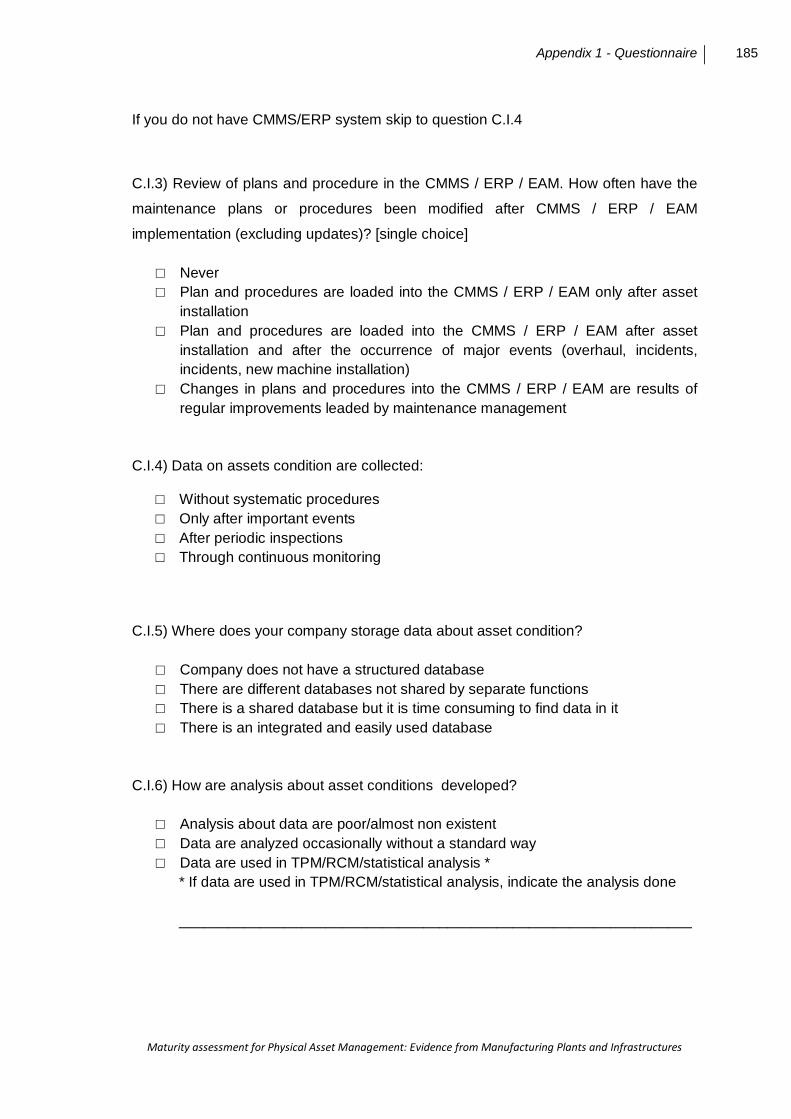
Appendix 1 - Questionnaire 185
Maturity assessment for Physical Asset Management: Evidence from Manufacturing Plants and Infrastructures
If you do not have CMMS/ERP system skip to question C.I.4
C.I.3) Review of plans and procedure in the CMMS / ERP / EAM. How often have the
maintenance plans or procedures been modified after CMMS / ERP / EAM
implementation (excluding updates)? [single choice]
□ Never □ Plan and procedures are loaded into the CMMS / ERP / EAM only after asset
installation □ Plan and procedures are loaded into the CMMS / ERP / EAM after asset
installation and after the occurrence of major events (overhaul, incidents, incidents, new machine installation)
□ Changes in plans and procedures into the CMMS / ERP / EAM are results of regular improvements leaded by maintenance management
C.I.4) Data on assets condition are collected:
□ Without systematic procedures □ Only after important events □ After periodic inspections □ Through continuous monitoring
C.I.5) Where does your company storage data about asset condition?
□ Company does not have a structured database □ There are different databases not shared by separate functions □ There is a shared database but it is time consuming to find data in it □ There is an integrated and easily used database
C.I.6) How are analysis about asset conditions developed?
□ Analysis about data are poor/almost non existent □ Data are analyzed occasionally without a standard way □ Data are used in TPM/RCM/statistical analysis *
* If data are used in TPM/RCM/statistical analysis, indicate the analysis done
_______________________________________________________________

186 Appendix 1 - Questionnaire
Maturity assessment for Physical Asset Management: Evidence from Manufacturing Plants and Infrastructures
C.I.7) Do you use tools such as PDAs (personal data assistant), smart-phone,.. to
support asset management activities
□ No □ Sometimes □ Yes
C.II) Asset Performance Management
C.II.1) The importance of performance measurement is understood by:
Strongly Disagree
Disagree Agree Strongly Agree
Board of Directors
Managers
Operators
C.II.2) What KPIs related to physical asset management are used in your
organization? [multiple choice]
□ Reliability □ Availability □ Maintainability □ Safety □ Security □ Health □ Environmental □ Quality of the business results (quality of products / service…) □ Economics □ Politics (relationship with stakeholders as regulators..) □ Customer Satisfaction □ Employees Satisfaction □ Training □ Others [link them]:________________
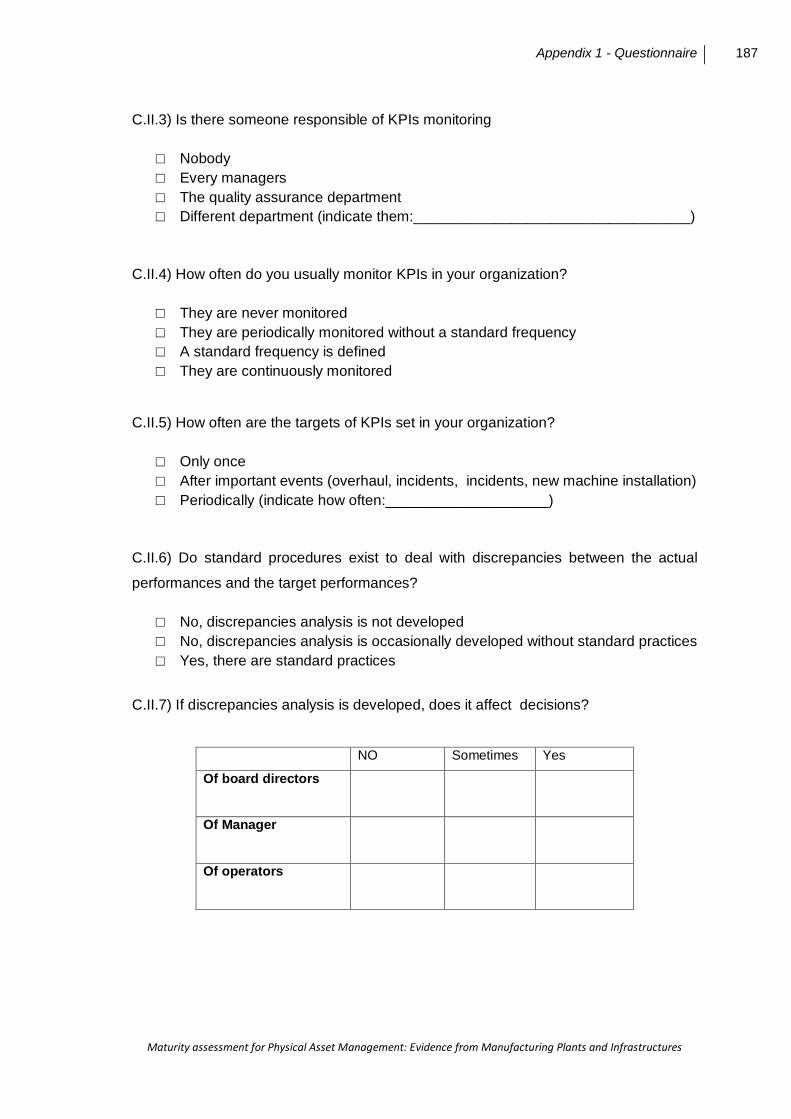
Appendix 1 - Questionnaire 187
Maturity assessment for Physical Asset Management: Evidence from Manufacturing Plants and Infrastructures
C.II.3) Is there someone responsible of KPIs monitoring
□ Nobody □ Every managers □ The quality assurance department □ Different department (indicate them:__________________________________)
C.II.4) How often do you usually monitor KPIs in your organization?
□ They are never monitored □ They are periodically monitored without a standard frequency □ A standard frequency is defined □ They are continuously monitored
C.II.5) How often are the targets of KPIs set in your organization?
□ Only once □ After important events (overhaul, incidents, incidents, new machine installation) □ Periodically (indicate how often:____________________)
C.II.6) Do standard procedures exist to deal with discrepancies between the actual
performances and the target performances?
□ No, discrepancies analysis is not developed □ No, discrepancies analysis is occasionally developed without standard practices □ Yes, there are standard practices
C.II.7) If discrepancies analysis is developed, does it affect decisions?
NO Sometimes Yes
Of board directors
Of Manager
Of operators
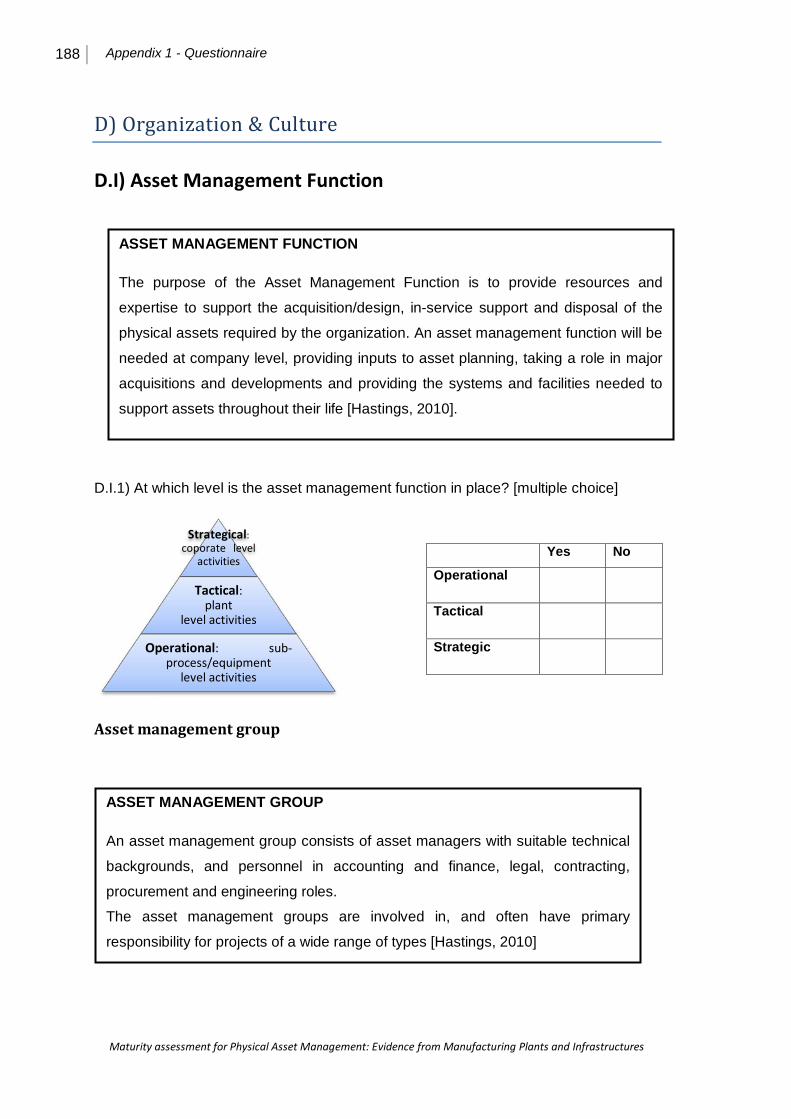
188 Appendix 1 - Questionnaire
Maturity assessment for Physical Asset Management: Evidence from Manufacturing Plants and Infrastructures
D) Organization & Culture
D.I) Asset Management Function
D.I.1) At which level is the asset management function in place? [multiple choice]
Yes No
Operational
Tactical
Strategic
Asset management group
ASSET MANAGEMENT FUNCTION
The purpose of the Asset Management Function is to provide resources and
expertise to support the acquisition/design, in-service support and disposal of the
physical assets required by the organization. An asset management function will be
needed at company level, providing inputs to asset planning, taking a role in major
acquisitions and developments and providing the systems and facilities needed to
support assets throughout their life [Hastings, 2010].
Strategical: coporate level
activities
Tactical: plant
level activities
Operational: sub-process/equipment
level activities
ASSET MANAGEMENT GROUP
An asset management group consists of asset managers with suitable technical
backgrounds, and personnel in accounting and finance, legal, contracting,
procurement and engineering roles.
The asset management groups are involved in, and often have primary
responsibility for projects of a wide range of types [Hastings, 2010]
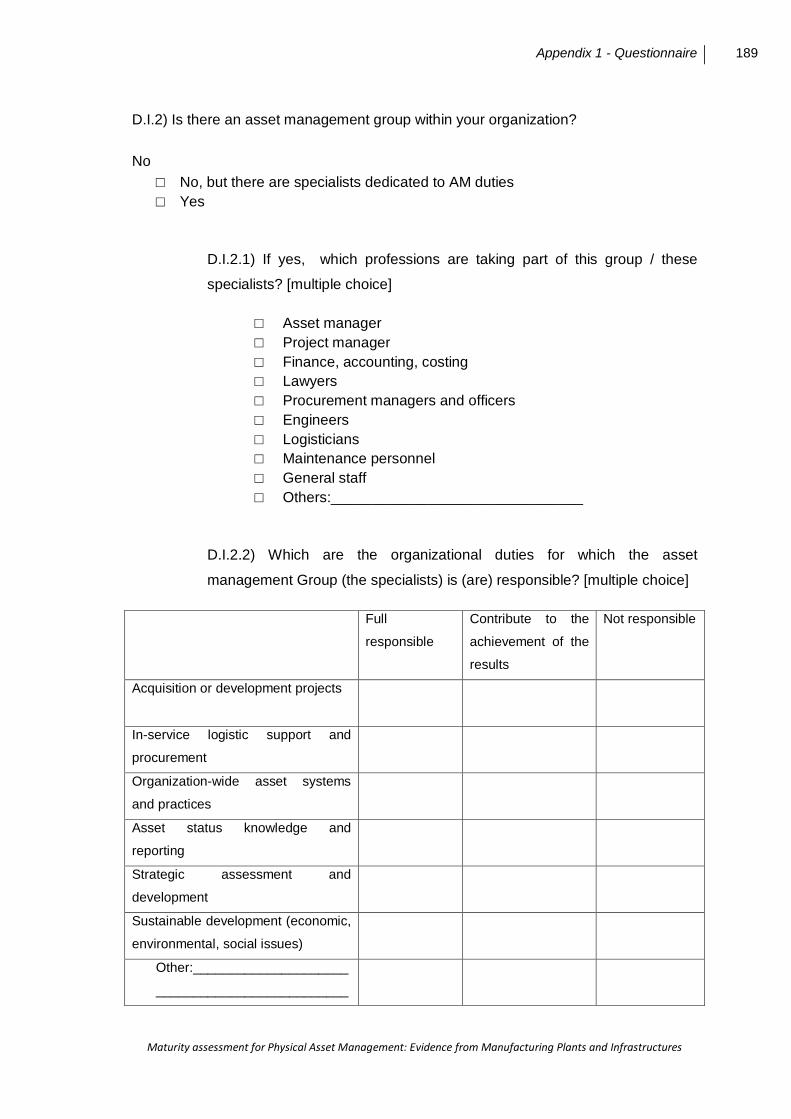
Appendix 1 - Questionnaire 189
Maturity assessment for Physical Asset Management: Evidence from Manufacturing Plants and Infrastructures
D.I.2) Is there an asset management group within your organization?
No □ No, but there are specialists dedicated to AM duties □ Yes
D.I.2.1) If yes, which professions are taking part of this group / these
specialists? [multiple choice]
□ Asset manager □ Project manager □ Finance, accounting, costing □ Lawyers □ Procurement managers and officers □ Engineers □ Logisticians □ Maintenance personnel □ General staff □ Others:_______________________________
D.I.2.2) Which are the organizational duties for which the asset
management Group (the specialists) is (are) responsible? [multiple choice]
Full
responsible
Contribute to the
achievement of the
results
Not responsible
Acquisition or development projects
In-service logistic support and
procurement
Organization-wide asset systems
and practices
Asset status knowledge and
reporting
Strategic assessment and
development
Sustainable development (economic,
environmental, social issues)
Other:_____________________
__________________________
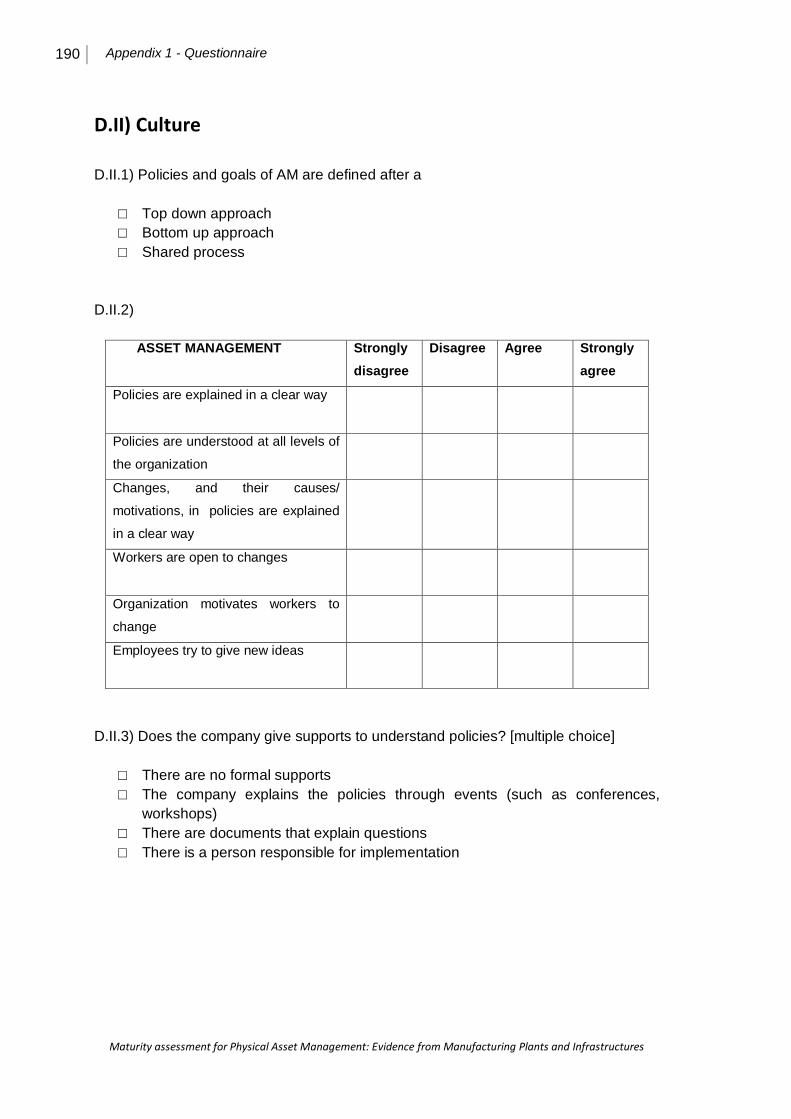
190 Appendix 1 - Questionnaire
Maturity assessment for Physical Asset Management: Evidence from Manufacturing Plants and Infrastructures
D.II) Culture
D.II.1) Policies and goals of AM are defined after a
□ Top down approach □ Bottom up approach □ Shared process
D.II.2)
ASSET MANAGEMENT Strongly disagree
Disagree Agree Strongly agree
Policies are explained in a clear way
Policies are understood at all levels of
the organization
Changes, and their causes/
motivations, in policies are explained
in a clear way
Workers are open to changes
Organization motivates workers to
change
Employees try to give new ideas
D.II.3) Does the company give supports to understand policies? [multiple choice]
□ There are no formal supports □ The company explains the policies through events (such as conferences,
workshops) □ There are documents that explain questions □ There is a person responsible for implementation
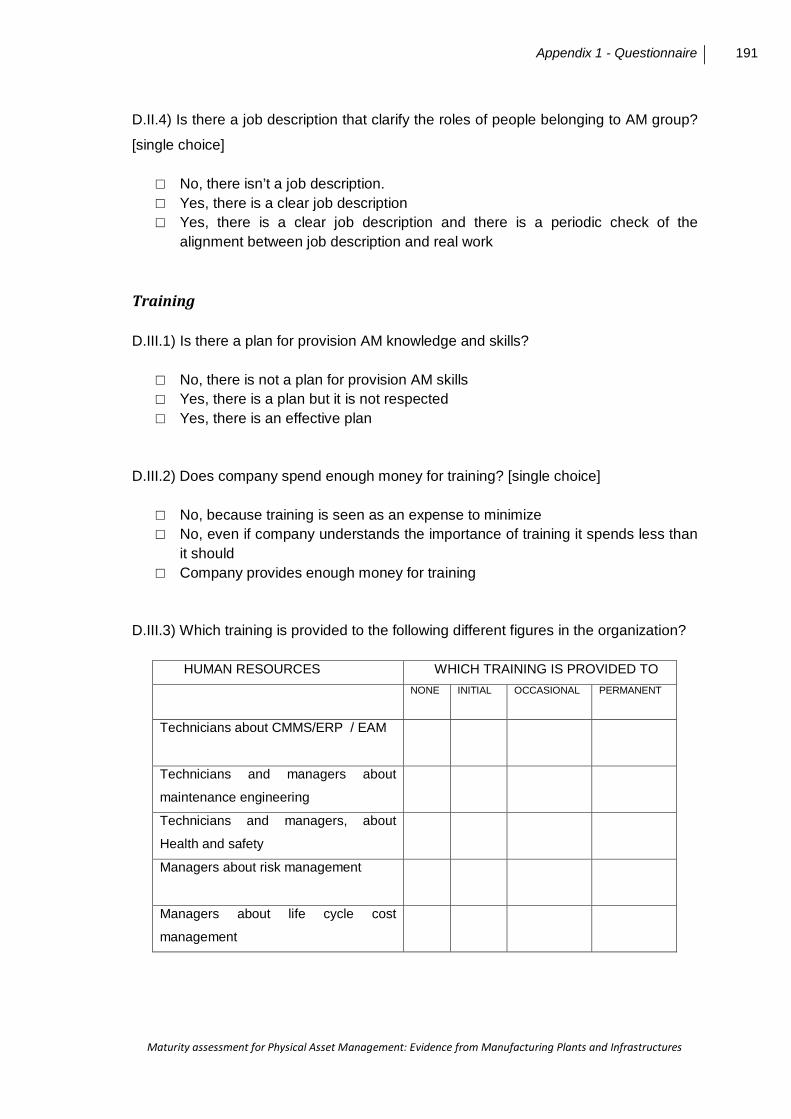
Appendix 1 - Questionnaire 191
Maturity assessment for Physical Asset Management: Evidence from Manufacturing Plants and Infrastructures
D.II.4) Is there a job description that clarify the roles of people belonging to AM group?
[single choice]
□ No, there isn’t a job description. □ Yes, there is a clear job description □ Yes, there is a clear job description and there is a periodic check of the
alignment between job description and real work
Training
D.III.1) Is there a plan for provision AM knowledge and skills?
□ No, there is not a plan for provision AM skills □ Yes, there is a plan but it is not respected □ Yes, there is an effective plan
D.III.2) Does company spend enough money for training? [single choice]
□ No, because training is seen as an expense to minimize □ No, even if company understands the importance of training it spends less than
it should □ Company provides enough money for training
D.III.3) Which training is provided to the following different figures in the organization?
HUMAN RESOURCES WHICH TRAINING IS PROVIDED TO
NONE INITIAL OCCASIONAL
PERMANENT
Technicians about CMMS/ERP / EAM
Technicians and managers about
maintenance engineering
Technicians and managers, about
Health and safety
Managers about risk management
Managers about life cycle cost
management
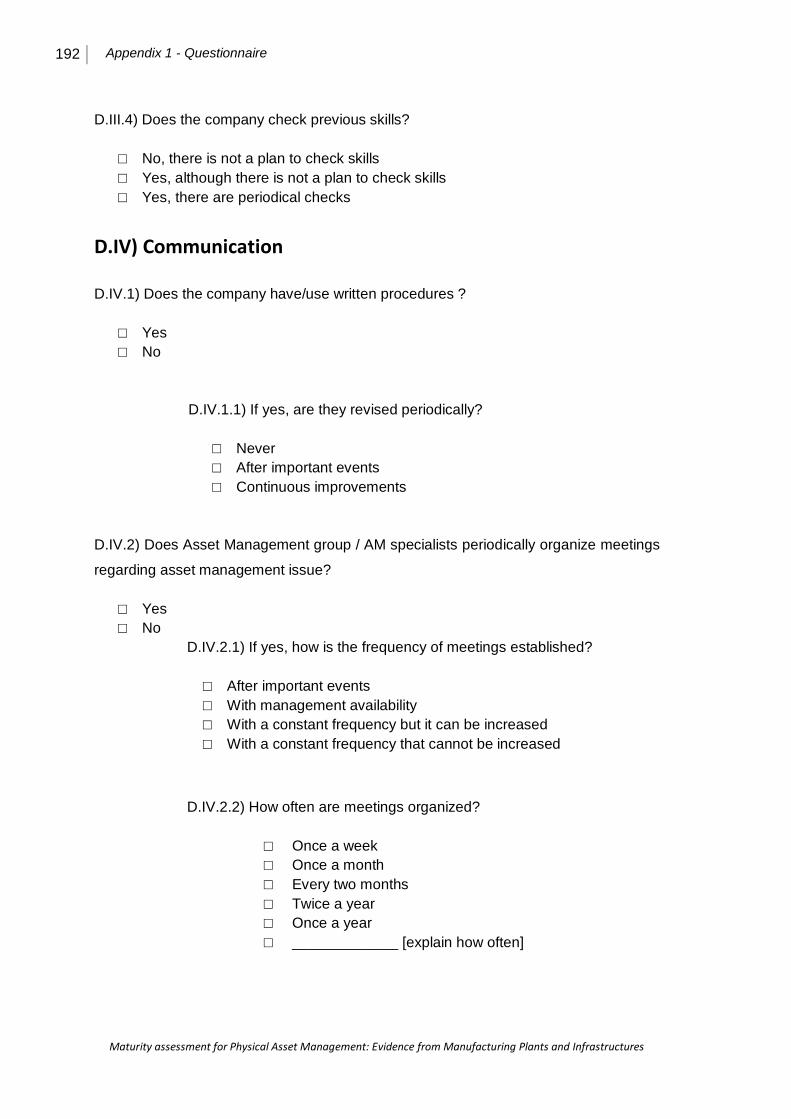
192 Appendix 1 - Questionnaire
Maturity assessment for Physical Asset Management: Evidence from Manufacturing Plants and Infrastructures
D.III.4) Does the company check previous skills?
□ No, there is not a plan to check skills □ Yes, although there is not a plan to check skills □ Yes, there are periodical checks
D.IV) Communication
D.IV.1) Does the company have/use written procedures ?
□ Yes □ No
D.IV.1.1) If yes, are they revised periodically?
□ Never □ After important events □ Continuous improvements
D.IV.2) Does Asset Management group / AM specialists periodically organize meetings
regarding asset management issue?
□ Yes □ No
D.IV.2.1) If yes, how is the frequency of meetings established?
□ After important events □ With management availability □ With a constant frequency but it can be increased □ With a constant frequency that cannot be increased
D.IV.2.2) How often are meetings organized?
□ Once a week □ Once a month □ Every two months □ Twice a year □ Once a year □ _____________ [explain how often]
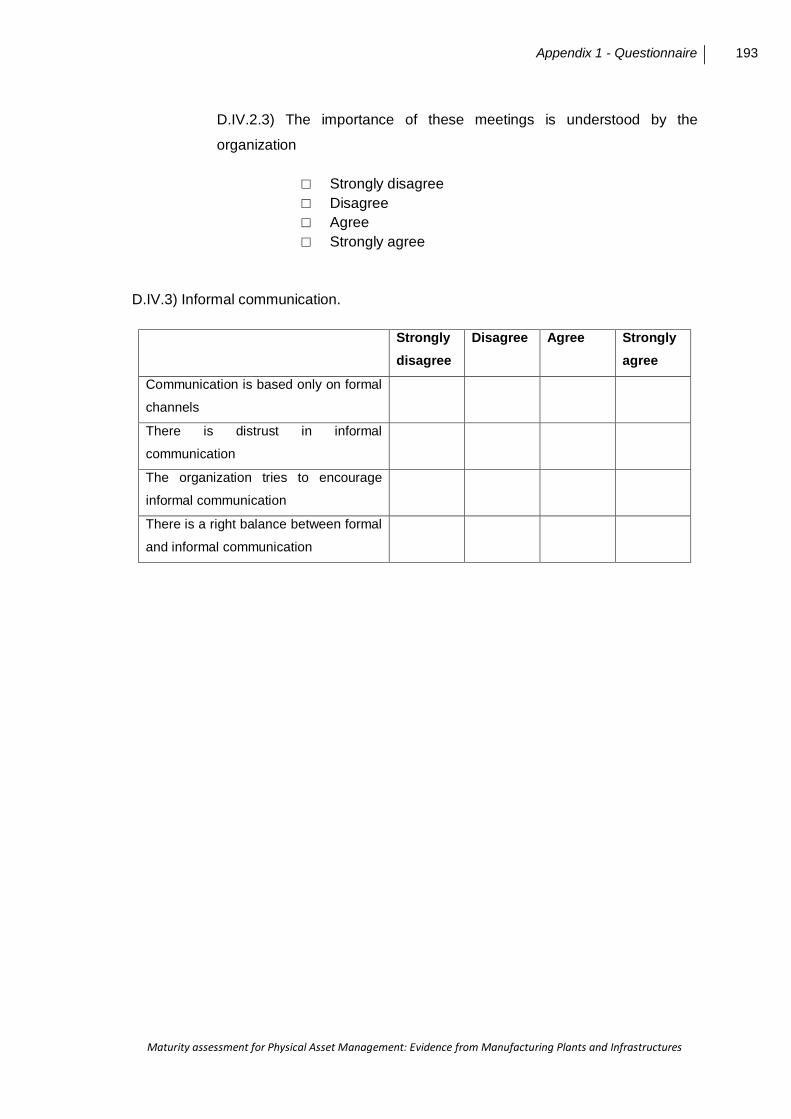
Appendix 1 - Questionnaire 193
Maturity assessment for Physical Asset Management: Evidence from Manufacturing Plants and Infrastructures
D.IV.2.3) The importance of these meetings is understood by the
organization
□ Strongly disagree □ Disagree □ Agree □ Strongly agree
D.IV.3) Informal communication.
Strongly disagree
Disagree Agree Strongly agree
Communication is based only on formal
channels
There is distrust in informal
communication
The organization tries to encourage
informal communication
There is a right balance between formal
and informal communication
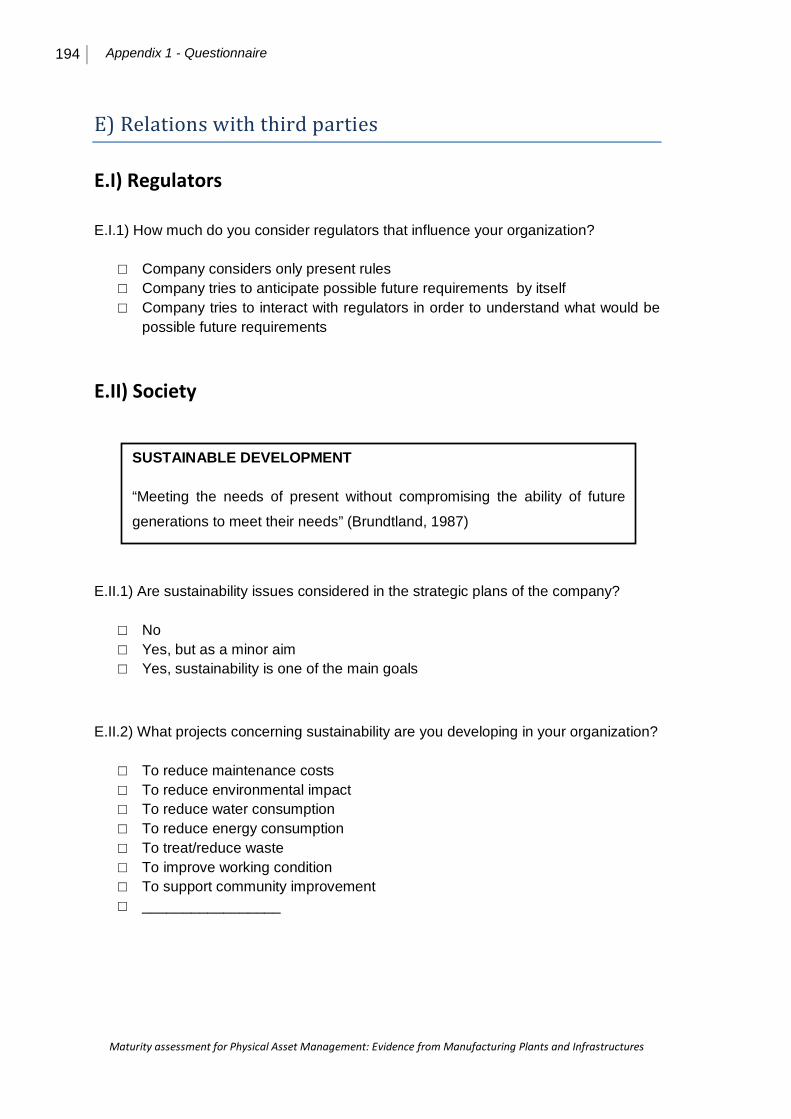
194 Appendix 1 - Questionnaire
Maturity assessment for Physical Asset Management: Evidence from Manufacturing Plants and Infrastructures
E) Relations with third parties
E.I) Regulators
E.I.1) How much do you consider regulators that influence your organization?
□ Company considers only present rules □ Company tries to anticipate possible future requirements by itself □ Company tries to interact with regulators in order to understand what would be
possible future requirements
E.II) Society
E.II.1) Are sustainability issues considered in the strategic plans of the company?
□ No □ Yes, but as a minor aim □ Yes, sustainability is one of the main goals
E.II.2) What projects concerning sustainability are you developing in your organization?
□ To reduce maintenance costs □ To reduce environmental impact □ To reduce water consumption □ To reduce energy consumption □ To treat/reduce waste □ To improve working condition □ To support community improvement □ _________________
SUSTAINABLE DEVELOPMENT
“Meeting the needs of present without compromising the ability of future
generations to meet their needs” (Brundtland, 1987)

Appendix 1 - Questionnaire 195
Maturity assessment for Physical Asset Management: Evidence from Manufacturing Plants and Infrastructures
E.III) Outsourcing
E.III.1) How many contractors do you have? (order of magnitude)
_____________________________________
E.III.2) Which service does your organization outsource?
□ Maintenance □ Design □ Construction □ Other:_____________
If your organization have maintenance service providers
E.III.2.1) Which services are offered by your maintenance providers?
□ Assistance in defining product specification; □ Assistance during the installation and commissioning phase of a
product/system; □ Assistance in defining the operational strategy; □ Field service – maintenance tasks; □ Remote diagnostics; □ Expert assistance for at site diagnostics and repair; □ Help desk, online help, telephone support; □ Advanced training; □ Logistic support optimization; □ Assistance in product End-Of-Life management; □ IT □ Other:__________________________________________
E.III.3) How does your organization share information with its service providers?
□ There is no database shared between company and contractors □ Contractors have their databases and only some information is shared □ There are some shared databases but contractors cannot update them □ There is an integrated database, easily accessible for both parts
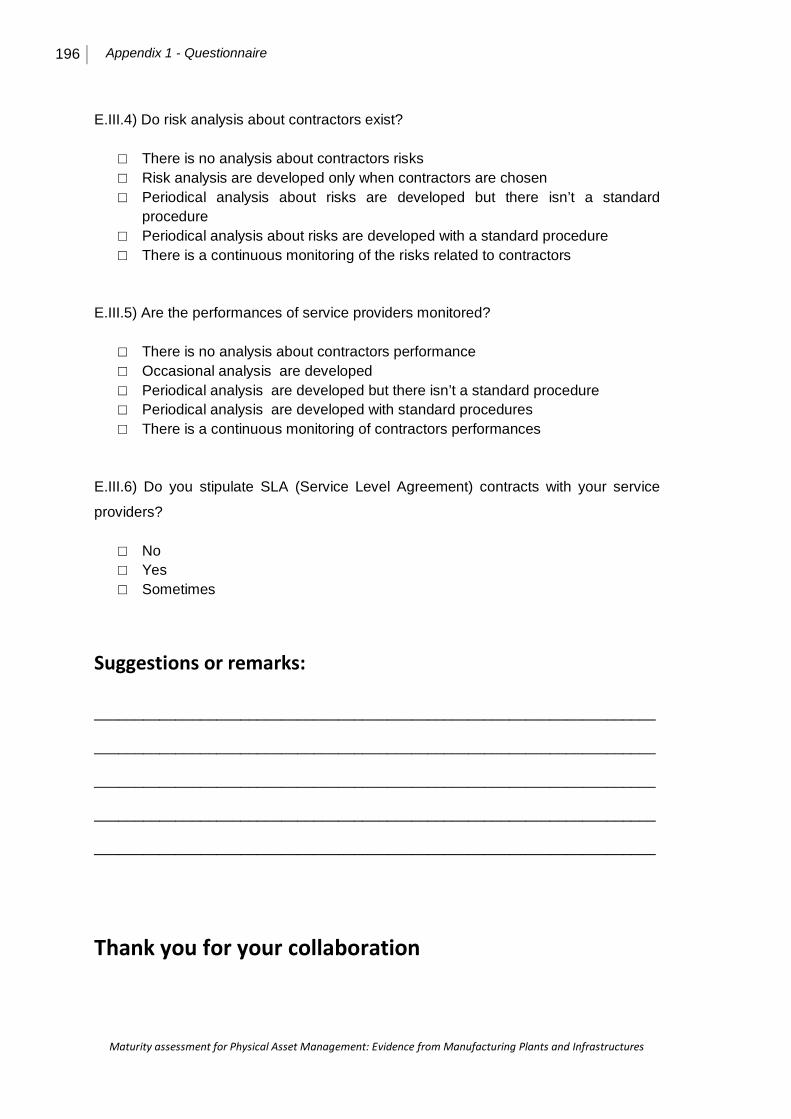
196 Appendix 1 - Questionnaire
Maturity assessment for Physical Asset Management: Evidence from Manufacturing Plants and Infrastructures
E.III.4) Do risk analysis about contractors exist?
□ There is no analysis about contractors risks □ Risk analysis are developed only when contractors are chosen □ Periodical analysis about risks are developed but there isn’t a standard
procedure □ Periodical analysis about risks are developed with a standard procedure □ There is a continuous monitoring of the risks related to contractors
E.III.5) Are the performances of service providers monitored?
□ There is no analysis about contractors performance □ Occasional analysis are developed □ Periodical analysis are developed but there isn’t a standard procedure □ Periodical analysis are developed with standard procedures □ There is a continuous monitoring of contractors performances
E.III.6) Do you stipulate SLA (Service Level Agreement) contracts with your service
providers?
□ No □ Yes □ Sometimes
Suggestions or remarks:
_____________________________________________________________________
_____________________________________________________________________
_____________________________________________________________________
_____________________________________________________________________
_____________________________________________________________________
Thank you for your collaboration