Mattias von Brömsse - Targetting safe aquifers
19
Targeting arsenic-safe aquifers in regions with high arsenic groundwater in Bangladesh and India MATTIAS VON BRÖMSSEN, PROSUN BHATTACHARYA, GUNNAR JACKS, ASHIS BISWAS, ROGER THUNVIK, KAZI MATIN AHMED & AZIZ HASAN
-
Upload
geological-survey-of-sweden -
Category
Presentations & Public Speaking
-
view
218 -
download
0
Transcript of Mattias von Brömsse - Targetting safe aquifers

Targeting arsenic-safe aquifers in regions with high arsenic groundwater in Bangladesh and India
MATTIAS VON BRÖMSSEN, PROSUN BHATTACHARYA, GUNNAR JACKS, ASHIS BISWAS, ROGER THUNVIK, KAZI MATIN AHMED & AZIZ HASAN

INTRODUCTION Recognition and magnitude of high arsenic groundwater in Bangladesh
•Highly productive aquifers and easy available and affordable hand tube wells (HTW), 100 m depth
• In Bangladesh, groundwater have been the element for two recent achievements
- access to safe drinking water
- food security through excessive use of GW for irrigation
•Now at threat due to elevated conc. of arsenic
•National survey => 47% above WHO (10 ug/l)
• Exposure through (50/50%)
- drinking water
- food chain
• Exposed population in the order of 10th of M of people (35-77 M)

INTRODUCTION Drinking water practice in rural Bangladesh and lessons learned from previous mitigation activities
71
95
85
100
2
67
0 50 100
Dugwells (231)
Pond Sand Filters (37)
Rain Water Harvesters(90)
Arsenic removal filters(10,569)
Deep Tubewell (58)
Bishudhya Filters (30)
%
Active Inactive

RESEARCH OBJECTIVES

RESEARCH OBJECTIVES
1. The overall objective of the study has been focused on assessing the potential for local drillers to target As safe groundwater
2. The specific objectives have been to validate the correlation between aquifer sediment colours and groundwater chemical composition, characterize aqueous and solid phase geochemistry and dynamics of As mobility and to assess the risk for cross-contamination of As between aquifers in Matlab Upazila in southeastern Bangladesh

HYDROGEOLOGICAL AND GEOCHEMICAL CONTEXT High arsenic groundwater in Bangladesh
A. Reductive dissolution
B. Pleistocene, ox, flushed
C. ?
mobilisation immobilisation
MATERIAL AND METHODS
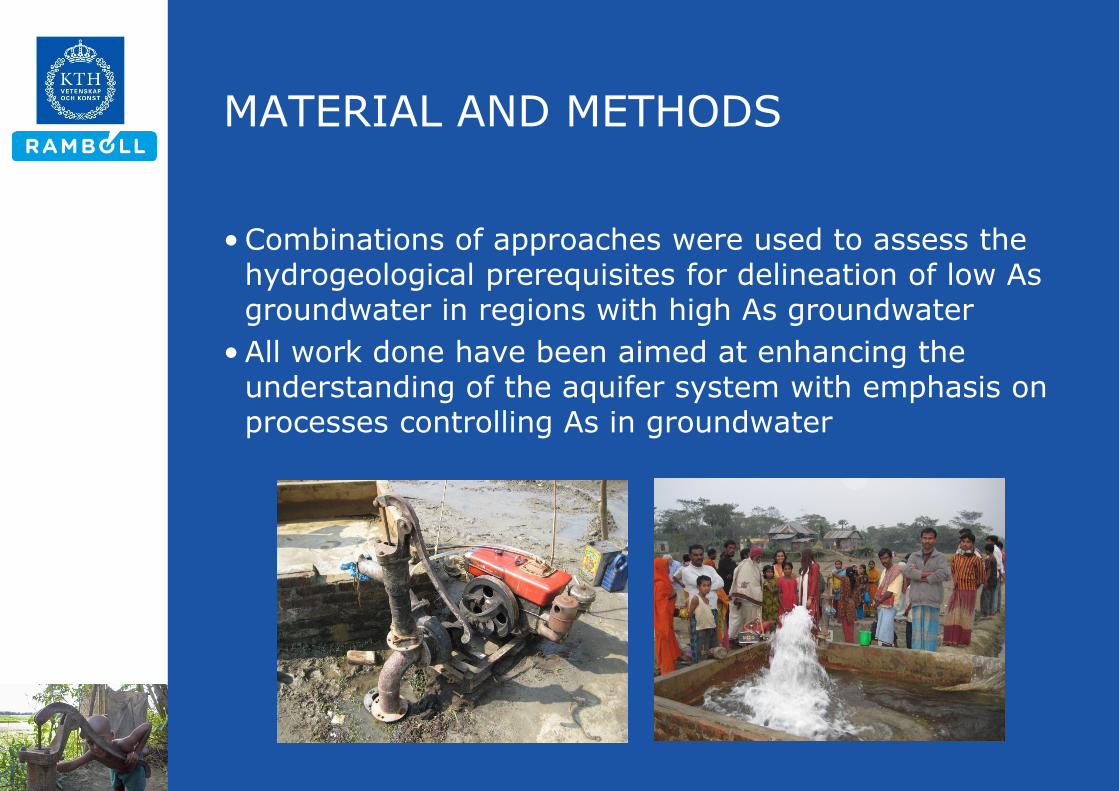
•Combinations of approaches were used to assess the hydrogeological prerequisites for delineation of low As groundwater in regions with high As groundwater
•All work done have been aimed at enhancing the understanding of the aquifer system with emphasis on processes controlling As in groundwater

MATERIAL AND METHODS Sediment colours
• In order to verify the local drillers knowledge of the sediment characteristics simple drilling tests were done
• Groundwater sampling were carried out from HTW (Matlab) with known depth and colour of the sediments at the tubewells screen, subsequently the groundwater composition was linked to the colour characteristics of the sediment
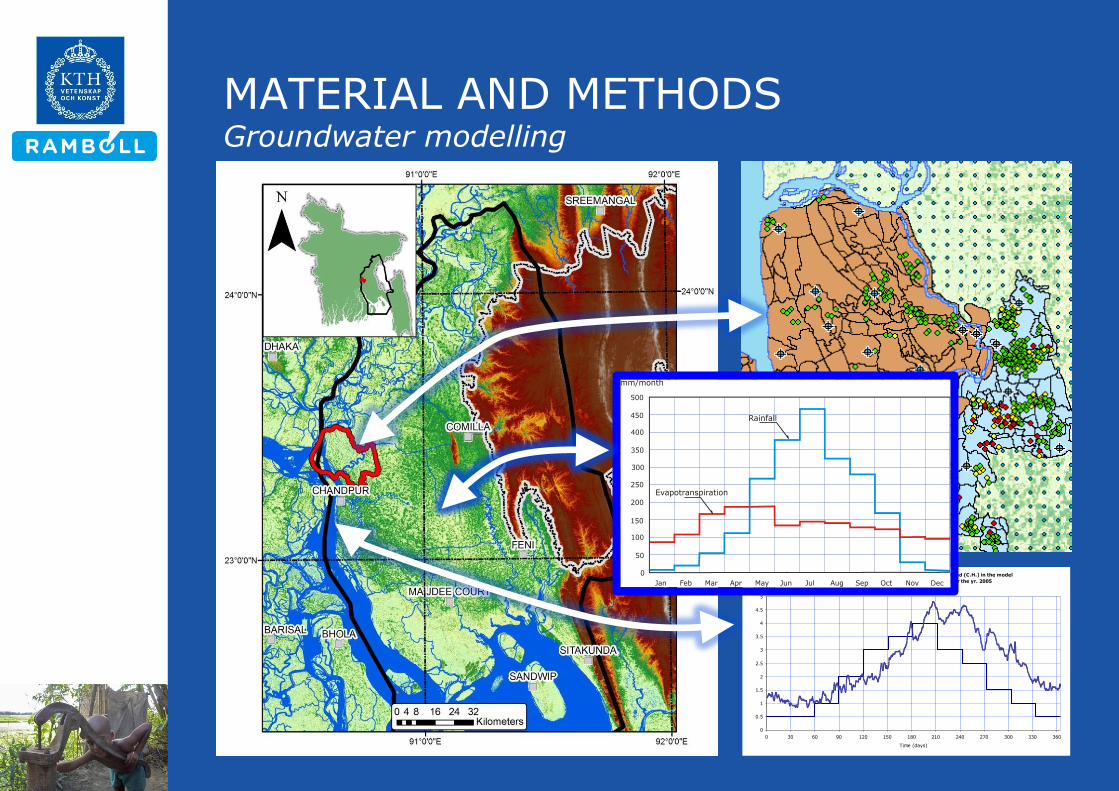
MATERIAL AND METHODS Groundwater modelling
Idealised surafce water levels (m) introduced as constant head (C.H.) in the model
and actual surface water levels at Matab (Meghna) for the yr. 2005
0
0.5
1
1.5
2
2.5
3
3.5
4
4.5
5
0 30 60 90 120 150 180 210 240 270 300 330 360
Time (days)
(m.a.s.l.)
Jan
500
mm/month
Rainfall
Evapotranspiration
450
400
350
300
250
200
150
100
50
0
Feb Mar Apr May Jun Jul Aug Sep Oct Nov Dec

RESULTS and DISCUSSION The drillers perception of sediment characteristics

Redox classification
Black White Off-White Red
Sediment colour
0.0
4.0
8.0
12.0
16.0
20.0
Fe
mg
/l
Black White Off-White Red
Sediment colour
0.0
0.8
1.6
2.4
3.2
4.0
Mn
mg
/l
Black White Off-White Red
Sediment colour
0.0
1.0
2.0
3.0
4.0
5.0
SO
4 m
g/l
red
off-white
white
black
MnMntottot
FeFetottot
SOSO4422--
8th International Conference on the Biogeochemistry of Trace Elements (ICOBTE), Adelaide, Australia
a b
c d
Blac k Whi teOff-Whi te Red
Sediment colour
0.0
80.0
160.0
240.0
320.0
400.0
As
ug/l
L e g e n d
M a x .
7 5 p e rc e n ti l e
M e d ia n
2 5 p e rc e n ti l e
M in .
Ars
enic
concentr
ation

RESULTS and DISCUSSION Sequence of aquifer sediments

RESULTS and DISCUSSION Geochemical investigations, relationship between As and other elements at the water-solid interface
• Elevated concentrations of Mn and Fe is prone to be generated through reductive dissolution
• Highest concentrations would be expected (FeOx and MnOx) in the reducing unit/zone (redox chemistry) but Mn are relatively lower in this unit
• This implies that secondary mineral phases control Mn in the reducing unit/sediments
0 50 100 150 200 250 300 350
18
21
23
33
40
44
49
51
52
54
Mn (mg/kg)
0 500 1 000 1 500 2 000 2 500 3 000 3 500 4 000
18
21
23
33
40
44
49
51
52
54
As (ug/kg)
0 5 000 10 000 15 000 20 000 25 000 30 000 35 000
18
21
23
33
40
44
49
51
52
54
Fe (mg/kg)
Sequential extraction (Arsenic)
01000
2000
3000
4000
18
21
23
33
40
44
49
51
52
54
Sample
As (
ug
/kg
)HNO3
Oxalate+AA
Oxalate
NaAc
Sequential extraction (Arsenic)
01000
2000
3000
4000
18
21
23
33
40
44
49
51
52
54
Sample
As (
ug
/kg
)HNO3
Oxalate+AA
Oxalate
NaAc
Sequential extraction (Arsenic)
01000
2000
3000
4000
18
21
23
33
40
44
49
51
52
54
Sample
As (
ug
/kg
)HNO3
Oxalate+AA
Oxalate
NaAc
Reduced unit
Oxidised unitSam
ple
(depth
, m
)
As (µg/kg)
Reduced unit
Oxidised unitSam
ple
(depth
, m
)
Fe (mg/kg)
Reduced unit
Oxidised unitSam
ple
(depth
, m
)
Mn (mg/kg)
a) b)
c)
Redox classification
Black White Off-White Red
Sediment colour
0.0
4.0
8.0
12.0
16.0
20.0
Fe
mg
/l
Black White Off-White Red
Sediment colour
0.0
0.8
1.6
2.4
3.2
4.0
Mn
mg
/l
Black White Off-White Red
Sediment colour
0.0
1.0
2.0
3.0
4.0
5.0
SO
4 m
g/l
red
off-white
white
black
MnMntottot
FeFetottot
SOSO4422--
8th International Conference on the Biogeochemistry of Trace Elements (ICOBTE), Adelaide, Australia
SI calculations implies that rhodochrosite and/or MnHPO4 may control Mn in this unit and hydroxyapatite PO4
3--tot

RESULTS and DISCUSSION Geochemical investigations, relationship between As and other elements at the water-solid interface
• Further, As would be expected to be lower in the reducing unit if Hfo is the major sorbent (FeOx)
• It is likely to believe that PO43--tot act as a major
competing ion for sorption sites
Hfo
(5 - 100 g/l)
As (ads) As (aq);
Astot = 2.1 – 7.7 mg/l (B.C. total available amount)
PO43--tot (ads) PO4
3-- (aq) Phosphate minerals;
PO43--tot (aq) = 0.5 – 8 mg/l (B.C. constant dissolved concentration)
1
0 50 100 150 200 250 300 350
18
21
23
33
40
44
49
51
52
54
Mn (mg/kg)
0 500 1 000 1 500 2 000 2 500 3 000 3 500 4 000
18
21
23
33
40
44
49
51
52
54
As (ug/kg)
0 5 000 10 000 15 000 20 000 25 000 30 000 35 000
18
21
23
33
40
44
49
51
52
54
Fe (mg/kg)
Sequential extraction (Arsenic)
01000
2000
3000
4000
18
21
23
33
40
44
49
51
52
54
Sample
As (
ug
/kg
)HNO3
Oxalate+AA
Oxalate
NaAc
Sequential extraction (Arsenic)
01000
2000
3000
4000
18
21
23
33
40
44
49
51
52
54
Sample
As (
ug
/kg
)HNO3
Oxalate+AA
Oxalate
NaAc
Sequential extraction (Arsenic)
01000
2000
3000
4000
18
21
23
33
40
44
49
51
52
54
Sample
As (
ug
/kg
)HNO3
Oxalate+AA
Oxalate
NaAc
Reduced unit
Oxidised unitSam
ple
(depth
, m
)
As (µg/kg)
Reduced unit
Oxidised unitSam
ple
(depth
, m
)
Fe (mg/kg)
Reduced unit
Oxidised unitSam
ple
(depth
, m
)
Mn (mg/kg)
a) b)
c)
Ca5(PO4)3(OH)
Fe3(PO4)2●8(H2O)
MnHPO4
0 50 100 150 200 250 300 350
18
21
23
33
40
44
49
51
52
54
Mn (mg/kg)
0 500 1 000 1 500 2 000 2 500 3 000 3 500 4 000
18
21
23
33
40
44
49
51
52
54
As (ug/kg)
0 5 000 10 000 15 000 20 000 25 000 30 000 35 000
18
21
23
33
40
44
49
51
52
54
Fe (mg/kg)
Sequential extraction (Arsenic)
01000
2000
3000
4000
18
21
23
33
40
44
49
51
52
54
Sample
As (
ug
/kg
)HNO3
Oxalate+AA
Oxalate
NaAc
Sequential extraction (Arsenic)
01000
2000
3000
4000
18
21
23
33
40
44
49
51
52
54
Sample
As (
ug
/kg
)HNO3
Oxalate+AA
Oxalate
NaAc
Sequential extraction (Arsenic)
01000
2000
3000
4000
18
21
23
33
40
44
49
51
52
54
Sample
As (
ug
/kg
)HNO3
Oxalate+AA
Oxalate
NaAc
Reduced unit
Oxidised unitSam
ple
(depth
, m
)
As (µg/kg)
Reduced unit
Oxidised unitSam
ple
(depth
, m
)
Fe (mg/kg)
Reduced unit
Oxidised unitSam
ple
(depth
, m
)
Mn (mg/kg)
a) b)
c)
0 50 100 150 200 250 300 350
18
21
23
33
40
44
49
51
52
54
Mn (mg/kg)
0 500 1 000 1 500 2 000 2 500 3 000 3 500 4 000
18
21
23
33
40
44
49
51
52
54
As (ug/kg)
0 5 000 10 000 15 000 20 000 25 000 30 000 35 000
18
21
23
33
40
44
49
51
52
54
Fe (mg/kg)
Sequential extraction (Arsenic)
01000
2000
3000
4000
18
21
23
33
40
44
49
51
52
54
SampleA
s (
ug
/kg
)HNO3
Oxalate+AA
Oxalate
NaAc
Sequential extraction (Arsenic)
01000
2000
3000
4000
18
21
23
33
40
44
49
51
52
54
Sample
As (
ug
/kg
)HNO3
Oxalate+AA
Oxalate
NaAc
Sequential extraction (Arsenic)
01000
2000
3000
4000
18
21
23
33
40
44
49
51
52
54
Sample
As (
ug
/kg
)HNO3
Oxalate+AA
Oxalate
NaAc
Reduced unit
Oxidised unitSam
ple
(depth
, m
)
As (µg/kg)
Reduced unit
Oxidised unitSam
ple
(depth
, m
)
Fe (mg/kg)
Reduced unit
Oxidised unitSam
ple
(depth
, m
)
Mn (mg/kg)
a) b)
c)
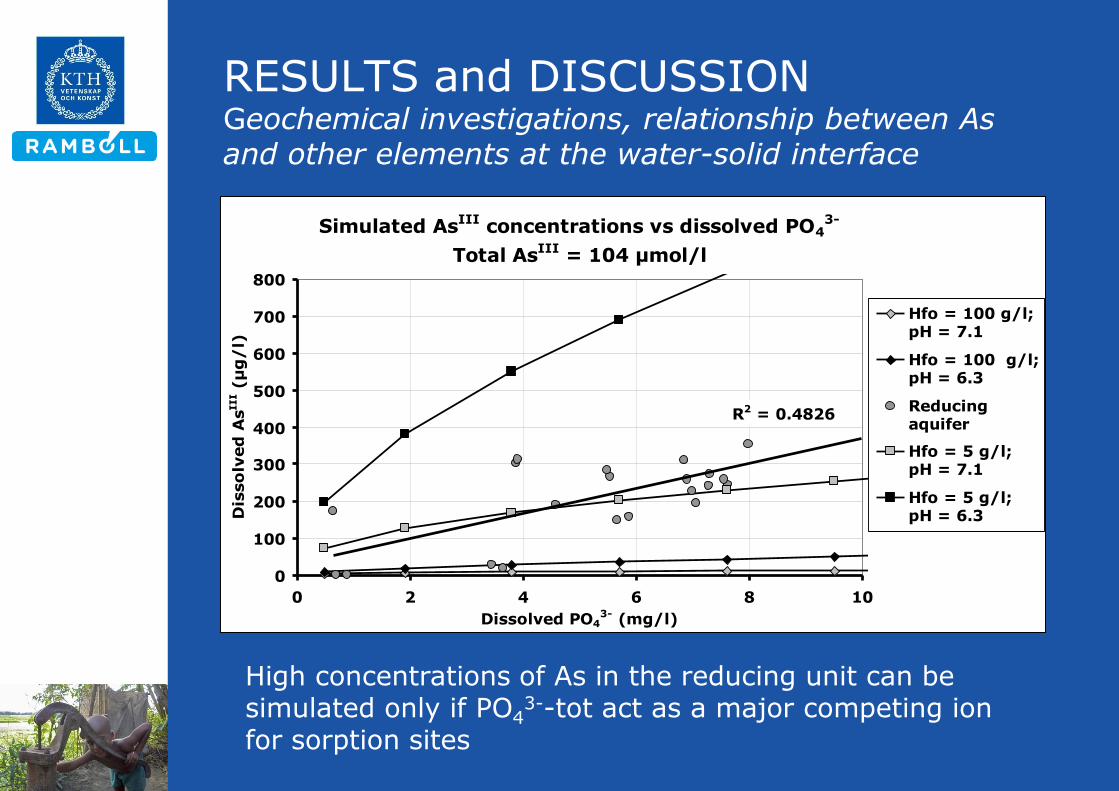
RESULTS and DISCUSSION Geochemical investigations, relationship between As and other elements at the water-solid interface
Simulated AsIII concentrations vs dissolved PO43-
Total AsIII = 104 µmol/l
R2 = 0.4826
0
100
200
300
400
500
600
700
800
0 2 4 6 8 10
Dissolved PO43- (mg/l)
Dis
so
lved
As
III (
µg
/l)
Hfo = 100 g/l;pH = 7.1
Hfo = 100 g/l;pH = 6.3
Reducingaquifer
Hfo = 5 g/l; pH = 7.1
Hfo = 5 g/l; pH = 6.3
Simulated AsIII concentrations vs dissolved PO43-
Total AsIII = 28 µmol/l
R2 = 0.4826
0
50
100
150
200
250
300
350
400
0 2 4 6 8 10
Dissolved PO43- (mg/l)
Dis
so
lved
As
III (
µg
/l)
Hfo = 100 g/l;pH = 7.1
Hfo = 100 g/l;pH = 6.3
Reducingaquifer
Hfo = 5 g/l; pH = 7.1
Hfo = 5 g/l; pH = 6.3
High concentrations of As in the reducing unit can be simulated only if PO4
3--tot act as a major competing ion for sorption sites

RESULTS and DISCUSSION Groundwater flow modelling
MatlabR. M
eghnaLocal flow zone
Regional flow
14-C dating of groundwater
Calculated GW ages assuming a natural vertical
gradient (1%) only and K(vertical) = 1.5×10e-8 m/s
0
10
20
30
40
50
60
70
80
90
100
0 2000 4000 6000 8000 10000 12000 14000 16000 18000
Age (yr BP)
Dep
th (
m.b
.g.l
)
14C age Calculated
Local flow system

•…
RESULTS and DISCUSSION Groundwater flow modelling
SASMIT 3
-2
0
2
4
6
8
10
1216 1246 1276 1306 1336 1366 1396 1426 1456 1486 1516 1546 1576 1606 1636 1666 1696
285 ft
230 ft
170 ft
95 ft
55 ft
SASMIT 4
-2
0
2
4
6
8
10
1216 1246 1276 1306 1336 1366 1396 1426 1456 1486 1516 1546 1576 1606 1636 1666 1696
780 ft
247 ft
187 ft
100 ft
55 ft
SASMIT 5
-2
0
2
4
6
8
10
1216 1246 1276 1306 1336 1366 1396 1426 1456 1486 1516 1546 1576 1606 1636 1666 1696
780 ft
215 ft
215 ft
95 ft
35 ft
SASMIT 6
-2
0
2
4
6
8
10
1216 1246 1276 1306 1336 1366 1396 1426 1456 1486 1516 1546 1576 1606 1636 1666 1696
780 ft
290 ft
130 ft
100 ft
50 ft
SASMIT 7
-2
0
2
4
6
8
10
1216 1246 1276 1306 1336 1366 1396 1426 1456 1486 1516 1546 1576 1606 1636 1666 1696
760 ft
245 ft
175 ft
85 ft
45 ft
SASMIT 8
-2
0
2
4
6
8
10
1216 1246 1276 1306 1336 1366 1396 1426 1456 1486 1516 1546 1576 1606 1636 1666 1696
770 ft
330 ft
230 ft
175 ft
45 ft
SASMIT 9
-2
0
2
4
6
8
10
1216 1246 1276 1306 1336 1366 1396 1426 1456 1486 1516 1546 1576 1606 1636 1666 1696
740 ft
215 ft
145 ft
95 ft
30 ft
SASMIT 10
-2
0
2
4
6
8
10
1216 1246 1276 1306 1336 1366 1396 1426 1456 1486 1516 1546 1576 1606 1636 1666 1696
770 ft
85 ft
50 ft
SASMIT 11
-2
0
2
4
6
8
10
1216 1246 1276 1306 1336 1366 1396 1426 1456 1486 1516 1546 1576 1606 1636 1666 1696
740
125 ft
60 ft
SASMIT 12
-2
0
2
4
6
8
10
1216 1246 1276 1306 1336 1366 1396 1426 1456 1486 1516 1546 1576 1606 1636 1666 1696
740
265 ft
90 ft
45 ft

CONCLUSIONS
• Awareness made the local drillers change their installation practices, if the drillers can target safe aquifers, it would be a very viable mitigation option
• Groundwater composition correlates well with the colours of the aquifer sediments and adds to the explanation on As heterogenic distribution
• PO43--tot seems to be an important competing ion in the
system and mobilisation of As
• Fe and Mn are controlled by secondary carbonates and phosphates in the aquifers
• Two flow system is abundant
• Mn may pose a problem due to health consequences
• The risk for cross-contamination will depend on abstraction of groundwater for irrigation purposes

ACKNOWLEGEMENTS
Sida, MISTRA & Ramböll Foundation
THANK YOU!