Matthew Schroeder - The University of Virginia · Web viewMatthew Schroeder Megan Kersh Ward...
119
FINAL CONTRACT REPORT DRAFT Scenario-Based Planning for the Regional Impacts of Statewide Multimodal Transportation Polices JAMES H. LAMBERT Center Associate Director Research Associate Professor of Systems and Information Engineering MATTHEW J. SCHROEDER Graduate Research Assistant Center for Risk Management of Engineering Systems University of Virginia
Transcript of Matthew Schroeder - The University of Virginia · Web viewMatthew Schroeder Megan Kersh Ward...
FINAL CONTRACT REPORT
DRAFT
Scenario-Based Planning for the Regional Impacts of StatewideMultimodal Transportation Polices
JAMES H. LAMBERTCenter Associate Director
Research Associate Professor of Systems and Information Engineering
MATTHEW J. SCHROEDERGraduate Research Assistant
Center for Risk Management of Engineering SystemsUniversity of Virginia
DRAFT August 6, 2008
PROJECT TEAM – need to double checkPROJECT TEAM
University of Virginia
James Lambert, Associate Director, Center for Risk Management of Engineering SystemsMatthew SchroederMegan KershWard WilliamsAsad Saqib
Project Steering Committee Wayne Ferguson, VTRCKatherine Graham, VDOTMark McCaskill, Roanoke MPOJohn Miller, VTRCKimberly Pryor Spence, Multimodal OfficeMary Lynn Tischer, Multimodal Office
Acknowledgements
Ralph Davis, VDOTJoost Santos, UVaChad Tucker, VDOTBen Mannell, VDOTMichael Garrett, VDOT
Abstract
The Office of the Virginia Secretary of Transportation identified twenty-one transportation policies and a set of forty-two policy performance evaluation criteria in Virginia’s long-range multimodal transportation plans, VTrans2025 and VTrans2035. The latest long-range planning effort VTrans2035, which is ongoing, has provided direction for the research described herein.
This effort was sponsored in part by the Office of Multimodal Transportation Planning and Investment and supports VTrans2035. While there has been considerable discussion of the potential impacts impacts of these the VTrans policies to the Commonwealth as a whole across the various criteria, there have been few attempts to assess and characterize the individual local and regional impacts impacts of the policies. Moreover the sensitivity of the policies to various scenario assumptions about the future has been in need of further exploration on the statewide, regional, and local levels. An upcoming summit of transportation thought leaders will convene in November 2008 will have use for knowledge of how VTrans policies have differential impacts to various regions and with various scenarios of the future.
This research effort develops and tests methodology for scenario-based assessments of the impacts impacts of the VTrans polices for multiple regions of the Commonwealth of Virginia. . The methodology is implemented in an MSExcel workbook available for download at www.virginia.edu/crmes/multimodal2. The This report details describes the application of the methodology in the form of an analytical workbook that enablesfor a locality or regional planning organization, e.g., a Metropolitan Planning Organization (MPO) or Planning District Commission (PDC), to assess the impact of statewide multimodal policies against across several of its long-range planning scenarios. . This report includes an application of the workbook methodology to the Roanoke, Virginia region and Hampton Roads regions of Virginia, a review of scenario-based planning, documentation of future scenarios, a survey of Metropolitan Planning Organizations in Virginia for their best practices in scenario-based transportation planning, and recommendations for long-range transportation planningnext steps.
ITC Labs and Classrooms, 08/05/08,
?
The effort alsoAn appendix describes several other implementations to Northern Virginia and Richmond regions in Appendix A. A survey and study of scenario-based planning best practices is featured in Appendix B. .
Another apAppendix C describes an Along with this, an input/output analysis of economic growth based on transportation investments was also researched that was requested by the Multimodal Office.
Another appendix provides the design of the survey questionnaire used with the MPOs.
INTRODUCTION
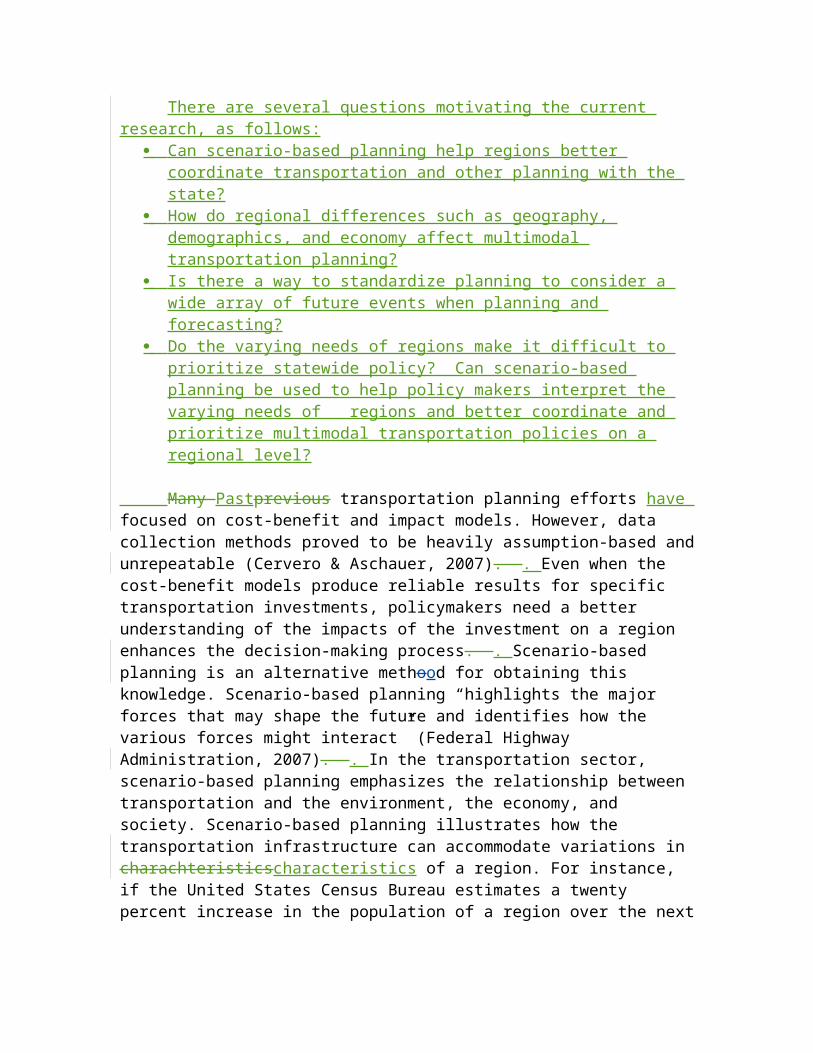
There are several questions motivating the current research, as follows: Can scenario-based planning help regions better coordinate transportation and
other planning with the state? How do regional differences such as geography, demographics, and economy
affect multimodal transportation planning? Is there a way to standardize planning to consider a wide array of future events
when planning and forecasting?
ITC Labs and Classrooms, 08/05/08,
Integrate into the abstract somehow?
Do the varying needs of regions make it difficult to prioritize statewide policy? Can scenario-based planning be used to help policy makers interpret the varying needs of regions and better coordinate and prioritize multimodal transportation policies on a regional level?
Many Pastprevious transportation planning efforts have focused on cost-benefit and impact models. However, data collection methods proved to be heavily assumption-based and unrepeatable (Cervero & Aschauer, 2007). . Even when the cost-benefit models produce reliable results for specific transportation investments, policymakers need a better understanding of the impacts of the investment on a region enhances the decision-making process. . Scenario-based planning is an alternative methood for obtaining this knowledge. Scenario-based planning “highlights the major forces that may shape the future and identifies how the various forces might interact” (Federal Highway Administration, 2007). . In the transportation sector, scenario-based planning emphasizes the relationship between transportation and the environment, the economy, and society. Scenario-based planning illustrates how the transportation infrastructure can accommodate variations in charachteristicscharacteristics of a region. For instance, if the United States Census Bureau estimates a twenty percent increase in the population of a region over the next five years, the transportation infrastructure will need to expand to grow to match the increased demand.
Scenario-based planning can be used as an alternative, or even complementary, tois an add-on or complementary to the following analysis methods:
Return on Investmentinvestment Cost-benefit analysis Risk Analysisanalysis Impact Analysisanalysis Sensitivity Analysisanalysis Systems Analysis analysis and Integrationintegration
The establishment of goals and performance measures for long-range transportation planning is useful on statewide and regional and local levels for understanding a variety of activities, including:
Funding and investments Land use Connectivity Priority setting
VTrans2035 and the Office of Multimodal Transportation Planning and Investment (Multimodal Office) are using twenty-one policies and forty-two performance criteria for evaluating statewide transportation policies. Example policies include investing in public transit, planning multimodally, and improving travel mode connections. The criteria encompass safety and security; preservation and management;
efficient movement of people and goods; economic vitality; quality of life; and program delivery.
The Multimodal Office has two challenges for applying scenario-based planning. The first challenge is that a set of high-level goals and associated criteria have been developed for prioritizing multimodal transportation policies, but they have not yet been integrated into existing prioritization methods. The second challenge is the existence of several obstacles to multimodal transportation prioritization that have occurred in Virginia in the past the few years. Three major obstacles are; the inability to achieve consistency in planning factors and assumptions across modes, different regulatory processes for modes of transportation, and a lack of methodology for computing a transportation project’s return on investment (ROI). Scenario-based planning addresses the first obstacle, inconsistent planning factors, and also provides a method that adapts to uncertainty in transportation-related futures.
We developed a methodology adapted from the Federal Highway Administration (2007) to analyze the impacts of statewide multimodal transportation policies on regions under various scenarios. The survey workbook is automated to process the inputs from various regions and give a local prioritization of transportation policies data entered by a regional transportation planner. The report details four demonstrations of the workbook applied across regions in Virginia. The four regions include Northern Virginia, Hampton Roads, Roanoke, and Richmond (reference appendices?). The report researches regional planning methodologies. For example, in Northern Virginia, TransAction2030 (cite report) provide multimodal analysis to create vision, goals, and strategies for future transportation. In the Hampton Roads region, the report analyzes the affects of future scenarios for a port-centered economy as well as the return on investment and economic impacts of the ports (reference Appendix C?)
We explored the scenarios used by different transportation departments and planning groups across the nation. Our methodology includes scenarios developed by the Metropolitan Washington Council of Governments (2004) , Delaware Valley Region Planning Committee (2007), Roanoke Valley Area Metropolitan Planning Organization (2005) and Thomas Jefferson Planning District Commission (n.d.). We sorted the selected scenarios into four main categories – spatial, demographical, economical, and other, which include environmental issues and natural disasters. The four categories encompass the major scenarios that transportation planners have to account for in the future.
There are several questions that this report examines. Some of these questions are as follows-
Can scenario-based planning help regions better coordinate transportation and other planning with the state?
How do regional differences such as geography, demographics, and economy affect multimodal transportation planning?
Is there a way to standardize planning to consider a wide array of future events when planning and forecasting?
Do the varying needs of regions make it difficult to prioritize statewide policy? Can scenario-based planning be used to help policy makers interpret the varying
needs of regions and better coordinate and prioritize multimodal transportation policies on a regional level?
PURPOSE AND SCOPE
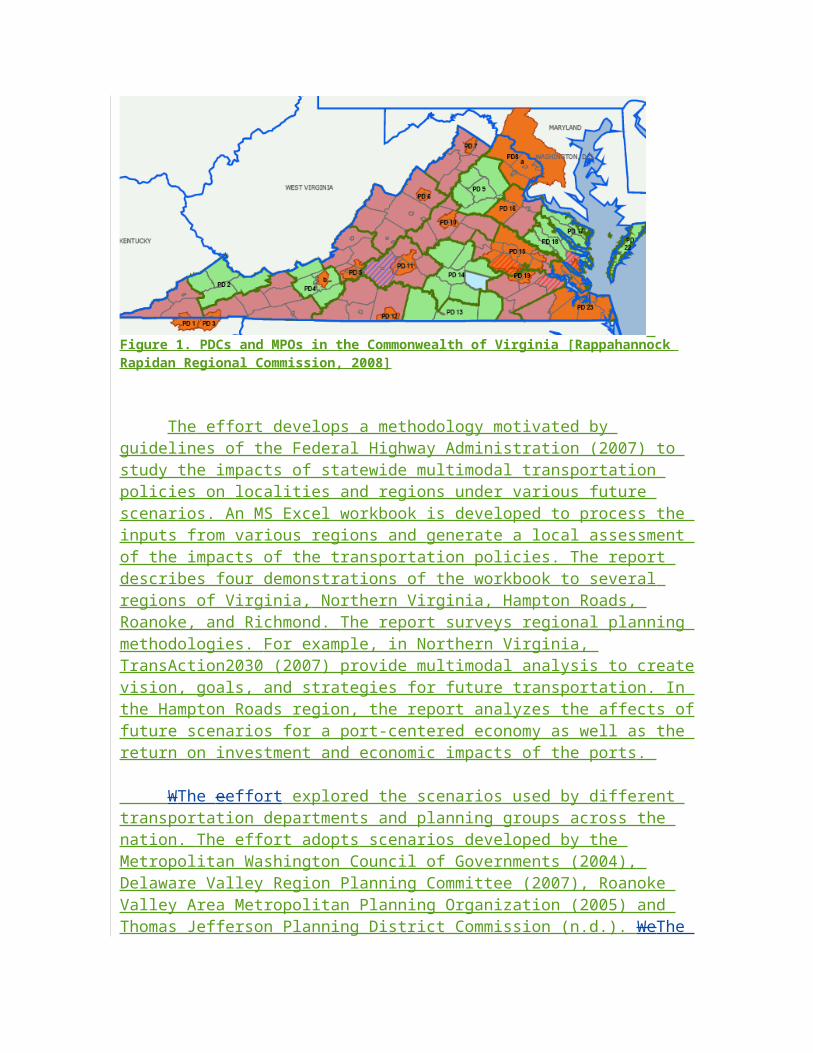
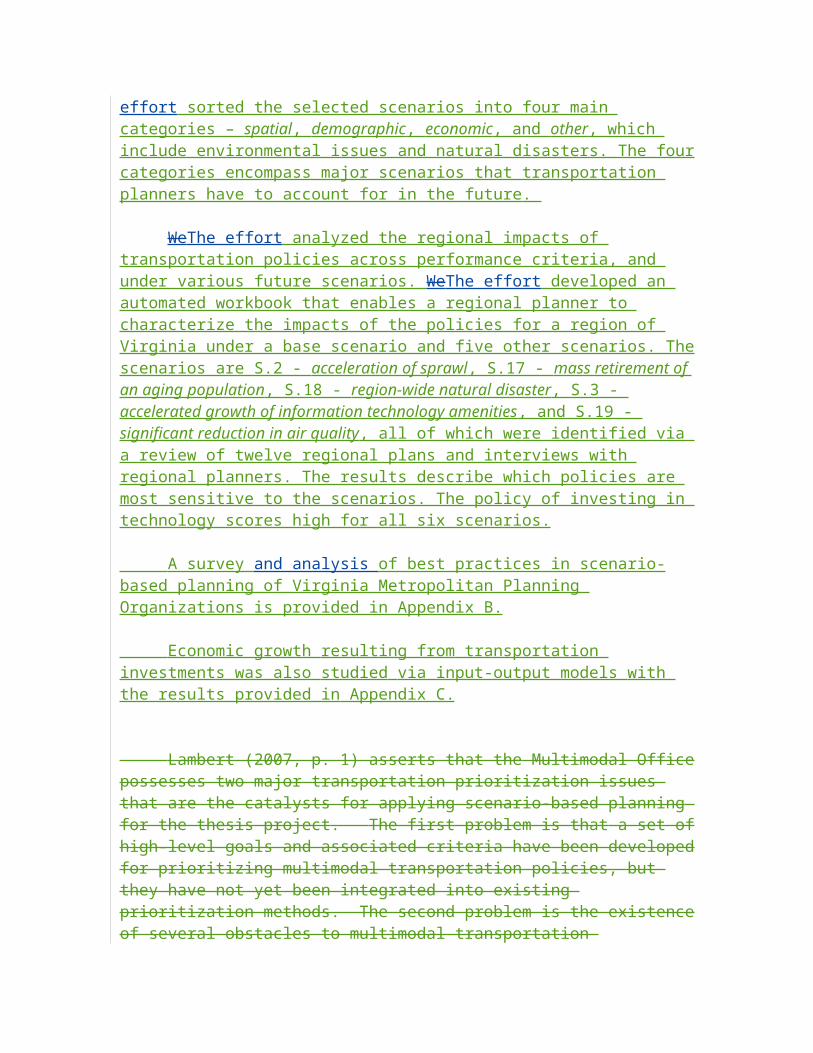
The intended customers of this effort are the Commonwealth of Virginia and the Metropolitan Planning Organizations (MPOs) and Planning District Commissions (PDCs) of the Commonwealth, as depicted in Figure 1.
Figure 1. PDCs and MPOs in the Commonwealth of Virginia [Rappahannock Rapidan Regional Commission, 2008]
The effort develops a methodology motivated by guidelines of the Federal Highway Administration (2007) to study the impacts of statewide multimodal transportation policies on localities and regions under various future scenarios. An MS Excel workbook is developed to process the inputs from various regions and generate a local assessment of the impacts of the transportation policies. The report describes four demonstrations of the workbook to several regions of Virginia, Northern Virginia, Hampton Roads, Roanoke, and Richmond. The report surveys regional planning methodologies. For example, in Northern Virginia, TransAction2030 (2007) provide multimodal analysis to create vision, goals, and strategies for future transportation. In the Hampton Roads region, the report analyzes the affects of future scenarios for a port-centered economy as well as the return on investment and economic impacts of the ports.
WThe eeffort explored the scenarios used by different transportation departments and planning groups across the nation. The effort adopts scenarios developed by the Metropolitan Washington Council of Governments (2004), Delaware Valley Region Planning Committee (2007), Roanoke Valley Area Metropolitan Planning Organization (2005) and Thomas Jefferson Planning District Commission (n.d.). WeThe effort sorted the selected scenarios into four main categories – spatial, demographic, economic, and other, which include environmental issues and natural disasters. The four categories encompass major scenarios that transportation planners have to account for in the future.
Matthew Schroeder, 08/05/08,
Ok format? Should these questions be revisited in the conclusion?
WeThe effort analyzed the regional impacts of transportation policies across performance criteria, and under various future scenarios. WeThe effort developed an automated workbook that enables a regional planner to characterize the impacts of the policies for a region of Virginia under a base scenario and five other scenarios. The scenarios are S.2 - acceleration of sprawl, S.17 - mass retirement of an aging population, S.18 - region-wide natural disaster, S.3 - accelerated growth of information technology amenities, and S.19 - significant reduction in air quality, all of which were identified via a review of twelve regional plans and interviews with regional planners. The results describe which policies are most sensitive to the scenarios. The policy of investing in technology scores high for all six scenarios.
A survey and analysis of best practices in scenario-based planning of Virginia Metropolitan Planning Organizations is provided in Appendix B.
Economic growth resulting from transportation investments was also studied via input-output models with the results provided in Appendix C.
Lambert (2007, p. 1) asserts that the Multimodal Office possesses two major transportation prioritization issues that are the catalysts for applying scenario-based planning for the thesis project. The first problem is that a set of high-level goals and associated criteria have been developed for prioritizing multimodal transportation policies, but they have not yet been integrated into existing prioritization methods. The second problem is the existence of several obstacles to multimodal transportation prioritization that have occurred in Virginia in the past the few years. According to Lambert (2007, p. 2), the obstacles that prevent multimodal transportation prioritization can be sorted into three major obstacles. These three major obstacles are; the inability to achieve consistency in planning factors and assumptions across modes, different regulatory processes for modes of transportation, and a lack of methodology for computing a transportation project’s return on investment (ROI) (Lambert, 2007, p. 3). Scenario-based planning addresses the first obstacle, inconsistent planning factors, and also provides a method that adapts to uncertainty in transportation-related futures. Economic growth based on transportation investments was also researched to investigate ROI. The results are detailed in Appendix C. . The establishment of goals and performance measures is useful on a statewide and regional level. These goals and subsequent scenarios include:
Funding & InvestmentsLand UseConnectivityPriority Setting
VTrans2035 and the Office of Multimodal Transportation Planning and Investment are using twenty-one policies and forty-two performance criteria for evaluating statewide transportation policies. Example policies include investing in public transit, planning
multimodally, and improving travel mode connections. The criteria encompass C.1 - safety and security, C.2 - preservation and management, C.3 - efficient movement of people and goods, C.4 - economic vitality, C.5 - quality of life, and C.6 - program delivery. We analyzed the regional impacts of transportation policies across performance criteria, and under various future scenarios. We developed an automated workbook that enables a regional planner to characterize the impacts of the policies for a region of Virginia under a base scenario and five other scenarios. The scenarios are S.2 - acceleration of sprawl, S.17 - mass retirement of an aging population, S.18 - region-wide natural disaster, S.3 - accelerated growth of information technology amenities, and S.19 - significant reduction in air quality, all of which were identified via a review of twelve regional plans and interviews with regional planners. The results describe which policies are most sensitive to the scenarios. The policy of investing in technology scores high for all six scenarios.The scope of this work focuses on the commonwealth Virginia and the Metropolitan Planning Organizations (MPOs) and Planning District Commissions (PDCs) within the commonwealth. Figure 1 displays the PDCs and MPOs in Virginia. The report details work done with the Roanoke Valley-Alleghany Regional Commission.
Figure 1. PDCs and MPOs in the Commonwealth of Virginia [Rappahannock Rapidan Regional Commission, 2008]
BACKGROUND/LITERATURE REVIEW
This e following section reviews the some fundamentals of scenario-based planning for transportation systems. . The section also examines the methodology recommended by the Federal Highway Administration and other regional planning organizations.
Scenario-Based Planning
Scenario-based planning lends itself to many misconceptions about its processes and aims. . Zergas , Sussman, and Conklin (2004) allay misconceptions by researching the origins and applications of scenario planning. . The terms scenario-based planning
Matthew Schroeder, 08/05/08,
rename
and scenario planning are often used interchangeably in literature. ‘Scenario planning’ means the focus on the scenario part of scenario-based planning.
Zergas et al. (2004) follows the evolution of scenario planning from corporate
strategies to transportation planning. . Royal Dutch Shell is generally first credited with using a scenario-based approach to aid strategic business planning. . Rapid changes in the business environment motivated Shell to search for a planning approach that could better deal with uncertainty. . Shell adopted scenario-based planning in order to address a wide range of situations and aid planners in preparing for a variety of business scenarios. . Zergas et al. (2004) emphasize the use of scenario planning for Shell by mentioning that the application of scenario planning contributed to Shell’s ability to anticipate and prepare for the oil crisis of 1973 and its economic aftermath. .
Scenario Planning as a Supplemental Technique
Currently, there appears to be no major statewide transportation departments that significantly incorporate scenario-based planning to multimodal transportation planning. . A possible reason for slow adaptation of scenario-based planning by transportation planners is that scenario-based planning involves long term planning and future scenarios, and as results, years may elapse until the efficacy of scenario-based planning can be properly evaluated. . Criticisms by transportation planners may be another reason for the slow adaptation of scenario based planning. . Cole (2001, p. 373) states another reason for the lack of popularity for scenario-based transportation planning approaches, many policy makers prefer specific answers, as opposed to several different possibilities. . Zergas et al. addresses criticisms of scenario planning and clears up misconceptions of its use and results. . Critics attempt to discredit scenario planning by claiming that it is ineffective in predicting the future. . Zergas et al. states that, “Scenario planning is not a replacement for traditional planning techniques such as forecasting; instead it aims to help organizations better prepare for the unexpected. In short, scenario planning helps to make robust strategic choices” (2004, p. 8).
In their own use of scenario planning, Zergas et al. (2004) applies systematic scenario planning to transportation planning in the Houston metro area. . The study used scenario planning methodology to examine key issues for the area, the scope of the problem, and finally generating relevant scenarios. . The scenarios generated are subsequently used to evaluate transportation policies in the area. . The results from the study showed that although the scenario planning could not be directly evaluated, the concept provided insight into transportation futures for transportation planners.
Bartholomew (2005) describes the usage of using scenarios in planning for land use issues in transportation. . The FHWA (2007) also is using scenario-based planning in transportation land use issues. . Bartholomew (2005) conducted a survey in 2003-2004 of MPOs and found that out of one-hundred fifty-two recipeients of the survey, 45% indicated that they had at least one scenario planning project. . Scenario-based planning allows for increased community involvement in planning and is recommended in scenario-based planning literature (FHWA 2007; Bartholomew, 2005; Zergas, 2004). .
An Existing Methodology with Scenario Planning
The Federal Highway Administration (FHWA) also recommends using scenario planning (About Scenario Planning, 2007) as part of transportation planning. The FHWA developed a recommended scenario-based planning methodology in an attempt to familiarize other transportation groups with scenario-based planning. . The FHWA scenario-based planning approach echoes the methodology presented above by Zergas et al. (2004) through its emphasis on “scenario planning as an enhancement of, not a replacement for, the traditional transportation planning process” (Zergas et al., 2004, p. 8). . In its approach, the FHWA regards the main purpose of scenario planning as aiding in preparation of potential transportation issues instead of predicting futures.
The FHWA scenario planning methodology involves six steps. . The first three steps of the FHWA methodology involve creating and planning scenarios. . The first step recommended by the FHWA is to research ‘driving forces’. . Driving forces are, “the major sources of change that impacts the future” (About Scenario Planning, ¶12). . Trends in local land use, levels of congestion, and local demographics are commonly used driving forces. . The second step is to determine patterns of interactions. . Determining patterns of interactions between driving sources can be done in a variety of ways. . The FHWA recommends that transportation planners use a matrix and develop a metric related to positive or negative outcome. . The third step involves creating scenarios from planners by fitting realistic situations to patterns between the driving forces. . An example of a scenario is an event where jobs and city population increase. The FHWA describes the goal of creating scenarios is to “bring life to the scenarios in a way that community stakeholders can easily recognize and connect the various components” (About Scenario Planning, ¶16). . The fourth through sixth step of the FHWA methodology involve stakeholders analyzing and evaluating the scenarios. . The fourth step is to analyze the implications of the scenario. . Transportation planners can use scenario-planning software tools to present scenarios visually. . Scenario-planning software also gives stakeholders and planners a better view of the consequences of a scenario. . During this step, transportation planners and stakeholders can develop potential transportation policies that mesh with the scenarios. . Evaluating scenarios is the fifth step in the FHWA’s methodology. . FHWA details a variety of methods to accomplish scenario evaluation, such as using various criteria and presenting the scenarios to the community stakeholders. . The sixth and last step is monitoring relevant indicators to the scenario. . Scenario planning is a dynamic methodology, and transportation planners can generate new scenarios as events occur (About Scenario Planning). .
Virginia Applications of Scenario-Based Planning
Several applications of scenario-based planning in Virginia are described below.
Thomas Jefferson Planning District
Thomas Jefferson Planning District (TJPD) and the Roanoke Valley Area Planning Commission (RVARC) both apply scenario-based transportation planning, but take different approaches in application. . The RVARC generally uses the approach of developing detailed objective scenarios that guide planners to relevant policies. . These detailed scenarios are then converted into numbers that apply to transportation area zones. . The numbers are then put into models that such as IMPLAN, an economic impact modeling system. . After planners use forecasting tools, other analysis and decision making is done by transportation planners and relevant policies are generated. . In some cases, the models are not used and scenarios more used as a post-process tool for relevant policies (M. McCaskill, personal communication, February 25, 2008). .
The Thomas Jefferson Planning District (TJPD) uses scenario-based planning in the Eastern Planning Initiative project. . The Eastern Planning Initiative focuses on the future of regional growth. . Thus, TJPD uses scenarios that focus on growth possibilities specifically (Jefferson Area EPI, n.d.). . TJPD uses the growth scenarios to gauge stakeholder’s opinions on the possible futures. . Planners develop potential policies based on the evaluation of scenarios and other constraints. .
Though the use of scenario-based planning for TJPD and RVARC are different, the use and scope of scenarios both are constrained by deadlines and set budgets. . Also, for major transportation forecasting, both organizations rely on the Virginia Department of Transportation. . The project’s work with Roanoke will also consider the approach of TJPD as well as other approaches transportation planners use outside of Virginia. .
Metro Washington Council of Governments
An application of scenario planning was recently used to predict relevant transportation futures in Northern Virginia. . “What if…The Washington Region Grew Differently?” (2006) is a regional mobility and accessibility scenario study by the Metro Washington Council of Governments (MWCOG). . The study identifies four key issues facing the Washington D.C. area, and matches scenarios to each issue. . The issues come from the topics of population growth, economics, and demographics. . MWCOG chooses job growth outpacing household growth as the first key. . The second issue is workers living farther away from their jobs. . The third issue is the divide between the eastern and western part of the region in terms of demographics and economics. . The fourth issue is that most growth areas are located outside transit station areas. .
MWCOG’s approach (2006) of matching a scenario to a key issue uses a combination of the methods similar to that recommended by the Federal Highway Administration (FHWA) (2007) and Zergas et al (2004). . However, instead of using objectives and policies, MWCOG treats scenarios as potential policies that transportation planners can evaluate. . MWCOG also develops each key issue is on a large enough scale to match a scenario whereas FHWA and Zergas et al. both consider key issue interactions to generate scenarios. . The MWCOG approach yields more direct scenario addressing the key issues, however, the approach may miss important scenarios that planners can discover by looking at the interaction between key issues. . The proposed
thesis project generates scenarios by using a combination of the Zergas et al. (2004), the FHWA (2007), and the Metro Washington Council of Government (2006) approach in consultation with transportation planners.
Scenario-Based Planning in Other State Multimodal Planning of Other States
Transportation Planning groups outside of Virginia have also integrated scenario-based approaches into planning. . Envision Utah and the Sacramento Region Blueprint are two out of seven noteworthy scenario-based planning application the Federal Highway Commission (FHWA) features on its website. . Most of the noteworthy scenario-based planning applications focus on growth-based or environmental approaches to scenario-based planning. . Both Envision Utah and the Sacramento Region Blueprint are examples of focuses on growth and land-use in scenario-based planning. .
Envision Utah (http://www.envisionutah.org/process-scenario.phtml) guides the development of Utah growth patterns similar to the Thomas Jefferson Planning District approach. . The scenario focus of Envision Utah includes the environment, economic strength, and quality of life. . Thus, part of the process of Envision Utah is to develop scenarios that consider multiple modes of transportation in order to accomplish objective relating to environment, housing, and mobility. .
The Sacramento Region Blueprint is a transportation land-use study developed to
(http://www.sacregionblueprint.org/sacregionblueprint) aid growth in Sacramento, California. . The project uses scenarios to evaluate transportation projects and land-use strategies. . Although the Sacramento Region Blueprint uses scenarios as forecasting tools, which is contrary to scenario-planning expert advice, the project has received planning awards for its progress from the Environmental Protection Agency and the Federal Highway Commission. .
METHODOLOGY
We developedThis effort develops a methodology to analyze the impacts of statewide multimodal transportation policies on regions under various scenarios, as shown described in Figure 2. A Microsoft Excel survey workbook is automated to process the inputs from various regions and give a local prioritization of transportation policies as data is are entered by a regional transportation planner. .
Figure 2. Scenario-based planning methodology for evaluating regional impacts of statewide multimodal transportation policies.
The first step in the methodology is to Select Regions to use scenario-based planning in assessing the impacts of statewide multimodal transportation policies.
The second step is to Select Scenarios that are relevant to the regions selected. The process of selecting scenarios is done through a three step process that involves Identification of Key Issues that effect the region, Identification of Key Factors, and the D iscussion and C ombination of I ssues and K ey F actors . For example, two key issues for many regions in Virginia are retirement and gas prices. Two key factors that respectively drive these issues are the baby-boomer population reaching retirement age and the economy. Thus, transportation planners and policy makers may choose to create two future scenarios based on the combination of the issues and factors: increased retirement and transit-oriented development. The third step involves Scoring Transportation Policies Based On Evaluation Criteria. In the methodology, the scoring is based on if the policy has a significant, moderate, or minimal/no impact on the evaluation criteria. The fourth step is to Weigh Evaluation Criteria with Scenarios. This step uses the scenarios developed in the second step and the evaluation criteria in the third step. Transportation planners and policy makers decide whether given the future scenarios if the evaluation criteria will have anywhere from a major increase in importance to a major decrease in importance. The importance of the evaluation criteria affects the policy scoring in step three.
The fifth step is to Assess Policy Performance Sensitivity to the Region. Each future scenario generates a score for a transportation policy that was evaluated in the third step. The scenario generates the policy score by modifying the policy score for each evaluation criterion based on the importance of the criterion in the scenario as determined in step four. For example, a policy scores a ‘10’ for evaluation criterion one.
Transportation planners determine that for Scenario A the evaluation criterion one will have a ‘major increase of importance’. Since the criterion is more important, it receives a weight that increases the policy score under the criterion to ‘15’. If Scenario A had evaluated the criterion as having a ‘major decrease of importance’ then the policy score under the criterion could be decreased to ‘5’.
The methodology produces a set of scores for a statewide multimodal transportation policy over relevant regional future scenarios.
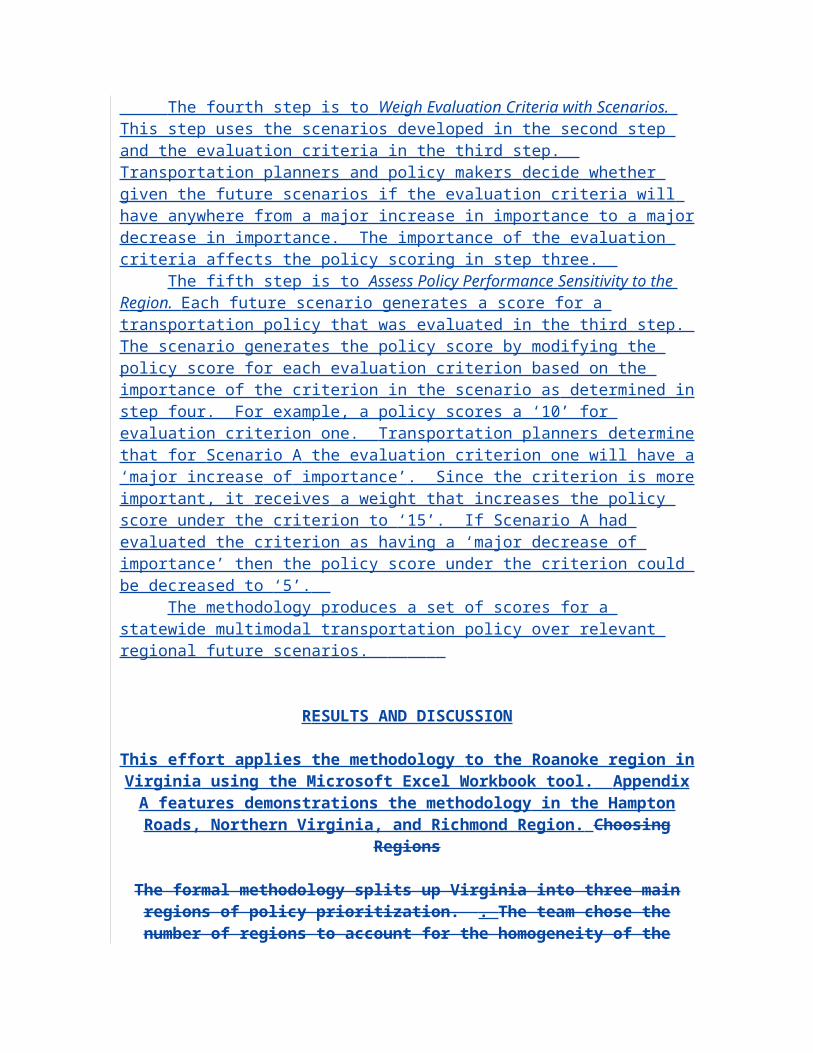
RESULTS AND DISCUSSION
This effort applies the methodology to the Roanoke region in Virginia using the Microsoft Excel Workbook tool. Appendix A features demonstrations the
methodology in the Hampton Roads, Northern Virginia, and Richmond Region. Choosing Regions
The formal methodology splits up Virginia into three main regions of policy prioritization. . The team chose the number of regions to account for the
homogeneity of the regions and mitigate the complexity of evaluating several regions. . The survey tool also has the ability to focus into smaller areas. . The team
customized the survey tool for the Metropolitan Planning Organization (MPO) in Roanoke in order to compete in the student paper contest. . Transportation
planners in Virginia’s thirteen other MPO’s (M. McCaskill, personal communication, February 25, 2008) can also use the survey tool. . The team
perceived the paper contest as an opportunity to test the survey tool. . The smaller scope of the area included in the contest challenged the flexibility of the survey tool
and forced the team to adjust the scope of the tool to have it properly apply to Roanoke transportation policies and scenarios. . In future work, the team will
further determine the optimal scope of the survey tool in Virginia.
Finding Relevant Scenarios
The second step to apply the methodology to Roanoke is to Select Scenarios. For Roanoke, the effort involves research that includes talking to transportation planners in the Metro Planning Organization and researching the relevant topics that affect transportation in the region. For the statewide scope of the tool, the research is based on the work of other states and localities such as the Sacramento Region Blueprint (http://www.sacregionblueprint.org/sacregionblueprint) and Envision Utah (http://www.envisionutah.org/process-scenario.phtml). The methodology for scenario-planning adapts techniques and recommendations from methodologies used by Zergas et al. (2004), Pearman (1986), the Metro Washington Council of Governments, and the Federal Highway Administration.
The scenario-based planning methodology first identifies key issues in the area that may affect the future. Several broad categories exist for these factors that include demographics, land usage, and population shifts. This suggests individual categories for each factor. Second, the design identifies factors that create the issues. Third,
Matthew Schroeder, 08/07/08,
ADJUST
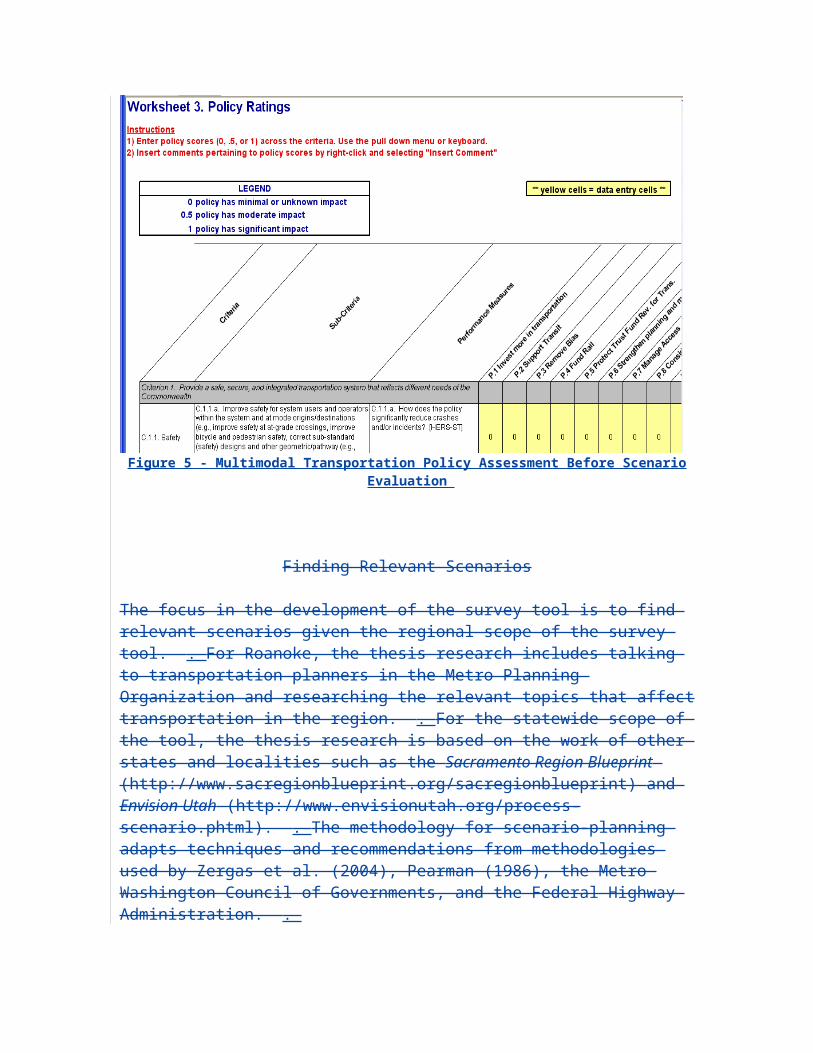
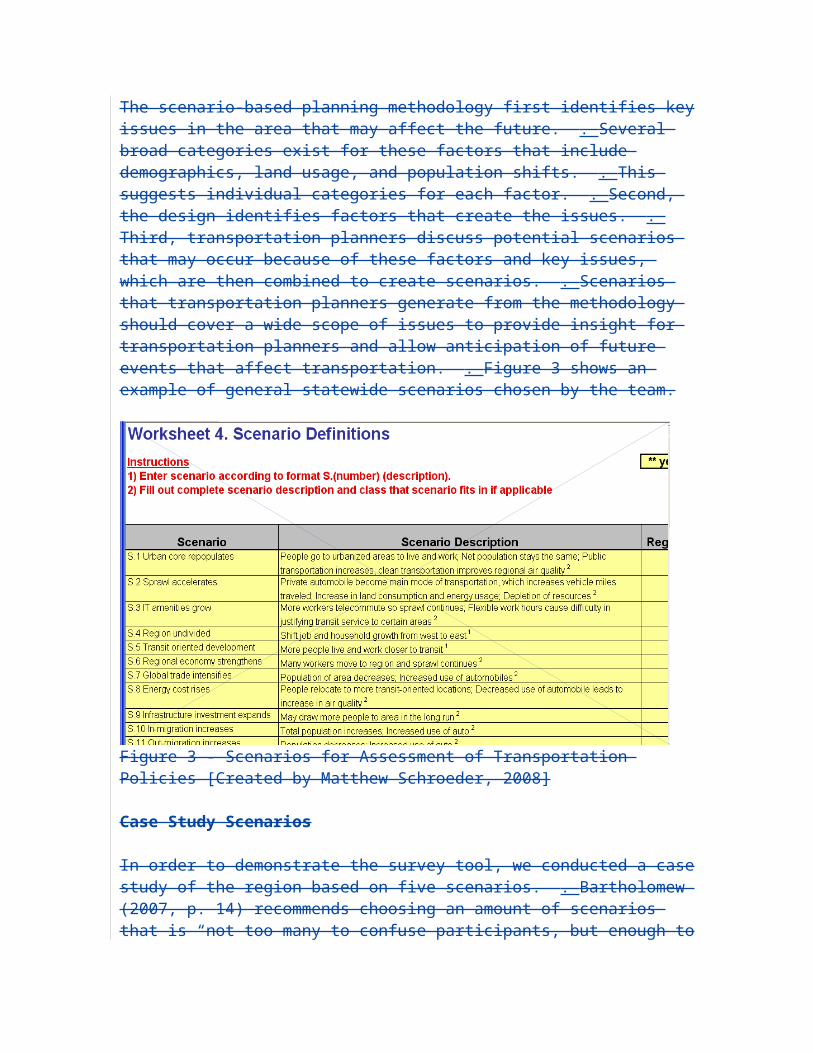
transportation planners discuss potential scenarios that may occur because of these factors and key issues, which are then combined to create scenarios. Scenarios that transportation planners generate from the methodology should cover a wide scope of issues to provide insight for transportation planners and allow anticipation of future events that affect transportation. Figure 3 shows an example of general statewide scenarios chosen for the effort.
Figure 3 - Scenarios for Assessment of Transportation Policies
Case Study Scenarios
In order to demonstrate the methdology, the effort conducted a case study of the region based on five scenarios. Bartholomew (2007, p. 14) recommends choosing an amount of scenarios that is “not too many to confuse participants, but enough to allow for divergent thinking and coherent story telling (Godet, 2001; Ringland, 1998, 2002).” First, the effort interpreted the scenario, S.2 - Urban sprawl. Urban sprawl is an issue that affects many places of growth in the region and the nation. As developers continue to plan future residential and commercial buildings around the region and as the number of sites to build in the city decreases, urban sprawl will increase. If the current growth rates continue in the region, urban sprawl is inevitable despite public opposition. Thus, regional transportation planners will need to consider the impacts of urban sprawl when prioritizing multimodal transportation policies.
Second, the effort analyzed the impacts of scenario, S.17 - Retirement. As the demographics of an area changes, the transportation system must adapt to meet new demands. This is an important issue as the baby-boomer generation, a major cross-section of the population in the United States, is reaching the retirement age. An aging population “implies additional transit needs, changing housing needs, the need for heightened safety standards, and residents with inflexible financial situations” (Federal Highway Administration [FHWA], 2007). Businesses must even change how they operate, by
developing new products to target the current demographics and compensating for the expected labor shortages (MIT Center for Transportation & Logistics, 2007). The retirement scenario is particularly important for the region in the case study, since the area is considered one of top places in the country to retire, as 40% of the population of the region is 45 or older (The Roanoker Magazine, 2007). This age demographic is concerned with maintaining their mobility, within the limits of their physical and financial capabilities. The older population requires different forms of public transit, especially ones that link them with residential, retail, and health centers (The Roanoke Valley Area Metropolitan Planning Organization [RVAMPO], 2005).
Third, the effort studied scenario S.18 - Natural disasters relevant to the region. Areas across the country are subject to natural disasters that cost millions of dollars in damages.Through the study of past disasters and local environmental factors, the hazard analysis workgroup of the region identified flooding and wildfires as the two most likely naturaldisasters for the area. The streams running through the steep terrain of the region subject the area to periodic flash flooding. To highlight the importance of this scenario, flood related research and documentation from the past shows that there are an estimated 5,400 structures that could possibly be impacted by flooding in the region (RVAMPO, 2000).
Fourth, the effort consider the potential of scenario S.3 - IT amenities growing in the region. This high priority scenario is due to the large information technology and engineering base that has developed in several surrounding areas. Many companies have chosen to locate their work facilities and headquarters throughout the surrounding areas due to its highly skilled technology workforce, policies that encourage business growth, and advanced IT infrastructure (Commonwealth of Virginia, Office of the Governor, 2007).
Fifth, scenario S.19 - Decrease in air quality, is more specific to the region. Intermodal and multimodal sources of transit stations are needed throughout the country to support a wider range of transportation solutions for public, commercial, and several other uses. Recently, ten areas that are in close proximity to the region were selected as possible locations for a new rail and truck intermodal transit station. However, there has been opposition to building transit stations in the region from environmental groups (Christopolus, 2007). Health hazards from higher levels of soot include a 30% increased risk of death for individuals with heart disease, lung disease, and diabetes. The current soot level of the region already approaches the EPA soot limit of PM 2.5. Thus, a new transit station could cause dangerous levels of soot for the local communities.
Identification of Policies
In preparation for the next step of the methodology, Score Policies Based on Evaluation Criteria, we the effort identifiesy multimodal transportation policies. WeThe effort used the 21 policies established in the statewide long-range transportationplan, VTRANS 2025 (Virginia Department of Transportation [VDOT], 2004). The policies fall into four main categories: funding/investment, land use, connectivity, and priority setting. Examples of the policies include improving connections between modes, considering state versus local rules, increasing rail funding, and starting a trust fund for transportation.
WeThe effort identified policies that are special to the region to allow for more direct options for the regional transportation planners. The policies are meant to correlate with the regional- specific scenarios that wethe effort developed. The additional policies relevant to the region include P.22 - Smart growth, P.23 - Bicycle and pedestrian facilities feeder system, P. 24 - Environmental focus, and P. 25 - Diesel and filter regulation.
Policy P.22 - Smart growth is a growth strategy that impacts multimodal transportation use. Smart growth focuses on building desirable communities for residents. In a public workshop, it was shown that the public rejected urban sprawl scenarios in favor of more “Smart-growth” patterns. Smart growth patterns mainly refer to having denser town and urban centers. Proponents of Smart growth claim that increasingdensity of population centers will decrease driving time, traffic congestion, and preserve farmland (Thomas Jefferson Planning District Commission, 2007). Implementation of Smart Growth would place more influence on multimodal transportation because with more dense population centers, there is potential to use different modes of transportation. Therefore, policy P.22 - Smart growth, will be added to the list of policies considered for the region.
Next, wethe effort consider Policy P.23 - Bicycle and pedestrian facilities feeder system (RVAMPO, 2007). Effective mobility of the baby boomers can be maintained by providing better walking and biking facilities, as many areas lack safe or formal paths (RVAMPO, 2006). The implementation of 12 ft. lanes to the current infrastructure provides room for bicyclists, walkers, and users of any other personal ride-along type devices to travel. The lanes could connect shopping and residential districts, bus stops, and park and ride lots. Many bikes are publicly available and buses have been equipped with bike racks. Policy P.23 - Bicycle and pedestrian facilities feeder system, will give the aging population more transportation options, while allowing them to maintain a healthy lifestyle and help the environment.
Policy P.24 - Environmental focus, is another potential policy for the region. Some of the more recent natural disasters have been linked to global warming (Environmental Protection Agency, 2007). Scientists have suggested that the recent drought is linked to climate changes associated with global warming. The land being extremely dry increases the likelihood of wildfires. If the region and the nation set forth efforts to reduce carbon emissions, the more recent climate extremes and possibility of natural disasters would be reduced (RVAMPO, 2007). .
Last, wethe effort study Policy P.25 - Mandate of ultra low sulfur diesel and filters for all new trucks (Christopulos, 2007). To allow the intermodal truck and train transit station to be built in the region, all new trucks must use ultra low sulfur diesel with air filters. The filter rule would only apply to trucks of model year 2007 and beyond, and eventually to all trucks by the year 2030. The policy would reduce the sulfur emissions by 90% or more, particulate emissions up to 80%, and nitrogen oxide up to 20% . The reduction of emissions would help to maintain levels of soot under the EPA monitored levels of PM 2.5. Ultra low sulfur diesel mandates would also apply to all other diesel vehicles using the facility, such as off-road vehicles.
Selection of Performance Criteria
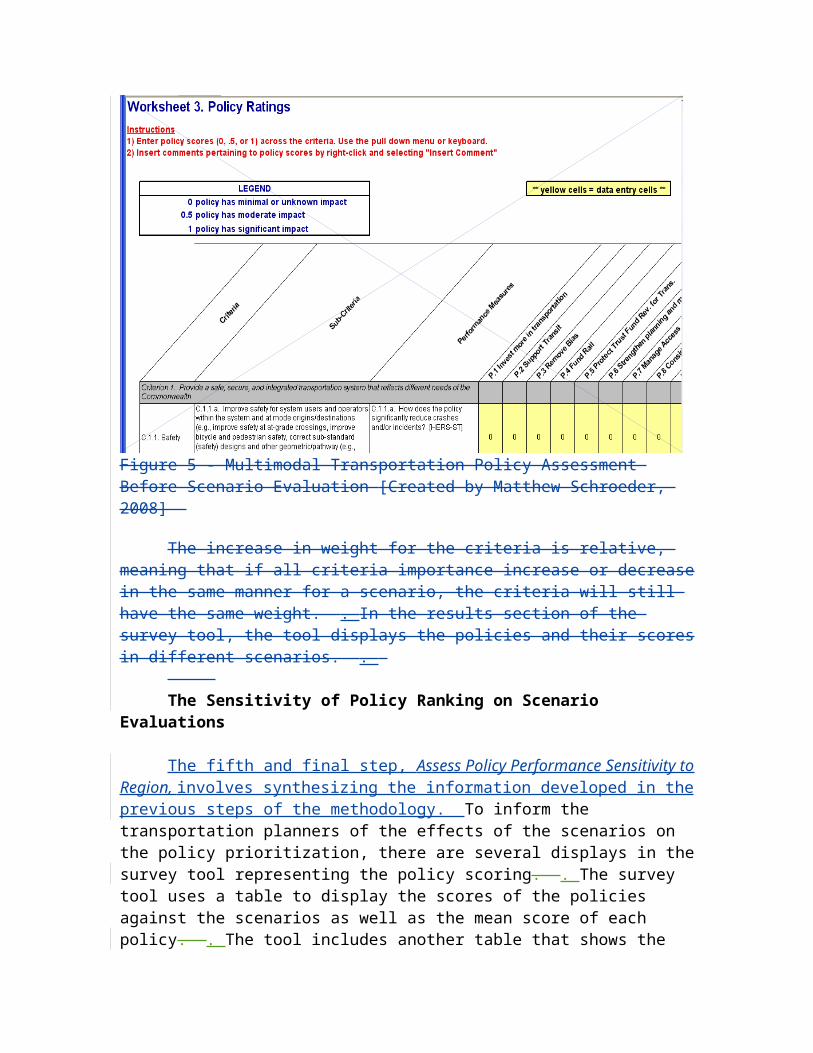
Next, wethe effort identified performance criteria from the statewide long-range transportation plan to measure the impact of a policy and to weight different scenarios. The performance criteria consist of safety, efficiency, economic vitality, quality of life, and feasibility. Sub-criteria are used to more specifically define the different aspects of the performance criteria. For example, sub-criteria, C.1.1.a under safety asks if the policy will, "Improve safety for system users and operators within the system and at mode origins/destinations (e.g., improve safety at at-grade crossings, improve bicycle andpedestrian safety, correct sub-standard (safety) designs and other geometric/pathway (e.g., runway obstructions, channel depth, bridge clearance, etc) deficiencies)."
Within the subcriteria are the performance measures, which directly evaluate the policies. The performance measure under sub-criteria C.1.1.a is, "Does the policy significantly reduce crashes and/or incidents?" There are 13 criteria and 34 sub-criteria and performance measures currently included in the tool. To determine the overall scores for policies, wethe effort evaluated the impact of each policy across each of the performance measures. We The methodology uses a rating of 0 for a minimal or an unknown impact, 0.5 for a moderate impact, and 1 for a significant impact.
Scoring Policies Based on Evaluation Criteria
Figure 5 shows how in step three of the methodology transportation planners score policies using a high, medium and low/not sure scale. In the application the methodology, the effort uses a 0, 0.5, 1, scale for scoring the impacts.

Figure 5 - Multimodal Transportation Policy Assessment Before Scenario Evaluation
Finding Relevant Scenarios
The focus in the development of the survey tool is to find relevant scenarios given the regional scope of the survey tool. . For Roanoke, the thesis research includes talking to transportation planners in the Metro Planning Organization and researching the relevant topics that affect transportation in the region. . For the statewide scope of the tool, the thesis research is based on the work of other states and localities such as the Sacramento Region Blueprint (http://www.sacregionblueprint.org/sacregionblueprint) and Envision Utah (http://www.envisionutah.org/process-scenario.phtml). . The methodology for scenario-planning adapts techniques and recommendations from methodologies used by Zergas et al. (2004), Pearman (1986), the Metro Washington Council of Governments, and the Federal Highway Administration. . The scenario-based planning methodology first identifies key issues in the area that may affect the future. . Several broad categories exist for these factors that include demographics, land usage, and population shifts. . This suggests individual categories for each factor. . Second, the design identifies factors that create the issues. . Third, transportation planners discuss potential scenarios that may occur because of these factors and key issues, which are then combined to create scenarios. . Scenarios that transportation planners generate from the methodology should cover a wide scope of issues to provide insight for transportation planners and allow anticipation of future events that affect transportation. . Figure 3 shows an example of general statewide scenarios chosen by the team.
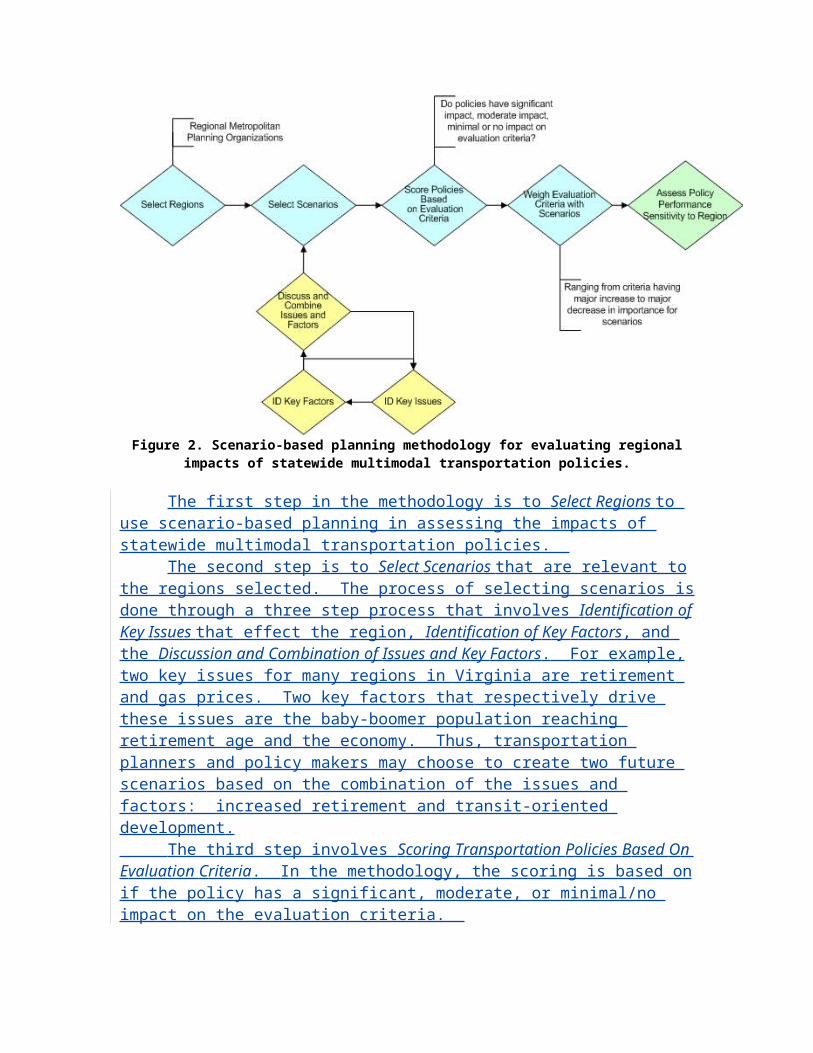
Figure 3 - Scenarios for Assessment of Transportation Policies [Created by Matthew Schroeder, 2008]
Case Study Scenarios
In order to demonstrate the survey tool, we conducted a case study of the region based on five scenarios. . Bartholomew (2007, p. 14) recommends choosing an amount of scenarios that is “not too many to confuse participants, but enough to allow for divergent thinking and coherent story telling (Godet, 2001; Ringland, 1998, 2002).” First, we interpreted the scenario, S.2 - Urban sprawl. Urban sprawl is an issue that affects many places of growth in the region and the nation. As developers continue to plan future residential and commercial buildings around the region and as the number of sites to build in the city decreases, urban sprawl will increase. If the current growth rates continue in the region, urban sprawl is inevitable despite public opposition. Thus, regional transportation planners will need to consider the impacts of urban sprawl when prioritizing multimodal transportation policies.Second, we analyzed the impacts of scenario, S.17 - Retirement. . As the demographics of an area changes, the transportation system must adapt to meet new demands. This is an important issue as the baby-boomer generation, a major cross-section of the population in the United States, is reaching the retirement age. An aging population “implies additional transit needs, changing housing needs, the need for heightened safety standards, and residents with inflexible financial situations” (Federal Highway Administration [FHWA], 2007). Businesses must even change how they operate, by developing new products to target the current demographics and compensating for the expected labor shortages (MIT Center for Transportation & Logistics, 2007). The retirement scenario is particularly important for the region in the case study, since the area is considered one of top places in the country to retire, as 40% of the population of the region is 45 or older (The Roanoker Magazine, 2007). This age demographic is concerned with maintaining their mobility, within the limits of their physical and financial capabilities. The older population requires
different forms of public transit, especially ones that link them with residential, retail, and health centers (The Roanoke Valley Area Metropolitan Planning Organization [RVAMPO], 2005).Third, we studied scenario S.18 - Natural disasters relevant to the region. Areas across the country are subject to natural disasters that cost millions of dollars in damages.Through the study of past disasters and local environmental factors, the hazard analysis workgroup of the region identified flooding and wildfires as the two most likely naturaldisasters for the area. The streams running through the steep terrain of the region subject the area to periodic flash flooding. To highlight the importance of this scenario, flood related research and documentation from the past shows that there are an estimated 5,400 structures that could possibly be impacted by flooding in the region (RVAMPO, 2000).Fourth, we consider the potential of scenario S.3 - IT amenities growing in the region. This high priority scenario is due to the large information technology and engineering base that has developed in several surrounding areas. Many companies have chosen to locate their work facilities and headquarters throughout the surrounding areas due to its highly skilled technology workforce, policies that encourage business growth, and advanced IT infrastructure (Commonwealth of Virginia, Office of the Governor, 2007). Fifth, scenario S.19 - Decrease in air quality, is more specific to the region. Intermodal and multimodal sources of transit stations are needed throughout the country to support a wider range of transportation solutions for public, commercial, and several other uses. Recently, ten areas that are in close proximity to the region were selected as possible locations for a new rail and truck intermodal transit station. However, there has been opposition to building transit stations in the region from environmental groups (Christopolus, 2007). Health hazards from higher levels of soot include a 30% increased risk of death for individuals with heart disease, lung disease, and diabetes. The current soot level of the region already approaches the EPA soot limit of PM 2.5. Thus, a new transit station could cause dangerous levels of soot for the local communities.
Using Scenarios for Scoring Policies
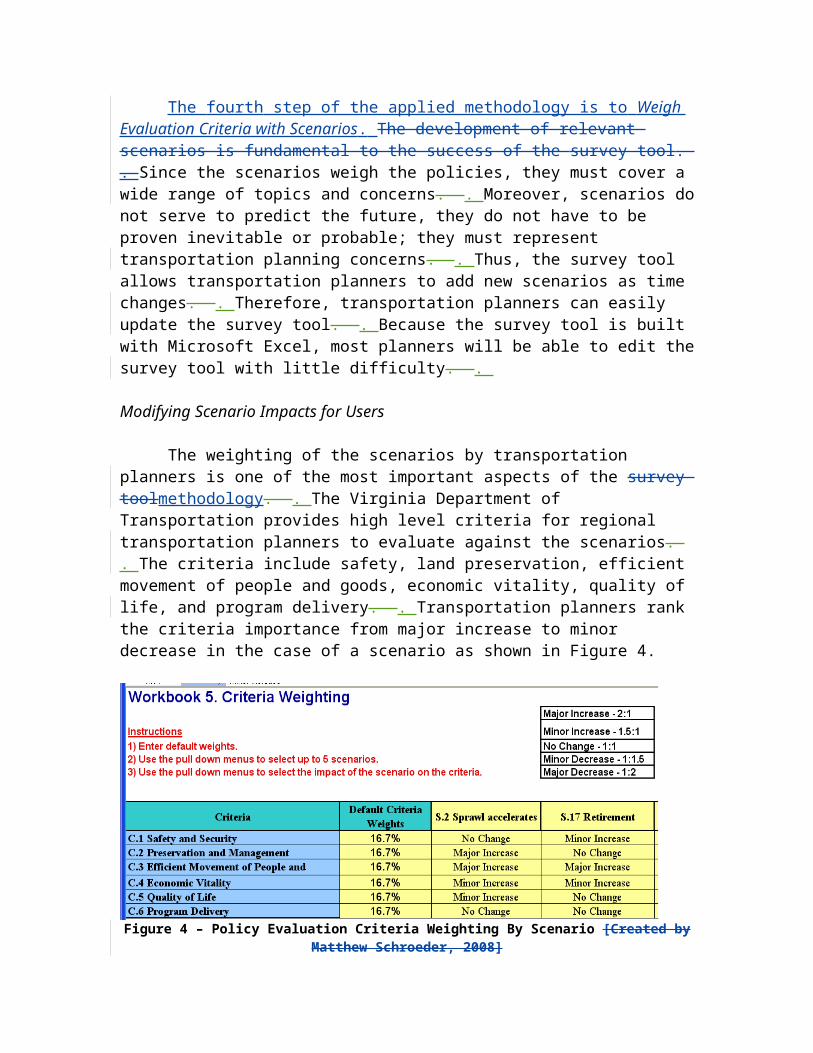
The fourth step of the applied methodology is to Weigh Evaluation Criteria with Scenarios. The development of relevant scenarios is fundamental to the success of the survey tool. . Since the scenarios weigh the policies, they must cover a wide range of topics and concerns. . Moreover, scenarios do not serve to predict the future, they do not have to be proven inevitable or probable; they must represent transportation planning concerns. . Thus, the survey tool allows transportation planners to add new scenarios as time changes. . Therefore, transportation planners can easily update the survey tool. . Because the survey tool is built with Microsoft Excel, most planners will be able to edit the survey tool with little difficulty. .
Modifying Scenario Impacts for Users
The weighting of the scenarios by transportation planners is one of the most important aspects of the survey toolmethodology. . The Virginia Department of Transportation provides high level criteria for regional transportation planners to evaluate against the scenarios. . The criteria include safety, land preservation, efficient movement

of people and goods, economic vitality, quality of life, and program delivery. . Transportation planners rank the criteria importance from major increase to minor decrease in the case of a scenario as shown in Figure 4.
Figure 4 – Policy Evaluation Criteria Weighting By Scenario [Created by Matthew Schroeder, 2008]
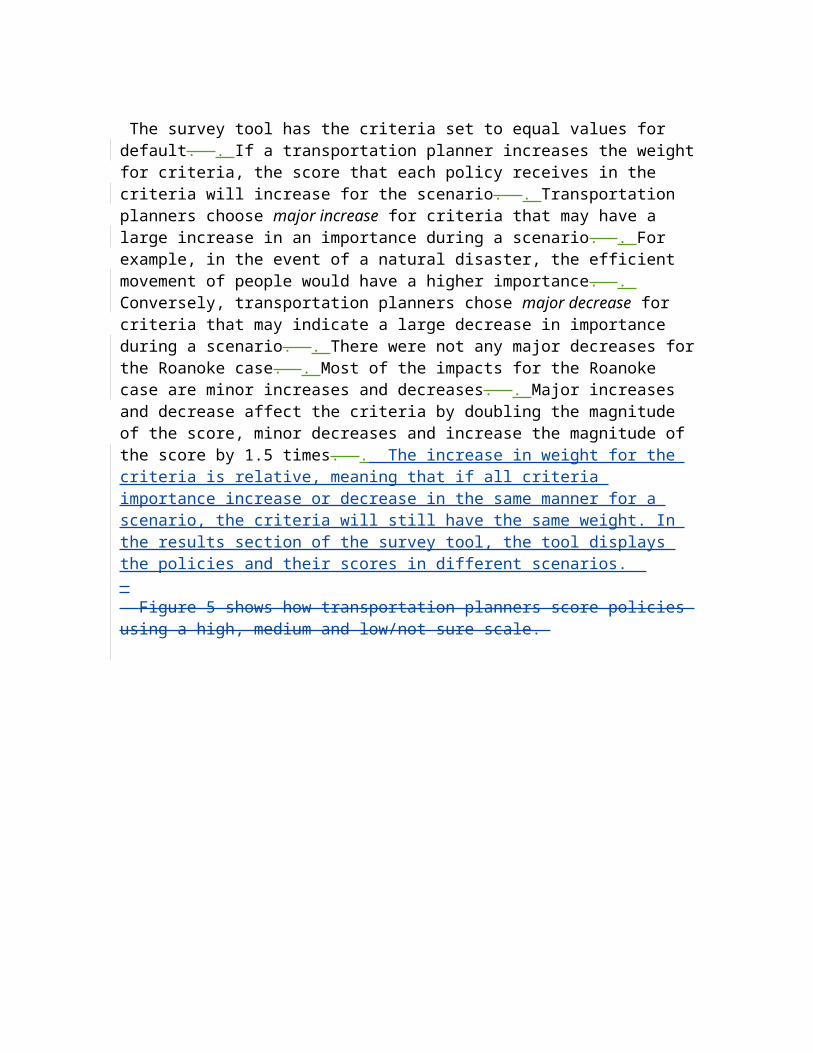
The survey tool has the criteria set to equal values for default. . If a transportation planner increases the weight for criteria, the score that each policy receives in the criteria will increase for the scenario. . Transportation planners choose major increase for criteria that may have a large increase in an importance during a scenario. . For example, in the event of a natural disaster, the efficient movement of people would have a higher importance. . Conversely, transportation planners chose major decrease for criteria that may indicate a large decrease in importance during a scenario. . There were not any major decreases for the Roanoke case. . Most of the impacts for the Roanoke case are minor increases and decreases. . Major increases and decrease affect the criteria by doubling the magnitude of the score, minor decreases and increase the magnitude of the score by 1.5 times. . The increase in weight for the criteria is relative, meaning that if all criteria importance increase or decrease in the same manner for a scenario, the criteria will still have the same weight. In the results section of the survey tool, the tool displays the policies and their scores in different scenarios. Figure 5 shows how transportation planners score policies using a high, medium and low/not sure scale.
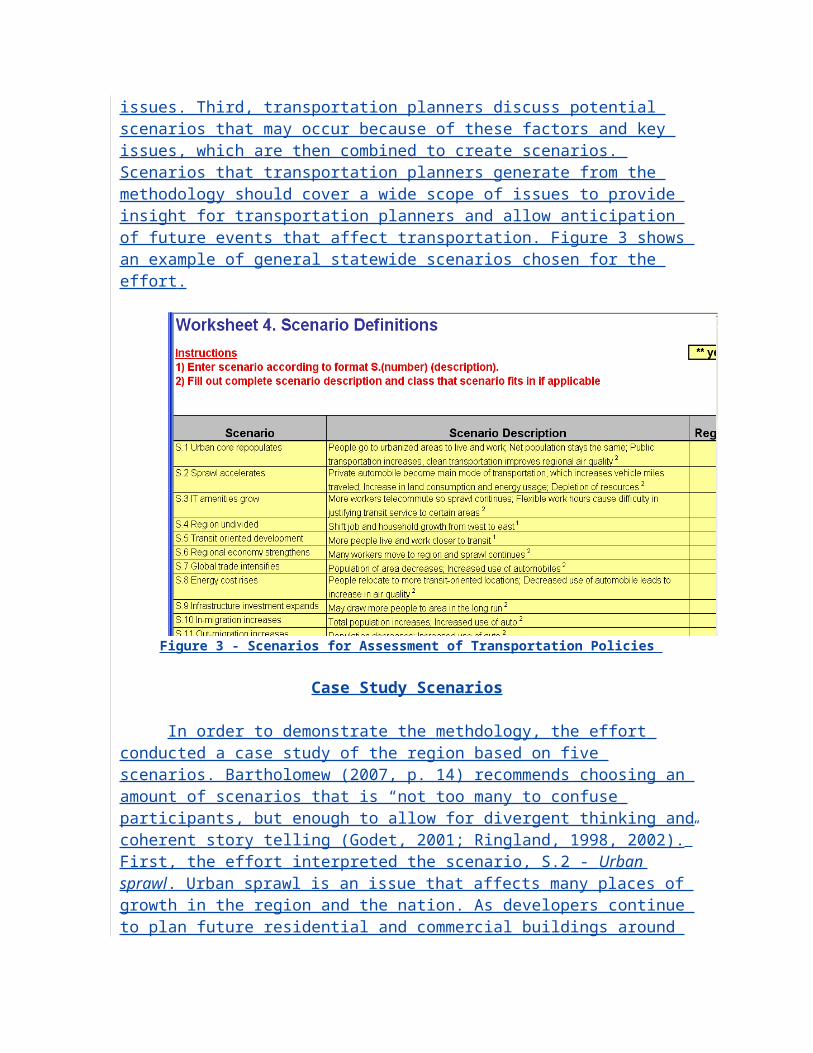
Figure 5 - Multimodal Transportation Policy Assessment Before Scenario Evaluation [Created by Matthew Schroeder, 2008]
The increase in weight for the criteria is relative, meaning that if all criteria importance increase or decrease in the same manner for a scenario, the criteria will still have the same weight. . In the results section of the survey tool, the tool displays the policies and their scores in different scenarios. . The Sensitivity of Policy Ranking on Scenario Evaluations
The fifth and final step, Assess Policy Performance Sensitivity to Region, involves synthesizing the information developed in the previous steps of the methodology. To inform the transportation planners of the effects of the scenarios on the policy prioritization, there are several displays in the survey tool representing the policy scoring. . The survey tool uses a table to display the scores of the policies against the scenarios as well as the mean score of each policy. . The tool includes another table that shows the ranking of each policy against other policies for each scenario. . Scatter plot graphs accompany both tables in the survey tool. . The graphs show the wide range of policy effects. . The displays of policy scores are critical for the survey tool to fulfill the objective of providing a method for transportation planners to get more acquainted with the affects of multimodal transportation policies in varied futures. . The next section will display the results of the survey tool when applied to the Roanoke area. .
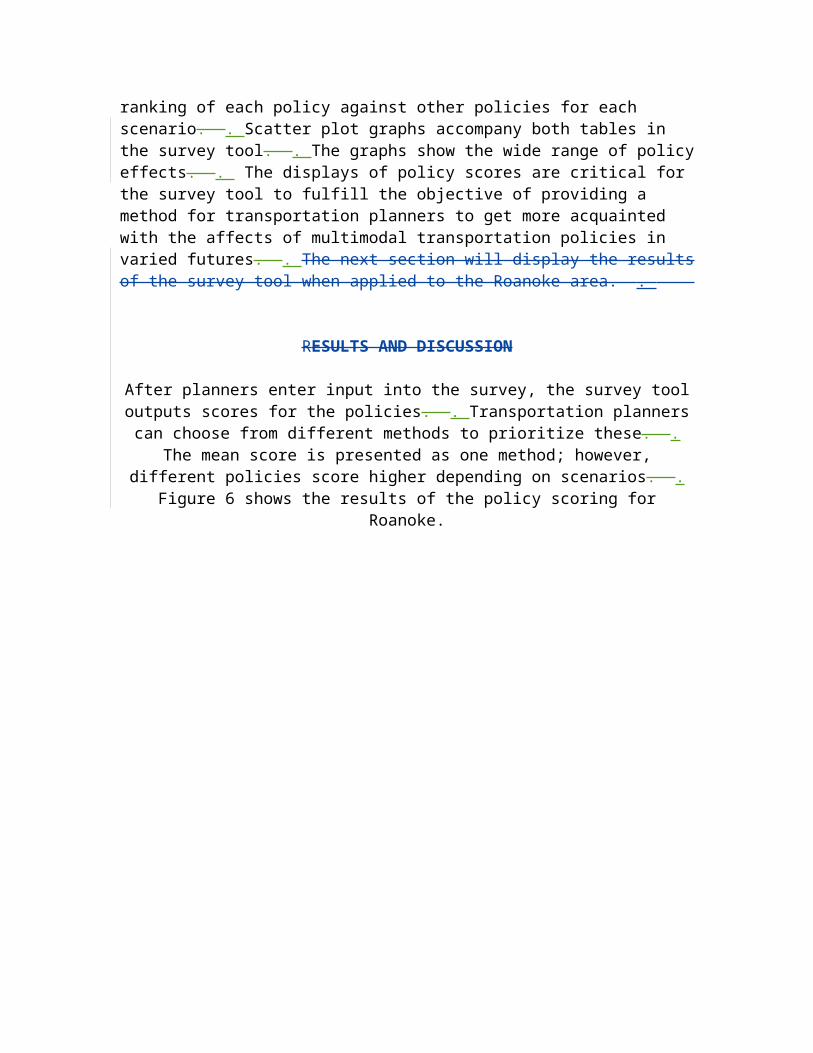
RESULTS AND DISCUSSION

After planners enter input into the survey, the survey tool outputs scores for the policies. . Transportation planners can choose from different methods to prioritize these. . The mean score is presented as one method; however, different policies score higher depending on scenarios. . Figure 6 shows the results of the policy scoring for Roanoke.
Figure 6 - Overall Policy Impact Scoring [Created by Matthew Schroeder, 2008]

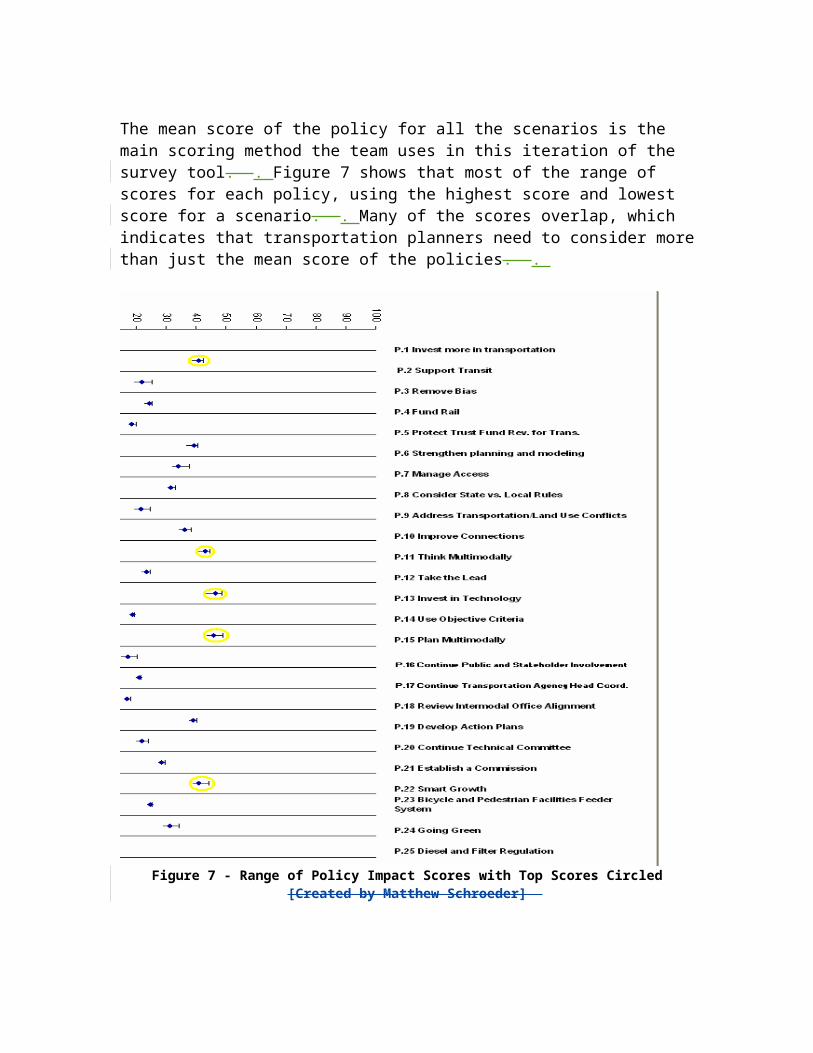
The mean score of the policy for all the scenarios is the main scoring method the team uses in this iteration of the survey tool. . Figure 7 shows that most of the range of scores for each policy, using the highest score and lowest score for a scenario. . Many of the scores overlap, which indicates that transportation planners need to consider more than just the mean score of the policies. .
Figure 7 - Range of Policy Impact Scores with Top Scores Circled [Created by Matthew Schroeder]

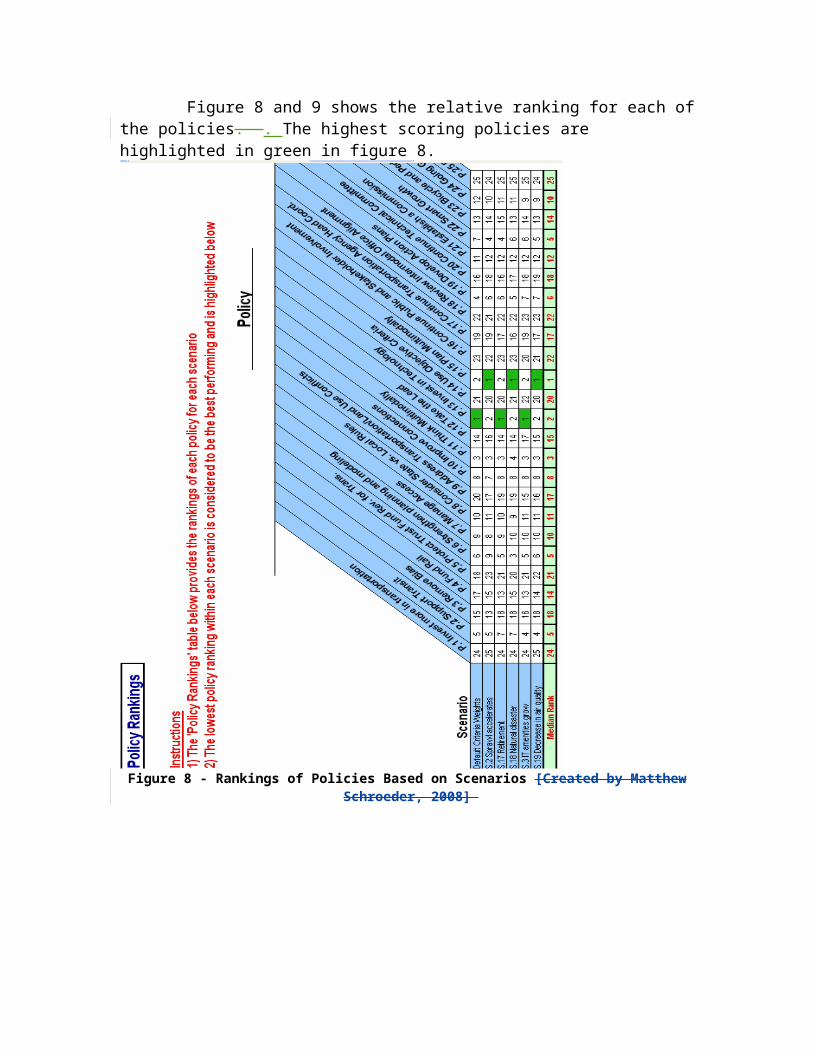
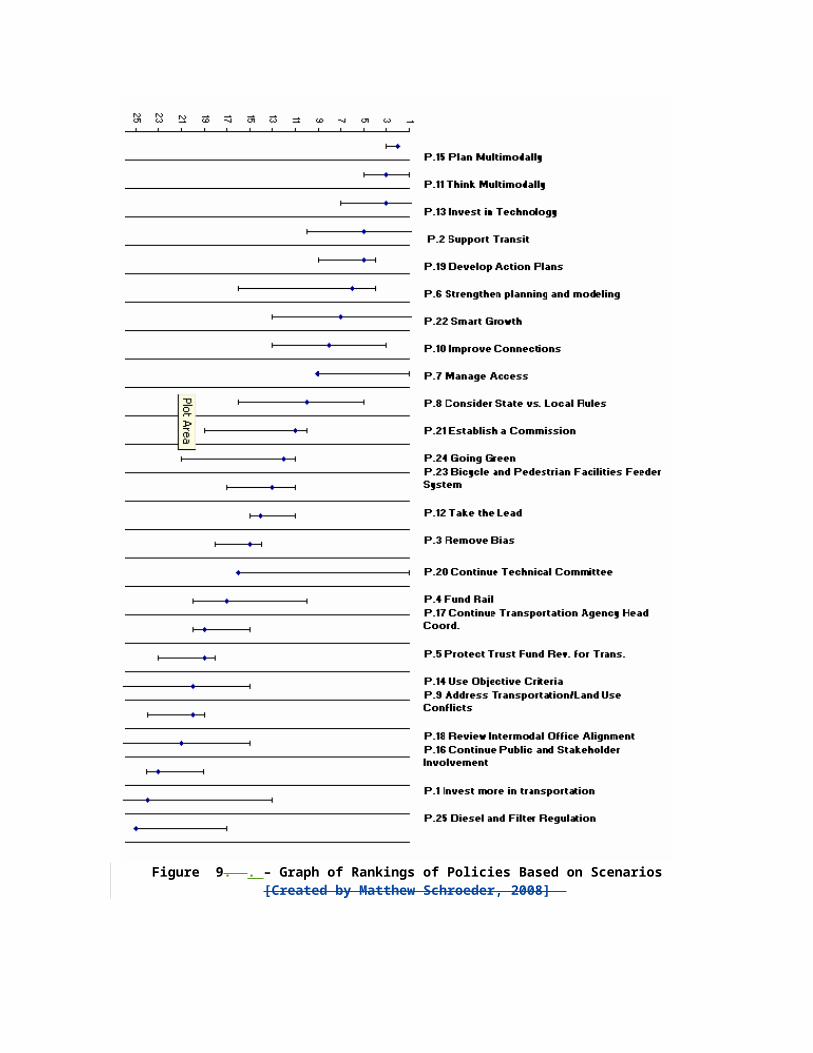
Figure 8 and 9 shows the relative ranking for each of the policies. . The highest scoring policies are highlighted in green in figure 8.
Figure 8 - Rankings of Policies Based on Scenarios [Created by Matthew Schroeder, 2008]
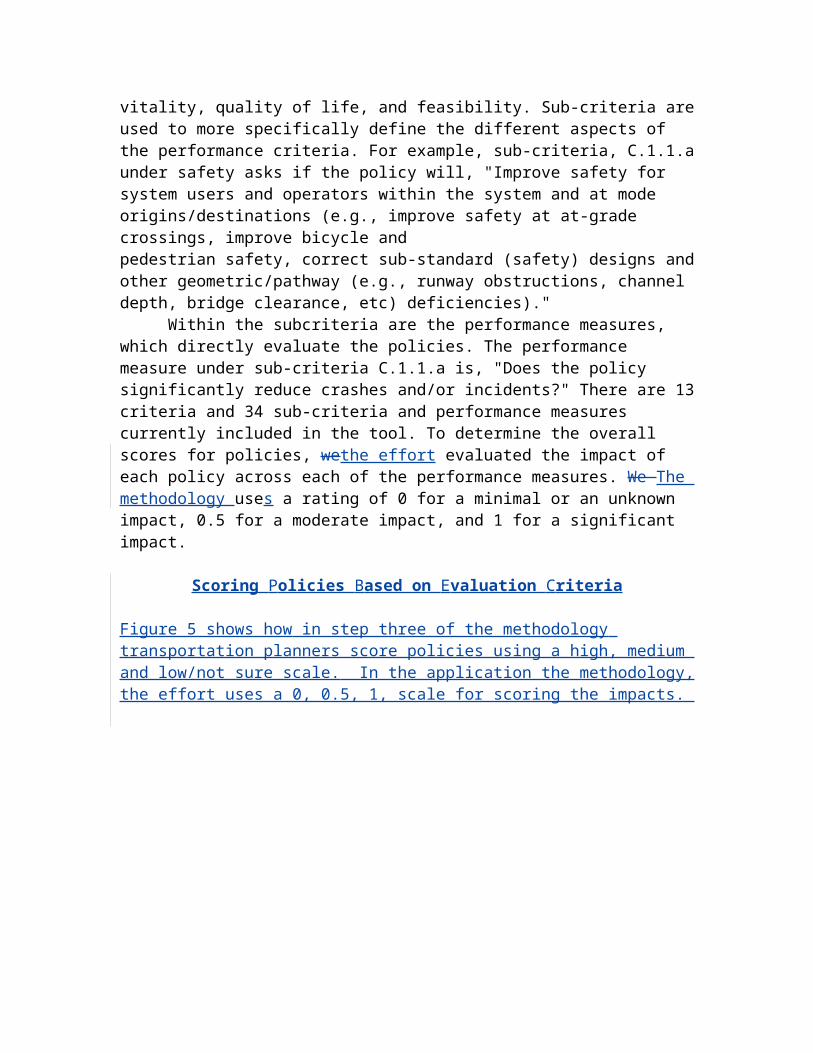
Figure 9. . – Graph of Rankings of Policies Based on Scenarios [Created by Matthew Schroeder, 2008]
The top five policies based on the mean score are P.2 - support transit, P.15 - think multimodally, P.13 - invest in technology, and P.22 - smart growth. . The specific policies chosen in the prioritization are less important than the methodology and ability for transportation planners to adapt and effectively use the methodology to prioritize policies. .
The top rated policies, P.1 - invest in technology and P.15 - think multimodally, both have the same amount of first and second place rankings throughout the scenarios. Policies P.22 - smart growth and P - support transit also have the same score; however, they rank higher and lower in different scenarios. . The next chapter discusses the results of the survey toolapplying the methodology with the survey tool as well as scenario-based planning in tools and transportation planning methodologies. .
A recommendation for the survey tool is that transportation planners consider both mean score and individual scenario rankings. . Some of the possible evaluation methods for transportation planners are weighting scenarios, using one scenario as a tie-breaker or most important scenario, or using the standard deviation in rankings. . For example, using Student’s T interval for the scenario ranking score orders the following policies from best to worst: P. 2, P. 22, P. 19, P. 6. . Using the mean score, P. 2 and P. 22 are tied as well as P. 19 and P. 6. . The survey tool provides the information to the transportation planners to allow for several ways to prioritize the policies.
Uses of the Survey ToolMethdology
The teamThe effort designed the methodology and survey tool to be adaptable to several metropolitan planning organizations (MPO) and regions of Virginia. . Therefore, one of the major benefits of the survey tool is its flexibility. . Transportation planners can add and take away scenario and policies as well as change the weighting of policy evaluation criteria compared to scenarios. . The survey tool contributes a formal methodology for prioritizing multimodal transportation policies as requested by the team’s sponsors of the effort, the Multimodal Office. . The scenario-based approach of the survey tool provides an improvement over other methodologies in terms of providing transportation planners with a more holistic view of the future in addition to forecasting methods. .
Demonstrations in Other Virginia Regions
The purpose of these examples is to demonstrate the robustness of regional scenario-based planning for evaluating statewide multimodal transportation policies. . The examples include regions in the commonwealth of Virginia that have varying long term transportation planning needs based on geographical location, demographics, and other characteristics. . Each example portrays the utilization of scenario-based planning on a regional level and its effects on the prioritization of transportation policies. . The result of these examples illustrates the ability for scenario-based planning to coordinate statewide multimodal transportation policy prioritization among regions. .
In order to demonstrate the needs of the region and the efficaciousness of scenario-based planning, wethe effort performed a case study of four major regions in the
Matthew Schroeder, 08/05/08,
ok placement?
Matthew Schroeder, 08/07/08,
Get rid of?
commonwealth of Virginia. . These regions are based on the boundaries for the Virginia Association of Planning District Commission. . In addition to R.1 – Roanoke, T the regions we chosen were Region R.4 - Richmond, R.2 - Hampton Roads, R.1 -Roanoke, and R.3 - Northern Virginia. . For each region, wethe effort observed and analyzed regional factors such as population, employment, researched long term predictions and planning methodologies and interviewed transportation planners (reference survey?). . In the case studies, after expounding on regional factors, wethe effort applied the scenario-based planning workbook tool to the region. . The demonstrations are featured in Appendix A.
To apply the workbook tool, we performed multimodal transportation policy scoring and scenario weighting. . The final result provides a policy prioritization recommendation that indicates the results of the diverse needs of the differing areas. . Region R.2 - HAMPTON ROADS
Overview
Hampton Roads is located in southeast Virginia and borders the Chesapeake Bay as well as the Atlantic Ocean. . Figure 10 depicts the Hampton Roads Planning District Commission boundaries. .
Figure 10. Hampton Roads Planning District (Hampton Roads Planning District Commission, 2008)
The boundaries of the planning district are the focus for the case studies. . The geographical location of the area, along with the demographics and cities give the area several unique characteristics. . Multimodal transportation policies that consider increaing population and employment will be considered, as well as the relevant scenario of sea level rising.
Matthew Schroeder, 08/05/08,
H
Policies
The Hampton Roads area is a growing region and thus must account for the complexities associated with population growth and employment shifts. . For example, according to the long term transportation plan (cite), there is an expected increase in population in the area by over 442,000 between 2000 and 2030, an annual growth rate of 0.8%. Virginia Beach will experience the largest locality increase in population, with an increase of over 105,000 people (17). . In terms of population, The HRMPO area is expected to add an additional 243,000 employees between 2000 and 2030, an annual growth rate of 0.8% (18). . The following policies were used in conjunction with the workbook tool:
P.4 – Fund Rail
The Intermodal Management System Regional Study for Hampton Roads was published in 2007 (cite). . The study analyzes and summarizes the important of freight movement for the Hampton Roads area. . One of the major ways freight movement is performed is through rail. . Four major rail routes that connect the nations east-west rail system begin and end in Hampton roads. . According to the study, for “Hampton Roads to remain competitive in attracting new business, it must facilitate the rapid and efficient movement of new materials and finished products using…trains” (2). . For example, $322 million project cost is predicted for improving the Heartland Corridor (103). . As shown in figure X, the dollars per ton for Hampton Roads freight is expected to increase in the future. .
Table 1. . Dollars Per Ton for Hampton Roads Freight (Intermodal Management System Regional Freight Study, 2007)
P.24 - Going Green
Environmental concerns are relevant to the Hampton Roads area. . Given the high population of the area and increasing freight activity, there is the potential for a high amount of pollution. . The Hampton Roads 2030 Transportation Planning report (cite) contains a section for environmental mitigation activities. . Potential policies and methods for going green mentioned in the report include “avoiding impacts altogether,minimizing a proposed activity/project size or its involvement, rectifying impacts(restoring temporary impacts), precautionary and/or abatement measures to reduceconstruction impacts, employing special features or operational management measuresto reduce impacts, and/or compensating for environmental impacts by providingsuitable, replacement or substitute environmental resources of equivalent or greater
value, on or off-site.” (99). .
Scenarios
Because of the high population of the Hampton Roads area and the wealth of multimodal transportation, there are several scenarios that should be considered in order to properly prioritize transportation policies. . The scenarios that this thesis analyzed were sea rise and IT amenities growth. .
S.20 - Sea Rise
One of the region’s main concerns is global warming. . Deputy Secretary of Transportation for Virginia Ralph Davis gave a presentation on (some date) about the dangers of global warming and the potential effects of climate change. . (further info, numbers and stuff) The Hampton Roads area is especially prone to the negative effects of global warming given its environment. . One of these effects is sea level rising. . In 2007, ICF International published a report entitled “The Potential Impacts of Global Sea Rise on Transportation Infrastructure”. . The report covers the District of Columbia, Maryland, North Carolina, and Virginia. . Norfolk Harbor was identified as an area of concern given the density of its economic activity and location. . The figure below is from a presentation by Nikki Rovner, Deputy Secretary of Natural Resources on the Governor’s Commission on Climate Change (2008). . The dark blue areas represent areas at-risk for flood damage. .
Figure 11. Risk Areas for Flood Damage around the Hampton Roads Area The presentation discusses the effects of sea-rise and the areas most at risk in the Hampton Roads Area, as well as throughout Virginia. . Planners in the Hampton Roads area should be consider this scenario when developing future transportation policies. .
ITC Labs and Classrooms, 08/05/08,
If necessary
ITC Labs and Classrooms, 08/05/08,
Need citation info for this
S.5 - Transit Oriented Development
In a survey sent out to Planning District Commissions in Virginia, the Hampton Roads Planning District mentioned transit oriented development as an important scenario for consideration in the future. . One of the goals for the area in the long term transportation plan is to “Increase the accessibility and mobility options available to people and for freight. And set aside funding for mass transit projects.” Two current long term projects in the Hampton Roads district are the Norfolk Light Rail and Peninsula Fixed Guideway. . Both these projects will help the area in increasing transit usage and capability. .
Workbook Analysis
We used the background information and simulated the use of our workbook tool to recommend a prioritization of multimodal transportation policies for Hampton Roads. .
We used the background information and simulated the use of our workbook tool to recommend a prioritization of multimodal transportation policies for Hampton Roads. . Figure 12 shows the weighting of the critieria against the future scenarios for the Hampton Roads region. .
Figure 12. Survey Workbook Criteria Weighting over Scenarios for the Hampton Roads Region
The weighting of the criteria based on the scenarios relevant to Region R.2 – Hampton Roads results in the prioritization of the five policies shown in figure X. .
The lines extending from the points represent the minimum and maximum scores of the policies using the scenarios S.5 – Transit Oriented Development and S.20 – Sea Rise. . Policy P.2 – Support Transit ranked the highest overall, however, the policy score overlapped with Policy P.4 – Fund Rail. . Policy P.23 – Bicycle and Pedestrian Facilities Feeder System and Policy P.24 – Going Green both scored lower than the other three policies. . The result does not suggest that these policies should not be considered, on the contrary, these policies are important policies. . The results indicate that these policies may need to be examined for robustness in future scenarios and closely examined when being combined with other policies and projects that implement the policies.
Conclusion
We found that several multimodal transportation policies score strongly against future scenarios relevant to the region. . Some policies score lower than others and thus may not be as robust in future scenarios. . The diversity of the Hampton Roads area poses many challenges for transportation planners. . As demonstrated in this case study, scenario-based planning helps planners identify future factors and needs of the area that contribute to current policy decisions. .
Findings from Demonstration
The case studies in the diverse regions of Virginia displayed the variety of potential futures based on the unique characteristics of each region. . One of the top policies for all regions was Policy P.2 – Support Transit. . The other demonstrations are detailed in Appendix A. . However, there were other policies that scored similarly and robustness against future scenarios must be taken into consideration during policy prioritization by transportation planners. We The effort utilized Scenarioscenario-based planning to account for the different futures of the region and improve coordination potential among the regions by considering the regional impacts of scenario-based planning on statewide multimodal transportation policies. . The variety in these regions shows an increased
need for coordination of future plans. . Scenario-Based planning provides a way to better anticipate future state and regional transportation needs. .
Scenario-Based Planning Integrated with Current Methods
Transportation planners can use the survey tool in conjunction with other current methods. . In Roanoke, transportation planners can use the survey tool as a filter to decide which policies transportation planners will forecast and evaluate (M. McCaskill, personal communication, February 25, 2008). . Also, transportation planners can use scenario-based planning to account for different characteristics in multiple regions. . Scenario-based planning can also be applied to transportation planning other than policy planning. . Feedback from the Roanoke MPO and Multimodal Office indicate that the scenario-based planning methodology has potential to integrate with current planning methods and provide more insight into the possible impacts of multimodal transportation policies in the future (M. McCaskill, personal communication, February 25, 2008). . Transportation planners often need to evaluate long-term transportation projects and transportation planners can use scenario-based planning in similar way as they can with prioritizing long-term transportation policies. . Financial constraints are another large concern for transportation planners. . Transportation planners can integrate financial future scenarios to use scenario-based planning to better understand financial risks for transportation policies and projects. . For transportation planners in Virginia to use scenario-based planning effectively, the approach must be understood by planners and reasonably integrated into current planning methods. . The scenario-based approach’s ability to integrate into other Virginia regional transportation areas is integral to further proving scenario-based planning use in Virginia and may serve as the topic of a future project. .
Economic, demographic, spatial, and environmental scenarios are more important than ever before, and it is essential that local, state, and federal government agencies properly plan for the scenarios. The survey workbook incorporates scenario-based thinking into long-range transportation planning and is the foundation of a model that will be the next generation of transportation planning.
In order to expand the use of the survey workbook and scenario-based planning approach, the team researched scenario-based planning throughout the state and conducted a preliminary survey of other Metropolitan Planning Organizations (MPO) in the state. The survey included high level scenarios such as industrial growth, population growth, and natural disasters. Regional needs for scenario-based planning differ. The results of the survey indicated that adjustments are necessary to the survey workbook and the scenario-planning approach to effectively aid transportation planning.
Results of the Scenario Survey
A survey including scenario-based planning and multimodal policy importance questions was sent to the PDCs and MPOs in the commonwealth of Virginia. . The full survey can be referenced in Appendix B. . The following questions related to scenario-based planning were asked in the survey:
Matthew Schroeder, 08/05/08,
Can cut and just reference appendices if necessary
Section 3. . Scenario Planning
The University of Virginia is also assisting the Multimodal Planning Office with scenario planning related to the six long-range goals and 21 policy recommendations identified in VTrans2025. . The following questions support that effort.
Describe any experience with scenario-based long-range transportation planning in your region, including any coordination with local, regional, federal agencies or the private sector.
Check up to five (5) of the following scenarios that are relevant for scenario-based long-range multimodal transportation planning for your region:
Increased urban populationSprawl accelerationIT amenities growthJobs and households shift
regionallyTransit oriented
developmentRegional economy growsGlobal trade growsEnergy costs riseInfrastructure investment
grows
Increased overall population and automobile usage
Population decreaseDecrease in automobile use and increase in transit use
Increase in overall public transit usage
Energy usage constraintsNatural disasterIncreased retirementOther (Please explain)

1. Choose one (1) scenario identified above, and using the table below, characterize how the scenario might affect the relative importance of the VTrans planning goals (shown in the first column) for your region.
Scenario: [elaborate if needed]
Major Decrease
Minor Decrease
Same Minor Increase
Major Increase
Safety/security Preservation/system managementMobility/accessibilityEconomic vitalityEnvironmental sustainability Fiscal responsibility
4. Check up to five (5) of the following VTrans2025 statewide policies (from the VTrans2025 Phase 3 Final Report at www.vtrans.org ) that are of particular importance to your region:
Increase investment in transportationSupport public transitFund railStrengthen planning and modelingManage land-use/accessConsider state versus local responsibilities Address transportation/land use conflictsImprove multimodal travel connectionsIncrease multimodal planning emphasis Invest in technologyContinue public and stakeholder involvementProvide bicycle and pedestrian facilities
The following PDCs and MPOs responded: George Washington Regional Commission Hampton Roads PDC National Capital Region Region 2000 Blacksburg, Christiansburg, Montgomery Area MPO Roanoke Valley-Alleghany Regional Commission Northern Shenandoah Valley Regional Commission Crater Planning District Commission Lenowisco Planning District Commission Richmond Regional Planning District Commission
We recorded and analyzed the quantifiable results of the survey. . To analyze the regional differences in Virginia, we included analysis of the west and east PDCs and MPOs. . The west PDCs/MPOs include: Region 2000, Northern Shenandoah Valley Regional Commission, Blacksburg/Christiansburg/Montgomery Area MPO, Roanoke Valley-Alleghany Regional Commission, and Lenowisco Planning District Commission. . The east PDCs/MPOs include: Hampton Roads PDC, National Capital Region, Crater Planning District Commission, George Washington Regional Commission, and Richmond Regional Planning District Commission. . Figures 14 and 15 show the overall percent relevance of scenarios and policies to the PDCs/MPOs.
DRAFT
0.00%
20.00%
40.00%
60.00%
80.00%
100.00%
Perc
ent U
se
Figure 14. Overall Relevant Policy Percentage
0%10%20%30%40%50%60%70%80%
Figure 15. Overall Relevant Scenario Percentage
The policies P.23 - Bicycle and Pedestrian Facilities Feeder System, P.1 - Invest more in transportation, and P.2 - Support Transit stand out in the survey as being overall important policies in the commonwealth of Virginia. . The scenarios of S.8 - Energy cost
DRAFT
rises and S.2 - Sprawl accelerates were found to be important in Virginia with a 70% and 60% use in the PDCs/MPOs surveyed. .
Figures 16 and 17 show the breakdown of relevant policies for the east and the west region.
0.00%
20.00%
40.00%
60.00%
80.00%
100.00%
Increase Invest. In Trans.
Prov. Bicycle and ped. Fac.
Support Pub. Trans
Fund Rail
Consider State v. Local
Address trans/land use conf.
Streng. Plan and Model
Improve multimodal conn.
Contin. Pub. Stake. Invovl.
Manage Land-use
Invest in tech.
Perc
ent U
se
Figure 16. Eastern PDCs/MPOs Policy Importance
0.00%
20.00%
40.00%
60.00%
80.00%
100.00%
Perc
ent U
se
Figure 17. Western PDCs/MPOs Policy Importance
DRAFT
ITC Labs and Classrooms, 08/05/08,
Get rid of title
For the eastern PDCs/MPOs, P.1 - Invest more in transportation and P.23 - Bicycle and Pedestrian Facilities Feeder System appear to be important, being picked 100% and 80% respectively. For the western PDCs/MPOs, P.23 - Bicycle and Pedestrian Facilities Feeder System and P.2 - Support Transit are the most important, with 100% and 80% use. . In comparing the two areas, the policy P.7 - Manage Access and P.13 - Invest in Technology appear to be more important in the west, whereas increase investment in transit and strengthen planning and modeling is more important in the east. .
Figures 18 and 19 show the breakdown of relevant scenarios for the east and west region.
0.00%20.00%40.00%60.00%80.00%
100.00%
Infrastr. Invest. Grows
Energy Costs Rise
Sprawl Accel.
Transit Develop.
Incr. overall public transit
Increased Urban Pop.
Reg. Econ. Grows
Jobs/House Shift
Decr. Use of Autos/In...
Natural Disaster
IT Amenities Grow
Increase Pop./Autos
Global Trade Grows
Increased Retirement
Pop. Decr.
Energy Use Constraints
Figure 18. Eastern PDCs/MPOs Scenario Importance
DRAFT
ITC Labs and Classrooms, 08/05/08,
Get rid of title
0.00%20.00%
40.00%60.00%
80.00%100.00%
Figure 19. Western PDCs/MPOs Scenario Importance
For the eastern PDCs/MPOs the relevant scenarios are S.9 - Infrastructure investment expands, S.8 - Energy cost rises, S.2 - Sprawl accelerates, S.5 - Transit oriented development, and increased overall public transit. . In the west, the scenarios of S.8 - Energy cost rises, S.2 - Sprawl accelerates, and S.17 - Retirement are relevant to the PDCs/MPOs. . The scenario S.9 - Infrastructure investment expands is much more important in the east than in the west (80% importance vs. 0% importance). . The scenario S.17 - Retirement appears to be more important in the west than the east (60% importance vs. 0% importance). .
We also recorded and analyzed the questions in the survey considering the effect of scenarios and regional use of scenario-based planning. . The results of the scenarios show the regional differences in policy needs and future scenarios. . Many regions are using scenario-based planning in a variety of ways. . Thus, it is crucial that there is coordination among regions during policy prioritization and long term planning. . Standardized scenario-based planning will aid the region in planning coordination. .
CONCLUSION
The application of the policy prioritization methodology in Roanoke successfully introduced scenario-based planning to the Roanoke Valley Metropolitan Planning Organization. . WeThe effort exceeded most applications of scenario-based planning in literature by working with transportation planners to revise and improve the survey tool for usage in other regions of Virginia. . As discussed in the literature review, one of the major criticisms of traditional transportation planning is the lack of single resulting strategy and lack of holistic approach for future predictions. . The project’s scenario-
DRAFT
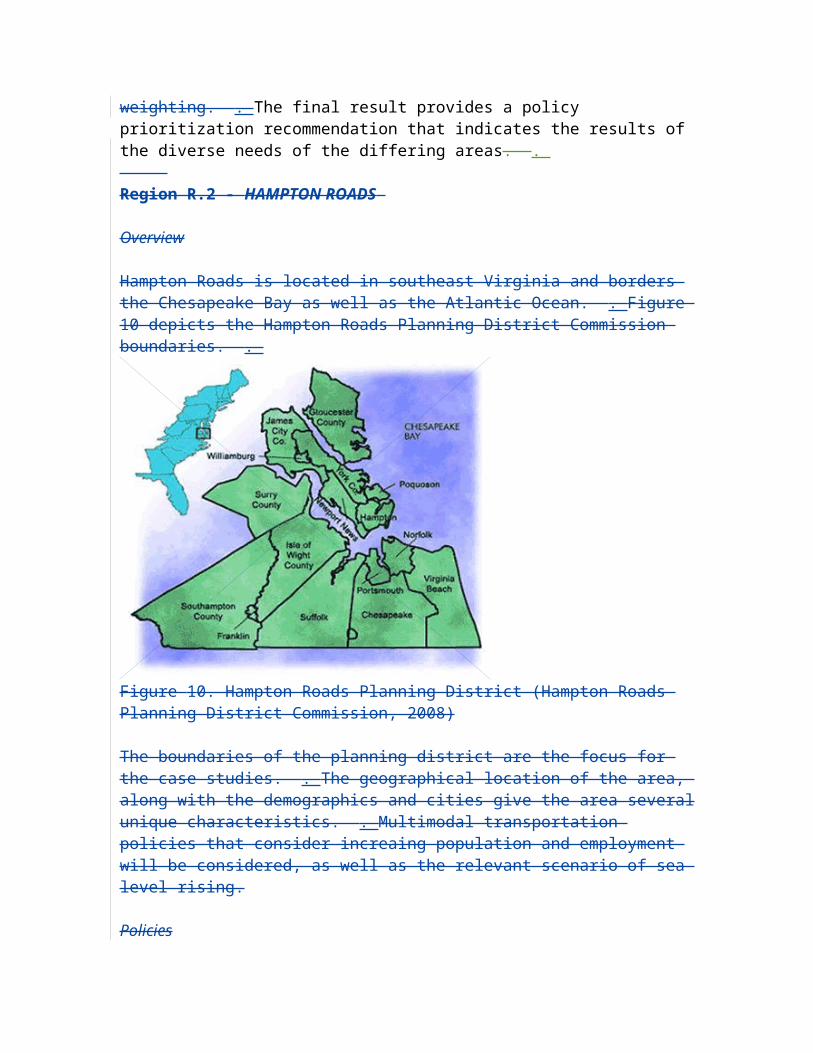
based planning approach exposed transportation planners in Roanoke to the holistic approach of considering multiple futures and categories of events when evaluating long-term transportation policies. . The project prepares scenario-based planning for usage in other regions in Virginia and potentially in other states. . The Multimodal Office also approved of the concept of the survey tool, and its potential to coordinate state transportation policy prioritizations and evaluation criteria with regions within the state. .
The survey tool may have to be thoroughly revised for other regions based on existing methods, but the focus, scenario-based planning, can integrate more smoothly with other regions. . The survey workbook can be customized and used in different regions and localities. The Office of Multimodal Transportation Planning will able to use regional and local policy prioritizations to support its overall statewide plan. With more testing and evaluation, the survey workbook can be used to help states, regions, and localities more effectively prioritize multimodal transportation policies for the long-term and positively impact transportation. Additional scenarios and regions may be added in the future. The ability of the survey workbook to integrate scenario-based planning maximizes its effectiveness in ranking additional policies to be added in the future. . Long-range planning decisions can be made by determining the potential impacts on additional regions and their scenarios. .
The survey tool is a simple demonstration of the use of scenario-based planning. . The main reason for the ease of integration for the scenario-based planning approach the project uses is its flexibility. . For example, the survey tool uses Virginia Department of Transportation criteria to evaluate policies. . A Metropolitan Planning Organization (MPO) can easily change the evaluation criteria to the federal mandated criteria. . The scenario-based planning approach can be made more complex or simpler to account for other regions transportation processes. . Transportation planners and policy makers can also use scenario-based planning to evaluate transportation projects and their financial constraints, in addition to the main focus of the project, prioritizing transportation policies. . As the literature states, there is still hesitation from transportation planners for using scenario-based planning as part of a formal transportation planning methodology. . The approval of metropolitan planning organizations such as Roanoke will help scenario-based planning to quickly gain more acceptance as a formal tool for transportation planning. .
RECOMMENDATIONS
In the future, the scenario-based planning approach will need several more test cases and reviews by transportation planners. . Since there are many different applications for scenario-based planning, it is not necessary that the scenario-based planning approach is unique to the survey tool. . Surveys and polls of how transportation planners can use scenario-based planning in the transportation process will provide guidance to the creation of a more formal scenario-based planning approach. . Appendix E details a brief survey this effort undertook. . Appendix D shows an additional draft-survey that could be issued to transportation planners in Virginia. . The focus for testing scenario-based planning should be mainly among the metropolitan planning
DRAFT
Matthew Schroeder, 08/05/08,
Mention survey stuff in appendix?
ITC Labs and Classrooms, 08/05/08,
Numbered recommendations?

organizations (MPO’s) in Virginia. . The Virginia Department of Transportation should also be strongly involved in developing scenario-based planning so the process can be better standardized throughout the state.
Transportation is an industry that affects all residents of Virginia and many more people that travel in Virginia. . Transportation policy makers and planners acknowledge the importance of being able to properly plan for transportation in the future as population increases and more people use transportation (M. McCaskill, personal communication, February 25, 2008). . Scenario-based planning provides a new way for transportation planners and policy makers to holistically plan for a complex future. . Thus, the attempt to implement and use scenario-based planning as part of the transportation process is a beneficial and worthwhile project. .
COSTS AND BENEFITS ASSESSMENT
This report has described initial steps and associated lessons for the use of regional scenario-based planning. The potential benefits of such a framework include:
Coordination of regional long term planning with other regions and commonwealth
Characterization of the future to improved policy decisions Facilitation of communication among regional planners Identification of regional needs through future scenarios Potential for quantifying policies better with future scenarios
The costs of implementing such a framework whose development is approached in this report include:
Resources needed to survey and hold workshops for regions Time needed to update and adjust regional long term planning standards Resources to accommodate shift in planning approach Time and resources needed to coordinate efforts regionally
ACKNOWLEDGMENTS
We would like to thank members across Virginia’s transportation agencies that provided a wealth of information and advice, notably: Mary Lynn Tischer of the Multimodal Office, Kimberly Spence, Katherine Graham, and Michael Garret of VDOT, Mark McCaskill of RVAMPO, Wayne Ferguson and John Miller of the Virginia Transportation Research Council, members of the Multimodal Advisory Committee, and Ralph Davis, Deputy Secretary of Transportation for Virginia.
DRAFT
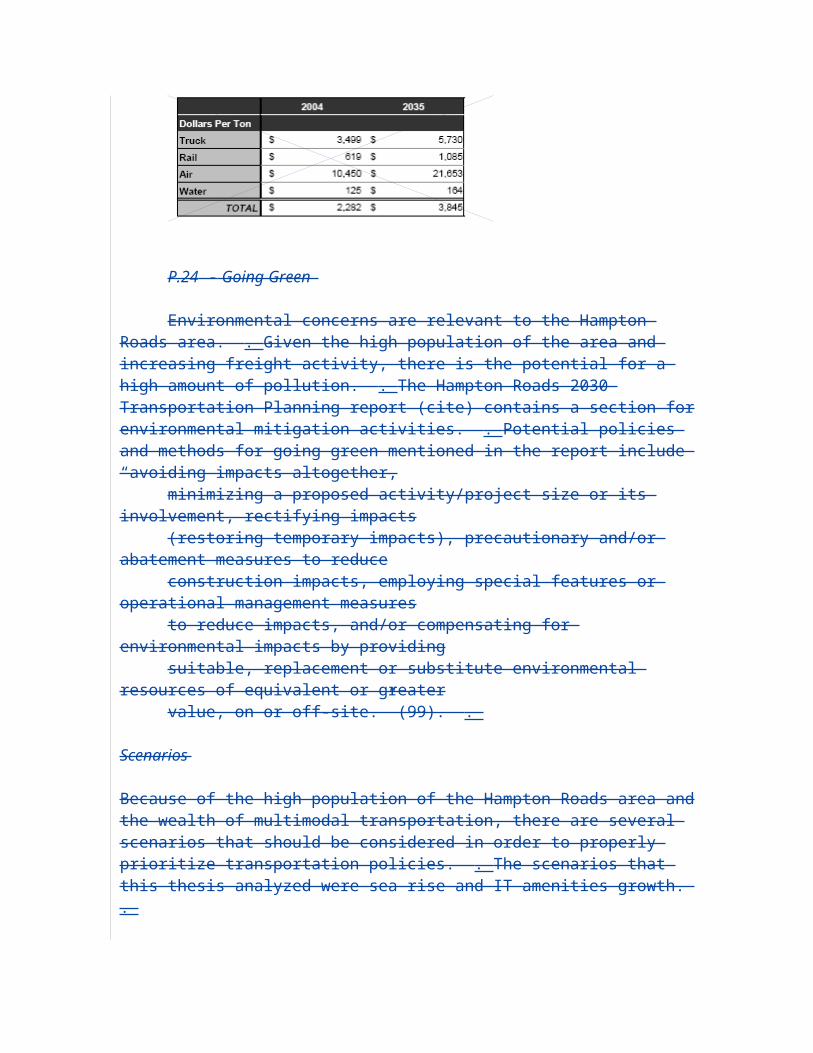
REFERENCES
TransAction2030 (2006). Transaction 2030: Transportation for Today and Tomorrow. Northern Virginia Transportation Authority. 12 pp.
Bartholomew, K. (2005). . Integrating Land Use Issues Into Transportation Planning: Scenario Planning. . Retrieved June 3, 2008, from http://nepa.fhwa.dot.gov/. .
Cervero, R., & Aschauer, D. (1998). . Economic impact analysis of transit investments:Guidebook for practitioners. . Retrieved October 30, 2007, from http://trb.org/news/blurb_detail.asp?id=2582
Christopulos, D. . (2007). . Sierra Club Opposes Intermodal Transfer Station in Roanoke Region. . Retrieved December 3, 2007, from http://virginia.sierraclub.org/roanoke/intermodal.pdf
Cole, Sam (2001). . Dare to Dream: Bringing Futures into Planning. . Journal of the American Planning Association, 67(4), 372 – 383.
Commonwealth of Virginia, Office of the Governor. . (2007). . Governor Kaine Announces New Jobs for Arlington County-GridPoint, Inc. to Invest $5 Million and Move Headquarters to Virginia. . Retrieved November 24, 2007, from http://www.yesvirginia.org/About_Us/NewsArticle.aspx?newsid=900.
Delaware Valley Regional Planning Commission. . (2005). . Regional Analysis of What-If Transportation Scenarios. . Retrieved October 31, 2007 from http://www.dvrpc.org/LongRangePlan/2030/WhatIfFinal.pdf.
Environmental Protection Agency. . (n.d.). . Climate Change – Health and Environmental Issues. Environmental Protection Agency. . Retrieved December 12, 2007, from http://www.epa.gov/climatechange/effects/extreme.html
Federal Highway Administration. . (2007). . FHWA Scenario Planning Initiatives. . Retrieved June 4, 2008, from http://transportation.ky.gov/planning/Scenario/1%20McCullough%20FHWA.pdf
Federal Highway Administration. . (2004). . Scenario Planning Peer Workshop – Binghamton, NY. . Retrieved October 18, 2007, from http://www.fhwa.dot.gov/planning/scenplan/nyscenplanrpt.htm
Federal Highway Administration. . (n.d.). . Scenario planning. . Retrieved October 24, 2007, from http://www.fhwa.dot.gov/planning/scenplan/about.htm
DRAFT

ICF International. (2007). . The Potential Impacts of Global Sea Level Rise on Transportation Infrastructure. . Retrieved June 6, 2008, from http://climate.dot.gov/publications/potential_impacts_of_global_sea_level_rise
MIT Center for Transportation & Logistics and The Zaragoza Center at the ZLC. . (2006). . Proceedings of the Supply Chain 2020 Project’s European Advisory Council Spring 2006 Meeting. . Retrieved October 18, 2007, from http://ctl.mit.edu/public/spring_2006_sc2020_eac.pdf
National Capital Region Transportation Planning Board. (2007). . Financially Constrained Long-Range Transportation Plan. . Retrieved June 6, 2008 from http://www. Mwcog.org/clrp
National Capital Region Transportation Planning Board and the Metropolitan Washington Council of Governments. . (2004). . What If The Washington Region Grew Differently?: The TPB Regional Mobility and Accessibility Scenario study. . Retrieved October 4, 2007, from http://www.mwcog.org/transportation/activities/regional/documents/Generic%2 0for%20Web%207-07.pdf
Richmond Area Metropolitan Planning Organization. . (2007). . 2031 Long-Range Transportation Plan. . Retrieved July 5, 2008, from http://www.richmondregional.org/Urban%20Transp-MPO/MPO_Div_Cats/toc.htm
Roanoke Valley Area Regional Commission. . (2006). Pedestrian Access to Commercial Centers: Connecting residential and commercial Land uses. . Retrieved December 1, 2007, from http://www.rvarc.org/work/access06final.pdf
Roanoke Valley Area Regional Commission. . (2006). . Roanoke Valley-Alleghany Regional Commission Pre-Disaster Mitigation Planning. Retrieved October 17, 2007 from http://www.rvarc.org/disaster/index.htm
Roanoke Valley Area Metropolitan Planning Organization. (2005). . Planning for Elderly and Disabled Mobility. . Retrieved October 18, 2007, from http://www.rvarc.org/work/mobilityfinal.pdf
Roanoke Valley Area Metropolitan Planning Organization. . (n.d.). . What happens when the ‘baby boom’ generation retires? Retrieved November 3, 2007, from http://www.rvarc.org/temp/retirement.pdf
The Roanoker Magazine. . (2007) Where to Retire. . Retrieved November 1, 2007, from http://www.theroanoker.com/visitorguide/wheretoretire/index.cfm.
Rovner, N. . (2008). . Governor’s Commission on Climate Change. . Presentation to the Hampton Roads Planning District Commission. .
DRAFT
Thomas Jefferson Planning District Commission. . (n.d.). . Jefferson Area Eastern Planning Initiative. . Retrieved December 3 2007, from http://www.tjpdc.org/community/epi.asp
Transportation Accountability Commission. . (2007). . Final Report of the Transportation Accountability Commission to the Governor and General Assembly of Virginia. . Retrieved November 3, 2007, from http://www.transportation.virginia.gov/Initiatives/TransportationAccountability/Final_draft%20_%20full_report_9_5_07.pdf
Virginia Department of Transportation. . (2004). . Virginia’s Statewide Multimodal Long-Range Transportation Plan: Phase 3 and Final Report to the General Assembly. . Retrieved December 3, 2007, from http://www.virginiadot.org/projects/vtrans/resources/revisedPhase3Reportforctb.pdf
Zergas, C., Sussman, J., Conklin, C. (2004). Scenario Planning for Strategic Regional Transportation Planning. . J. Urban Planning and Development, 130(1), 2-13. .
DRAFT

APPENDIX A: SCENARIO-BASED PLANNING DEMONSTRATIONS
Region R.2 - HAMPTON ROADS
Overview
Hampton Roads is located in southeast Virginia and borders the Chesapeake Bay as well as the Atlantic Ocean. Figure 10 depicts the Hampton Roads Planning District Commission boundaries.
Figure 20. Hampton Roads Planning District (Hampton Roads Planning District Commission, 2008)
The boundaries of the planning district are the focus for the case studies. The geographical location of the area, along with the demographics and cities give the area several unique characteristics. Multimodal transportation policies that consider increaing population and employment will be considered, as well as the relevant scenario of sea level rising.
Policies
The Hampton Roads area is a growing region and thus must account for the complexities associated with population growth and employment shifts. For example, according to the long term transportation plan (cite), there is an expected increase in population in the area by over 442,000 between 2000 and 2030, an annual growth rate of 0.8%. Virginia Beach will experience the largest locality increase in population, with an increase of over 105,000 people (17). In terms of population, The HRMPO area is expected to add an additional 243,000 employees between 2000 and 2030, an annual growth rate of 0.8% (18). The following policies were used in conjunction with the workbook tool:
DRAFT
Matthew Schroeder, 08/07/08,
H
P.4 – Fund Rail
The Intermodal Management System Regional Study for Hampton Roads was published in 2007 (cite). The study analyzes and summarizes the important of freight movement for the Hampton Roads area.
One of the major ways freight movement is performed is through rail. Four major rail routes that connect the nations east-west rail system begin and end in Hampton roads. According to the study, for “Hampton Roads to remain competitive in attracting new business, it must facilitate the rapid and efficient movement of new materials and finished products using…trains” (2). For example, $322 million project cost is predicted for improving the Heartland Corridor (103). As shown in figure X, the dollars per ton for Hampton Roads freight is expected to increase in the future.
Table 2. Dollars Per Ton for Hampton Roads Freight (Intermodal Management System Regional Freight Study, 2007)
P.24 - Going Green
Environmental concerns are relevant to the Hampton Roads area. Given the high population of the area and increasing freight activity, there is the potential for a high amount of pollution. The Hampton Roads 2030 Transportation Planning report (cite) contains a section for environmental mitigation activities. Potential policies and methods for going green mentioned in the report include “avoiding impacts altogether,minimizing a proposed activity/project size or its involvement, rectifying impacts(restoring temporary impacts), precautionary and/or abatement measures to reduceconstruction impacts, employing special features or operational management measuresto reduce impacts, and/or compensating for environmental impacts by providingsuitable, replacement or substitute environmental resources of equivalent or greatervalue, on or off-site.” (99).
Scenarios
Because of the high population of the Hampton Roads area and the wealth of multimodal transportation, there are several scenarios that should be considered in order to properly prioritize transportation policies. The scenarios that this thesis analyzed were sea rise and IT amenities growth.
S.20 - Sea Rise
DRAFT
One of the region’s main concerns is global warming. Deputy Secretary of Transportation for Virginia Ralph Davis gave a presentation on (some date) about the dangers of global warming and the potential effects of climate change. (further info, numbers and stuff) The Hampton Roads area is especially prone to the negative effects of global warming given its environment. One of these effects is sea level rising.
In 2007, ICF International published a report entitled “The Potential Impacts of Global Sea Rise on Transportation Infrastructure”. The report covers the District of Columbia, Maryland, North Carolina, and Virginia. Norfolk Harbor was identified as an area of concern given the density of its economic activity and location. The figure below is from a presentation by Nikki Rovner, Deputy Secretary of Natural Resources on the Governor’s Commission on Climate Change (2008). The dark blue areas represent areas at-risk for flood damage.
Figure 11. Risk Areas for Flood Damage around the Hampton Roads Area The presentation discusses the effects of sea-rise and the areas most at risk in the Hampton Roads Area, as well as throughout Virginia. Planners in the Hampton Roads area should be consider this scenario when developing future transportation policies.
S.5 - Transit Oriented Development
In a survey sent out to Planning District Commissions in Virginia, the Hampton Roads Planning District mentioned transit oriented development as an important scenario for consideration in the future. One of the goals for the area in the long term transportation plan is to “Increase the accessibility and mobility options available to people and for freight. And set aside funding for mass transit projects.” Two current long term projects in the Hampton Roads district are the Norfolk Light Rail and Peninsula Fixed Guideway. Both these projects will help the area in increasing transit usage and capability.
Workbook Analysis
DRAFT
ITC Labs and Classrooms, 08/07/08,
If necessary
ITC Labs and Classrooms, 08/07/08,
Need citation info for this
We used the background information and simulated the use of our workbook tool to recommend a prioritization of multimodal transportation policies for Hampton Roads.
We used the background information and simulated the use of our workbook tool to recommend a prioritization of multimodal transportation policies for Hampton Roads. Figure 12 shows the weighting of the critieria against the future scenarios for the Hampton Roads region.
Figure 12. Survey Workbook Criteria Weighting over Scenarios for the Hampton Roads Region
The weighting of the criteria based on the scenarios relevant to Region R.2 – Hampton Roads results in the prioritization of the five policies shown in figure X.
The lines extending from the points represent the minimum and maximum scores of the policies using the scenarios S.5 – Transit Oriented Development and S.20 – Sea Rise. Policy P.2 – Support Transit ranked the highest overall, however, the policy score
DRAFT
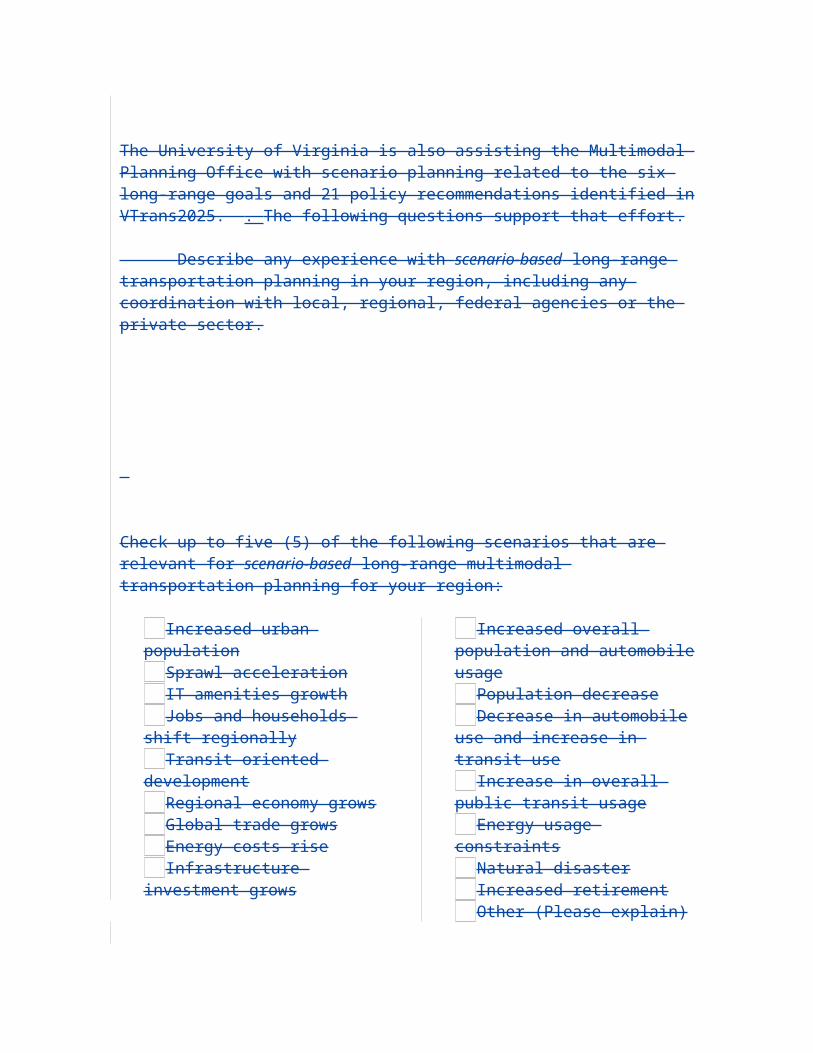
overlapped with Policy P.4 – Fund Rail. Policy P.23 – Bicycle and Pedestrian Facilities Feeder System and Policy P.24 – Going Green both scored lower than the other three policies. The result does not suggest that these policies should not be considered, on the contrary, these policies are important policies. The results indicate that these policies may need to be examined for robustness in future scenarios and closely examined when being combined with other policies and projects that implement the policies.
Conclusion
We found that several multimodal transportation policies score strongly against future scenarios relevant to the region. Some policies score lower than others and thus may not be as robust in future scenarios. The diversity of the Hampton Roads area poses many challenges for transportation planners. As demonstrated in this case study, scenario-based planning helps planners identify future factors and needs of the area that contribute to current policy decisions.
Region R.3 - NORTHERN VIRGINIA
Overview
The northern Virginia area is one of the most populous in the commonwealth. . The region generates a significant portion of the wealth for Virginia. . Regional planning in Northern Virginia is managed by the Metro Washington Council of Governments. . Figure 20 displays the boundaries of the Metro Washington Council of Governments.
Figure 30. Virginia Member Jurisdictions for Metro Washington Council of Governments (http://www.mwcog.org/about/jurisdiction/, 2008)
DRAFT
ITC Labs and Classrooms, 08/05/08,
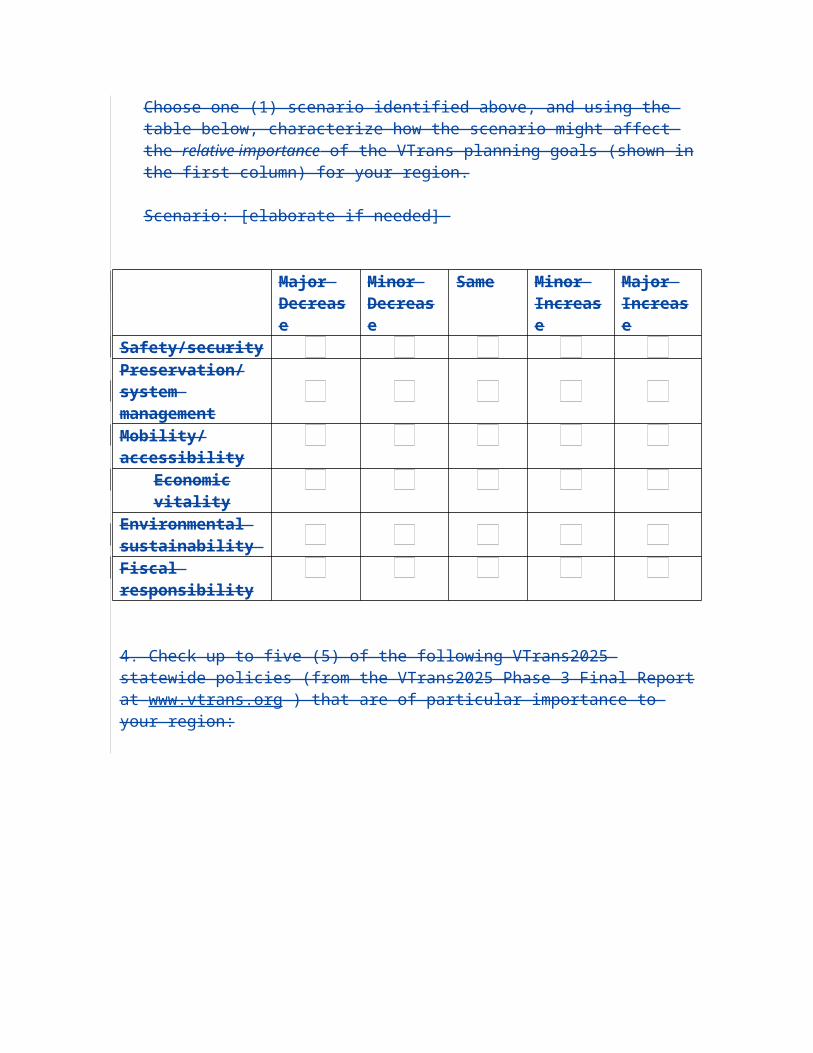
Fairfax, Loudon, Arlington and Prince William counties are included in the region. . The combined population of the four counties out of ninety five total commonwealth counties sums to 1,863,407 (2006 census) or roughly 25% of the Virginia population. . As of January, 2008, Fairfax County, Loudon County, Arlington County, and Prince William County rank first, second, ninth, and eighteenth respectively in a list of the highest median in the nation. . Along with the density and prosperity, the region also contains a multitude of transportation planning issues. .
Policies
P.2 - Support Transit
One of the five main strategies in the MWCOG vision plan is to encourage the use of transit, especially for tourists. . In the long range plan, there are 13 major transit related project plans including Dulles Corridor Rapid Transit and increasing HOV lanes on the National Capital Beltway. .
P.22 – Increase Investment in Transportation
According to MWCOG, the traffic infrastructure in the region needs heavy maintenance. . Moreover, the highway system will not keep pace with the population growth in the region as shown in Figure 21. .
Figure 21. Forecast Trends for Transportation Volume in Northern Virginia (National Capital Region Transportation Planning Board and the Metropolitan Washington Council of Governments,
2004)
As predicted population and jobs increase as shown by Figure 22 the area will continue to need to invest in transportation.
DRAFT
ITC Labs and Classrooms, 08/05/08,
Come back to
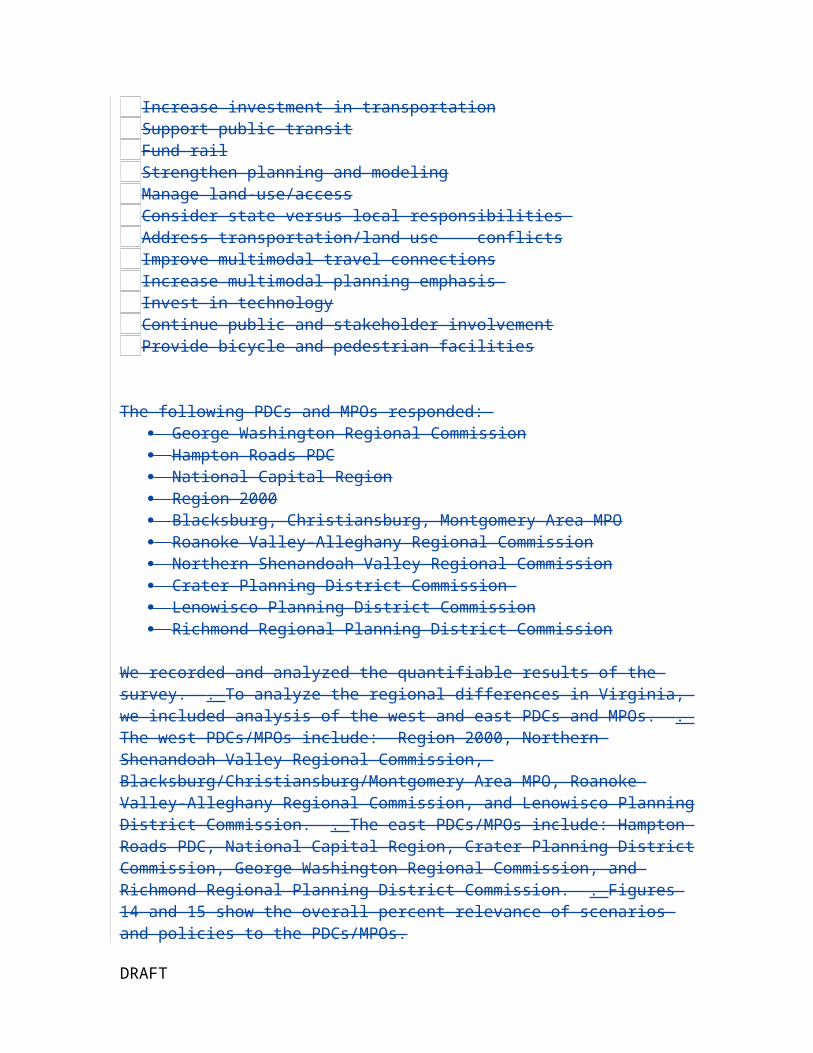
Figure 22. Predicted Job and Household Growth Rate in MWCOG Jurisdiction (National Capital Region Transportation Planning Board and the Metropolitan Washington Council of Governments,
2004)
P.23 - Bicycle and Pedestrian Facilities Feeder System
Objective four in the TBP’s vision plan is to create convenient bicycle and pedestrian access. . This policy also aligns with the Air Quality: Mobile Source Emissions plan (National Capital Region Transportation Planning Board, 2007) in the long range plan. . There also several environmental iniativies in the area such as http://www.commuterpage.com/ as presented at the Virginia Associate of Planning District Commissions Summer Conference 2008.
Scenarios
S.5 – Transit Oriented Development
Smart growth, or higher density planning, is one of the concepts regional planners are currently considering. . In the long range plan (National Capital Region Transportation Planning Board, 2007) indicates a vision of “healthy regional core and dynamic regional activity centers with a mix of jobs, housing and services in a walkable environment.” The scenario planning MWCOG document provides an example of potential “regional activity centers” represented in red (National Capital Region Transportation Planning Board, 2007).
DRAFT
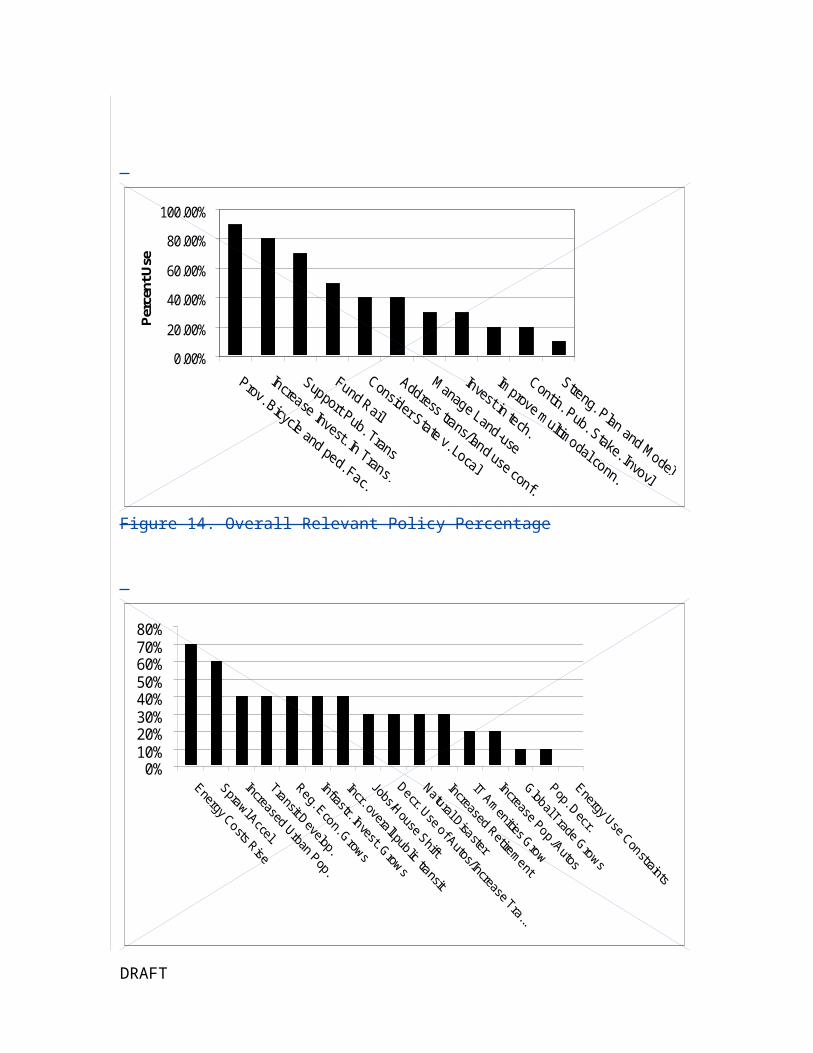
Figure 23. Scenario of Regional Centers (National Capital Region Transportation Planning Board and the Metropolitan Washington Council of Governments, 2004)
S.4 - Job/House Shifts
Job and Households may shift in the region, especially in Fairfax county, where new jobs and population is continually increasing. . The jobs/houses may shift as a result of commute times, as displayed in Figure 24. .
Figure 24. Commute Time During Morning Rush Hour in Northern Virginia Region and the Metropolitan Washington Council of Governments, 2004)
S.5 - Transit Oriented Development (see survey)
Transit oriented development is a probable scenario that the region will face. . It is mentioned in the MWCOG “What If the Region Grew Differently?” Scenario planning paper (2004). . Figure 25 below represents potential extensions of transit in the region.
DRAFT
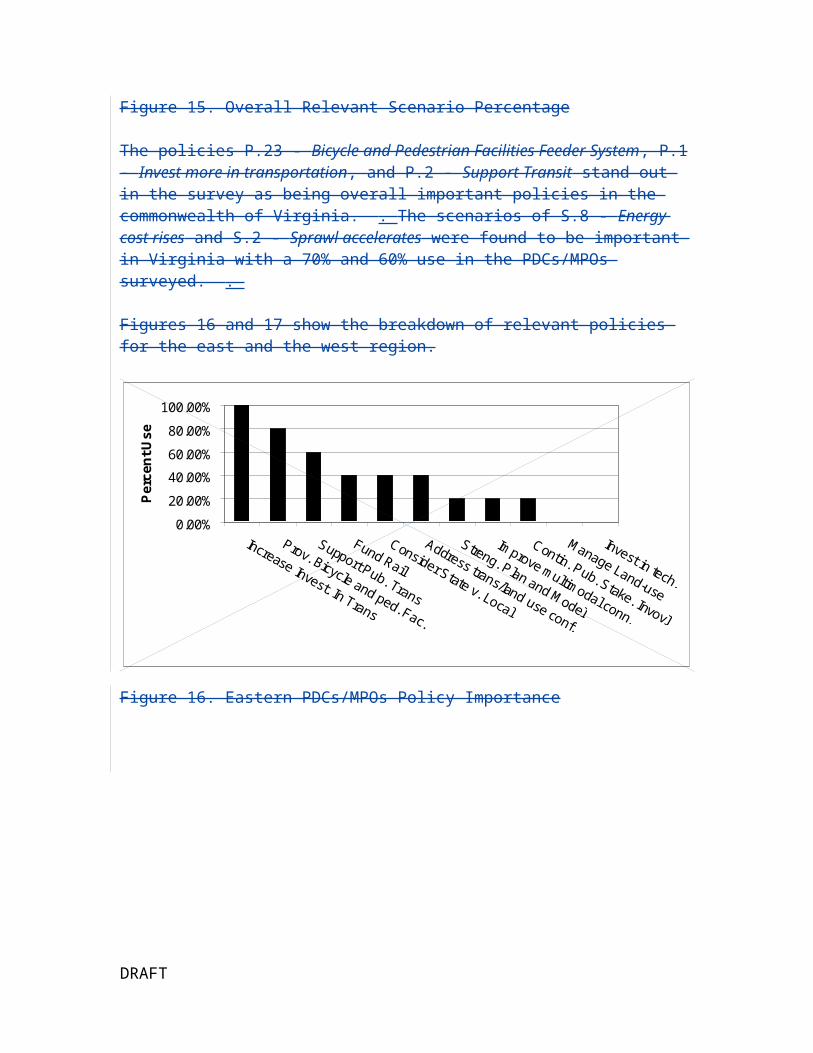
Figure 25. Transit Oriented Development Scenario (National Capital Region Transportation Planning Board and the Metropolitan Washington Council of Governments, 2004)
The effect of transit oriented development may lead to more people moving closer to jobs and vice versa. . Housing and population shift are two major policy concepts that are impacted by this scenario. .
Workbook analysis
We used the background information and simulated the use of our workbook tool to recommend a prioritization of multimodal transportation policies for Northern Virginia. . Figure 26 shows the weighting of the criteria against the future scenarios for the Norhtern region. .
Figure 26. Survey Workbook Criteria Weighting over Scenarios for the Northern Virginia Region
The weighting of the criteria based on the scenarios relevant to Region R.3 – Northern Virginia results in the prioritization of the five policies shown in Figure 27.
DRAFT
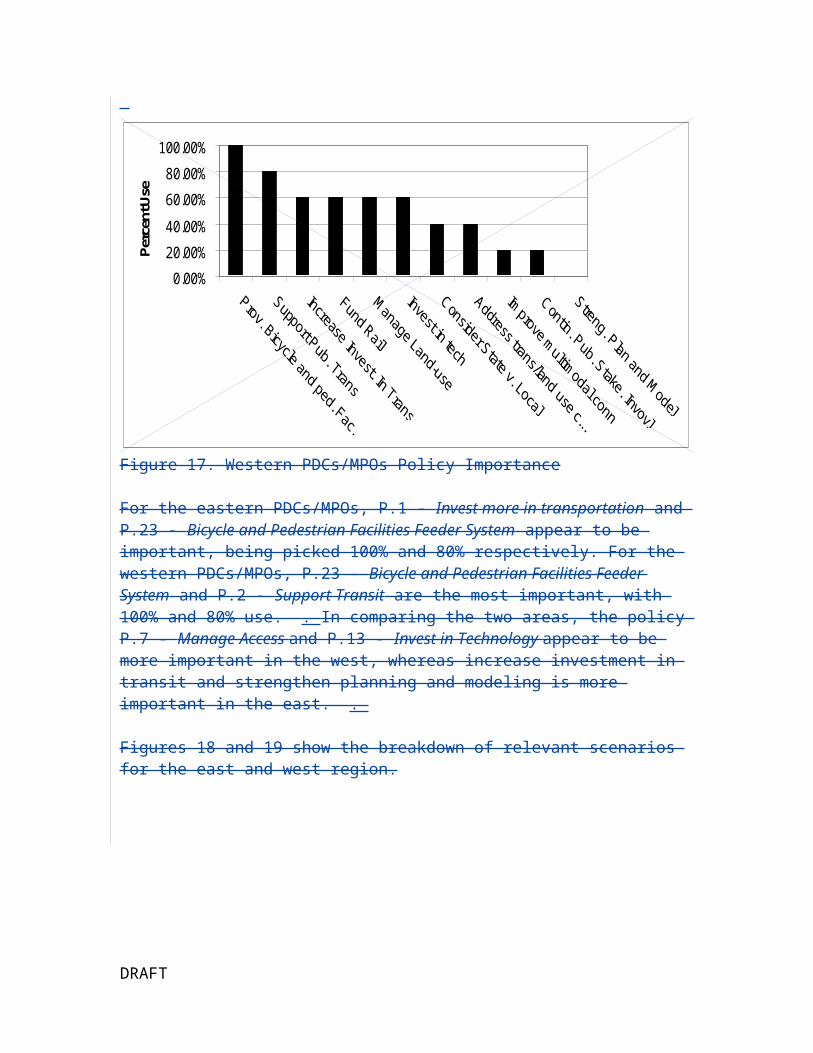
The lines extending from the points represent the minimum and maximum scores of the policies using the scenarios S.4 – Region Divided and S.5 – Transit Oriented Development. . Policy P.2 – Support Transit ranked the highest overall, however, the policy score overlapped with Policy P.1 – Invest More in Transportation. . Policy P.4 – Fund Rail scored lower overall than policy P.9 – Address Transportation/Land Use Conflicts, however, it scored much higher in one of the scenarios and may need further analysis during policy consideration and prioritization. .
Conclusion
In conclusion, the northern Virginia area is a highly populated and prosperous area that faces many transportation-related challenges in the future. . The Metro-Washington Council of Governments has used scenario-based planning in the form of normative scenarios to help anticipate and improve future transportation conditions. . Planning for the future is an integral activity in this region as the region is crucial to the economy of the commonwealth. .
RICHMOND
Overview
The Richmond region is considered one of “the big three” among the Virginia Association of Planning District Commissions due to its population. . The city of Richmond is home to the capital of the commonwealth as well as the governors office. . The city of Richmond deals with similar issues as Northern Virginia, though considers different geographical situations. . Figure 28 shows the areas associated with the Richmond region. .
DRAFT

Figure 28. . Richmond Planning District Commission Jurisdiction (http://www.richmondregional.org/default.htm)
Policies
P.1. – Invest More in Transportation
Invest more in transportation is one of the policies transportation planners chose in the scenario-based planning survey. . Table 2 shows the planned spending by the region for the long-range 2031 transportation plan. (2007)
Table 3. . 2031 Long-Range Transportation Plan Estimated Funds ($1,000's) (http://www.richmondregional.org/Urban%20Transp-MPO/MPO_Div_Cats/toc.htm)
P.6 - Strengthen Planning and Modeling
Strengthen planning and modeling was also selected by the Richmond regional transportation planners in the survey. . Planning and modeling standards are emphasized
DRAFT
by SAFETEA-LU regulations which require Metro Planning Organizations (MPOs) within PDC’s to create and adhere to long range plans. .
Scenarios
Scenarios:
S.2 - Sprawl accelerates
Sprawl acceleration is a common scenario in regions with large cities, such as Richmond. . Forecasts by the region show an overall predicted population increase of 56.5% and a percent change in households of 61.9% as shown by Table 3.
Table 4. Population and Households - Richmond Region (http://www.richmondregional.org/Urban%20Transp-MPO/MPO_Div_Cats/lrtp_files/Chapter_6_August_2008.pdf)
S.10 – In-Migration Increases
Increased urban population accompanies the previous scenario of sprawl acceleration. . Both scenarios may very well happen in conjunction as well as independently. . The Region predicts a 3.4% increase in population for Richmond in 2031. . Figure 29 shows the increased population density forecast for 2031, with high density increases predicted in Richmond with the higher density in darker red and Richmond focused in the rectangle.
DRAFT
Figure 29. . 2031 Predicted Population Density Forecast for Richmond Region (http://www.richmondregional.org/Urban%20Transp-MPO/MPO_Div_Cats/lrtp_files/
Chapter_6_August_2008.pdf)
Workbook analysis
We used the background information and simulated the use of our workbook tool to recommend a prioritization of multimodal transportation policies for Richmond. . Figure 30 shows the weighting of the criteria against the future scenarios for the Richmond region. .
Figure 40. Survey Workbook Criteria Weighting over Scenarios for the Richmond Region
The weighting of the criteria based on the scenarios relevant to Region R.4 – Richmond results in the prioritization of the five policies shown in figure 31. .
DRAFT

The lines extending from the points represent the minimum and maximum scores of the policies using the scenarios S.2 – Sprawl Accelerates and S.10 – In-Migration increases. . Policy P.2 – Support Transit ranked the highest overall, however, the policy score overlapped with Policy P.1 – Invest More in Transportation. . Policy P.4 – Fund Rail scored lower overall than the two other policies; however, the policy maximum scores overlapped the scores of the top two policies. . Policy P.6 – Strengthen Planning and Modeling is the second highest scoring policy and is robust against the two scenarios which may make the policy a higher priority for planners.
Conclusion
Several of the policies evaluated using the workbook tool had similar overall scores but varied with future scenarios. . The variation of the impacts of regional scenarios on statewide policies indicates the significance of scenario-based planning. . The Richmond region contains many similar challenges to Northern Virginia but differs in terms of demographics and geography. . Planning and investment in transportation stand as important policies with the consideration of future scenarios that may affect transportation. .
DRAFT
APPENDIX B: EXAMPLE OF SURVEY AND ANALYSIS OF SCENARIO-BASED PLANNING BEST PRACTICES
Example of Survey Sent to Metropolitan Planning Organizations SENT TO MPO AND PDC
To MPO Directors:
VA Code §2.2-229 and §33.1-23.03 require the Office of Intermodal Planning and Investment to work with regional transportation agencies to develop regional multimodal performance measures and prepare an annual performance report on state and regional efforts. . The Multimodal Planning Office has been working with representatives from the Virginia Association of Planning District Commissions (VAPDC) and transportation agencies to determine appropriate measures for the report, which will be produced as a web-based report by December 2008. The list of measures is included. . Efforts were made to identify measures that are consistent with those identified in the code and for which data are readily available in all regions. . As the report is refined and expanded, other measures may be added. .
In 2006, the Multimodal Planning Office requested information on the goals and performance measures used in your planning process; this information was used to identify measures for the 2006 Performance Report. . So that we can reflect current regional planning efforts, the Multimodal Planning Office is again requesting information on your region’s goals and performance measures. . Additional information is also requested to support other efforts associated with the VTrans Update. . Please complete the attached following questionnaire and e-mail your response to Katherine Graham at [email protected] or fax to 804-225-4785 by July 14th. The responses will be compiled and used to facilitate discussion led by Dr. Mary Lynn Tischer at the Transportation Committee Meeting during the VAPDC Summer Conference in July.
DRAFT
ITC Labs and Classrooms, 08/05/08,
Highlight/point out our questions unless keep in-report reference
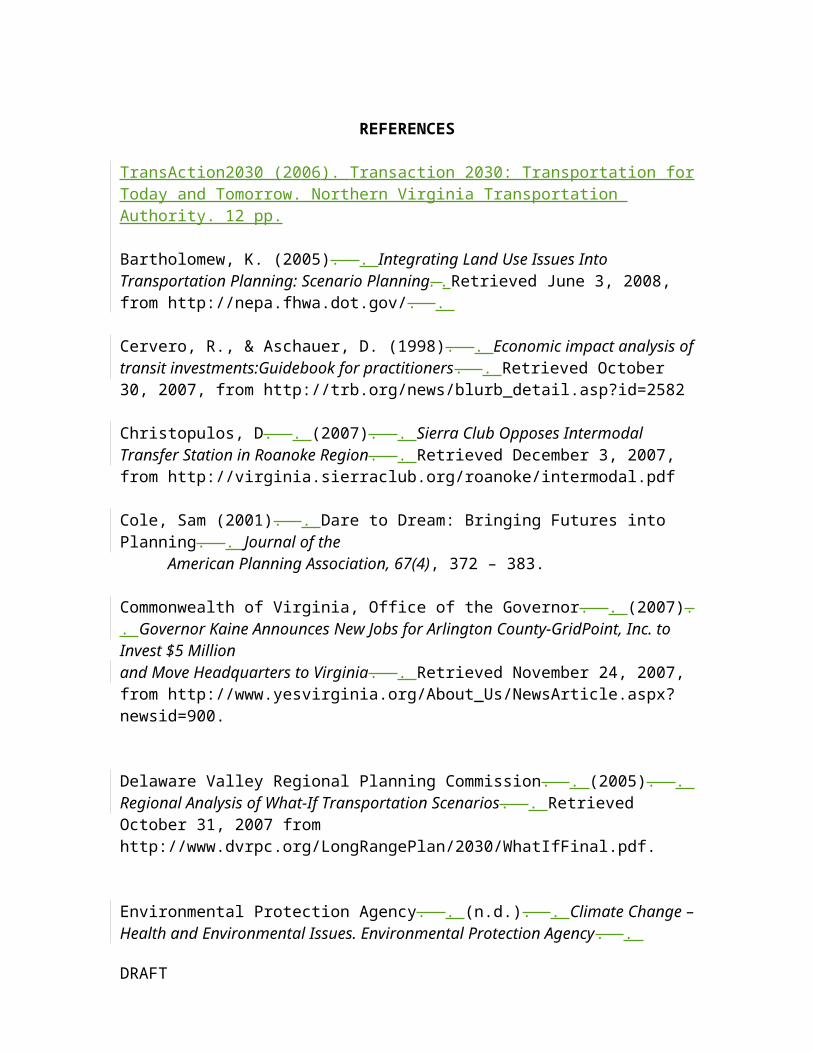
Thank you for your participation. .
Deputy Secretary Ralph DavisIntermodal Office of Planning and Investment
DRAFT
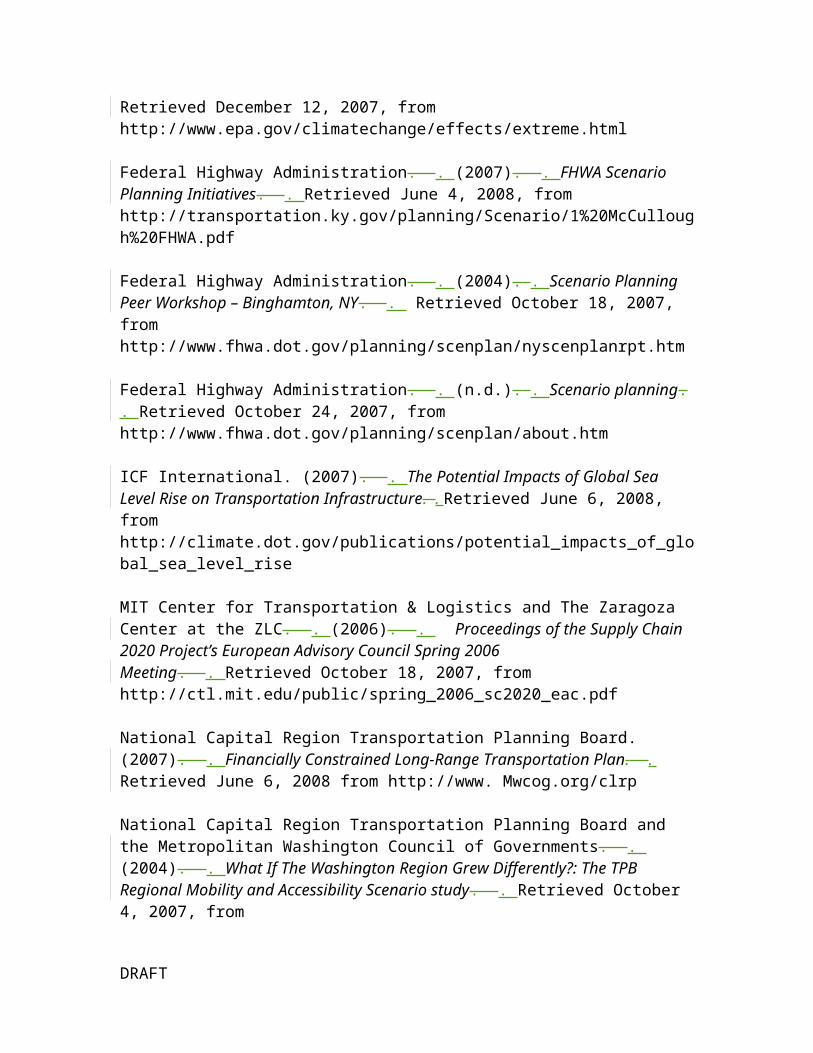
2007 Performance ReportRegional Transportation Indicators, Goals, and Performance
Measures
Transportation Indicators Population Registered Vehicles Licensed Drivers VMT Lane Miles
Safety and Security Deaths Death Rate Crashes Crash Rate
Maintenance and Preservation Pavement Condition Bridge Condition
Mobility, Accessibility, and Connectivity Transit Trips per Capita HOV Usage Congestion
Transportation and Land Use Job/Housing Ratio VMT per Capita
DRAFT
Regional Planning Questionnaire - 2008
Section 1 . . Regional Goals and Performance Measures
1) Has your MPO and/or PDC updated regional transportation goals, objectives or vision since the most recent adopted plan? If yes, please list. . (See Table 1 for our most recent list of goals.)
2) Do you measure the performance of the system relative to your goals? If yes, please list measures.
No
3) What data sources apply? (Choose all that apply.)State Census/Weldon CooperCollect yourself
If collect yourself, what do you collect and how often?
4) If you collect data yourself, in what format is data stored?GISExcel spreadsheetWord documentsAccessOther (Please specify)
DRAFT
Section 2 . . Regional Vision
A major part of the update to the statewide multimodal long-range transportation plan, known as VTrans2035, will be analysis of the Corridors of Statewide Significance (formerly called Multimodal Investment Networks) identified in VTrans2025. . As part of that effort, the Multimodal Planning Office is reviewing regional plans to identify common themes, regional visions and the desired function of each of the corridors. . Please answer the following questions regarding the long-range vision for your region.
1) Which of the following modes does you most recent regional statement of transportation goals, objectives and/or vision specifically address? (Check all that apply.)
BicyclePedestrianTransitAviationFreightRailPortIntermodal Transfer
2) In what way does your regional transportation plan address Corridors of Statewide Significance identified in VTrans2025? For more information on these corridors, look at the VTrans2025 Phase 3 Report at www.vtrans.org. . (Check all that apply.)
VisionGoalsObjectivesStrategiesPoliciesPerformance MeasuresFunded Transportation Improvement ProjectsNon-funded Transportation Improvement Projects
3) Please provide any web links or contact information that would facilitate documenting the above responses.
DRAFT

Section 3 . . Scenario Planning
The University of Virginia is also assisting the Multimodal Planning Office with scenario planning related to the six long-range goals and 21 policy recommendations identified in VTrans2025. . The following questions support that effort.
Describe any experience with scenario-based long-range transportation planning in your region, including any coordination with local, regional, federal agencies or the private sector.
2. Check up to five (5) of the following scenarios that are relevant for scenario-based long-range multimodal transportation planning for your region:
Increased urban populationSprawl accelerationIT amenities growthJobs and households shift
regionallyTransit oriented
developmentRegional economy growsGlobal trade growsEnergy costs riseInfrastructure investment
grows
Increased overall population and automobile usage
Population decreaseDecrease in automobile use and increase in transit use
Increase in overall public transit usage
Energy usage constraintsNatural disasterIncreased retirementOther (Please explain)
DRAFT
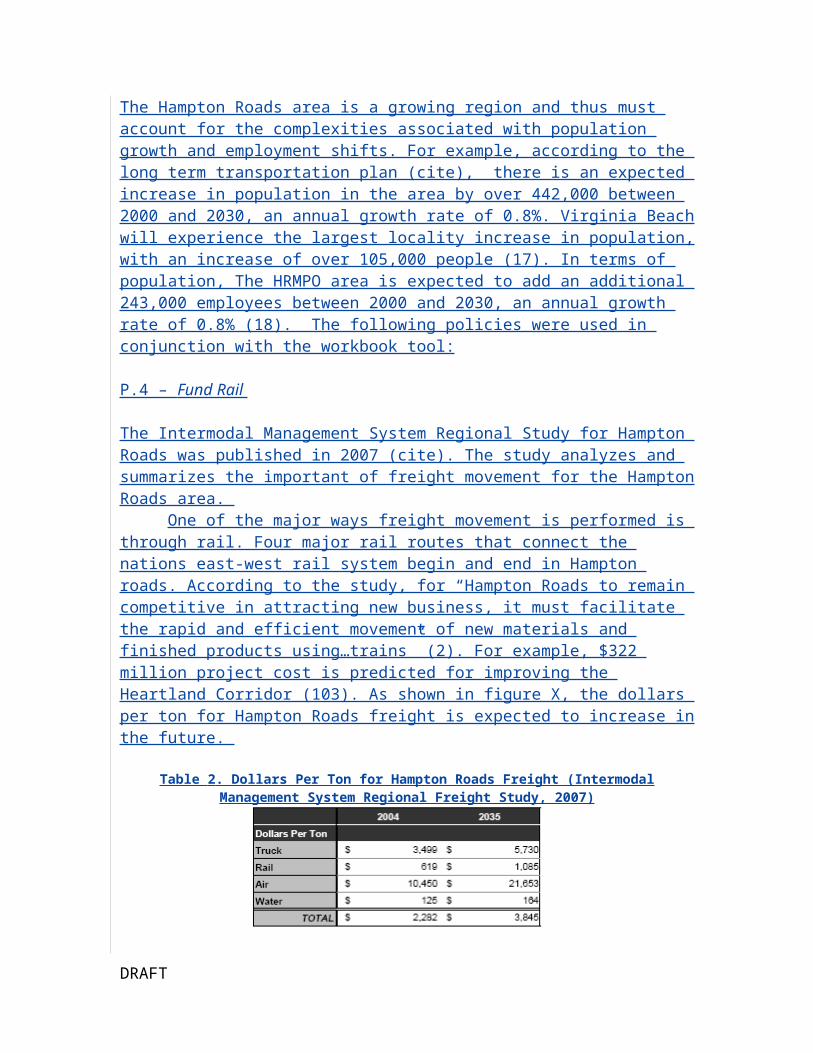
3. Choose one (1) scenario identified above, and using the table below, characterize how the scenario might affect the relative importance of the VTrans planning goals (shown in the first column) for your region.
Scenario: [elaborate if needed]hurricane evacuation using existing Rt. 460
Major Decrease
Minor Decrease
Same Minor Increase
Major Increase
Safety/security Preservation/system managementMobility/accessibilityEconomic vitalityEnvironmental sustainability Fiscal responsibility
4. Check up to five (5) of the following VTrans2025 statewide policies (from the VTrans2025 Phase 3 Final Report at www.vtrans.org ) that are of particular importance to your region:
Increase investment in transportation
Support public transitFund railStrengthen planning and
modelingManage land-use/accessConsider state versus local responsibilities
Address transportation/land use conflicts
Improve multimodal travel connections
Increase multimodal planning emphasis
Invest in technology
Continue public and stakeholder involvement
Provide bicycle and pedestrian facilities
DRAFT
Section 4 . . Contact Information
Name Organization Phone E-mail
Thank you for your participation.
Analysis of Survey
The following PDCs and MPOs responded: George Washington Regional Commission Hampton Roads PDC National Capital Region Region 2000 Blacksburg, Christiansburg, Montgomery Area MPO Roanoke Valley-Alleghany Regional Commission Northern Shenandoah Valley Regional Commission Crater Planning District Commission Lenowisco Planning District Commission Richmond Regional Planning District Commission
We recorded and analyzed the quantifiable results of the survey. To analyze the regional differences in Virginia, we included analysis of the west and east PDCs and MPOs. The west PDCs/MPOs include: Region 2000, Northern Shenandoah Valley Regional Commission, Blacksburg/Christiansburg/Montgomery Area MPO, Roanoke Valley-Alleghany Regional Commission, and Lenowisco Planning District Commission. The east PDCs/MPOs include: Hampton Roads PDC, National Capital Region, Crater Planning District Commission, George Washington Regional Commission, and Richmond Regional Planning District Commission. Figures 14 and 15 show the overall percent relevance of scenarios and policies to the PDCs/MPOs.
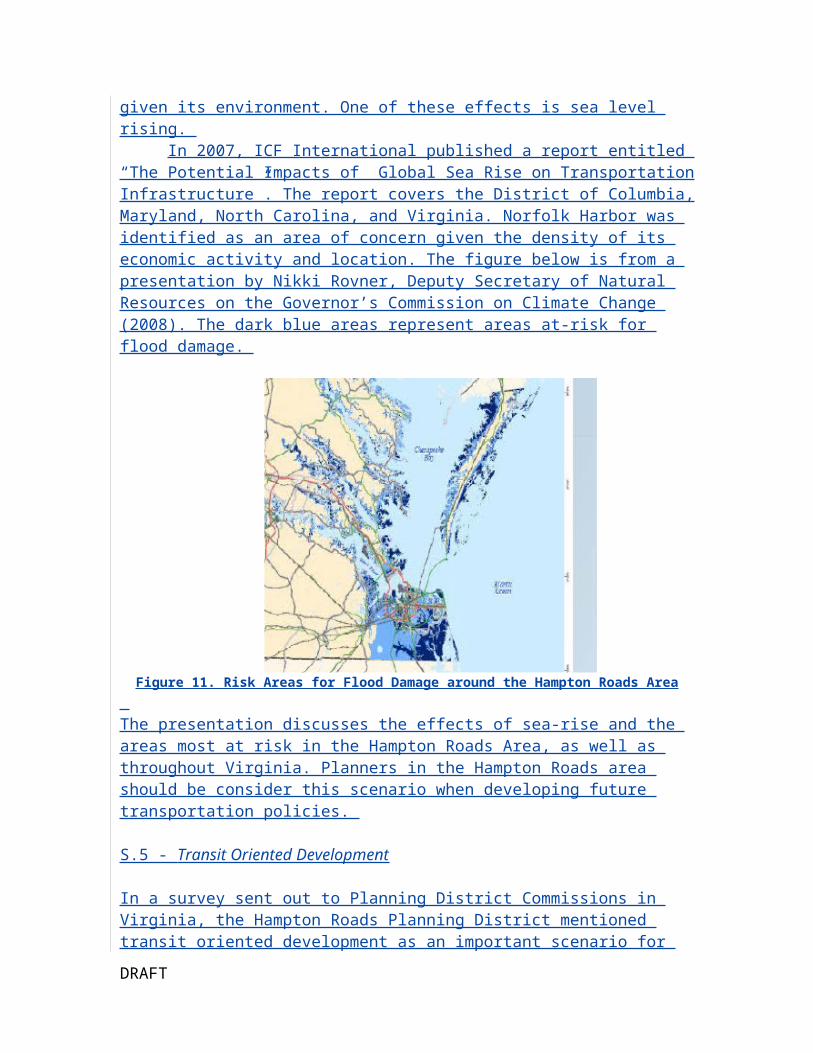
0.00%
20.00%
40.00%
60.00%
80.00%
100.00%
Perc
ent U
se
Figure 14. Overall Relevant Policy Percentage
0%10%20%30%40%50%60%70%80%
Figure 15. Overall Relevant Scenario Percentage
The policies P.23 - Bicycle and Pedestrian Facilities Feeder System, P.1 - Invest more in transportation, and P.2 - Support Transit stand out in the survey as being overall important policies in the commonwealth of Virginia. The scenarios of S.8 - Energy cost rises and S.2 - Sprawl accelerates were found to be important in Virginia with a 70% and 60% use in the PDCs/MPOs surveyed.
71
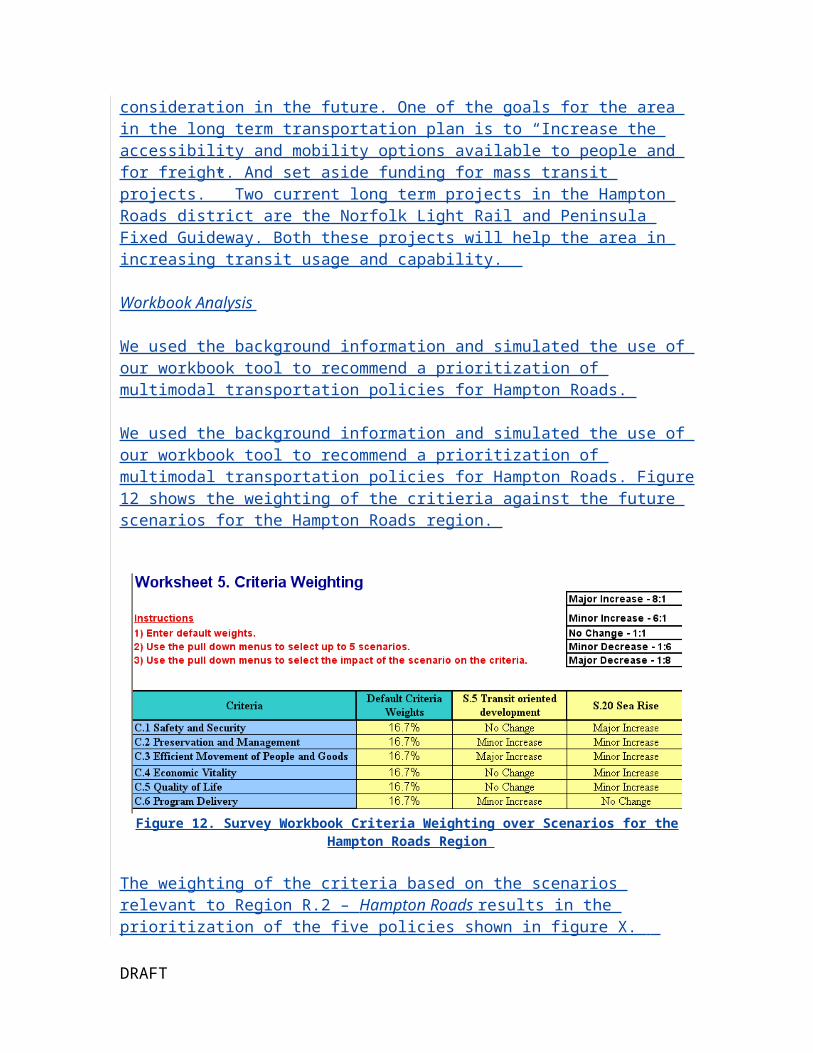
Figures 16 and 17 show the breakdown of relevant policies for the east and the west region.
0.00%
20.00%
40.00%
60.00%
80.00%
100.00%
Increase Invest. In Trans.
Prov. Bicycle and ped. Fac.
Support Pub. Trans
Fund Rail
Consider State v. Local
Address trans/land use conf.
Streng. Plan and Model
Improve multimodal conn.
Contin. Pub. Stake. Invovl.
Manage Land-use
Invest in tech.
Perc
ent U
se
Figure 16. Eastern PDCs/MPOs Policy Importance
0.00%
20.00%
40.00%
60.00%
80.00%
100.00%
Perc
ent U
se
Figure 17. Western PDCs/MPOs Policy Importance
72
ITC Labs and Classrooms, 08/07/08,
Get rid of title
For the eastern PDCs/MPOs, P.1 - Invest more in transportation and P.23 - Bicycle and Pedestrian Facilities Feeder System appear to be important, being picked 100% and 80% respectively. For the western PDCs/MPOs, P.23 - Bicycle and Pedestrian Facilities Feeder System and P.2 - Support Transit are the most important, with 100% and 80% use. In comparing the two areas, the policy P.7 - Manage Access and P.13 - Invest in Technology appear to be more important in the west, whereas increase investment in transit and strengthen planning and modeling is more important in the east.
Figures 18 and 19 show the breakdown of relevant scenarios for the east and west region.
0.00%20.00%40.00%60.00%80.00%
100.00%
Infrastr. Invest. Grows
Energy Costs Rise
Sprawl Accel.
Transit Develop.
Incr. overall public transit
Increased Urban Pop.
Reg. Econ. Grows
Jobs/House Shift
Decr. Use of Autos/In...
Natural Disaster
IT Amenities Grow
Increase Pop./Autos
Global Trade Grows
Increased Retirement
Pop. Decr.
Energy Use Constraints
Figure 18. Eastern PDCs/MPOs Scenario Importance
0.00%20.00%
40.00%60.00%
80.00%100.00%
Figure 19. Western PDCs/MPOs Scenario Importance
73
ITC Labs and Classrooms, 08/07/08,
Get rid of title
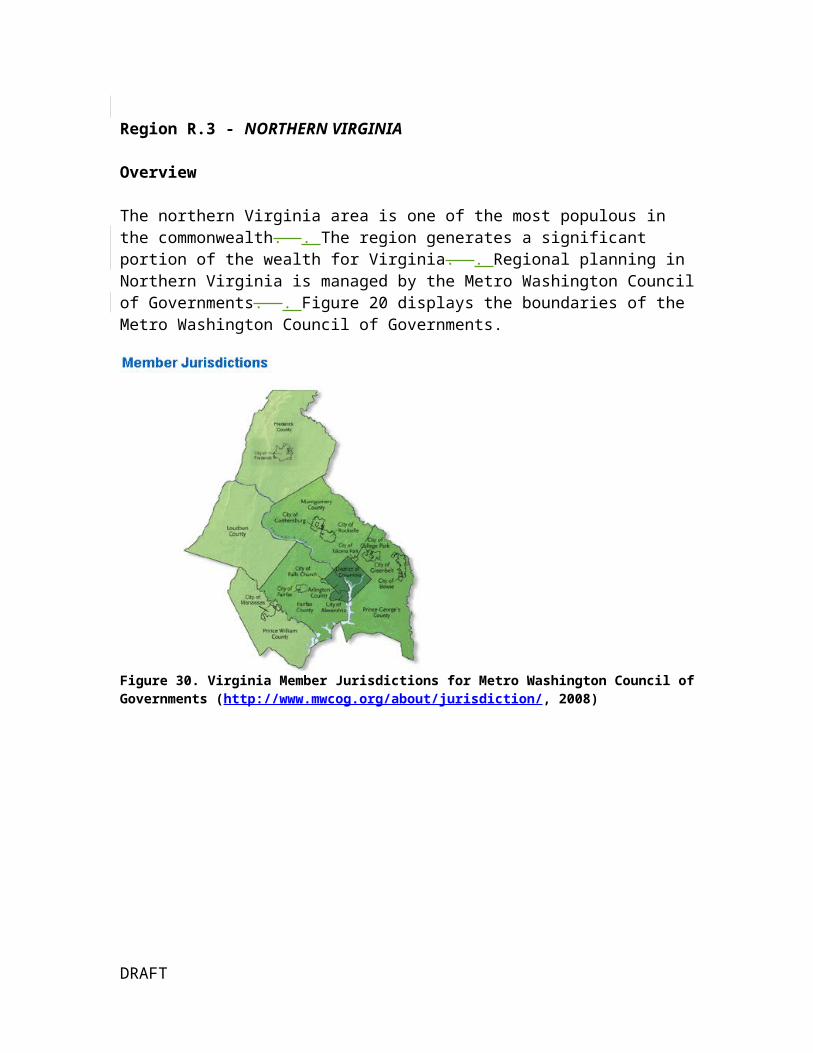
For the eastern PDCs/MPOs the relevant scenarios are S.9 - Infrastructure investment expands, S.8 - Energy cost rises, S.2 - Sprawl accelerates, S.5 - Transit oriented development, and increased overall public transit. In the west, the scenarios of S.8 - Energy cost rises, S.2 - Sprawl accelerates, and S.17 - Retirement are relevant to the PDCs/MPOs. The scenario S.9 - Infrastructure investment expands is much more important in the east than in the west (80% importance vs. 0% importance). The scenario S.17 - Retirement appears to be more important in the west than the east (60% importance vs. 0% importance).
We also recorded and analyzed the questions in the survey considering the effect of scenarios and regional use of scenario-based planning. The results of the scenarios show the regional differences in policy needs and future scenarios. Many regions are using scenario-based planning in a variety of ways. Thus, it is crucial that there is coordination among regions during policy prioritization and long term planning. Standardized scenario-based planning will aid the region in planning coordination.
74
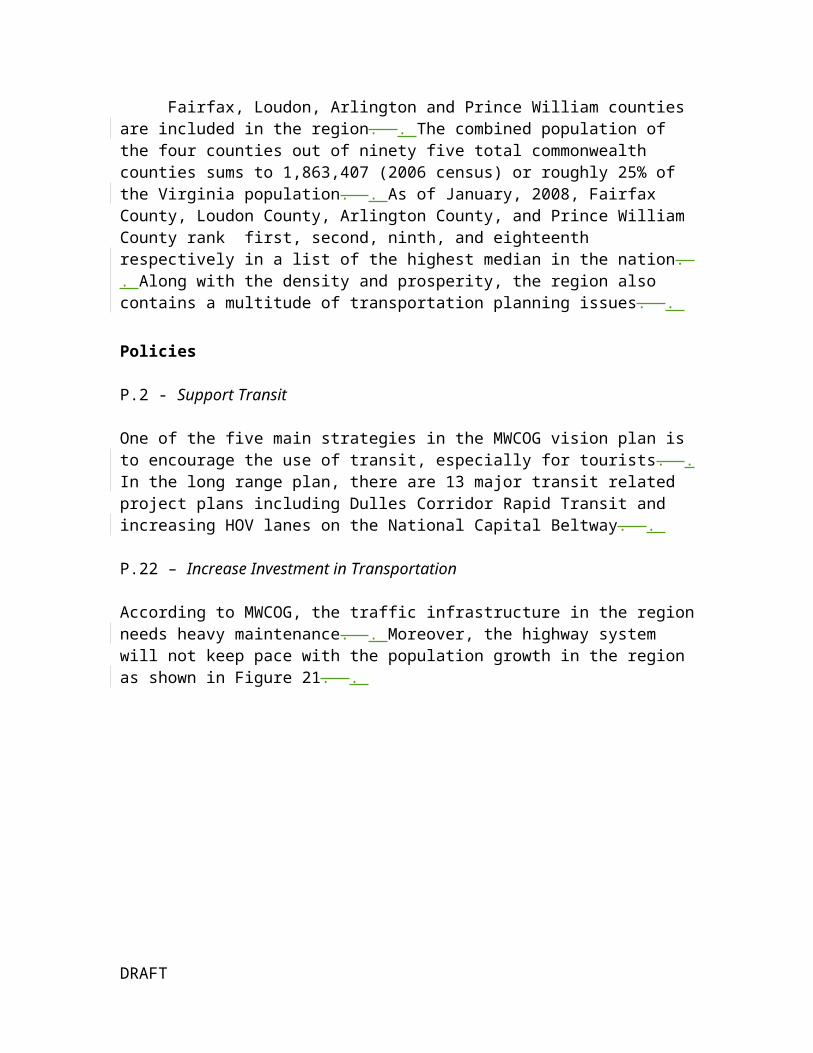
APPENDIX C: ECONOMIC IMPACT PORT STUDY
TO: Dr. Mary Lynn Tischer, Multimodal Office
FROM:
Megan KershAsad SaqibMatthew SchroederWard WilliamsProfessor James Lambert
University of VirginiaCenter for Risk Management of Engineering Systems
DATE: January 28, 2008
SUBJECT: The impacts of increasing output in transportation on final demand/GDP in Virginia
Executive Summary
We analyzed the impacts of transportation investment in Virginia and to overall output and final demand in sixty sectors of the economy. .
For this study, we purchased data from the Bureau of Economic Analysis (http://www.bea.gov/regional/rims/index.cfm). . The data set was released in 2005 and is the most recent data available.
Our observations from Bureau of Economic Analysis data are as follows:
The seven transportation sectors are interconnected with the sixty sectors through the expression x = Ax + c (expressed per year).
o x - total output per year (million dollars)o A - input output matrix for output recycled to each sector [60 x 60]o Ax – recycled output into other sectors per year (dollars) o c - "final demand" output of the economy per year or GDP(dollars)
GDP = consumption + investment + (government spending) + (exports − imports)
Output in Virginia is broken down into 60 sectors for this problem. Of the sixty sectors the total output is $226B Of the sixty sectors, the final demand is $128B The seven transportation sectors are
o Air transportationo Rail transportation
75

o Water transportationo Truck transportationo Transit and ground passenger transportationo Pipeline transportation o Other transportation and support activities
Output for the seven transportation sectors is $7.2B The seven transportation sectors constitute 2.5% of total output Final demand for the seven transportation sectors is $3.2B The seven transportation sectors constitute 3.2% of the final demand This database does not distinguish between public and private investment or
between services and construction.
We found the following in complementary analysis:
Stimulating total output: A 1% increase to transportation output, x, results in a $37M increase to final demand, c, across all sectors
o The 1% increase in transportation output also resulted in over a 1% increase in final demand for all transportation sectors
Stimulating final demand: (say something about graph results)o Mention difference between stimulating demand and increasing output
76
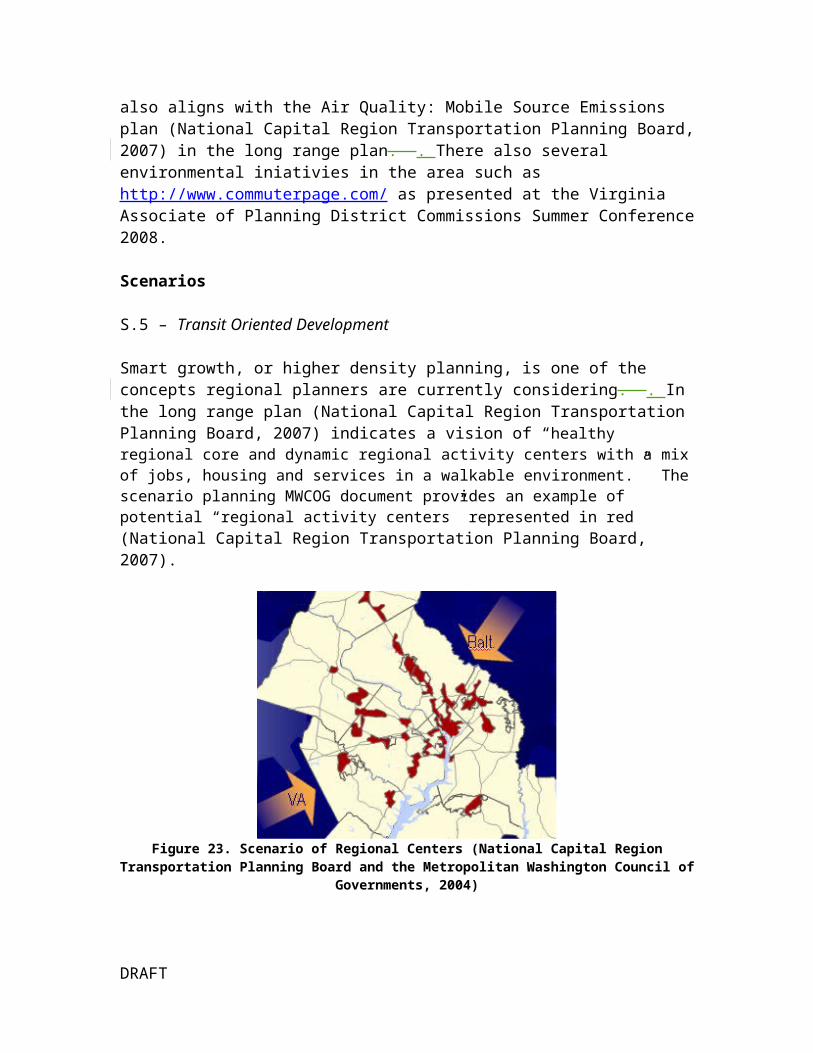
Results of Increasing Transportation Output
We analyzed the results of increasing transportation output by raising transportation output in all the transportation sectors by 1%. . Table 4 provides the sectors and increased output in millions of dollars. .
Table 5 - Transportation sector increase in output
SectorSector ouput ($ millions)
Increase in sector output ($ millions)
Air transportation 1801.7 18.0Rail transportation 699.3 7.0Water transportation 292.0 2.9Truck transportation 2538.1 25.4Transit and ground passenger transportation* 344.1 3.4Pipeline transportation 80.0 0.8Other transportation and support activities* 1443.3 14.4
Using the formula x= Ax + c, new c values (output or final demand) values were calculated. . Figure 32 displays the increased output for the respective transportations sectors.
0
5
10
15
20
25
30
millions
Figure 32 – Increase in output for transportation sectors given 1% increase in output
The total output increase for all transportation sectors is 64 millions dollars. . The total output increase for all sectors in Virginia is 37 million dollars. . The difference between
77
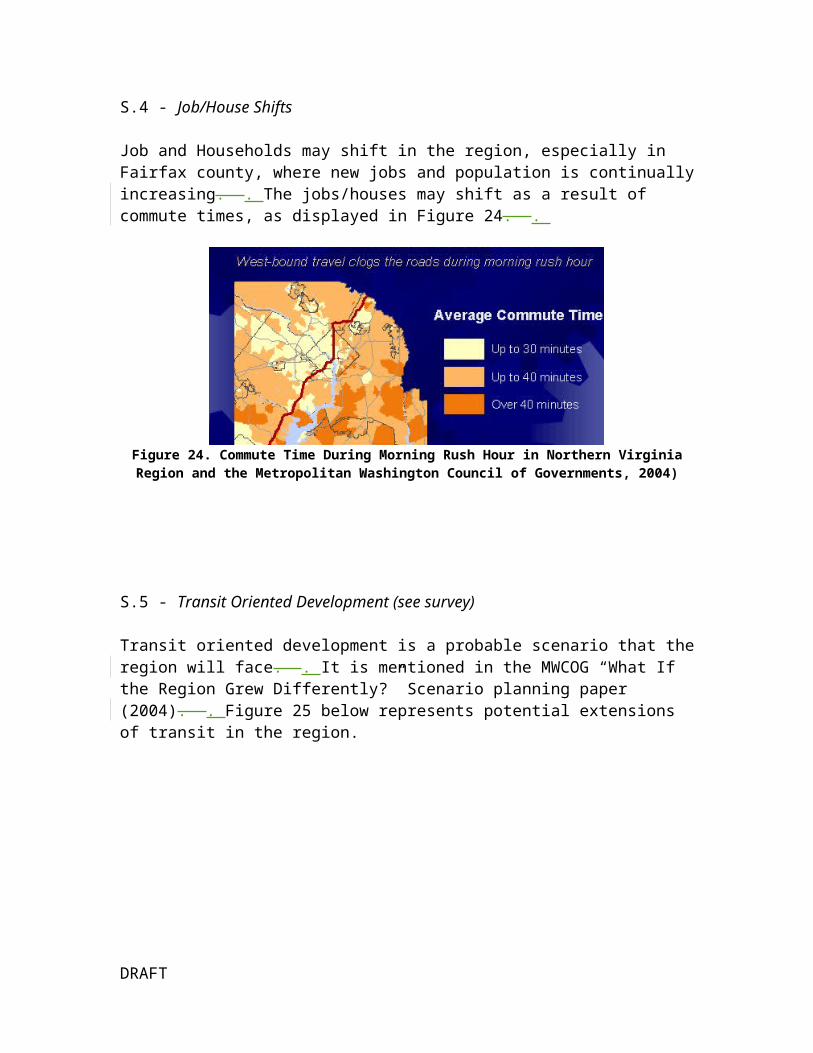
the transportation sector gains and overall gains is due to increased transportation output absorbing output from other sectors. . It is important to note that there is still a strong overall increase in output overall when increasing output for transportation by 1%. . Results from Stimulating Final Demand
We use the formula x = Ax + c to exchange the desired unknown c value with x. After manipulating the formula we obtain c(I-A)-1 = x.
When stimulating demand, we found that output for all sectors increases, in contrast to the first approach, which was increasing output for specific sectors. . Figure 33 shows the ten sectors with greatest percentage increase in output based on a 1% increase in final demand in the transportation sectors. .
0.00%0.50%1.00%1.50%2.00%2.50%3.00%3.50%
Figure 33 – Percent increase in output per 1% increase in final demand for transportation sectors
These following issues should be considered when deciding whether to increase output or attempt to stimulate demand:
Ease of stimulating demand in a sector compared to ability to increase output for a sector
o Stimulating final demand for transportation sectors by 1% results in a 3% increase in petroleum and coal manufacturing output, however, it must be considered if this output is feasible
Need to increase output for many sectorso Stimulating demand has a greater overall positive effect in increasing
output over a variety of sectors Specific sectors that currently may be in higher demand or have a higher ability
for production/output
78
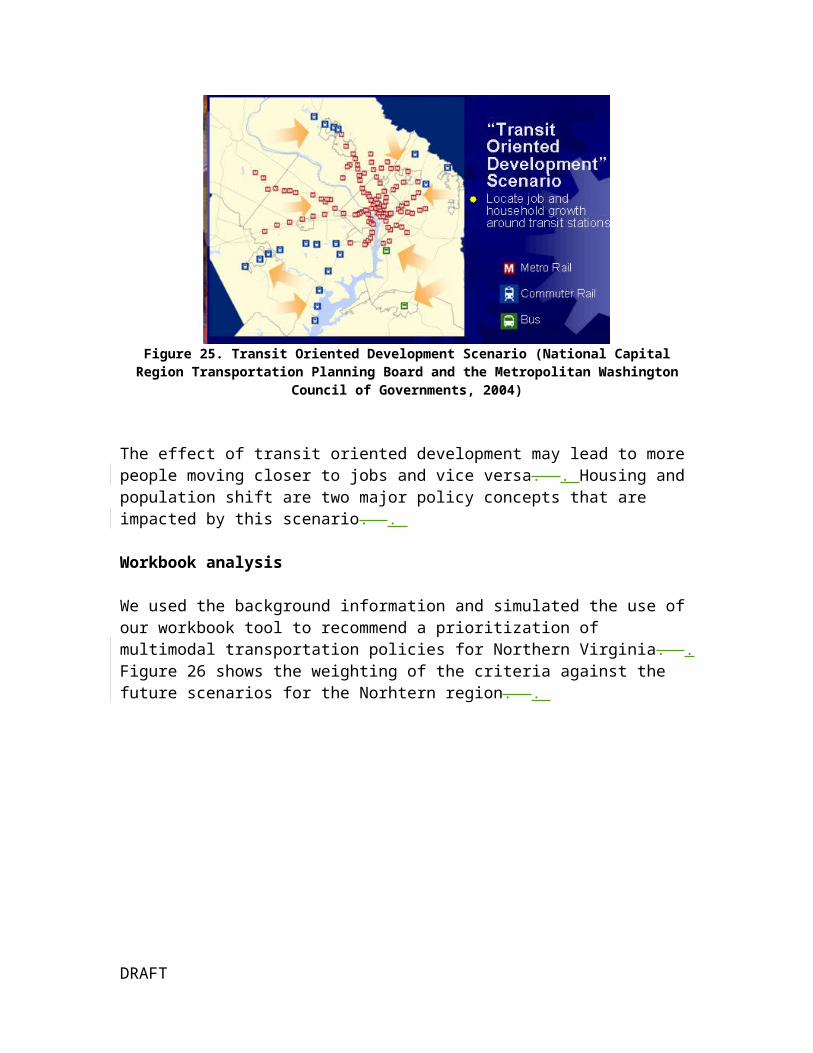
o For example, rail as a form of public transportation has become more popular in past years, thus making it easier to stimulate demand for the sector
(Appendice within appendice)Results from increasing output across all manufacturing sectors
For comparison, we increased all manufacturing sector output values by 1% as described in Table 5. .
Table 6 – Manufacturing sector increase in output
SectorSector ouput ($ millions)
Increase in sector output ($ millions)
Wood product manufacturing 1805.2 18.1Nonmetallic mineral product manufacturing 910.5 9.1Primary metal manufacturing 753.3 7.5Fabricated metal product manufacturing 1642.4 16.4Machinery manufacturing 1774.7 17.7Computer and electronic product manufacturing 2500.6 25.0Electrical equipment and appliance manufacturing 749.1 7.5Motor vehicle, body, trailer, and parts manufacturing 1562.2 15.6Other transportation equipment manufacturing 2916.9 29.2Furniture and related product manufacturing 1424.0 14.2Miscellaneous manufacturing 674.6 6.7Food, beverage, and tobacco product manufacturing 5960.6 59.6Textile and textile product mills 1585.6 15.9Apparel, leather, and allied product manufacturing 378.4 3.8Paper manufacturing 2006.4 20.1Printing and related support activities 1482.3 14.8Petroleum and coal products manufacturing 127.7 1.3Chemical manufacturing 2238.5 22.4Plastics and rubber products manufacturing 2083.7 20.8
Table 6 provides output increases for the manufacturing sector compared to the transportation output increases.
Table 7 - Comparison of transportation and manufacturing increased output results
Agglomerated Sector
Change in final demand for transportation sectors per one unit change in output
Change in final demand for all sectors per one unit change in output
Transportation 0.89 0.52
79
ITC Labs and Classrooms, 08/05/08,
What to do with this?
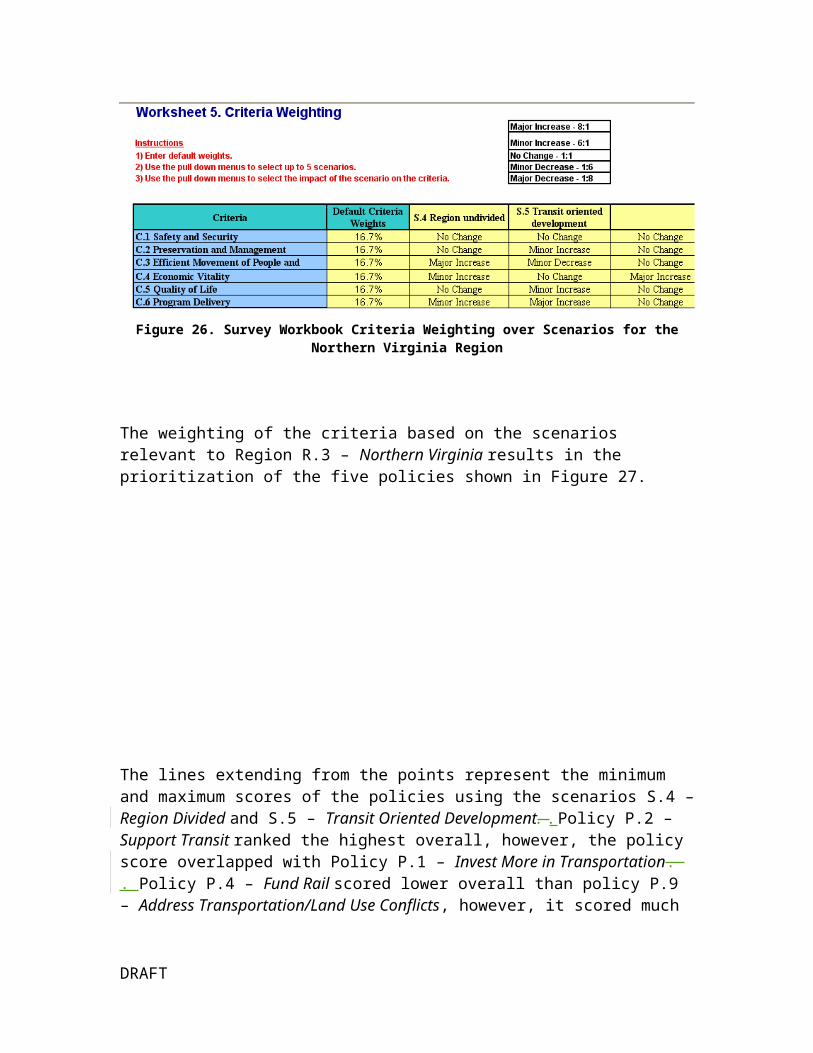
Manufacturing 0.66 0.37
The first column represents the increased final demand for the respective agglomerated sector per one unit change in output for the agglomerated sector. . Another interpretation for the first column is an increase in final demand per $1 increased output in the agglomerated sector. . The second column represents the sum of increased final demand for all sixty sectors per one unit output increase for the agglomerated sector. . We found that the transportation sector produces more final demand per increased output than manufacturing, or in other words, requires less output increase to produce a comparable level of final demand. .
To justify the one percent increase in output, we calculated the resulting change in output. . The output change is displayed in Table 7.
Table 7 - Percent Increase of Output for Transportation Sectors
SectorPercent change
Air transportation 1.6%Rail transportation 1.7%
Water transportation 1.2%Truck transportation 2.2%
Transit and ground passenger transportation* 1.5%Pipeline transportation 1.1%
Other transportation and support activities* 3.1%
Every percent increase is above 1%, the amount of increase in output. . In the manufacturing sector, five industries had less than 1% return. .
Based on the data analysis above, it is predicted that increasing output in the transportation sector will result in a beneficial output. . Further analysis may be done to focus on which transportation sectors provide the best output per increased output and how other sector’s increased outputs compare to transportation.
80
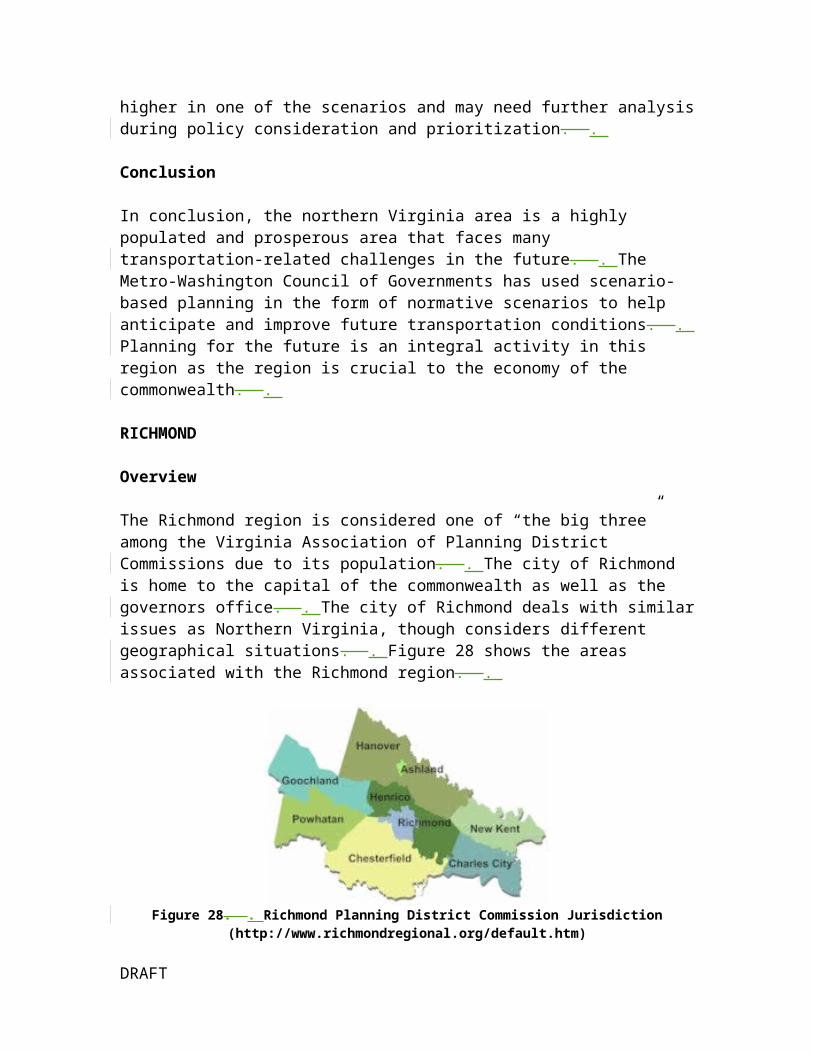
Figure 34 – Input/Output sector output (A matrix)
Table 8 - Sector Output (x)Sector Codes Sector Description Sector ouput
($ millions)CROP Crop and animal production 920FRST Forestry, fishing, and related activities 581OILG Oil and gas extraction 492MING Mining, except oil and gas 811MINS Support activities for mining 82UTIL Utilities* 1,907CNST Construction 19,147WOOD Wood product manufacturing 1,805NMET Nonmetallic mineral product manufacturing 910PMET Primary metal manufacturing 753FMET Fabricated metal product manufacturing 1,642MACH Machinery manufacturing 1,775COMP Computer and electronic product manufacturing 2,501ELEC Electrical equipment and appliance manufacturing 749MOTR Motor vehicle, body, trailer, and parts manufacturing 1,562TREQ Other transportation equipment manufacturing 2,917FURN Furniture and related product manufacturing 1,424MFGM Miscellaneous manufacturing 675FOOD Food, beverage, and tobacco product manufacturing 5,961TEXT Textile and textile product mills 1,586
81
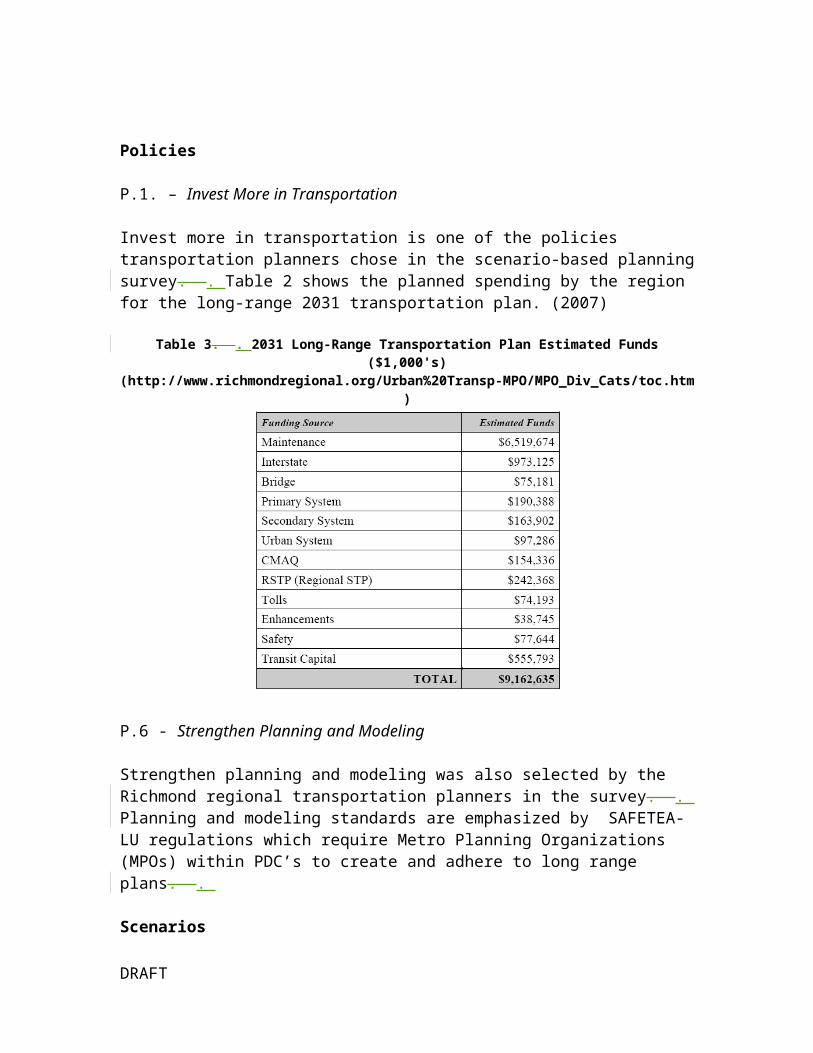
APPR Apparel, leather, and allied product manufacturing 378PAPR Paper manufacturing 2,006PRNT Printing and related support activities 1,482PETR Petroleum and coal products manufacturing 128CHEM Chemical manufacturing 2,239PLAS Plastics and rubber products manufacturing 2,084WTRD Wholesale trade 9,557RTRD Retail trade 16,126AIRT Air transportation 1,802RAIL Rail transportation 699WATR Water transportation 292TRCK Truck transportation 2,538GRND Transit and ground passenger transportation* 344PIPE Pipeline transportation 80TRNM Other transportation and support activities* 1,443WRHS Warehousing and storage 754PUBL Publishing including software 3,557MPIC Motion picture and sound recording industries 250BRDC Broadcasting and telecommunications 7,846INFO Information and data processing services 4,382BANK Federal Reserve banks, credit intermediation and related services 6,102SECU Securities, commodity contracts, investments 1,947INSR Insurance carriers and related activities 4,350FUND Funds, trusts, and other financial vehicles 873REAL Real estate 5,566RENT Rental and leasing services and lessors of intangible assets 1,792PROF Professional, scientific, and technical services 39,096MNGT Management of companies and enterprises 8,697ADMI Administrative and support services 8,481WSTE Waste management and remediation services 492EDUC Educational services 3,080HLTH Ambulatory health care services 9,515HOSP Hospitals and nursing and residential care facilities 8,373SOCL Social assistance 1,747PERF Performing arts, museums, and related activities 852AMST Amusements, gambling, and recreation 958ACCO Accommodation 1,541FSRV Food services and drinking places 6,372OTHR Other services* 9,611
60 Households
82
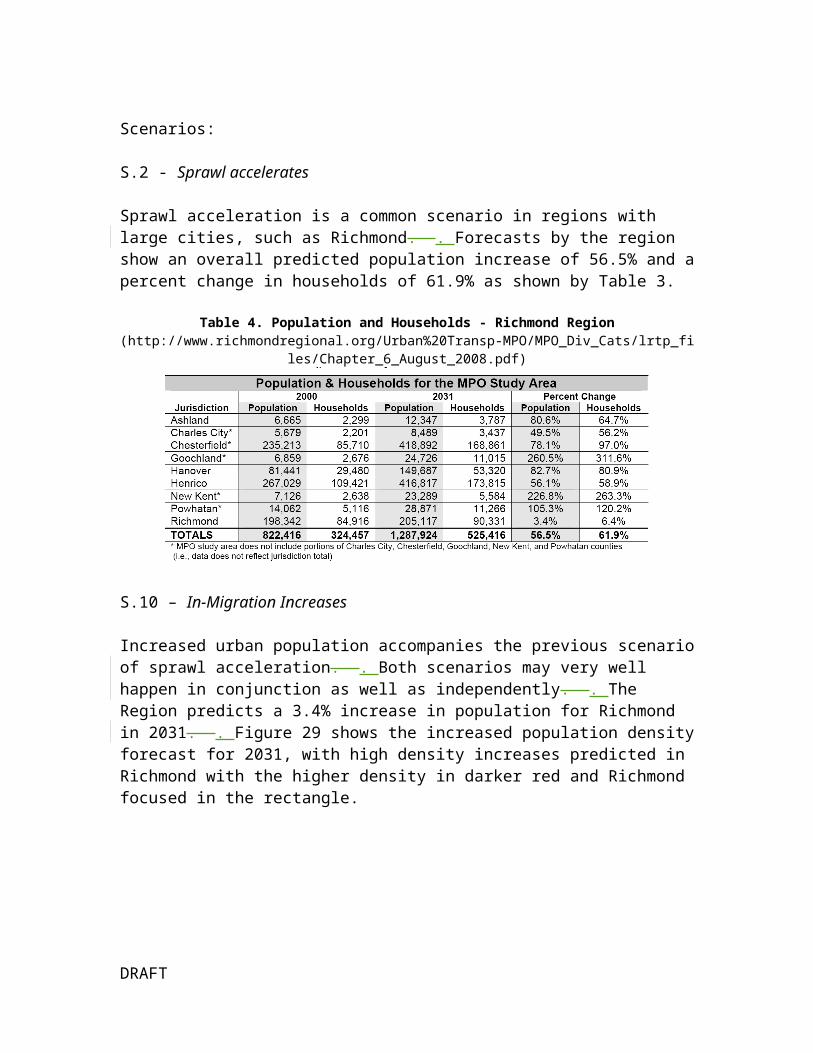
APPENDIX D: DRAFT OF POTENTIAL MPO SURVEY
We also created a draft of a survey that transportation planners can fill out to help identify scenario-based planning in the MPO’s. . The preliminary survey is shown below. .
Survey
Survey Tool Draft:Survey Tool – Scenarios - Example
Given the following criteria –
C.1 Safety and SecurityC.2 Preservation and ManagementC.3 Efficient Movement of People and GoodsC.4 Economic VitalityC.5 Quality of LifeC.6 Program Delivery
What kind of impact would these scenarios on your area? (please highlight your choice)
S.2 – Sprawl Accelerates
C.1 Safety and Security (Significant Impact) (Moderate Impact) (None or Unknown Impact)
C.2 Preservation and Management (Significant Impact) (Moderate Impact) (None or Unknown Impact)
C.3 Efficient Movement of People and Goods (Significant Impact) (Moderate Impact) (None or Unknown Impact)
C.4 Economic Vitality (Significant Impact) (Moderate Impact) (None or Unknown Impact)
C.5 Quality of Life (Significant Impact) (Moderate Impact) (None or Unknown Impact)
C.6 Program Delivery (Significant Impact) (Moderate Impact) (None or Unknown Impact)
S.17 – Retirement
C.1 Safety and Security (Significant Impact) (Moderate Impact) (None or Unknown Impact)
83
C.2 Preservation and Management (Significant Impact) (Moderate Impact) (None or Unknown Impact)
C.3 Efficient Movement of People and Goods (Significant Impact) (Moderate Impact) (None or Unknown Impact)
C.4 Economic Vitality (Significant Impact) (Moderate Impact) (None or Unknown Impact)
C.5 Quality of Life (Significant Impact) (Moderate Impact) (None or Unknown Impact)
C.6 Program Delivery (Significant Impact) (Moderate Impact) (None or Unknown Impact)
S.18 – Natural Disaster
C.1 Safety and Security (Significant Impact) (Moderate Impact) (None or Unknown Impact)
C.2 Preservation and Management (Significant Impact) (Moderate Impact) (None or Unknown Impact)
C.3 Efficient Movement of People and Goods (Significant Impact) (Moderate Impact) (None or Unknown Impact)
C.4 Economic Vitality (Significant Impact) (Moderate Impact) (None or Unknown Impact)
C.5 Quality of Life (Significant Impact) (Moderate Impact) (None or Unknown Impact)
C.6 Program Delivery (Significant Impact) (Moderate Impact) (None or Unknown Impact)
S.3 – IT Amenities Grow
C.1 Safety and Security (Significant Impact) (Moderate Impact) (None or Unknown Impact)
C.2 Preservation and Management (Significant Impact) (Moderate Impact) (None or Unknown Impact)
C.3 Efficient Movement of People and Goods
84
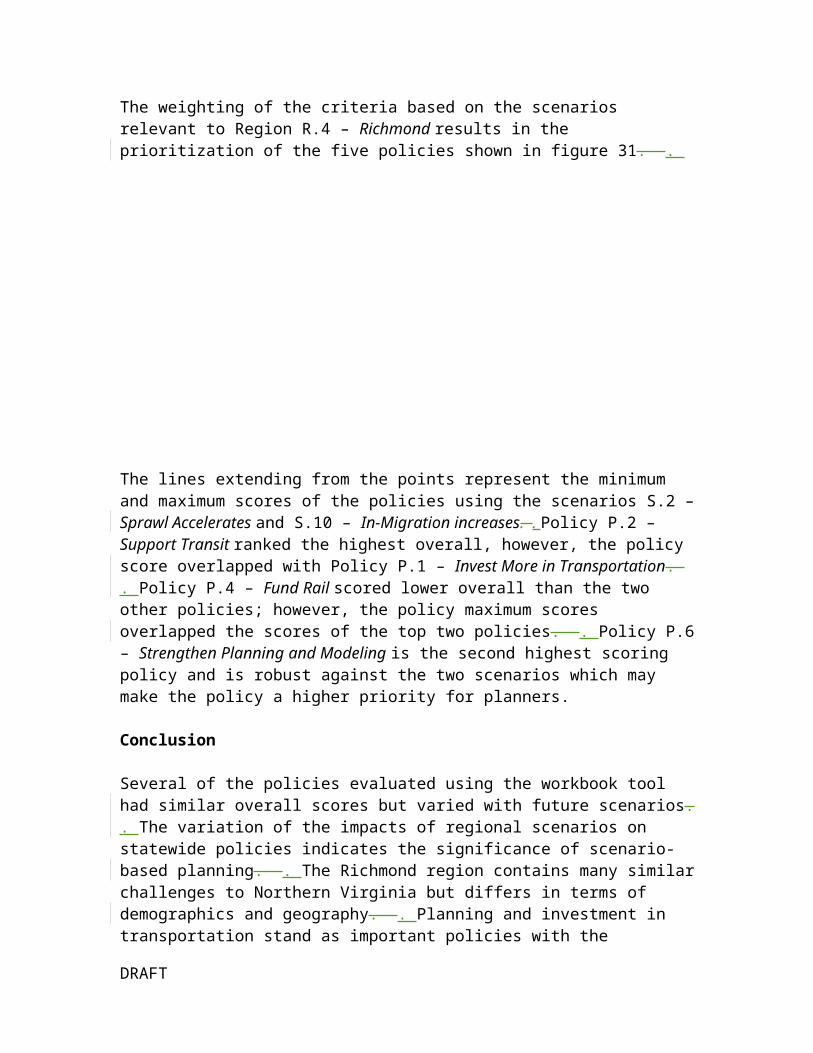
(Significant Impact) (Moderate Impact) (None or Unknown Impact)
C.4 Economic Vitality (Significant Impact) (Moderate Impact) (None or Unknown Impact)
C.5 Quality of Life (Significant Impact) (Moderate Impact) (None or Unknown Impact)
C.6 Program Delivery (Significant Impact) (Moderate Impact) (None or Unknown Impact)
S.19 – Decrease in Air Quality
C.1 Safety and Security (Significant Impact) (Moderate Impact) (None or Unknown Impact)
C.2 Preservation and Management (Significant Impact) (Moderate Impact) (None or Unknown Impact)
C.3 Efficient Movement of People and Goods (Significant Impact) (Moderate Impact) (None or Unknown Impact)
C.4 Economic Vitality (Significant Impact) (Moderate Impact) (None or Unknown Impact)
C.5 Quality of Life (Significant Impact) (Moderate Impact) (None or Unknown Impact)
C.6 Program Delivery (Significant Impact) (Moderate Impact) (None or Unknown Impact)
85
APPENDIX E: PRELIMINARY MPO SURVEY
We surveyed the regional MPO’s to analyze how they use scenario based planning in their transportation planning. . Some MPO’s used scenarios directly, and others used scenario-based planning indirectly. . Table 9 below shows the result of the MPO survey. .
Table 9. Results of user MPO surveyMPO Use of Scenarios in
Planning1. Blacksburg-Christiansburg-Montgomery Area (BCM)
Some
2. Central Virginia Some3. Danville Little4 Charlottesville-Albemarle Complete-direct5. Richmond Area MPO Some6. Roanoke Valley Area MPO*
Complete-direct
7. Tri-Cities Area MPO Some8. Fredericksburg Area MPO
Some
9. Hampton Roads PDC Little10. Harrisonburg-Rockingham MPO
Little
11. West Piedmont PDC (Danville MPO)
Little
12. Winchester-Frederick MPO
Little
We observed that smaller MPOs have less evidence of use of scenario-based planning, whereas larger MPO’s tend to use scenarios either directly or indirectly in planning. . Figure 34 displays an excerpt of a workbook that keeps track of the types of scenarios for MPO’s. .
86
ITC Labs and Classrooms, 08/05/08,
Either cut down to just one page and last appendice or get rid of
Figure 34. . Excerpt from spreadsheet of MPO scenario usage
87