Matteson watch your cash
38
Watch Your Cash Gary Matteson, Farm Credit Council
-
Upload
dghagenmaier -
Category
Documents
-
view
146 -
download
2
Transcript of Matteson watch your cash

Watch Your Cash
Gary Matteson, Farm Credit Council

Looking to the Future
• What are your skills? • What is your tolerance for risk? • What is your capacity to deal with
ambiguity? • What is your capacity to lead others? • What is your capacity for self-discipline?

What is your capacity to gather information?

define success
acres gross sales tractors yield/acre cows net profit

define success
enough net profit to meet your goals for your family and your business

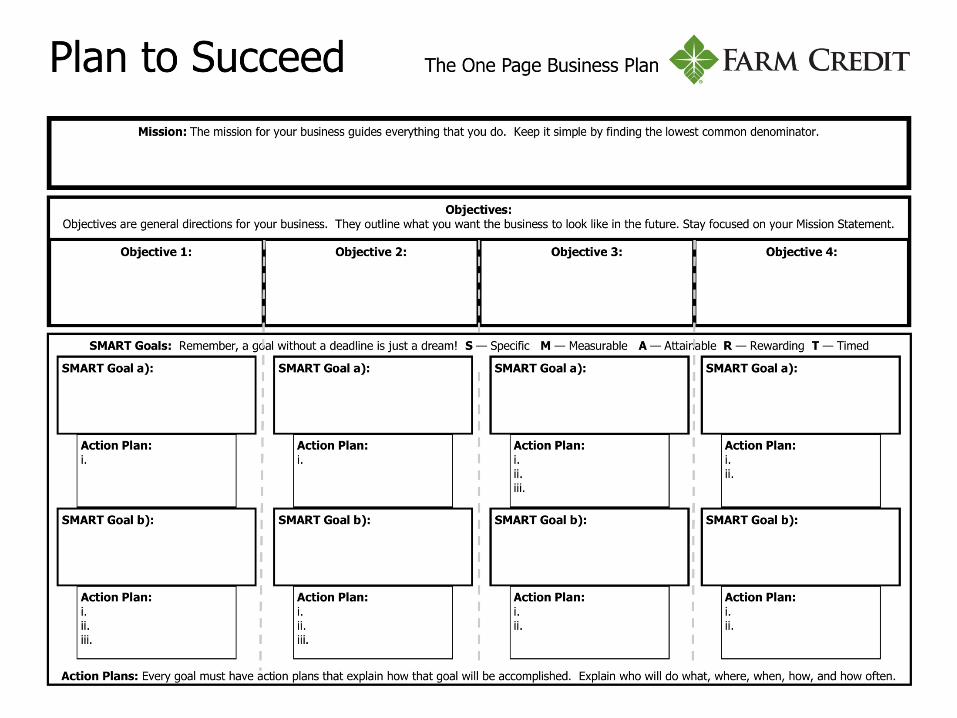
• Plan to succeed, plan to be happy • Tell your story in a business plan • A budget is a plan in numbers • Plan for contingencies
know your business


Historical Dollars % of Sales
Sales (total income) $367,200 100%
- Cost of Goods Sold: (variable costs)
$312,600 85%
= Gross Margin: $54,600 15%
- Overhead(fixed costs) $7,800 2%
= Profit (Net Margin) $46,800 13%
The 5-Line Income Statement

This 5-Line Income Statement
Becomes the basis of this Cash Flow Analysis Spreadsheet
Showing Annual Business Results Historical Dollars % of Sales
Sales (total income) $367,200 100%
- Cost of Goods Sold: (variable costs)
$312,600 85%
= Gross Margin: $54,600 15%
- Overhead(fixed costs) $7,800 2%
= Profit (Net Margin) $46,800 13%

The Concept of Cash Flow Budgeting

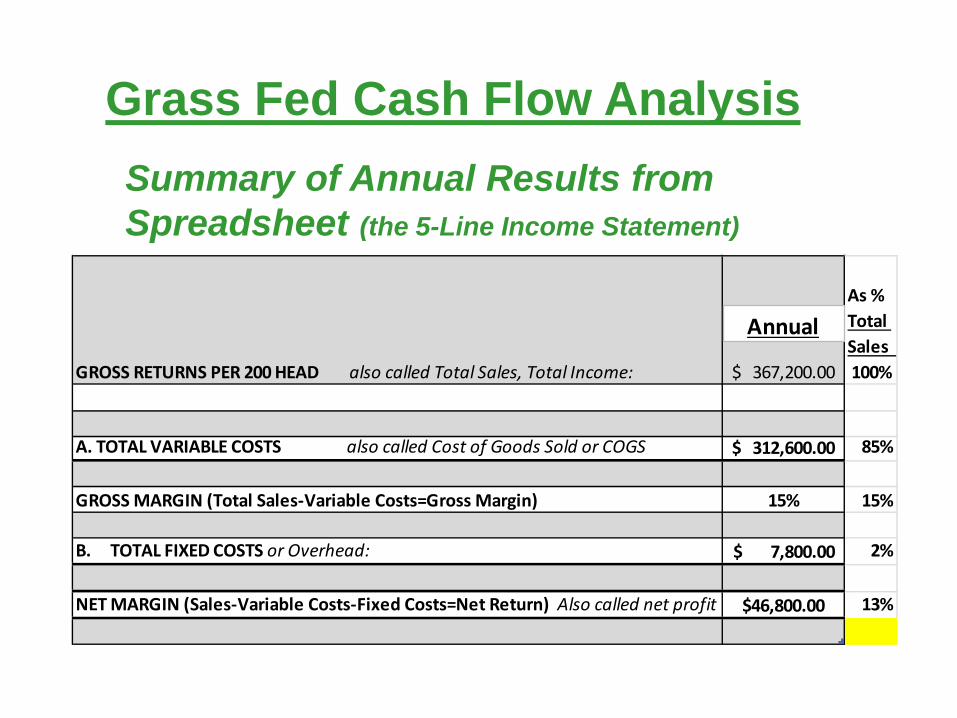
GROSS RETURNS PER 200 HEAD also called Total Sales, Total Income: 367,200.00$
As % Total Sales 100%
A. TOTAL VARIABLE COSTS also called Cost of Goods Sold or COGS 312,600.00$ 85%
GROSS MARGIN (Total Sales-Variable Costs=Gross Margin) 15% 15%
B. TOTAL FIXED COSTS or Overhead: 7,800.00$ 2%
NET MARGIN (Sales-Variable Costs-Fixed Costs=Net Return) Also called net profit $46,800.00 13%
Annual
Grass Fed Cash Flow Analysis Summary of Annual Results from Spreadsheet (the 5-Line Income Statement)
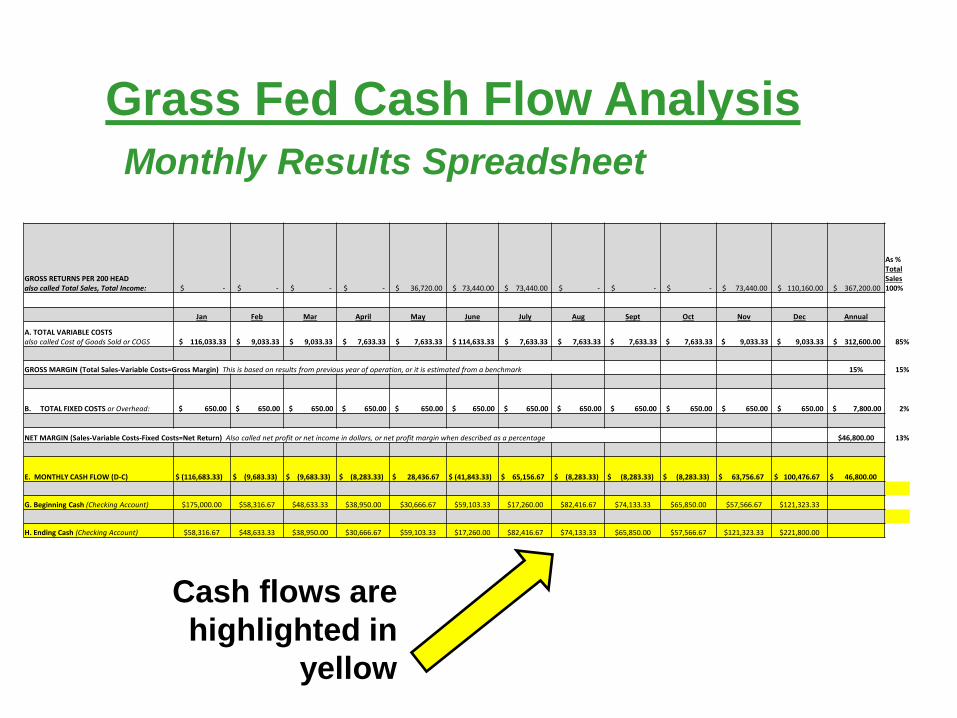
GROSS RETURNS PER 200 HEAD also called Total Sales, Total Income: $ - $ - $ - $ - $ 36,720.00 $ 73,440.00 $ 73,440.00 $ - $ - $ - $ 73,440.00 $ 110,160.00 $ 367,200.00
As % Total Sales 100%
Jan Feb Mar April May June July Aug Sept Oct Nov Dec Annual
A. TOTAL VARIABLE COSTS also called Cost of Goods Sold or COGS $ 116,033.33 $ 9,033.33 $ 9,033.33 $ 7,633.33 $ 7,633.33 $ 114,633.33 $ 7,633.33 $ 7,633.33 $ 7,633.33 $ 7,633.33 $ 9,033.33 $ 9,033.33 $ 312,600.00 85%
GROSS MARGIN (Total Sales-Variable Costs=Gross Margin) This is based on results from previous year of operation, or it is estimated from a benchmark 15% 15%
B. TOTAL FIXED COSTS or Overhead: $ 650.00 $ 650.00 $ 650.00 $ 650.00 $ 650.00 $ 650.00 $ 650.00 $ 650.00 $ 650.00 $ 650.00 $ 650.00 $ 650.00 $ 7,800.00 2%
NET MARGIN (Sales-Variable Costs-Fixed Costs=Net Return) Also called net profit or net income in dollars, or net profit margin when described as a percentage $46,800.00 13%
E. MONTHLY CASH FLOW (D-C) $ (116,683.33) $ (9,683.33) $ (9,683.33) $ (8,283.33) $ 28,436.67 $ (41,843.33) $ 65,156.67 $ (8,283.33) $ (8,283.33) $ (8,283.33) $ 63,756.67 $ 100,476.67 $ 46,800.00
G. Beginning Cash (Checking Account) $175,000.00 $58,316.67 $48,633.33 $38,950.00 $30,666.67 $59,103.33 $17,260.00 $82,416.67 $74,133.33 $65,850.00 $57,566.67 $121,323.33
H. Ending Cash (Checking Account) $58,316.67 $48,633.33 $38,950.00 $30,666.67 $59,103.33 $17,260.00 $82,416.67 $74,133.33 $65,850.00 $57,566.67 $121,323.33 $221,800.00
Grass Fed Cash Flow Analysis Monthly Results Spreadsheet
Cash flows are highlighted in
yellow

GROSS RETURNS PER 200 HEAD also called Total Sales, Total Income: -$ -$ -$ -$ 36,720.00$ 73,440.00$ 73,440.00$ -$ -$ -$ 73,440.00$ 110,160.00$ 367,200.00$
As % Total Sales 100%
VARIABLE COSTS PER 200 HEAD:Jan Feb Mar April May June July Aug Sept Oct Nov Dec Annual
Purchase Price 105,000.00$ 105,000.00$ 210,000.00$ Transport 2,000.00$ 2,000.00$ 4,000.00$
Summer Pasture 4,800.00$ 4,800.00$ 4,800.00$ 4,800.00$ 4,800.00$ 4,800.00$ 4,800.00$ 33,600.00$ Winter Hay - Forage 6,200.00$ 6,200.00$ 6,200.00$ 6,200.00$ 6,200.00$ 31,000.00$
Other Feed 500.00$ 500.00$ 500.00$ 500.00$ 500.00$ 500.00$ 500.00$ 500.00$ 500.00$ 500.00$ 500.00$ 500.00$ 6,000.00$ Protein & Mineral 333.33$ 333.33$ 333.33$ 333.33$ 333.33$ 333.33$ 333.33$ 333.33$ 333.33$ 333.33$ 333.33$ 333.33$ 4,000.00$
Hired Labor 333.33$ 333.33$ 333.33$ 333.33$ 333.33$ 333.33$ 333.33$ 333.33$ 333.33$ 333.33$ 333.33$ 333.33$ 4,000.00$ Veterinary & Supplies 250.00$ 250.00$ 250.00$ 250.00$ 250.00$ 250.00$ 250.00$ 250.00$ 250.00$ 250.00$ 250.00$ 250.00$ 3,000.00$
Utilities, Fuel, Oil 583.33$ 583.33$ 583.33$ 583.33$ 583.33$ 583.33$ 583.33$ 583.33$ 583.33$ 583.33$ 583.33$ 583.33$ 7,000.00$ Facility & Equip Repair 166.67$ 166.67$ 166.67$ 166.67$ 166.67$ 166.67$ 166.67$ 166.67$ 166.67$ 166.67$ 166.67$ 166.67$ 2,000.00$
Breeding Charge -$ Marketing 333.33$ 333.33$ 333.33$ 333.33$ 333.33$ 333.33$ 333.33$ 333.33$ 333.33$ 333.33$ 333.33$ 333.33$ 4,000.00$
Misc 166.67$ 166.67$ 166.67$ 166.67$ 166.67$ 166.67$ 166.67$ 166.67$ 166.67$ 166.67$ 166.67$ 166.67$ 2,000.00$
Interest 166.67$ 166.67$ 166.67$ 166.67$ 166.67$ 166.67$ 166.67$ 166.67$ 166.67$ 166.67$ 166.67$ 166.67$ 2,000.00$ A. TOTAL VARIABLE COSTS 116,033.33$ 9,033.33$ 9,033.33$ 7,633.33$ 7,633.33$ 114,633.33$ 7,633.33$ 7,633.33$ 7,633.33$ 7,633.33$ 9,033.33$ 9,033.33$ 312,600.00$ 85%
GROSS MARGIN (Total Sales-Variable Costs=Gross Margin) This is based on results from previous year of operation, or it is estimated from a benchmark 15%
FIXED COSTS PER 200 HEAD:Depreciation
Interest 166.67$ 166.67$ 166.67$ 166.67$ 166.67$ 166.67$ 166.67$ 166.67$ 166.67$ 166.67$ 166.67$ 166.67$ 2,000.00$ Insurance 150.00$ 150.00$ 150.00$ 150.00$ 150.00$ 150.00$ 150.00$ 150.00$ 150.00$ 150.00$ 150.00$ 150.00$ 1,800.00$ Death Loss 333.33$ 333.33$ 333.33$ 333.33$ 333.33$ 333.33$ 333.33$ 333.33$ 333.33$ 333.33$ 333.33$ 333.33$ 4,000.00$
B. TOTAL FIXED COSTS or Overhead: 650.00$ 650.00$ 650.00$ 650.00$ 650.00$ 650.00$ 650.00$ 650.00$ 650.00$ 650.00$ 650.00$ 650.00$ 7,800.00$ 2%
NET MARGIN (Sales-Variable Costs-Fixed Costs=Net Return) Also called net profit or net income in dollars, or net profit margin when described as a percentage $46,800.00 13%
C. TOTAL COSTS PER 200 HEAD: (A+B) 116,683.33$ 9,683.33$ 9,683.33$ 8,283.33$ 8,283.33$ 115,283.33$ 8,283.33$ 8,283.33$ 8,283.33$ 8,283.33$ 9,683.33$ 9,683.33$ 320,400.00$
GROSS RETURNS PER 200 HEAD: Jan Feb Mar April May June July Aug Sept Oct Nov Dec TotalIncome
Steers 36,720.00$ 73,440.00$ 73,440.00$ 73,440.00$ 110,160.00$ 367,200.00$ Heifers -$ Cull Cows -$ Cull Heifers -$ D. GROSS RETURNS/200 HEAD (Sales): -$ -$ -$ -$ 36,720.00$ 73,440.00$ 73,440.00$ -$ -$ -$ 73,440.00$ 110,160.00$ 367,200.00$
E. MONTHLY CASH FLOW (D-C) (116,683.33)$ (9,683.33)$ (9,683.33)$ (8,283.33)$ 28,436.67$ (41,843.33)$ 65,156.67$ (8,283.33)$ (8,283.33)$ (8,283.33)$ 63,756.67$ 100,476.67$ 46,800.00$
G. Beginning Cash (Checking Account) $175,000.00 $58,316.67 $48,633.33 $38,950.00 $30,666.67 $59,103.33 $17,260.00 $82,416.67 $74,133.33 $65,850.00 $57,566.67 $121,323.33
H. Ending Cash (Checking Account) $58,316.67 $48,633.33 $38,950.00 $30,666.67 $59,103.33 $17,260.00 $82,416.67 $74,133.33 $65,850.00 $57,566.67 $121,323.33 $221,800.00
Grass Fed Monthly Cash Flow Analysis

how quickly can you make money?
• Goal of producing cash in 6 months • Budget to accomplish goal • Pay your bills • Family living expenses

Managing inventory/expense…the time factor…
24-36 months
1-2 months

• Record keeping is required for taxes • Ultimate goal is to manage from records • Need up-to-date and accurate records • Create budget with expectations and
measurable results
plan your business
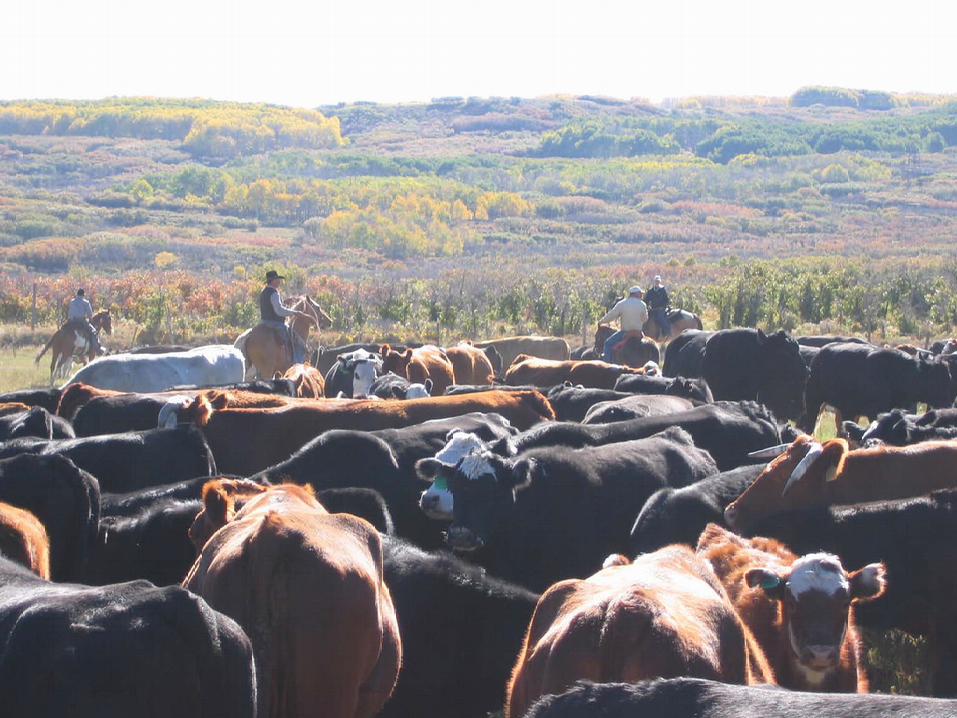
starting in the beef business
Like any small business: income expenses cash flow

things to do before starting
• Save money • Protect credit rating • Gain experience • Network • Plan


• Cycle for cash flow…

North Dakota: Returns Per Cow
• 2012 Returns: Cow/Calf Operation* – Average : $171.70 Net return per cow – Low 20%: -$34.65 – High 20%: $347.25
– *Based on 527 wwt @ $157.34/cwt.

North Dakota: Backgrounding Returns • 2012 Backgrounding Operation Net
Returns* – Average: $17.31/cwt – Low 20%: -$73.12/cwt – High 20%: $66.64/cwt
– *Based on avg gain of 154 lbs and sale price
of $143.46/cwt.
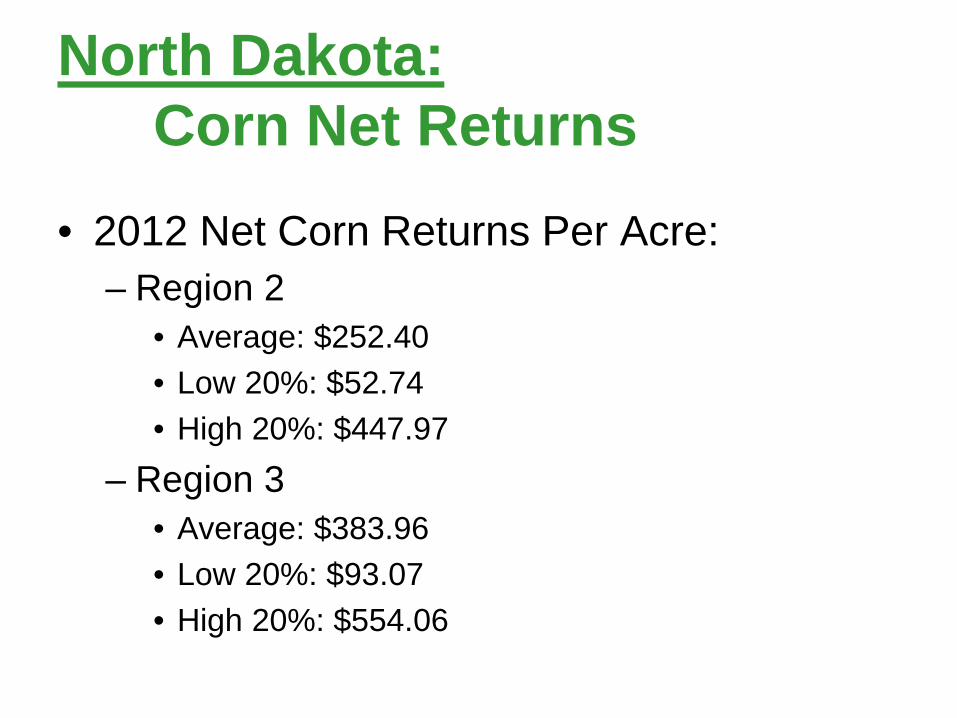
North Dakota: Corn Net Returns • 2012 Net Corn Returns Per Acre:
– Region 2 • Average: $252.40 • Low 20%: $52.74 • High 20%: $447.97
– Region 3 • Average: $383.96 • Low 20%: $93.07 • High 20%: $554.06

Grass Fed Beef Net Returns
• Return Per Head – Average Range: $150 - $350 – Low 20%: $10 - $80 – High 20%: $380 - $450
• Return Per Acre – Average Range: $180 - $300 – Low 20%: $15 - $65 – High 20%: $325 - $400

Business Cycle ~ Cash Flow Cycle
• Plan, prepare – avoid surprises, achieve success

Helpful Resource Links
• www.finbin.umn.edu • www.ndfarmmanagement.com • www.iowabeefcenter.org • www.grazinghandbook.com • www.bcscd.com • www.Mccc.msu.edu • www.Mandan.ars.usda.gov • www.greencoverseed.com

Three basic business skills: 1. Financial 2. Production 3. Marketing
If you are lucky you have two of these skills. Partner with or hire the skill you don’t have.
manage your business

.www.annualcreditreport.com