Mattel Inc. Earnings Conference Call First Quarter 2011 · : Certain statements made by Mattel’s...
18
Mattel Inc. Earnings Conference Call First Quarter 2011 (Unaudited Results) April 15, 2011 Robert Eckert – Chief Executive Officer Bryan Stockton – Chief Operating Officer Kevin Farr – Chief Financial Officer
Transcript of Mattel Inc. Earnings Conference Call First Quarter 2011 · : Certain statements made by Mattel’s...

Mattel Inc. Earnings Conference Call
First Quarter 2011 (Unaudited Results)
April 15, 2011Robert Eckert – Chief Executive Officer
Bryan Stockton – Chief Operating OfficerKevin Farr – Chief Financial Officer

©2011 Mattel, Inc. All Rights Reserved
2
FORWARD-LOOKING STATEMENT: Certain statements made by Mattel’s executives during today’s presentations may include forward-looking statements relating to the future performance of our overall business, brands and product lines. These statements are based on currently available operating, financial, economic and competitive information and they are subject to a number of significant risks and uncertainties which could cause our actual results to differ materially from those projected in the forward-looking statements. We describe some of these uncertainties in the risk factors section of our 2010 annual report on Form 10-K, as well as in our 2011 quarterly reports on Form 10-Q and in other filings we make with the SEC from time to time. Mattel does not update forward-looking statements and expressly disclaims any obligation to do so.
REGULATION G: Information required by Securities and Exchange Commission Regulation G, regarding non-GAAP financial measures, as well as other financial and statistical information, will be available at the time of the conference call on the “Investors & Media” section of http://corporate.mattel.com/, under the subheading “Financial Information” – “Earnings Releases.”
©2011 Mattel, Inc. All Rights Reserved
3
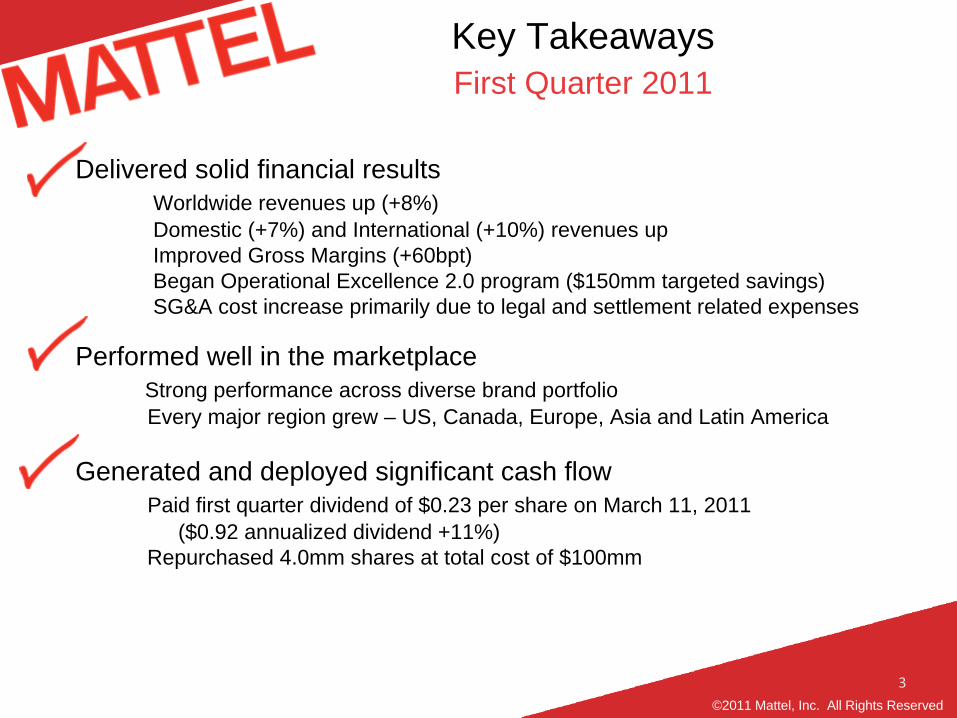
Key Takeaways First Quarter 2011
Delivered solid financial results Worldwide revenues up (+8%)Domestic (+7%) and International (+10%) revenues upImproved Gross Margins (+60bpt)Began Operational Excellence 2.0 program ($150mm targeted savings)SG&A cost increase primarily due to legal and settlement related expenses
Performed well in the marketplaceStrong performance across diverse brand portfolio Every major region grew – US, Canada, Europe, Asia and Latin America
Generated and deployed significant cash flowPaid first quarter dividend of $0.23 per share on March 11, 2011
($0.92 annualized dividend +11%)Repurchased 4.0mm shares at total cost of $100mm

©2011 Mattel, Inc. All Rights Reserved
4
Global Strategic Priorities 2011 and Beyond
Deliver consistent growthContinue momentum in core brandsOptimize Entertainment partnershipsBuild new franchisesContinue expansion of International footprint
Build on operating margin progressSustain Gross Margin of ~50%Deliver cost savings targets
Generate significant cash flowContinue disciplined, opportunistic, value enhancing deployment

©2011 Mattel, Inc. All Rights Reserved
2006 2007 2008 2009 20102011201020112010
5
Worldwide Gross Sales First Quarter 2011 ($ In Millions - Unaudited)
• Core brand momentum continues with growth in Barbie, Hot Wheels and American Girl.• Evergreen entertainment properties continue to improve, including CARS, Disney
Princess, Thomas & Friends, and Toy Story 3.• The Monster High franchise continues to expand globally.• Gained share in growing US category.*
• Retail inventory levels up consistent with POS momentum and timing of Easter.
Quarter Year-to-Date Historical TrendFull Year+8.0% +8.0%
6,158.0 6,486.06,592.91,041.1960.3 1,041.1960.3 5,934.3 6,386.6
CurrencyImpact (ppt)
+3 ppt 0 ppt 0 ppt0 ppt+3 ppt (2) ppt+3 ppt+1 ppt (2) ppt
* Source: NPD Group / Consumer Tracking Service (Jan – Feb)

©2011 Mattel, Inc. All Rights Reserved
656573
310316
7370
20112010
3,424 3,700 3,643 3,286 3,661
2,2692,442 2,357
2,1682,221
440431 463
463487
2006 2007 2008 2009 2010
Oth
AG
FP
MB656573
310316
7370
20112010
6
+4.0%
(2.0%)
+15.0%
+4.0%
(2.0%)
+15.0%
Quarter Year-to-Date Historical TrendFull Year+8.0% +8.0%
Mattel Brands:
Fisher Price:
American Girl:
Worldwide Gross Sales by Business First Quarter 2011 ($ In Millions - Unaudited)
CurrencyImpact(ppt)
+3 ppt 0 ppt +3 ppt+1 ppt 0 ppt0 ppt+3 ppt
Y/Y %Y/Y %
• Growth in Girl of the Year “Kanani” and My American Girl as well as positive momentum in retail operations.
• Growth driven primarily by Barbie, Monster High, Entertainment, Disney Princess, and Hot Wheels.
• Growth in Power Wheels and flat sales in Core offset by decreases in Baby Gear and the loss of the Sesame Street license.
1,041.1960.3
1,041.1960.3
(2) ppt (2) ppt
6,158.0 6,486.06,592.95,934.3
6,386.6
©2011 Mattel, Inc. All Rights Reserved
303258
172183
7370
20112010
1,495 1,433 1,425 1,390 1,616
1,467 1,507 1,414 1,3071,349
440 431 463 463487
2006 2007 2008 2009 2010
AG
FP
MB303258
172183
7370
20112010
7
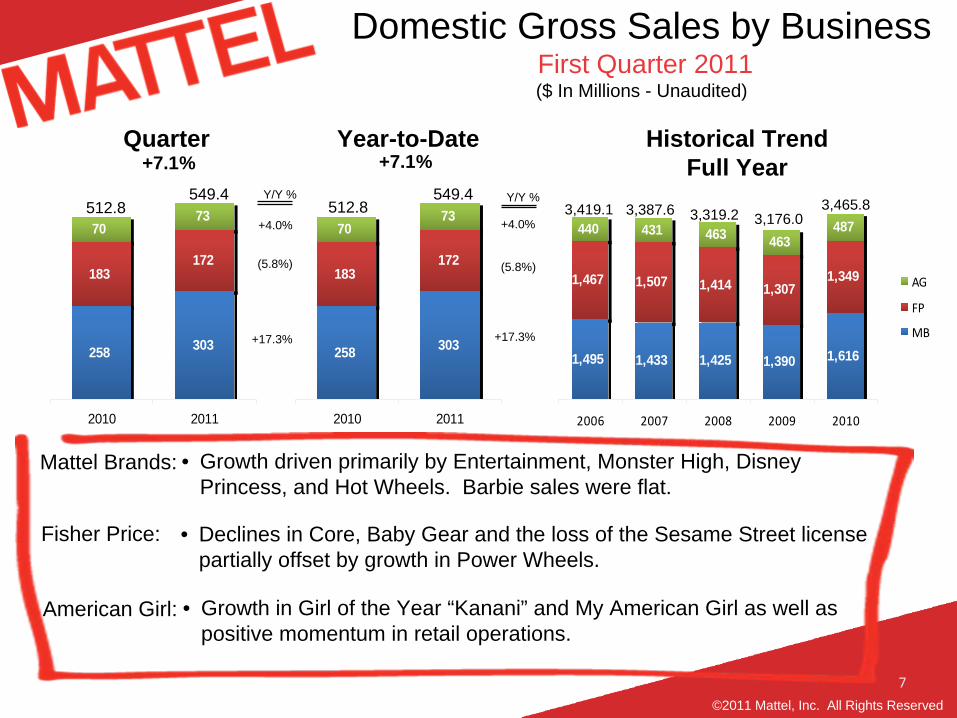
3,419.1 3,319.23,387.6512.8549.4
512.8549.4
+4.0%
(5.8%)
+17.3%
+4.0%
(5.8%)
+17.3%
Mattel Brands:
Fisher Price:
American Girl:
Domestic Gross Sales by Business First Quarter 2011 ($ In Millions - Unaudited)
+7.1% +7.1%Quarter Year-to-Date Historical Trend
Full YearY/Y % Y/Y %
• Growth driven primarily by Entertainment, Monster High, Disney Princess, and Hot Wheels. Barbie sales were flat.
• Declines in Core, Baby Gear and the loss of the Sesame Street license partially offset by growth in Power Wheels.
3,176.03,465.8
• Growth in Girl of the Year “Kanani” and My American Girl as well as positive momentum in retail operations.

©2011 Mattel, Inc. All Rights Reserved
279274
11388
6756
3330
20112010
1,543 1,798 1,690 1,443 1,508
740912 979
861 868
240
275 286271 333216
220 212184 212
2006 2007 2008 2009 2010
CAN/Oth
APAC
LATAM
Europe279274
11388
6756
3330
20112010
8
2,739.03,166.8
2,920.83,205.3
491.7447.5
491.7447.5
Quarter Year-to-Date Historical TrendFull Year+9.9% +9.9%
Europe:
Latin America:
Asia Pacific:
+10.1%
+28.2%
+2.0%
+18.8%
+10.1%
+28.2%
+2.0%
+18.8%
+2 ppt+7 ppt +7ppt (4)ppt+2ppt +1ppt (4)ppt+2 ppt+7 ppt
International Gross Sales by Region First Quarter 2011 ($ In Millions - Unaudited)
CurrencyImpact (ppt)
Y/Y % Y/Y %
• Growth in UK, Italy, Germany & Central Europe partially offset by declines elsewhere.
• Growth throughout the region with strong double digit growth in Brazil and Mexico.
• Growth across most markets with the strongest being China, Australia, and India.
2,758.3
©2011 Mattel, Inc. All Rights Reserved
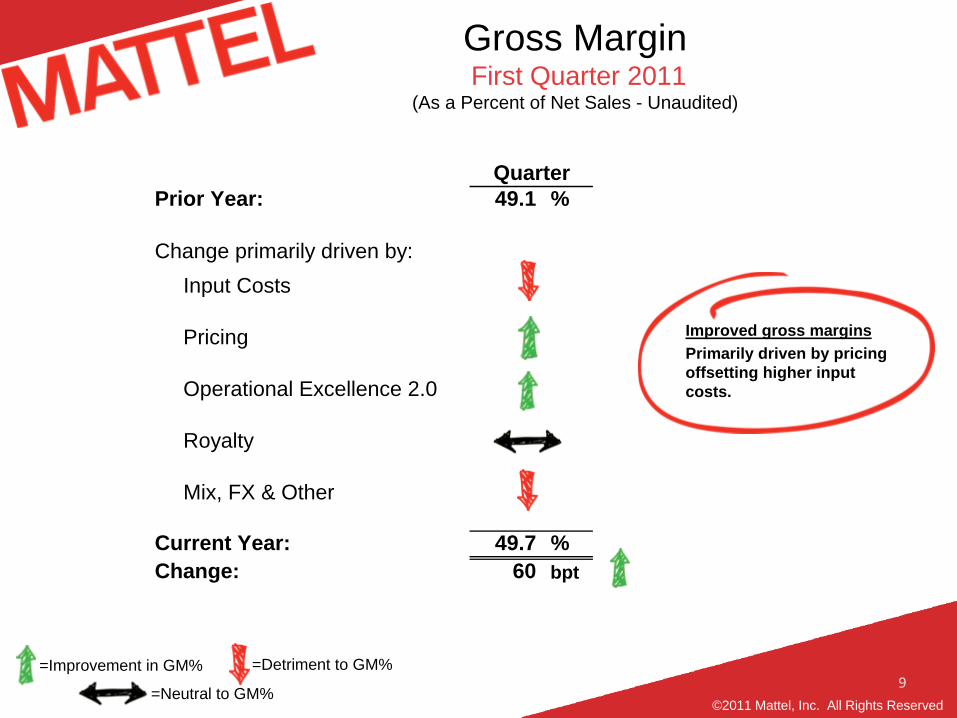
Prior Year: 49.1 %
Change primarily driven by:Input Costs
Pricing
Operational Excellence 2.0
Royalty
Mix, FX & Other
Current Year: 49.7 %Change: 60 bpt
Quarter
9
Gross Margin First Quarter 2011
(As a Percent of Net Sales - Unaudited)
=Improvement in GM% =Detriment to GM%
=Neutral to GM%
Improved gross marginsPrimarily driven by pricing offsetting higher input costs.

©2011 Mattel, Inc. All Rights Reserved
In Millions
Prior Year: 292.5$ 33.2 %
Change primarily driven by:Operational Excellence 2.0
Employee Related Costs
Severance
Legal/Settlement Related
Incentive/Equity Comp
Other
Current Year: 334.5$ 35.1 %
Change: 42.0$ 190 bpt
Quarter% of Sales
10=Improvement in SG&A =Detriment to SG&A
=Neutral to SG&A
SG&A First Quarter 2011
($ In Millions and as a Percent of Net Sales - Unaudited)
Operational Excellence 2.0 targeting incremental $150mm cumulative savings by end of 2012
Increase in legal/settlements was $26 million or 60% of the SG&A increase

©2011 Mattel, Inc. All Rights Reserved
% of Phase 22009 2010 Total Gross Q1A FY Target Legal Structural Total Total
SG&A 88 20 108 48% 3 15 75
Gross Margin 62 27 89 40% 1 15
Advertising 14 14 28 12% 1 5
Gross Savings 164 61 225 100% 5 35 75 40 115 150
Investments 32 13 13 3 15
Net Savings 132 48 212 2 20
Global Cost Leadership Operational Excellence 2.02012 FY Targets2011
11
Operational Excellence 2.0 First Quarter 2011 ($ In Millions –
Unaudited)
• Global Cost Leadership program savings exceeded expectations with $225 million in sustainable savings.
• Operational Excellence 2.0 includes new 2-year cumulative savings targets – total $150 million.• At least 60%+ of $150 million cost savings expected to positively impact SG&A
• Operational Excellence 2.0 initiatives include:• Reduction in legal expenses• Global Brand Teams/North America Division re-organization• Continuation of global procurement initiatives• SKU efficiency• Packaging optimization
Run Rate

©2011 Mattel, Inc. All Rights Reserved
In Millions
Prior Year: 45.2$ 5.1 %
Change primarily driven by:
Sales Volume
Gross Margin
Advertising & Promotion
SG&A
Currency
Current Year: 36.8$ 3.9 %
Change: (8.4)$ (120) bpt
Quarter% of Sales
12
Operating Income First Quarter 2011 ($ In Millions –
Unaudited)
=Improvement in Op Inc =Detriment to Op Inc
=Neutral to Op Inc
Higher sales and gross margins offset by higher SG&A spend driven by legal/settlement activity

©2011 Mattel, Inc. All Rights Reserved
13
EPS First Quarter 2011 ($ Per Share ‐
Unaudited)
=Improvement in EPS =Detriment to EPS
=Neutral to EPS
Higher sales and gross margins offset by higher SG&A spend driven by legal/settlement activity
Quarter
Prior Year: 0.07$
Change primarily driven by:
Operating Profit
Interest / Non-operating
Tax Rate
Currency
Share Count
Current Year: 0.05$ Change: (0.02)$
(29%)
Lower operating profit and higher interest expense partially offset by improved tax rate

©2011 Mattel, Inc. All Rights Reserved
Capital Deployment Share Repurchases• 4.0mm shares/Avg. price $25.24• Remaining authorization $364mm
Dividend• First Quarter dividend $0.23• Annualized dividend to $0.92 (+11%)
14
Cash Flow*
First Quarter 2011 ($ In Millions - Unaudited)
* Amounts shown are preliminary estimates. Actual amounts will be reported in Mattel’s Quarterly Report on Form 10-Q for the quarterly period ending March 31, 2011.
Improved Cash Flow from Ops
Primarily due to decision not to factor domestic receivables last year ($300mm) partially offset by increased working capital
2009 2010 2011
Net Income (51) 25 17 Depreciation 38 37 36 Amortization 6 4 4 Change in Working Capital & Other (208) (311) (99)
Net Cash Used for Operations (215) (245) (42)
Capital spending (20) (24) (45) Other investing 43 (11) 36
Net Cash From/(Used for) Investing 23 (35) (9)
Share Repurchases - - (100) Dividends - - (80)
Financing Activities and Other (21) 35 (1)
Net Cash (Used for)/From Financing Activities & Other (21) 35 (181)
Change in cash (213) (245) (232)
Cash at the beginning of the period 618 1,117 1,281
Cash at the end of the period 405 872 1,049

©2011 Mattel, Inc. All Rights Reserved
15
Well Positioned for 2011 & Beyond
Near Term Strategic Priorities
Deliver consistent growthContinue momentum in core brandsOptimize Entertainment partnershipsBuild new franchisesContinue expansion of International footprint
Build on operating margin progress Sustain Gross MarginDeliver cost savings targets
Generate significant cash flow Continue disciplined, opportunistic, value enhancing deployment

©2011 Mattel, Inc. All Rights Reserved
16
Appendix

©2011 Mattel, Inc. All Rights Reserved
17
Incremental MGA and Recall- Related Legal/Settlement Costs
Historical Trend of Yr/Yr Variance ($ In Millions ‐
Unaudited)
1st trial beganMay 2008
2nd trial beganJanuary 2011
Incremental MGA and Recall-Related Legal and Settlement Costs
2008 2009 2010 2011 2008 2009 2010 2011 2008 2009 2010 2011
Q1 18.3 (11.3) 5.7 10.7 - 20.9 (28.4) 7.5 18.3 9.6 (22.7) 18.2Q2 25.1 (21.2) 8.3 - (4.9) 3.7 25.1 (26.1) 12.0Q3 0.5 (4.2) 11.0 - 5.4 (10.2) 0.5 1.2 0.8 Q4 (7.2) 3.4 15.0 15.4 (15.4) - 8.2 (12.0) 15.0
Full Year 36.8 (33.3) 39.9 15.4 6.0 (34.9) 52.2 (27.3) 5.0
Recall Related Settlement Total Legal/SettlementMGA/Recall Legal

©2011 Mattel, Inc. All Rights Reserved
18