Matrix (Partially Grouted) Riprap Lab Flume Study · Matrix (Partially Grouted) Riprap Lab Flume...
95
Matrix (Partially Grouted) Riprap Lab Flume Study Jeffrey D. G. Marr, Principal Investigator St. Anthony Falls Laboratory University of Minnesota April 2015 Research Project Final Report 2015-15
Transcript of Matrix (Partially Grouted) Riprap Lab Flume Study · Matrix (Partially Grouted) Riprap Lab Flume...

Matrix (Partially Grouted) Riprap Lab Flume Study
Je�rey D. G. Marr, Principal InvestigatorSt. Anthony Falls Laboratory
University of Minnesota
April 2015
Research ProjectFinal Report 2015-15

To request this document in an alternative format call 651-366-4718 or 1-800-657-3774 (Greater Minnesota) or email your request to [email protected]. Please request at least one week in advance.

Technical Report Documentation Page 1. Report No. 2. 3. Recipients Accession No. MN/RC 2015-15 4. Title and Subtitle 5. Report Date Matrix (Partially Grouted) Riprap Lab Flume Study
April 2015 6.
7. Author(s) 8. Performing Organization Report No. Jeffrey D.G. Marr, Rita R. Weaver, Omid Mohseni, Craig Taylor, Jon Hilsendager, Sara Mielke
9. Performing Organization Name and Address 10. Project/Task/Work Unit No. St. Anthony Falls Laboratory 2-Third Ave SE Minneapolis, MN 55414
CTS # 2012004 11. Contract (C) or Grant (G) No.
(c) 99008 (wo) 2
12. Sponsoring Organization Name and Address 13. Type of Report and Period Covered Minnesota Department of Transportation Research Services & Library 395 John Ireland Boulevard, MS 330 St. Paul, Minnesota 55155-1899
Final Report 14. Sponsoring Agency Code
15. Supplementary Notes http://www.lrrb.org/pdf/201515.pdf 16. Abstract (Limit: 250 words) The Minnesota Department of Transportation (MnDOT) in conjunction with the Saint Anthony Falls Laboratory (SAFL) has conducted a research study on the use of matrix riprap, or partially grouted riprap, as a spill-through abutment countermeasure. Spill-through abutments at river bridges require a countermeasure to protect the abutment from erosion and scour and often riprap is used. However obtaining large enough stone to protect the abutment can significantly increase construction costs. Matrix riprap, or partially grouted riprap, is an option that will allow for smaller stone, that when partially grouted, will provide equivalent protection to larger sized riprap. This study focused on matrix riprap applied to bridge abutments and included a review of published literature; site visits and observation of matrix riprap installation; laboratory experiments to evaluate matrix riprap application/installation (e.g., non-hydraulic experiments looking at rock and grout placement); experiments to test matrix riprap on a prototype abutment within a flume (hydraulic flume experiments), and finally hydraulic experiments focused on quantifying matrix riprap strength (steep flume experiments). Study results showed that the shear strength of matrix riprap was determined to be more than three times greater than conventional riprap in a laboratory setting. Additional investigation should be completed to better understand the application and performance of the matrix riprap, however this study can be used to support the use of matrix riprap in place of larger stone or other bridge countermeasures.
17. Document Analysis/Descriptors 18. Availability Statement Matrix riprap, Riprap, Stone matrix asphalt, Bridge abutments No restrictions. Document available from:
National Technical Information Services, Alexandria, Virginia 22312
19. Security Class (this report) 20. Security Class (this page) 21. No. of Pages 22. Price Unclassified Unclassified 95

Matrix (Partially Grouted) Riprap Lab Flume Study
Final Report
Prepared by:
Jeffrey D.G. Marr Rita R. Weaver Omid Mohseni Craig Taylor
Jon Hilsendager Sara Mielke
St. Anthony Falls Laboratory University of Minnesota
April 2015
Published by: Minnesota Department of Transportation
Research Services & Library 395 John Ireland Boulevard, MS 330
St. Paul, Minnesota 55155-1899
This report represents the results of research conducted by the authors and does not necessarily represent the views or policies of the Minnesota Local Road Research Board, the Minnesota Department of Transportation, or the University of Minnesota. This report does not contain a standard or specified technique.
The authors, the Minnesota Local Road Research Board, the Minnesota Department of Transportation, and the University of Minnesota do not endorse products or manufacturers. Any trade or manufacturers’ names that may appear herein do so solely because they are considered essential to this report.

Acknowledgments The authors would like to thank the Minnesota Department of Transportation for the sponsorship of this research effort and for their guidance and technical input. We would like to thank the Technical Advisory Panel which included Nicole Bartelt, Solomon Woldeamlak, Peter Leete, Jason Law, James Hallgren, James Michael, Jodi Teich, and Shirlee Shirkow. Finally, we thank the University of Minnesota - Center for Transportation Studies for their administrative support and leadership in this effort.

Table of Contents
Contents
1.0 Introduction ............................................................................................................................................ 1
2.0 Background Review ................................................................................................................................ 2
2.1 Literature Review............................................................................................................................. 2
2.1.1 Summary of NCHRP Studies ........................................................................................... 2
2.1.2 Traditional Riprap Design Methods .................................................................................... 3
2.1.3 Characterizing Riprap Size, Shape, Angularity, and Percent Grout for Matrix Riprap ...... 4
2.1.4 Grout Evaluation ................................................................................................................. 5
2.1.5 Summary of Supplementary Documents ............................................................................ 6
3.0 Site Visit.................................................................................................................................................. 9
4.0 Out-of-Flume Materials Tests ............................................................................................................... 11
4.1 Out-of-Flume Apparatus and Procedures ...................................................................................... 11
4.1.1 Facilities and Riprap ......................................................................................................... 11
4.1.2 Grout Mixture and Quality Assurance ............................................................................. 12
4.1.3 Grout Application ............................................................................................................. 13
4.1.4 Void Volume and Grout Measurements ........................................................................... 14
4.2 Out-of-Flume Results..................................................................................................................... 15
4.2.1 Riprap and Grout Volume ................................................................................................. 16
4.2.2 Void Volume and Grout Fraction Results ........................................................................ 17
4.2.3 Porosity and Grout Fraction .............................................................................................. 19
4.3 Mechanical Pull Tests..................................................................................................................... 22
4.3.1 Mechanical Pull Test Apparatus and Procedures ............................................................. 22
4.3.2 Mechanical Pull Test Results ............................................................................................ 22
4.4 Out-of-Flume Conclusions and Discussion ................................................................................... 24
5.0 Hydraulic Flume Experiments .............................................................................................................. 25
5.1 Background and Motivation ......................................................................................................... 25
5.2 Experimental Design: Series A, B and C ....................................................................................... 26
5.2.1 Review of Example Bridge Crossings ............................................................................. 26
5.2.2 Model Scaling .................................................................................................................. 28
5.3 Flume Setup ................................................................................................................................... 29
5.3.1 Model Abutment ............................................................................................................... 29
5.3.2 Riprap Sizing and Placement ............................................................................................ 29
5.4 Data Acquisition ............................................................................................................................ 31
5.5 Series A conventional 1-inch riprap ............................................................................................. 32

5.6. Series B – Conventional 0.2-inch riprap ....................................................................................... 36
5.7 Series C – Matrix Riprap ................................................................................................................ 39
5.8 Series D – Plane Bed Runs ............................................................................................................. 42
5.9 Tilting Bed Flume Testing: Conclusions ....................................................................................... 44
6.0 Steep Flume Experiments ..................................................................................................................... 45
6.1 Steep Flume Construction .............................................................................................................. 45
6.2 Steep Flume Experiments ............................................................................................................... 47
6.3 Steep Flume Run Results ............................................................................................................... 55
6.4 Steep Flume Conclusions ............................................................................................................... 70
Summary of findings ................................................................................................................................... 72
References ................................................................................................................................................... 73

List of Figures
Figure 3.1 -Grout application at Bridge No. 48030, Milaca, MN ................................................................. 9 Figure 3.2 - Matrix riprap at Bridge No. 48030, Milaca, MN .................................................................... 10 Figure 4.1. Example Out-of-Flume test box configuration. ........................................................................ 11 Figure 4.2. Image of slump cone and table apparatus. ................................................................................ 13 Figure 4.3. Image of a box after filled with riprap and grouted. ................................................................. 14 Figure 4.4. Example of volume-depth relationship developed for testing box. .......................................... 15 Figure 4.5. Class I rock and grout volume summary. ................................................................................. 16 Figure 4.6. Class II rock and grout volume summary. ................................................................................ 17 Figure 4.7. Class I voids volume summary. ................................................................................................ 18 Figure 4.8. Class II voids volume summary. .............................................................................................. 18 Figure 4.9. Class I porosity and grout fraction summary. ........................................................................... 19 Figure 4.10. Class II porosity and grout fraction summary. ....................................................................... 20 Figure 4.11. Porosity for Class I and Class II tests against dimensionless depth. ...................................... 21 Figure 4.12. Grout fraction for Class I and Class II tests against dimensionless depth. ............................. 21 Figure 4.13. Mechanical pull test apparatus and anchoring system. ........................................................... 22 Figure 5.1. Schematic of typical bridge spill-through abutment configuration. The dashed box represents the region modeled in the Tilting Bed Flume. ............................................................................................ 27 Figure 5.2. Schematic drawing of two abutment configurations. ............................................................... 28 Figure 5.3. Photograph of physical model layout prior to riprap and geotextile fabric placement. ............ 29 Figure 5.4. Image showing the setup for a spill through abutment experiment in the Tilting Bed Flume. The image shows the filter material, the model riprap material, and Model 1 Abutment. ......................... 31 Figure 5.5. Tilting Bed Flume data carriage used to take precision velocity and topographic scans. ........ 32 Figure 5.6. Photograph of the abutment with 25 mm riprap material. ........................................................ 32 Figure 5.7. Initial topographic scan of abutment section in the Tilting Bed Flume. ................................... 33 Figure 5.8. Bed elevation change near abutment after 12.8 L/s flow. ........................................................ 34 Figure 5.9. Cross-section topography of water surface and bed during water discharge of 12.8 L/s for Series A. ...................................................................................................................................................... 34 Figure 5.10. Cross-section topography of water surface and bed during maximum flow (114 L/s) for Series A. ...................................................................................................................................................... 35 Figure 5.11. Map of final elevations changes at the surface after 114 L/s test. .......................................... 35 Figure 5.12. Flume setup for Model 1 with pea gravel. .............................................................................. 36 Figure 5.13. Failure of pea gravel at 10 L/s. ............................................................................................... 38 Figure 5.14. Failure of pea gravel at 11.2 L/s ............................................................................................. 39 Figure 5.15. Hot glue applied to finished riprap surface............................................................................. 40 Figure 5.16. Side by side comparison of pea gravel surface with and without hot glue "grout". ............... 40 Figure 5.17. Isopach showing failure of hot glue matrix riprap. ................................................................. 41 Figure 5.18. Image of Quickcrete matrix riprap within the Tilting Bed Flume. ......................................... 42 Figure 5.19. Plane bed configuration, riprap only. ..................................................................................... 42 Figure 5.20. Plane bed configuration, matrix riprap. .................................................................................. 43 Figure 5.21. Bed change after failure of conventional Class 1 riprap material. Note the movement of material. ...................................................................................................................................................... 43 Figure 5.22. Bed change after max flow conditions were run in flume. Note the lack of any movement of the stones. .................................................................................................................................................... 44 Figure 6.1. Design details of steep flume. ................................................................................................... 46 Figure 6.2. 2-inch angular gravel. ............................................................................................................... 47 Figure 6.3. 2-inch river rock. ...................................................................................................................... 48 Figure 6.4. Flume floor from downstream to upstream. ............................................................................. 49 Figure 6.5. Calibration curves for orifice plates. ........................................................................................ 50

Figure 6.6. Stage discharge relationship in test flume. ............................................................................... 51 Figure 6.7. Bed shear stress and Froude developed in the test flume. ........................................................ 52 Figure 6.8. Pre-Run 1, 2-inch angular gravel with no grout. ...................................................................... 55 Figure 6.9. Post-Run 1, 2-inch angular gravel with no grout. ..................................................................... 56 Figure 6.10. Pre-Run 2, 2-inch angular gravel with grout placed according to MnDOT guidelines. ......... 57 Figure 6.11. Post-Run 2, 2-inch angular gravel with grout placed according to MnDOT guidelines. ....... 57 Figure 6.12. Pre-Run 3, 2-inch angular gravel with grout paced according to MnDOT guidelines. .......... 58 Figure 6.13. Post-Run 3, 2-inch angular gravel with grout placed according to MnDOT guidelines. ....... 58 Figure 6.14. Pre-Run 4, 2-inch angular gravel with half recommended grout. .......................................... 60 Figure 6.15. Post-Run 4, 2-inch angular gravel with half recommended grout. ......................................... 60 Figure 6.16. Pre-Run 5, 2-inch angular gravel with half recommended grout. .......................................... 61 Figure 6.17. Post-Run 5, 2-inch angular gravel with half recommended grout. ......................................... 61 Figure 6.18. Pre-Run 6, 2-inch river rock with no grout............................................................................. 62 Figure 6.19. Post-Run 6, 2-inch river rock with no grout. .......................................................................... 62 Figure 6.20. Pre-Run 7, 2-inch river rock with grout placed according to MnDOT guidelines. ................ 64 Figure 6.21. Post-Run 7, 2-inch river rock with grout placed according to MnDOT guidelines. ............... 64 Figure 6.22. Pre-Run 8, 2-inch river rock with grout placed according to MnDOT guidelines. ................ 65 Figure 6.23. Post-Run 8, 2-inch river rock with grout placed according to MnDOT guidelines. ............... 65 Figure 6.24. Pre-Run 9, 2-inch river rock with half of the recommended grout. ........................................ 67 Figure 6.25. Pre-Run 10, 2-inch river rock with half of the recommended grout. ...................................... 68 Figure 6.26. Post-Run 10, 2-inch river rock with half of the recommended grout. .................................... 68 Figure 6.27. Image of measurement location upstream of test section sump. ............................................ 70 Figure 6.28. Summary of grout quantity on shear strength. ........................................................................ 71
List of Tables Table 2.1. FWERI Recommended Grout Mix .............................................................................................. 5 Table 4.2. MnDOT Special Provision (S-1) 2511 Grout Mixture. ............................................................. 12 Table 4.3. Summary of modified grout mixture. ........................................................................................ 12 Table 4.4 Horizontal pull test results. ......................................................................................................... 23 Table 4.5. Vertical pull test results. ............................................................................................................ 23 Table 5.1. Summary of four test series performed in tilting bed flume. ..................................................... 26 Table 5.2. Summary of MnDOT bridge characteristics taken from plan sheets. ........................................ 27 Table 5.3. Prototype and Model Geometric Parameters ............................................................................. 28 Table 5.4. Summary of Pea Gravel Grain Size Distribution (in mm) ......................................................... 30 Table 5.5. Summary of Landscape Rock Grain Size Distribution (in mm) ................................................ 30 Table 6.1. Size Gradations for 2-inch Angular gravel and 2-inch River Rock ........................................... 47 Table 6.2. Grout Mix Design for Steep Flume Runs .................................................................................. 53 Table 6.3. Pre- and post-tap grout diameters. ............................................................................................. 53 Table 6.4. Weight of grout applied to test setup. ........................................................................................ 54 Table 6.5. Summary of ten test runs and results. ........................................................................................ 69 Table 6.6. Summary of failure bed shear stress by amount of grout. ......................................................... 71

Executive Summary Spill-through abutments at river bridges often require a countermeasure to protect abutment from erosion and scour. Matrix riprap, or partially grouted riprap, is installed by placing conventional riprap material and then “welding” contact points with a specialized grout mixture. The grout covers and penetrates the riprap and bonds neighboring stones together forming a “matrix” armor layer that serves to protect the structure. Typically, riprap is used as the countermeasure, however, obtaining large enough stone in some regions can dramatically increase the construction costs associated with a project. Since matrix or grout adds strength to the riprap, matrix riprap countermeasure creates the opportunity to use smaller stone, which may be more available to the project. The goal of this study was to evaluate the performance of matrix riprap when used on spill-through abutments.
Matrix riprap has been evaluated in a laboratory setting as a countermeasure for bridge piers, and conventional riprap and other countermeasures have been evaluated for bridge abutments, yet extensive study has not been completed for matrix riprap as a countermeasure for bridge abutments. This study focused on matrix riprap applied to spill-through abutments and included a review of published literature; site visits and observation of matrix riprap installation; laboratory experiments to evaluate the matrix riprap application/installation (e.g., non-hydraulic experiments looking at rock and grout placement); experiments to test matrix riprap on a prototype abutment within a flume (hydraulic flume experiments), and finally hydraulic experiments focused on quantifying matrix riprap strength (steep flume experiments).
The literature review revealed that while matrix riprap is used extensively overseas, in the United States the countermeasure is new without much laboratory or field demonstration. Matrix riprap has been studied at other U.S. universities as a countermeasure for bridge pier scour, but has not been studied as a countermeasure for spill-through abutments. The most comprehensive study completed on matrix riprap is the NCHRP Report 593, which was followed by a number of supplemental papers discussing or building on the work presented in NCHRP Report 593.
The out-of-flume materials tests were conducted to evaluate the application and installation of the matrix riprap at full scale. These tests were completed by placing riprap in a series of boxes (dimensions 48˝ (L) x 48˝ (W) x 15˝ (H)) and applying grout per MnDOT recommendations. These tests evaluated the grout mixture and application, the void volume before and after grout placement, the grout volume penetrating the group, and porosity and grout fraction. The study focused on both Class I and Class II riprap. Key findings of this set of experiments showed that the porosity of the riprap decreased by approximately 10 percent with the grout added, indicating how much grout was able to penetrate the rock. Also, grout penetration was limited to about 1.5 times the D50 of the stone for Class I riprap; however, for Class II riprap grout was able to penetrate through the full depth of stone indicating that with smaller sized riprap, the matrix riprap will create a shell over the countermeasure, while larger riprap will develop larger rock modules or clasts with bonds that extend through the depth of the countermeasure.
The hydraulic flume experiments included developing a prototype spill-through abutment based on dimensions of typical MnDOT bridges. Two stone sizes were selected to represent riprap and a number of materials were selected as surrogates for the grout. Both mobile and fixed bed conditions were used during these experiments. The flume allowed for high enough velocities to move the conventional riprap (i.e., no matrix); however, when a matrix was applied, the available flow rates in the flume could not exceed the failure threshold of the matrix riprap. In addition, it was determined that it was challenging to find an appropriate surrogate for the grout at model scale. Materials tested included hot glue, wood glue, wood glue with additives to change consistency, Gorilla GlueTM, quickrete, cement glue, and Portland cement (with different amounts of water and kaolin to change consistency).
The steep flume experiments were conducted to evaluate failure at velocities and bed shear stresses higher than those possible in the tilting bed flume. A new flume was constructed with a 15 percent slope, which would result in velocities in excess of 15 feet per second. Two-inch angular stone and two-inch river rock

(rounded) stone with and without matrix were evaluated. Flow rates were increased in the flume until failure was achieved. “Failure” was defined as any movement of rock out of its original location. The results of these experiments showed the conventional riprap (non-matrix) failed under high shear stress; however, the matrix riprap provided substantial strength to the countermeasure that exceeded the capabilities of the flume.
Matrix riprap is a promising countermeasure for spill-through abutments as well as other riprap countermeasure applications. The testing conducted in this study showed significant added strength by the matrix through the vertical and horizontal bonds formed by the matrix material. Additional research topics are suggested at the end of the project report, which will be important to investigate to improve understanding of application and performance of matrix riprap.

1
1.0 Introduction Spill-through abutments are commonly used in Minnesota waterway bridges. The side slopes on spill-through abutments are typically protected by riprap cover. Both non-grouted and fully grouted riprap systems have been well studied and have distinct benefits and limitations in protecting the abutments against river scour. Matrix riprap or partially grouted riprap is a scour protection approach that uses post-placement injection of concrete into some of the pore space between stones. Recent studies suggest that matrix riprap may be a sound alternative to traditional riprap in terms of protection and possibly costs. Matrix riprap is porous and is not subject to uplift pressures typical of fully grouted riprap or slabs. It has a comparative roughness to riprap and the effective rock size is substantially greater than the individual rocks within the riprap matrix. Matrix riprap can be placed thinner than traditional riprap. The design and costs of matrix riprap are not well defined but are of interest to Minnesota bridge engineers and maintenance personnel.
The primary goal of this research proposal is to conduct laboratory experiments to evaluate the performance of matrix riprap as a protection measure for spill-through abutments. The effects of stone size, stone angularity, and percent grout under a variety of flow conditions were evaluated. The results can be used as design guidelines for matrix riprap projects. A technical advisory panel from across various MnDOT districts and other local government agencies was included in update meetings throughout the project and had input on project focus and deliverables.

2
2.0 Background Review
2.1 Literature Review This section discusses the literature reviewed by the research team on previous studies regarding scour countermeasures, spill-through abutments, and the placement of matrix riprap. The most comprehensive documents were the NCHRP Reports 593 and 587, which are summarized in Section 2.1.1. A number of USACE and HEC documents on the design of scour countermeasures and riprap sizing were reviewed and used in the design of the laboratory experiments. Section 2.1.3 discusses how these documents were applied to this study. The literature review also included documents characterizing the riprap (discussed in Section 2.1.2) and a summary of the grout evaluation recently completed for MnDOT (discussed in Section 2.1.4).
There were also a significant number of supplemental documents reviewed by the research team which contained information on scour countermeasures and the development of scour holes, however these were not directly related to matrix riprap. Other supplemental papers summarized the information contained in the NCHRP reports mentioned above. These supplemental documents are summarized in Section 2.1.5.
2.1.1 Summary of NCHRP Studies The majority of relevant literature pertinent to this project falls into one of two categories: 1) evaluation of matrix riprap in applications other than spill-through abutment slopes, and 2) evaluation of spill-through abutment flow patterns, countermeasure systems used in spill-through abutments and their failure mechanisms. Two of the most comprehensive documents of these subjects are NCHRP Report 593 (Lagasse et al., 2007) for matrix riprap applications and NCHRP Report 587 (Barkdoll et al., 2007) for spill-through abutment protection.
In the NCHRP Report 593, the effectiveness of matrix riprap for protecting bridge piers against scour has been presented. Partial grouting creates conglomerate particles with a median stone size (d50) that is much larger than the maximum stone size of the riprap matrix.
Small scale flume tests and prototype scale tests were conducted as part of this NCHRP study. The small scale tests were used to determine the stability and performance of several countermeasures, including the matrix riprap. The prototype scale tests were used to evaluate constructability, test performance, and also to check water quality in regards to placing the matrix riprap underwater.
The small scale tests were conducted using a geotextile fabric that extended two-thirds the distance from the pier to the edge of the riprap as recommended by the NCHRP Project 24-07 (1). Different grout mixtures were used, using three aggregate gradations in the grout mixture (with median sizes of 0.58, 1 and 1.2 inches). In addition to trying different grout mixtures, the tests varied the layer thickness, the aerial coverage and the termination detail of the matrix riprap. They also considered sloping the riprap away from the pier instead of keeping the countermeasure flush with the stream bed.
The large scale tests were conducted on sand filled geotextile containers instead of the geotextile fabric under the matrix riprap layer. The riprap had a d50 of 6 inches, and the grout was mixed at a commercial plant and applied by an experienced underwater grout installation specialist. Grout was applied both above and below water.
This report concludes that filling 15 to 40 percent of the riprap voids space with grout increased the countermeasure stability without losing flexibility or permeability. This study also found that the stone shape is more important than angularity and that the countermeasure remains functional even if a few individual stones are lost.
NCHRP Report 593 includes several general design guidelines for placing matrix riprap. The riprap d50 should be greater than nine inches but less than fifteen inches in order to achieve a desirable void space. If the void space is too small, then grouting is not possible; however, if the void space is too large, then the

3
grout will not be retained. Finally, injecting grout with a “spot-by-spot” method instead of a line method reduces the risk of clogging the voids and preventing permeability. A more detailed description of the design guidelines can be found in Section 2.1.2 of this report.
The NCHRP Report 587 has as an extensive discussion of riprap protection of spill-though abutments. Riprap failure mechanisms are expected to be similar to the failure mechanisms for matrix riprap on abutment slopes. Several documents characterize riprap failure mechanisms (NCHRP Report 568 (Lagasse et al., 2006), Ettema et al. 2003, HEC-11 (Brown and Clyde, 1989), HEC-23 (Lagasse et al., 2001), NCHRP Report 587 (Barkdoll et. al., 2007), and Melville et al., 2007). Although the articles name the failure mechanisms slightly differently, all describe the same three processes. First is the dislodging of riprap particles due to excessive shear stress on the riprap mat (shear failure). Second is the erosion of fines through the void spaces in the riprap mat (winnowing). Third is scour at the edges of the mat. Shear failure can be prevented with properly sized riprap stones and winnowing is prevented with a proper filter under the riprap.
NCHRP Report 587 presents an extensive discussion on scour at the edges of the riprap mat. Scour leads to several other types of riprap failures, including dislodgement, slump, and sliding. The type of riprap failure depends in part on the location of the abutment slope with respect to the main channel and the floodplain; however, the scour hole follows a similar pattern. Scour holes tend to form at the toe of the riprap mat at the downstream end of the abutment slope.
Experiments performed for NCHRP Report 587 included the evaluation of various countermeasures (large blocks, large geobags, and blocks with geobags) with different wing wall or abutment alignments. In a flume at the research facility, wing walls or abutments were constructed in the floodplain and into the channel. Flow velocities and depths were varied in order to initiate failure of the countermeasure and the scour hole was mapped and evaluated at the end of each test.
NCHRP Report 587 also draws a connection between vorticity strength and scour. As water flows through a spill-though abutment, small horizontal vortices form at the upstream end of the abutment due to the flow constriction. The variable water depth caused by the abutment side slope also initiates vertical vortices. In addition, the expansion at the downstream end of the abutment slope generates much larger vortices. This downstream vortex is the key parameter for the formation of the downstream scour hole. NCHRP Report 587 concludes that the deepest scour location forms in the floodplain at a 30 degree angle to the downstream direction. This location corresponds to the location of the positive/negative vorticity. The report also concludes that riprap aprons around an abutment prevent the initiation of scour at the toe. The scour hole is then deflected downstream, where it is typically smaller than a scour hole that could develop immediately downstream of the abutment.
2.1.2 Traditional Riprap Design Methods Bridge scour and countermeasures are discussed in detail in HEC-18 (Richardson and Davis, 2001) and HEC-23 (Lagasse et al., 2001).Traditional (non-grouted) riprap design methods are presented in HEC-11 (Brown and Clyde, 1989). Design Guideline 8 in the HEC-23 document discusses the procedure for design of sizing rock riprap at bridge abutments. The design guidance is based on two research studies completed in 1991 and 1993 to determine equations for the sizing of the riprap (Pagan-Ortiz, 1991, and Atayee, 1993). The Design Guideline recommends using one of two equations to estimate riprap size, based on the Froude Number for the channel.
For Froude Numbers less than or equal to 0.8, t
𝐷50
he
=
f
oll
𝐾𝑆
ow
1�𝑉
𝑦 −
ing
𝑔𝑦
e2
quation is recommended:
𝑠�
Where:
D50 = median stone diameter (ft)

4
V = characteristic average velocity in the contracted section (ft/s)
Ss = Specific gravity of rock riprap
g = gravitational acceleration (32.2ft/s2)
y = depth of flow in the contracted bridge opening (ft)
K = 0.89 for a spill-through abutment (1.02 for a vertical wall abutment)
For Froude Numbers greater than 0.8, the fo
5
l
0
lowing equation i2 0.
s1
r4
ecommended:
Where the parameters are as defined abov
𝐷
e, ex
=
pec
t𝑠
:
𝐾�𝑉�
K = 0.61 for spill-through abutment
𝑦
s (0.69 f
𝑆 −
or
1
ve
𝑔𝑦
rtical wall abutments)
The Design Guideline also includes recommendations for estimating the characteristic average velocity. This velocity depends on the set-back ratio of the abutment and the set-back length of the abutment. The set-back length of the abutment is defined as the distance from the ear edge of the main channel to the toe of the abutment. The set-back ratio can then be calculated by dividing the set-back length by the average channel flow depth.
The set-back ratio is then used to decide how to calculate the flow and area when using flow divided by area to calculate velocity. If the set-back ratio is less than five for the abutments, the entire contracted area should be considered. If the set-back ratio is greater than five for the abutments, the overbank section only should be considered. Additional details are given in the guidelines for scenarios when the set-back ratio for one abutment is greater than five and for the other abutment is less than five.
The recommended extent of rock riprap is also defined in the Design Guideline 8, including how far riprap should extend from the toe of the abutment, how far riprap should extend up the slope of the abutment, the thickness of the riprap, and the use of underlying filter material.
2.1.3 Characterizing Riprap Size, Shape, Angularity, and Percent Grout for Matrix Riprap Design recommendations for the rock riprap, grout, and the filter material for matrix riprap at piers, were provided in the NCHRP Report 593. Although piers and abutments interact with the channel differently, optimum matrix riprap characteristics will likely be similar. Recommendations given in the report for piers provided a useful starting point for the abutment analysis.
Angular rock was preferred, which provides greater stability over rounded riprap. The suggested length to thickness ratio was less than or equal to 3.0. The standard gradations recommended for use for matrix riprap applications are: USCOE Class II, Class III, and Class IV, with d50 of 8.5 to 10.5, 11.5 to 14.0, and 14.5 to 17.5 inches, respectively. These approximately translate to MnDOT riprap Classes III, IV, and V, respectively. The NCRHP Report maintains that riprap gradations smaller than these classes have void spaces that are too small for the grout to penetrate. Riprap gradations larger than these classes do not have enough contact between the stones and void spaces are too large to retain the grout.
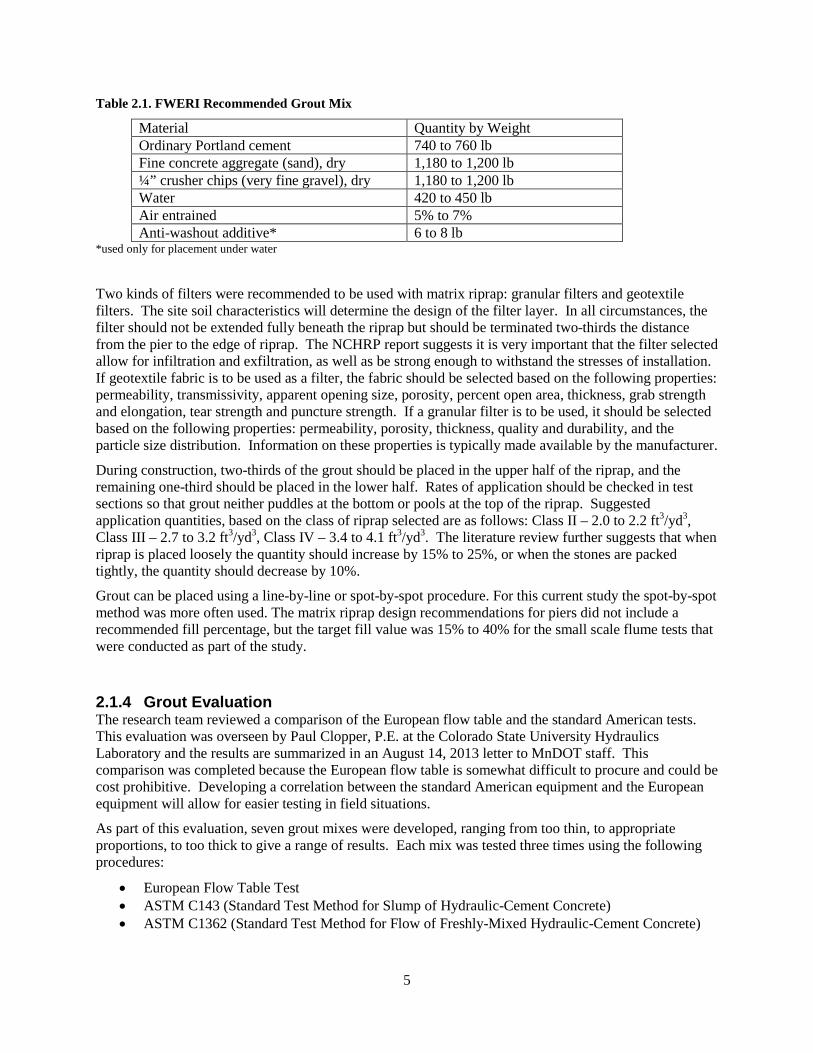
Portland cement-based grout is recommended with a mix based on design guidance from the Federal Waterway Engineering and Research Institute in Germany. The mix density should range from 120 to 140 lb/ft3. Table 2.1 gives guidance on the recommended grout mix. Standard tests are recommended to check the rock and grout quality before use on a site.
5
Table 2.1. FWERI Recommended Grout Mix
Material Quantity by Weight Ordinary Portland cement 740 to 760 lb Fine concrete aggregate (sand), dry 1,180 to 1,200 lb ¼” crusher chips (very fine gravel), dry 1,180 to 1,200 lb Water 420 to 450 lb Air entrained 5% to 7% Anti-washout additive* 6 to 8 lb
*used only for placement under water
Two kinds of filters were recommended to be used with matrix riprap: granular filters and geotextile filters. The site soil characteristics will determine the design of the filter layer. In all circumstances, the filter should not be extended fully beneath the riprap but should be terminated two-thirds the distance from the pier to the edge of riprap. The NCHRP report suggests it is very important that the filter selected allow for infiltration and exfiltration, as well as be strong enough to withstand the stresses of installation. If geotextile fabric is to be used as a filter, the fabric should be selected based on the following properties: permeability, transmissivity, apparent opening size, porosity, percent open area, thickness, grab strength and elongation, tear strength and puncture strength. If a granular filter is to be used, it should be selected based on the following properties: permeability, porosity, thickness, quality and durability, and the particle size distribution. Information on these properties is typically made available by the manufacturer.
During construction, two-thirds of the grout should be placed in the upper half of the riprap, and the remaining one-third should be placed in the lower half. Rates of application should be checked in test sections so that grout neither puddles at the bottom or pools at the top of the riprap. Suggested application quantities, based on the class of riprap selected are as follows: Class II – 2.0 to 2.2 ft3/yd3, Class III – 2.7 to 3.2 ft3/yd3, Class IV – 3.4 to 4.1 ft3/yd3. The literature review further suggests that when riprap is placed loosely the quantity should increase by 15% to 25%, or when the stones are packed tightly, the quantity should decrease by 10%.
Grout can be placed using a line-by-line or spot-by-spot procedure. For this current study the spot-by-spot method was more often used. The matrix riprap design recommendations for piers did not include a recommended fill percentage, but the target fill value was 15% to 40% for the small scale flume tests that were conducted as part of the study.
2.1.4 Grout Evaluation The research team reviewed a comparison of the European flow table and the standard American tests. This evaluation was overseen by Paul Clopper, P.E. at the Colorado State University Hydraulics Laboratory and the results are summarized in an August 14, 2013 letter to MnDOT staff. This comparison was completed because the European flow table is somewhat difficult to procure and could be cost prohibitive. Developing a correlation between the standard American equipment and the European equipment will allow for easier testing in field situations.
As part of this evaluation, seven grout mixes were developed, ranging from too thin, to appropriate proportions, to too thick to give a range of results. Each mix was tested three times using the following procedures:
• European Flow Table Test • ASTM C143 (Standard Test Method for Slump of Hydraulic-Cement Concrete) • ASTM C1362 (Standard Test Method for Flow of Freshly-Mixed Hydraulic-Cement Concrete)

6
• ASTM D6449 (Standard Test Method for Flow of Fine Aggregate Concrete for Fabric Formed Concrete)
The evaluation developed a correlation between the European Flow Table Test and the three ASTM tests. The evaluation focused more the results of the European Flow Table test after the 15 taps, since this represents the condition at which the grout will be applied.
Of the three ASTM tests, the ASTM C143 slump test presented the best correlation to the European Flow Table, when slump (in inches) was graphed against the diameter of the grout after 15 taps (in centimeters). The R-squared value for this correlation was 0.89. Using the ASTM C1362 method of testing was determined to not be appropriate for testing grout used for matrix riprap because the larger aggregate limited the ability to accurately repeat the test. ASTM D6449 also was not appropriate for matrix riprap grout because the pea size gravel caused clogging of the flow cone nozzle.
The letter concludes that ASTM C143 can be used, with caution, to test grout for Matrix riprap. The author recommends that more studies be completed, but also states that using grout with a slump between 6.5 and 7.5 inches would be appropriate for matrix riprap installation. The author also recommends that the European Flow Table Test and ASTM C143 be used to test the grout and the results of the tests be recorded in a database so a better conclusion can be drawn from their correlation.
The letter further states that the ratio of fine to coarse aggregate in the grout mix had a marked effect on the flowability of the grout, because the sand is more likely to bind to the water more closely. Because of this, the author recommends that further evaluation of the grout mix using very little coarse aggregate be completed to evaluate the flowability of the grout. This may help reduce the potential for clogging of the grout pump during application.
Lastly, the letter recommends a few modifications to the MnDOT special provision 2511 document regarding the implementation of matrix riprap. These comments are on the use of language for riprap sizes, the description of the consistency of the grout and a suggestion to add language regarding grout delivery rate.
2.1.5 Summary of Supplementary Documents A number of supplementary documents were reviewed as part of the literature review. These documents discussed in detail scour countermeasures other than matrix riprap, discussed countermeasures around bridge piers, or summarized information in the NCHRP Reports 587 and 593. The information in these documents were not directly applicable to the current study, however they have been summarized in this section to offer a comprehensive list of documents related to the subject of scour countermeasures. The supplementary documents are summarized by publication date.
Tentative Design Procedure for Riprap-Lined Channels (Anderson, 1970): This NCHRP report summarizes previous studies completed regarding tractive forces and sediment transport as they relate to erosion issues in roadside ditches. The report also summarizes experimental testing completed to help develop design criteria and design procedures when using riprap lining or aggregate in channels. The study focused on areas where more erosion protection is needed than grass only lined channels, but velocities are not so high that a paved channel is needed.
Tentative Design Procedure for Riprap-Lined Channels-Field Evaluation (Anderson, 1973): This report summarizes the second phase in developing the design criteria and procedures for riprap lining. This field evaluation looked at four channels which have riprap constructed as outlined in the NCHRP report. At the time of the evaluation, two of the channels had discharges that had approached design velocities prior to the evaluation. The evaluation showed that the riprap limited the erosion in the channels.

7
Design and Construction of Grouted Riprap (USACE, 1992): This USACE design document provides guidance for the design and construction of grouted riprap used as a countermeasure. The document covers application, design considerations, limitations, construction considerations and procedures.
Riprap Performance at Bridge Piers Under Mobile-Bed Conditions (Toro-Escobar, 1998): This paper summarizes research completed by the University of Auckland, Nanyang University, and St. Anthony Falls Laboratory, where riprap was subject to mobile bed conditions instead of clear water conditions. The studies helped to suggest improvements in the installation guidelines for riprap and the underlying geotextile so it less likely to fail during flood, which is more realistically represented by mobile bed conditions.
Countermeasures to Protect Bridge Piers from Scour – Volume 1, User’s Guide (Parker, 1999): This report summarizes the NCHRP Project 24-7 where flow altering countermeasures and armoring countermeasures were evaluated for effectiveness in reducing scour. The countermeasures discussed include riprap with and without prior excavation and with and without geotextile or granular filter, cable tied blocks, grout filled bags, and gabions. Volume 1 of this document provides design recommendations for these countermeasures.
Scour Countermeasures Using Geosynthetics and Partially Grouted Riprap (Heibuam, 2000): This paper describes different countermeasures, discussing materials used for cover layers (the part of the countermeasure that provides the resistance against hydrodynamic loads), filters (required if a permeable system is used), and fill (sometimes needed to fill a scour hole before the countermeasure can be installed). The paper discusses the special condition of placing granular material, geocontainers, geotextiles and mattresses, or partially grouted riprap underwater.
An Overview of Scour Types and Scour-Estimation Difficulties Faced at Bridge Abutments (Ettema, 2003): This paper discusses the unique issues regarding estimating scour at bridge crossings because of the flow field, varied sediments and soils, and the different types of potential failure modes found at bridge abutments. The paper also goes into detail of the different scour types that can form, and how flume experiments have limitations when trying to replicate different field conditions.
Riprap Design Criteria, Recommended Specifications, and Quality Control (Lagasse, 2006): This document is the NCHRP Report 568, associated with NCHRP Project 24-23. The purpose of the project was to develop guidelines for the construction and inspection of riprap, recommend test methods during application, and determine specifications for materials and construction. The guidelines are intended to cover application of riprap within streams and at bridge piers and abutments. The project did not include new laboratory experiments, but included a thorough literature review, survey of practitioners, evaluation of current design equations and comparison of riprap design results to field applications.
Countermeasure Toe Protection at Spill-Through Abutments (Melville, 2006): This paper summarizes a study that evaluated how scour hole geometry varies when modifying a floodplain, bridge abutment geometry, or the extent and type of scour countermeasure. This study did not consider “when” a countermeasure would fail, but only “how” a scour hole changes based on the variations that were evaluated. This paper also presents a method to estimate the local scour hole formation based on the spill-through bridge abutment geometry and the selected countermeasure.
Riprap Size Selection at Wing-Wall Abutments (Melville, 2007): This paper summarizes a study that evaluated riprap stability at wing-wall abutments. Riprap sizes were selected using design calculations then the calculated sizes were compared to sizes used during the study experiments. Two of the four design equations used for calculating riprap size, when incorporating factors of safety, were shown to be adequate in selecting riprap sizes that would resist shear failure in an experimental setting.
Geobag Performance as Scour Countermeasure for Bridge Abutments (Korkut, 2007): This paper summarizes a number of laboratory experiments completed to evaluate geobags as a countermeasure around bridge abutments. The experiments focused on geobags placed as an apron around wing-wall

8
abutments. Studies showed that scour could not be eliminated completely by the use of geobags, but that the geobags are a potential alternative to using standard riprap. This study was part of NCHRP Project 24-18, Scour Countermeasures for Bridge Abutments.
Integrating European Partially Grouted Riprap for Stream Stability and Bridge Scour Protection (Girard and Clopper, 2008): This paper summarizes the work that completed as part of NCHRP Project 24-07 “Countermeasures to Protect Bridge Piers from Scour” (NCHRP Report 593) which was one of the more significant resources used for this project. The paper also discusses the design concepts in NCHRP Report 568, which considers bioengineering or hybrid designs for stream stabilization. The report also discusses the placement of grout underwater.
Partially Grouted Riprap as a Pier Scour Countermeasure (Lagasse, 2008): This paper discusses work completed with regards to partially grouted riprap as a countermeasure under the NCHRP Project 24-07(2), “Countermeasures to Protect Bridge Piers from Scour.” The paper focuses on the design of the countermeasure, the grouting materials and methods, filter recommendations, and underwater placement.
Protecting Vertical-Wall Abutments with Riprap Mattresses (Cardoso, 2009): This document summarizes experiments on near vertical-wall bridge abutments using riprap mattress for scour protection. The study varied the thickness of the mattresses, their lateral extent of the mattress away from the abutment, and the diameter of the riprap. These modifications were evaluated to see how they affected the scour holes that developed at the edge of the countermeasure.
Influence of Riprap Apron Shape on Spill-Through Abutments (Gonzalo, 2012): This document summarizes a set of experiments where riprap apron geometries were modified and the apron width and total riprap volume needed for stability were evaluated. In these experiments, it was found that a modified geometry of widening the downstream apron where failure usually occurs, could allow for a reduction in riprap volume of up to 25%.
MnDOT Special Provision S-1 (2511) Random Riprap Special (MnDOT, 2014):. This document amends the MnDOT special provision 2511 to provide details on matrix riprap construction including: what materials to use for riprap, grout, and filter, the grout mix design, the grouting method and application, quality assurance techniques, and measurement and payment. MnDOT is working towards making this a standard specification.

9
3.0 Site Visit On May 16, 2012, a site visit was conducted by the research team to observe placement of matrix riprap under Bridge No. 48030 in Milaca, MN. This bridge is on State Highway 23 over the Rum River. The motivation for using matrix riprap in this situation was prevention of vandalism (i.e. unwanted removal of movement of the stones by people), however application procedures and site conditions closely mimicked other sites, which may require the use of matrix riprap.
Prior to observing the application of the grout at the site, an hour workshop on matrix riprap implementation was given to the participants by Paul Clopper, P.E., one of the authors of the NCHRP Report 593. The presentation covered Design Guideline 12, which is the application guideline for matrix riprap. The objective of the workshop was to give participants a better understanding of the advantages of matrix riprap, to discuss the design considerations for application, and to practice designing the countermeasure using an example bridge pier. Workshop handouts included a copy of Design Guideline 12, copies of the presentation slides, and a scour countermeasure matrix which rates the functional application and the suitability for a river environment of a number of different countermeasures.
The riprap at the Rum River Bridge ranged from 9 to 15 inches and was more rounded than typical riprap. Grout was placed by MnDOT District 3 traffic and maintenance personnel. A grout pump was used to deliver the grout through a 2.5-inch diameter grout hose from the road deck down to the bridge abutment. Grout was placed at the contact point between stones, with some grout going into the voids to allow for connection of lower stones. Grout placement was overseen by of Paul Clopper.
Figures 3.1 and 3.2 are photographs showing the placement of the grout during the installation. The flow rate of the grout pump did present some issues with the accuracy of grout placement. Typically the grout is pumped onto the stone within inches of the stone surface, but the high flow rate required the person applying the grout to stand back several feet, which resulted in grout splashing over the surface of the stone. The finished surfaces at this installation are not ideal. Please see more representative images in Appendix B.
Figure 3.1 -Grout application at Bridge No. 48030, Milaca, MN

10
Figure 3.2 - Matrix riprap at Bridge No. 48030, Milaca, MN

11
4.0 Out-of-Flume Materials Tests The “Out-of-Flume Material Tests” describe the phase of testing that investigated the application and installation of matrix riprap at full scale. These experiments were conducted outside of a flume environment. Application of the grout in a controlled setting provided the opportunity to analyze grout penetration into the riprap and resulting void space. Of particular interest was how the application technique influenced the overall grout fraction used for the matrix and the grout penetration depth.
Mechanical pull/ultimate strength tests were also conducted as a first attempt to evaluate and quantify matrix riprap strength.
4.1 Out-of-Flume Apparatus and Procedures
4.1.1. Facilities and Riprap The Out-of-Flume testing was conducted in constructed lumber boxes designed specifically for the tests. Eight boxes were constructed with the dimensions 48 inches (L) x 48 inches (W) x 15 inches (H) and were lined with an ethylene propylene diene monomer (EPDM) liner so they would be watertight. A PVC stand pipe was installed in the corner of each box to allow water depth measurements. Figure 4.1 shows the box configuration.
Class I and Class II limestone rock riprap obtained from a local quarry was investigated in this phase. The size and gradation of the stones met the MnDOT standard definition for Class I or Class II riprap. The riprap material was hand-placed into the testing box with depths equivalent to several D50 diameters. For the Class I riprap the stone was placed at a depth of 9 inches and for the Class II riprap stone was placed at a depth of 12 inches.
Figure 4.1. Example Out-of-Flume test box configuration.

12
4.1.2. Grout Mixture and Quality Assurance MnDOT Special Provision (S-1) 2511 (Random Riprap (Matrix)) includes the specifications for matrix riprap grout, and a summary table of this specification is provided in Table 4.1. This grout mix is designed to be used with Class III to Class V riprap. Through preliminary testing it was determined that MnDOT special provision did not work well for the Class I and Class II riprap as it limited grout penetration. The grout mixture was therefore modified with approximately the same weight fractions of portland cement to coarse grains and water and was mixed to the similar slump as specified by the MnDOT standard.
The MnDOT special provision calls for 0.25-inch rock chips added to the mixture, while the modified mixture excluded the rock chips but added an equivalent amount of sand (25.5%wt.). The water fraction was approximately 13.5%wt. and was adjusted up or down to meet the slump specification. Portland cement was used and air entrainment was not considered for these tests. The modified grout mixture used in the testing is summarized in Table 4.2. Batches were mixed in 200 lb quantities. Table 4.2. MnDOT Special Provision (S-1) 2511 Grout Mixture.
Material Material Specification Quantity (lbs) Percent of total (%wt)
portland cement 3101 740 to 760 21
fine aggregate (sand), dry 3126 1180 to 1200 33
¼” crusher chips, dry 3137 CA-80 1180 to 1200 33
Water 3906 420 to 450 12
air entrainment 3113 8 to 12% - * Reproduced from MnDOT Special Provision (S-1) 2511 (Random Riprap (Matrix))
Table 4.3. Summary of modified grout mixture.
Material Quantity (lbs) % of Total Weight portland cement 6.375 26 sand, dry 15.25 60 Water 3.375 14
Quality assurance procedures in the MnDOT special provision call for the grout to be tested for “consistency”. The procedure involves using a special slump cone and table apparatus (Figure 4.2) to measure: a) the spread of the grout when the cone is simply lifted vertically away and b) the spread of the grout further when the table is “tapped” 15 times. A single “tap” is lifting the table 1.5-inches and allowing it to drop back to its resting position. The target values for the grout consistency (slump) test are as follows:
• 13.4 to 15 inches (34 to 38 cm) diameter, no tapping of the table • 19.7 to 21.25 inches (50 to 54 cm) diameter, 15 taps of the table
13
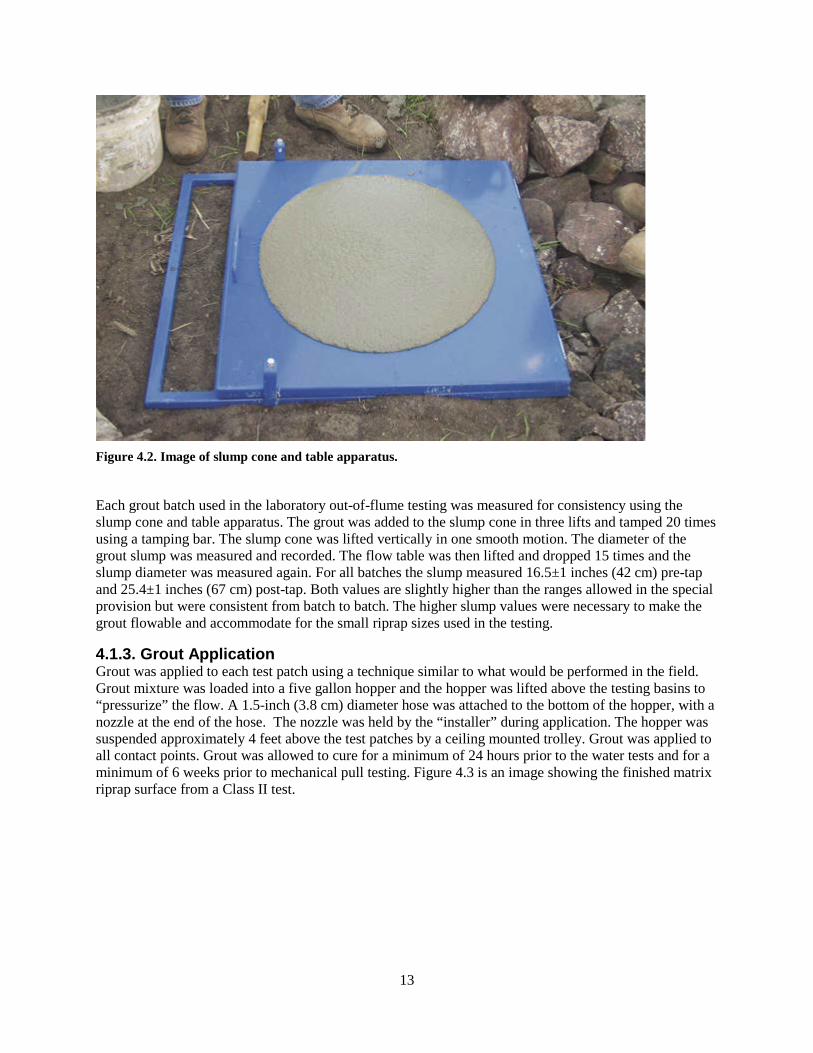
Figure 4.2. Image of slump cone and table apparatus.
Each grout batch used in the laboratory out-of-flume testing was measured for consistency using the slump cone and table apparatus. The grout was added to the slump cone in three lifts and tamped 20 times using a tamping bar. The slump cone was lifted vertically in one smooth motion. The diameter of the grout slump was measured and recorded. The flow table was then lifted and dropped 15 times and the slump diameter was measured again. For all batches the slump measured 16.5±1 inches (42 cm) pre-tap and 25.4±1 inches (67 cm) post-tap. Both values are slightly higher than the ranges allowed in the special provision but were consistent from batch to batch. The higher slump values were necessary to make the grout flowable and accommodate for the small riprap sizes used in the testing.
4.1.3. Grout Application Grout was applied to each test patch using a technique similar to what would be performed in the field. Grout mixture was loaded into a five gallon hopper and the hopper was lifted above the testing basins to “pressurize” the flow. A 1.5-inch (3.8 cm) diameter hose was attached to the bottom of the hopper, with a nozzle at the end of the hose. The nozzle was held by the “installer” during application. The hopper was suspended approximately 4 feet above the test patches by a ceiling mounted trolley. Grout was applied to all contact points. Grout was allowed to cure for a minimum of 24 hours prior to the water tests and for a minimum of 6 weeks prior to mechanical pull testing. Figure 4.3 is an image showing the finished matrix riprap surface from a Class II test.

14
Standpipe used to take water elevation measurements
Figure 4.3. Image of a box after filled with riprap and grouted.
4.1.4 Void Volume and Grout Measurements Prior to installing riprap material into the boxes, a water volume-depth relationship was developed for each box. This relationship was used to determine the void space within the riprap before and after application of grout.
Starting with an empty box, a measured weight of tap water was incrementally added to the box. After each addition of water, the water depth in the box was measured within the standpipe to the nearest 0.1 inches (0.25 cm). This cycle was repeated until the box was full. Water weight was converted to water volume by the unit weight of 62.4 lb/ft3 at temperature of 22 degrees C. The results yielded volume-depth data for each box.
Water was drained from the box and the process was repeated once the riprap was placed in the box to determine the volume of the riprap. Water was drained from the box, and after the riprap had dried, grout was applied to the riprap based on the MnDOT special provision. Twenty-four hours after the grout was applied, water was incrementally added and measured again to determine the volume of the grout used in the matrix riprap. The change in the volume of water between the three measurements (empty box, riprap, and matrix riprap) was used to determine how much grout was applied for each out-of-flume evaluation. An example of the volume-depth relationship developed for one of the boxes is shown in Figure 4.4.

15
Figure 4.4. Example of volume-depth relationship developed for testing box.
Using the information illustrated in Figure 4.4, the following quantities, varying by depth, were computed:
• Volume of riprap – determined by subtracting the water volume measured for riprap-no grout from the water volume measured for water only. The difference represents the cumulative rock volume with depth from bottom.
• Volume matrix riprap (riprap and grout) – determined by subtracting the water volume measured for riprap with grout from the water volume measured for water only.
• Volume of grout – determined by subtracting the volume in riprap with grout from volume of riprap-no grout.
4.2 Out-of-Flume Results Testing was performed on both Class I (D50 = 3 inches) and Class II (D50 = 6 inches) riprap and this section summarizes the results from the Out-of-Flume tests. For Class I riprap tests, three valid box tests were performed and for Class II riprap, eight valid box tests were performed. The results below are based on these tests.
The riprap and grout volume results are summarized in Section 4.2.1. The void volume and grout fraction results are summarized in Section 4.2.2 and the porosity and grout fraction results are summarized in Section 4.2.3. Measured or calculated values are plotted against the depth in the box allowing conclusions to be drawn about how the properties of the matrix riprap change from the surface through the entire depth of the riprap.

16
4.2.1 Riprap and Grout Volume The computed incremental riprap and grout volume by depth are summarized in Figures 4.5 and 4.6. Depth in the box is plotted along the y-axis, with the surface of the riprap at depth zero. The volume of riprap and grout were calculated as described in Section 4.1.4.
Results show that for Class I riprap, penetration of the grout reached 4-5 inches of depth. For the Class II riprap however, the penetration was fairly even throughout the depth of the box. Results from the Class II evaluation also indicate that some grout penetrated to the bottom of the test tank as seen by an increase in grout volume at 12 and 13 inches of depth. Grout was able to penetrate further in the Class II riprap case because of the larger void spaces with that size of riprap. Both Class I and Class II stones had an incremental rock volume in the range of 0.6-0.8 ft3.
Figure 4.5. Class I rock and grout volume summary.

17
Figure 4.6. Class II rock and grout volume summary.
4.2.2 Voids Volume and Grout Fraction Results The voids volume is the volume of space between the stones of the riprap material. One would expect the voids volume of riprap alone would be greater than that of matrix riprap since grout will penetrate and fill in void space. Figure 4.7 shows the average riprap and matrix riprap voids volume computed for all of the Class I tests. The plot shows the computed mean values as well as one standard deviation below and above the mean. The difference between the riprap and matrix riprap voids volumes is due to the volume of grout added; a larger difference in between riprap and matrix riprap suggests that more grout takes up void space at the measured depth.
The data suggests that penetration of the grout reached approximately 4 - 5 inches for Class I riprap or (~1.5*D50). At this depth, the average voids volume becomes similar between the riprap and matrix riprap. Above 4 - 5 inches, the presence of grout is detected in the reduced voids volumes of the matrix riprap.

18
Figure 4.7. Class I voids volume summary.
For Class II material, which is twice the size as Class I, the grout was able to penetrate more evenly into the riprap because of the larger void space. Figure 4.8 shows that the matrix reduced the voids volume evenly throughout the 14 inches of depth examined in this study.
Figure 4.8. Class II voids volume summary.

19
4.2.3 Porosity and Grout Fraction Porosity is defined as the ratio of pore space to the total volume of material, including all solids and voids. For the out-of-flume tests, it is defined as the ratio of the voids volume to the volume of the box facility. Grout fraction is defined as the ratio of grout applied to the total volume of box facility.
Figures 4.9 and 4.10 summarize computed porosity and grout fraction for Class I and Class II riprap, respectively. Porosity is large at the surface of the riprap or matrix riprap since the void space increases with the open surface at the top of the riprap. Porosity in both Class I and Class II riprap tests ranges between 0.4-0.5 for riprap. Porosity decreases to 0.3-0.4 for matrix riprap for both Class I and Class II riprap tests. Grout fractions in Class I riprap tests ranged between 0-0.4 with a mean around 0.25-0.3 for the region of penetration. Class II grout fraction was about 0.2 for the region from 0-11 inches below the surface and increased up to 0.6 at the bottom of the test box.
Figure 4.9. Class I porosity and grout fraction summary.
20
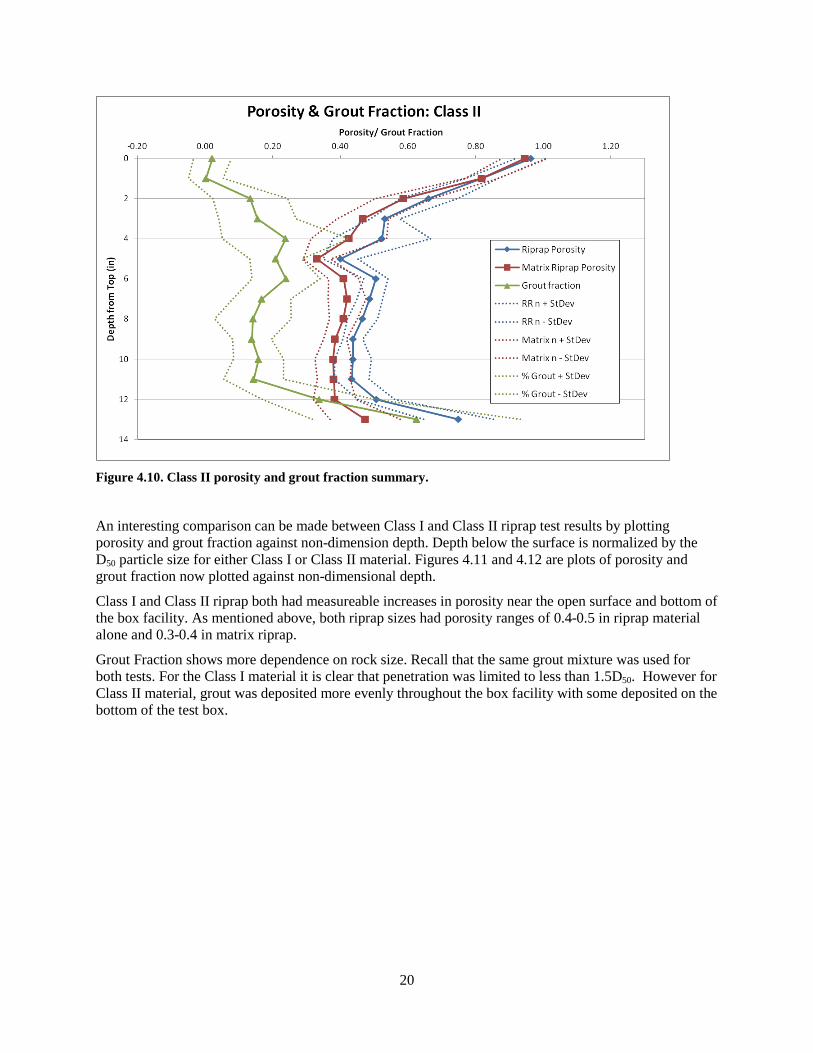
Figure 4.10. Class II porosity and grout fraction summary.
An interesting comparison can be made between Class I and Class II riprap test results by plotting porosity and grout fraction against non-dimension depth. Depth below the surface is normalized by the D50 particle size for either Class I or Class II material. Figures 4.11 and 4.12 are plots of porosity and grout fraction now plotted against non-dimensional depth.
Class I and Class II riprap both had measureable increases in porosity near the open surface and bottom of the box facility. As mentioned above, both riprap sizes had porosity ranges of 0.4-0.5 in riprap material alone and 0.3-0.4 in matrix riprap.
Grout Fraction shows more dependence on rock size. Recall that the same grout mixture was used for both tests. For the Class I material it is clear that penetration was limited to less than 1.5D50. However for Class II material, grout was deposited more evenly throughout the box facility with some deposited on the bottom of the test box.

21
Figure 4.11. Porosity for Class I and Class II tests against dimensionless depth.
Figure 4.12. Grout fraction for Class I and Class II tests against dimensionless depth.

22
4.3 Mechanical Pull Tests
4.3.1 Mechanical Pull Test Apparatus and Procedures Mechanical pull tests were conducted on the Class II matrix riprap to provide a simple “first pass” estimate of the strength of matrix riprap. The testing involved vertical and horizontal loading of the matrix riprap constructed for the out-of-flume tests. Tests were conducted on a) grout, b) simulated fractured grout and c) riprap only (no grout). It should be noted that the loading situation of this testing differs from the hydraulic loading of an open channel situation (e.g. no buoyancy effect, lift, drag or rotational loading, particle hiding effects).
The test patches were loaded using a 0.5-ton capacity electric hoist, steel chain and cable, and a 430 lb capacity digital pull scale (Figure 4.13). When possible, the steel cable was wrapped around the stone. If it was not possible to wrap the cable around the stone, the cable was attached to an eye-bolt embedded in the stone using 0.5 inch threaded anchor. The electric hoist was used to apply a load on the rock and a digital pull scale displayed the load weight on the stone. The stones were loaded until either they failed or until the maximum load was reached for the scale/hoist.
Figure 4.13. Mechanical pull test apparatus and anchoring system.
4.3.2 Mechanical Pull Test Results
Horizontal Loading To test horizontal loading, stones were pulled horizontally by the electric hoist/scale apparatus. Test 1 involved evaluating loading on grouted Class II stone within the box. As set up, the horizontal load exceeded the capacity of the scale. Since the capacity of the scale was exceeded, to avoid breaking the

23
scale, the scale was removed and the hoist was directly connected to the stone. Maximum loading was applied, however the entire box test facility was dragged across the floor with no failure of the grout. The estimated load required to pull the test facility exceeded 550 lbs therefore the failure load is listed at exceeding 550 lbs.
The test was repeated on fractured matrix riprap (Test 2) and riprap only (Test 3). In Test 2 the grout was cracked using a hammer prior to the start of the test. Test 3 loaded the stone prior to adding matrix. For both Test 2 and Test 3, the horizontal load was well below the matrix situation.
Results of the horizontal pull tests are summarized in Table 4.3 below. Table 4.4 Horizontal pull test results.
Stone Size Force Attachment
# Type (in) (lb) Failure Method
1 Matrix 4x6x3 >550* No wrap
2 Released Matrix 7x7x4 40 yes eyebolt
3 Traditional 4x6x3 20 yes eyebolt * Load estimated based on computed forces required to move the box test facility.
Vertical Loading The vertical loading tests repeated the horizontal pull tests, except the stones were pulled in an upwards direction. Only matrix riprap and fractured matrix riprap were evaluated for the vertical loading. The vertical pull tests yielded vertical ultimate strengths ranging from 31 lbs to in excess of 430 lbs. For fractured matrix (Test 8), the vertical strength of a surface stone was on the order of magnitude of the stone’s weight, which would be the similar force required to lift conventional riprap. For the Class II riprap, typical stone weights were less than 10 lbs. For matrix riprap, the vertical strength ranged widely from 51 lbs to the maximum of the digital balance of 430 lbs. Table 4.4 summarizes the results of the vertical loading tests. The table lists the number of grouted seams along the pulled stone, or the number of joint surfaces that were grouted. The data indicates that there is a strong correlation between the amount of grout (i.e. grouted seems) and the vertical strength. Table 4.5. Vertical pull test results.
Stone Force Attachment Grouted # Type Size (in) (lb) Failure Method Seams
1 Matrix 10x7x5 430 no eyebolt 32 Matrix 4x6x3 202 no eyebolt 23 Matrix 9x5x3.5 155 yes eyebolt 14 Matrix 7x7x4 90 yes eyebolt 15 Matrix 10x7x4 51 yes wrap 16 Matrix 5x7x4 200 yes wrap 17 Matrix 7x7x4 420 no wrap 38 Fractured Matrix 8x6x4 31 yes eyebolt 19 Matrix 12x9x4 55 yes eyebolt 1
* Load exceeded maximum capacity of digital scale of 430lbs.

24
4.4 Out-of-Flume Conclusions and Discussion In this phase of the project, tests were conducted in special test “boxes”. The boxes were water tight and calibrated prior to the start of testing, yielding volume-depth relationships for each box. The boxes were then filled with either Class I or Class II riprap, and volume-depth relationships were developed. Finally, grout was added to the riprap creating matrix riprap. The grout used was a modified grout mixture based on MnDOT special provision and adjusted for the finer grained riprap used in this study. The grout was placed in a method similar to what is specified for field application, using a similar pressurized hose application setup and welding contact points as described in MnDOT special provision for matrix riprap. A final volume-depth relationship was developed for the matrix riprap.
Using the volume-depth data collected, various plots were generated for riprap and matrix riprap volume, voids volume, grout fractions, and porosity. Data was plotted as incremental quantities depth from surface and against dimensionless depth normalized against the D50 particle size.
The matrix riprap box tests used to evaluate the grout penetration into the riprap were also used to begin to try to quantify the strength of the matrix riprap. Mechanical pull tests in horizontal and vertical directions were completed and estimates of the strength of the riprap were summarized.
Key findings from the Out-of-Flume tests suggest the following:
• The porosity of the matrix riprap ranged between 0.3 and 0.4 which is decreased slightly from conventional riprap where porosities were measured in the range of 0.4-0.5.
• Penetration of grout into the riprap is dependent on grainsize of the riprap. For finer Class I riprap, the penetration was limited to about ~1.5D50. For Class II, the grout was able to penetrate to the bottom of the test facility. In the latter case the grout distribution was fairly even throughout the vertical.
• Mechanical pull tests suggest that the addition of matrix to traditional riprap increases the stone strength by an order of magnitude. However, the mechanical pull tests are not representative of the loading mechanism expected in practice. The mechanical pull tests do indicate that grout fracturing greatly reduces matrix riprap strength. The influence of weathering and fracturing will play an important role in the long term performance of matrix riprap.
Discussion The depth of penetration of grout into the riprap is important for understanding the protection offered by this countermeasure. The Class I tests resulted in a matrix riprap characterized by a strong upper surface or “shell” over conventional riprap where the Class II matrix had a deeper matrix layer with lower grout fraction but greater penetration. The Out-of-Flume tests did not characterize or quantify the strength of these two types of grout distributions. Pull tests indicate that greater strength is correlated with quantity of grout on a stone. Penetration of grout provided protection of the countermeasure system beyond the surface layer. In other words, if only the surface layer is strengthened with grout, the lower layers of riprap will be unprotected should the surface layer fail.

25
5.0 Hydraulic Flume Experiments Summary In this section we describe a series of experiments in the SAFL Tilting Bed Flume, with the overall goal of exploring the failure mechanisms and strength of matrix riprap. Several flume arrangements were developed using a spill-through abutment configuration and two riprap sizes. Through these tests it was determined that the matrix riprap was stronger than anticipated and exceeded the maximum permissible velocities of the flume. This section describes the experiments completed in the Tilting Bed Flume. Section 6 discusses a new flume that was constructed with steeper slopes and the greater hydraulic capabilities to further test the capabilities of the matrix riprap.
5.1 Background and Motivation The major objective of this project was to design and carry out physical hydraulic experiments exploring the performance of matrix riprap as a scour countermeasure for spill-through abutments. The goals for this phase of the project were as follows:
• Develop a test design based on typical crossings at Minnesota state bridges. • Develop an appropriately scaled surrogate for matrix riprap grout that can be used at small scales
and demonstrates the failure threshold and mechanisms for matrix riprap failure. • Conduct physical model testing in the SAFL Tilting Bed Flume of a spill-through abutment with
matrix riprap. Observe failure mechanism and locations of failure. • Conduct physical model testing in the SAFL Tilting Bed Flume of a spill-through abutment with
conventional riprap to compare this countermeasure strength to the matrix riprap strength. • Using the insights gained in the SAFL Tilting Bed Flume, develop the experimental design for
large scale hydraulic modeling in the SAFL Main Channel facility.
Physical modeling of matrix riprap turned out to be a challenging exercise and required the research team to modify and adaptively adjust the test setup and goals throughout the project phase. A number of factors made this task challenging:
1. Scaling grout – Portland cement, aggregate and water are used to form grout material for matrix riprap and the slump and consistency are defined by a published standard (See sections 2.1.2 and 4.1.2). The methodology for scaling this material down to laboratory scale is non-trivial. The challenge was to find a surrogate grout material that replicated the strength, failure mechanism and consistency of prototype grout.
2. Scaling riprap – Riprap material used in the field is predominantly large cobble or boulders size material and, in Minnesota, this material is placed over filter material or finer aggregate ranging in size from clays/silts to sands and gravel. The processes of local scour and contraction scour are linked to live bed sediment transport conditions and so the scaling of natural bed material and the riprap material, with respect to transport capacity and critical bed shear stress, is important and non-trivial.
3. Failure point of matrix riprap – A major goal of the study was to determine the failure point of matrix riprap. The failure point or strength of matrix riprap at prototype scale was not known at the start of this study and therefore explicit incorporation of the stress conditions necessary for failure was not possible. In other words, the goal was to design and carry out experiments documenting failure of matrix riprap. However, the condition (bed shear) needed to achieve this failure was not known and so tests were designed using estimated failure stress.
4. Facility limitation – Two facilities were proposed for use in the project – the Tilting Bed Flume and Main Channel. The Tilting Bed Flume is capable of bed slopes up to 6% and has a water

26
discharge capacity of up to 6 cubic feet per second of water. The Main Channel is SAFL’s largest flume facility with water discharge capacity of up to 300 cubic feet per second with the bed slope fixed at ~ 0.5%. Both these facilities have significant capabilities for generating high sediment scour and transport conditions; however, the testing determined that the matrix riprap strength exceeded the capabilities of both facilities.
For the reasons described above, the testing campaign evolved over the project. The section below summarizes the main test series including motivation, design and results for each series. In total, four test series (A through D) as defined in Table 5.1 were carried out. Series A, B and C involved testing a single spill-through abutment. Series D did not involve testing of an abutment rather focused on determining failure threshold for conventional and matrix riprap.
River scour, in particular the depth of scour, is influenced by the active transport of sediment material and is characterized by the terms “live bed” or “clear water” conditions (Reference HEC 18). Live bed condition or live bed scour occurs when there is active transport of bed material. Clear water condition or clear water scour occurs when there is no transport or movement of bed material. Series A investigated live bed conditions and Series B, C and D investigated clear water conditions.
Table 5.1. Summary of four test series performed in tilting bed flume.
Sediment Series Descriptions transport Riprap
conditionsSeries A Spill-through abutment with conventional clear conventional
riprap and live bed conditions. water/erodable bed
Series B Spill-through abutment with conventional clear water conventionalriprap and clear water conditions
Series C Spill-through abutment with matrix riprap clear water matrixand clear water conditions
Series D no abutment, plane bed, clear water clear water conventional/matrixconditions
5.2 Experimental Design: Series A, B and C
5.2.1 Review of Example Bridge Crossings The hydraulic flume study was designed using bridge and river geometries typical to Minnesota. MnDOT personnel provided plan sheets of four bridges with typical spill-through abutment configurations. The bridges chosen were Bridge 08006, 79014, 56023, and 05017. Bridge plans were reviewed to determine a range of the following bridge and river characteristics:
• River channel bottom width • River flow depth • Depth to floodplain and width of floodplain • Bridge height and width • Bridge abutment side slope • Streamwise width of the bridge • Design riprap sizes
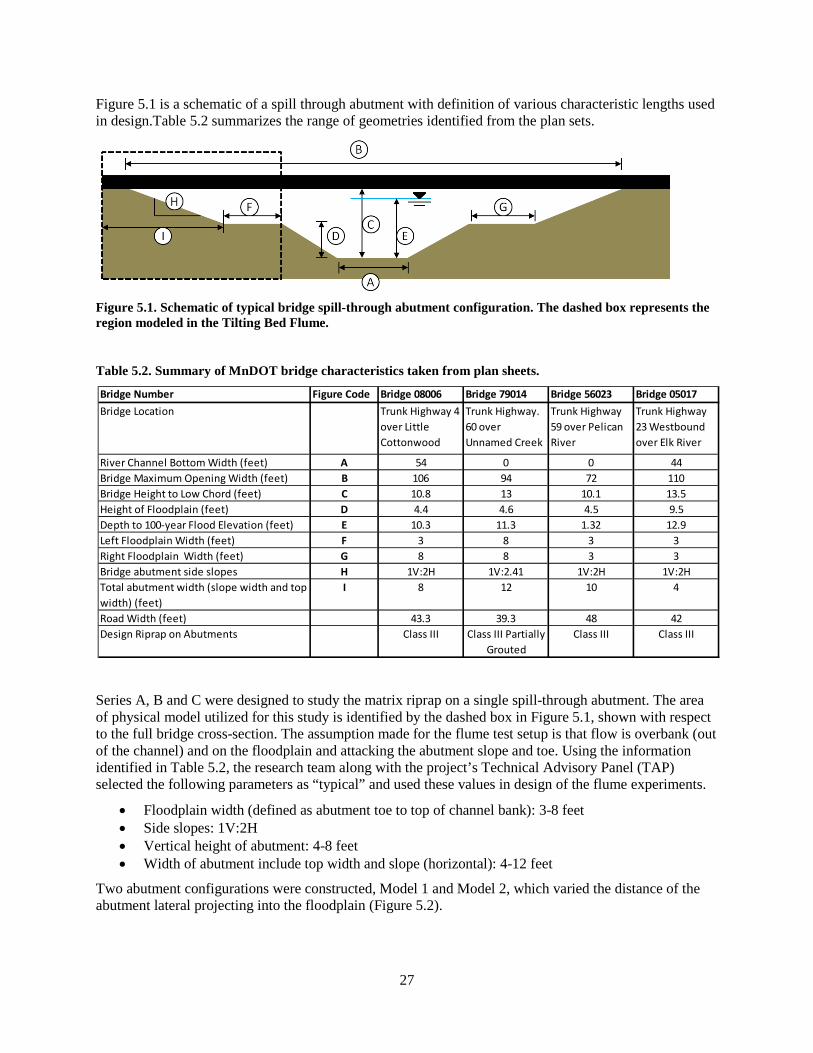
27
Figure 5.1 is a schematic of a spill through abutment with definition of various characteristic lengths used in design.Table 5.2 summarizes the range of geometries identified from the plan sets.
Figure 5.1. Schematic of typical bridge spill-through abutment configuration. The dashed box represents the region modeled in the Tilting Bed Flume.
Table 5.2. Summary of MnDOT bridge characteristics taken from plan sheets.
Bridge Number Figure Code Bridge 08006 Bridge 79014 Bridge 56023 Bridge 05017Bridge Location Trunk Highway 4
over Little Cottonwood Ri
Trunk Highway. 60 over Unnamed Creek
Trunk Highway 59 over Pelican River
Trunk Highway 23 Westbound over Elk River
River Channel Bottom Width (feet) A 54 0 0 44Bridge Maximum Opening Width (feet) B 106 94 72 110Bridge Height to Low Chord (feet) C 10.8 13 10.1 13.5Height of Floodplain (feet) D 4.4 4.6 4.5 9.5Depth to 100-year Flood Elevation (feet) E 10.3 11.3 1.32 12.9Left Floodplain Width (feet) F 3 8 3 3Right Floodplain Width (feet) G 8 8 3 3Bridge abutment side slopes H 1V:2H 1V:2.41 1V:2H 1V:2HTotal abutment width (slope width and top width) (feet)
I 8 12 10 4
Road Width (feet) 43.3 39.3 48 42Design Riprap on Abutments Class III Class III Partially
GroutedClass III Class III
Series A, B and C were designed to study the matrix riprap on a single spill-through abutment. The area of physical model utilized for this study is identified by the dashed box in Figure 5.1, shown with respect to the full bridge cross-section. The assumption made for the flume test setup is that flow is overbank (out of the channel) and on the floodplain and attacking the abutment slope and toe. Using the information identified in Table 5.2, the research team along with the project’s Technical Advisory Panel (TAP) selected the following parameters as “typical” and used these values in design of the flume experiments.
• Floodplain width (defined as abutment toe to top of channel bank): 3-8 feet • Side slopes: 1V:2H • Vertical height of abutment: 4-8 feet • Width of abutment include top width and slope (horizontal): 4-12 feet
Two abutment configurations were constructed, Model 1 and Model 2, which varied the distance of the abutment lateral projecting into the floodplain (Figure 5.2).

28
Figure 5.2. Schematic drawing of two abutment configurations.
5.2.2 Model Scaling
Geometric Scaling The laboratory physical model used standard non-distorted, geometric scaling approaches to approximate the geometry of the abutment, scale water discharge, and choose the model sediment. The important field or “prototype” geometries were described in the previous section. The flume facility used in the study was SAFL’s Tilting Bed Flume, which had the following geometries.
• Streamwise length: 48 ft (15 m) • Lateral width: 3 ft (1 m) • Vertical depth: 2 ft (0.6 m)
Using the prototype geometries described in Table 5.2 and the size of the model flume, a scaling ratio of 1:5 was selected. Table 5.3 provides a summary of the prototype ranges for key design parameters, model geometries for Model 1 and Model 2, and the equivalent prototype scale geometries for Model 1 and Model 2 assuming a 1:5 scaling.
Table 5.3. Prototype and Model Geometric Parameters
ParameterPrototype Range (ft)
Model 1(ft)
Model 2(ft)
Mode 1 (prototype - ft))
Model 2 (prototype - ft)
Lateral width of abutment 4-12 1.5 2.5 7.5 12.5
Vertical height of abutment 4-8 0.5 0.5 2.5 2.5
Abutment side slope 1V:2H 1V:2H 1V:2H 1V:2H 1V:2H
Lateral width of floodplain 3-8 1.5 0.5 7.5 2.5Streamwise length of abutment
39-48 3 3 15 15

29
5.3 Flume Setup
5.3.1 Model Abutment For Series A, B and C, a single spill-through abutment and floodplain were simulated in the Tilting Bed Flume. Figure 5.3 is an annotated photograph of the physical model setup. The abutment was formed out of grey polyvinyl chloride (PVC) plastic and pink insulating foam and configured in the Model 1 and Model 2 geometries described in Figure 5.2 and Table 5.3 above. For Series A runs, a mobile granular bed was installed upstream and downstream of the abutment. The bed was recessed slightly adjacent to the abutment to accommodate the installation of the riprap layer, which was placed on top of the abutment and floodplain surfaces.
Figure 5.3. Photograph of physical model layout prior to riprap and geotextile fabric placement.
5.3.2 Riprap Sizing and Placement Riprap was sized using the estimated field (prototype) hydraulic conditions of the five Minnesota bridges and applying design procedures outlined in HEC-23. Appropriate scaling relationships were then applied to determine the model riprap size.
The D50 of the riprap for the prototype was calculated using Equation 8.2 in HEC-23, assuming Froude number was less than 0.8, and K = 0.89 for spill through abutments. A D50 of 1.7 feet (prototype) was required for narrower floodplains and a D50 of 0.2 feet (prototype) was required for wider floodplains based on the estimated velocities through the bridges.
Using the 1:5 scale relationships, geometric and hydraulic parameters were scaled to model dimensions and the HE-23 was used with these model dimensions to determine design model grainsizes representing the riprap. For the wider floodplain (Model 1), a D50 of 0.5-inches was required and for narrow
Top of abutment
Bridge Abutment Floodplain
Flume Wall (main channel not modeled)
Recessed Bed

30
floodplain tests (Model 2), and a D50 of 4.1-inches was required. Because the HEC-23 conservatively estimates the protective grainsize of the riprap and the goal of the testing was to fail the riprap, the research team chose to decrease the size of the selected model riprap material. For the wide floodplain test a pea gravel with a D50 of 0.2 inches (5.1 mm) was used and landscape rock with a D50 of 1.0 inches (25 mm) was used for the narrower floodplain. The grainsize characterization data for these two materials is summarized in Table 5.4 and Table 5.5.
Riprap was placed as suggested by NCHRP 593 and HEC guidance. Thickness of the riprap was two times the D50 along the floodplain and up the sides of the abutment. A filter material (screen) was placed under the riprap. Figure 5.4 shows the abutment in place with the filter material and some landscape rock. Table 5.4. Summary of Pea Gravel Grain Size Distribution (in mm)
Set #1 Set #2 Set #3
D16 = 4.0 4.1 4.1 D50 = 5.1 5.1 5.1 D65 = 5.5 5.6 5.6 D84 = 6.2 6.2 6.3 D90 = 6.8 6.7 7.3
Table 5.5. Summary of Landscape Rock Grain Size Distribution (in mm)
Set #1 Set #2 Set #3
D16 = 22 21 21 D50 = 26 23 26 D65 = 28 26 28 D84 = 31 31 31 D90 = 32 32 32
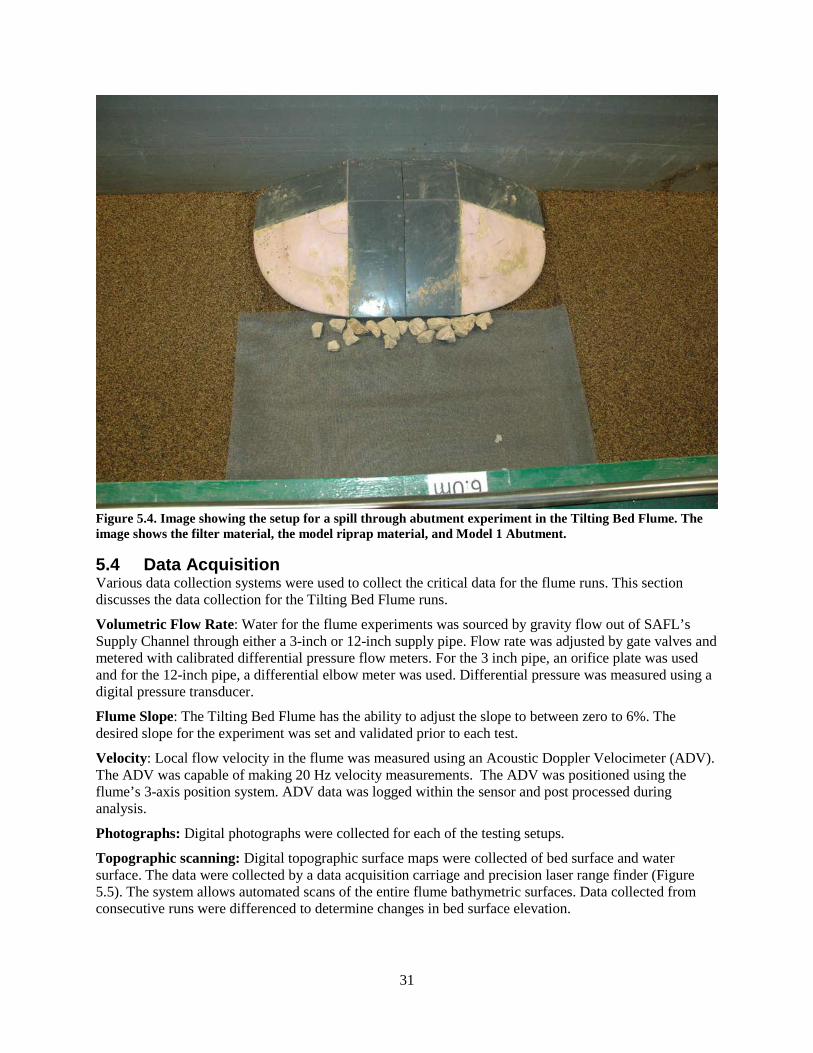
31
Figure 5.4. Image showing the setup for a spill through abutment experiment in the Tilting Bed Flume. The image shows the filter material, the model riprap material, and Model 1 Abutment.
5.4 Data Acquisition Various data collection systems were used to collect the critical data for the flume runs. This section discusses the data collection for the Tilting Bed Flume runs.
Volumetric Flow Rate: Water for the flume experiments was sourced by gravity flow out of SAFL’s Supply Channel through either a 3-inch or 12-inch supply pipe. Flow rate was adjusted by gate valves and metered with calibrated differential pressure flow meters. For the 3 inch pipe, an orifice plate was used and for the 12-inch pipe, a differential elbow meter was used. Differential pressure was measured using a digital pressure transducer.
Flume Slope: The Tilting Bed Flume has the ability to adjust the slope to between zero to 6%. The desired slope for the experiment was set and validated prior to each test.
Velocity: Local flow velocity in the flume was measured using an Acoustic Doppler Velocimeter (ADV). The ADV was capable of making 20 Hz velocity measurements. The ADV was positioned using the flume’s 3-axis position system. ADV data was logged within the sensor and post processed during analysis.
Photographs: Digital photographs were collected for each of the testing setups.
Topographic scanning: Digital topographic surface maps were collected of bed surface and water surface. The data were collected by a data acquisition carriage and precision laser range finder (Figure 5.5). The system allows automated scans of the entire flume bathymetric surfaces. Data collected from consecutive runs were differenced to determine changes in bed surface elevation.

32
Figure 5.5. Tilting Bed Flume data carriage used to take precision velocity and topographic scans.
5.5 Series A Conventional 1-inch Riprap
Summary Series A focused on flow through a single spill-through abutment protected by a 1-inch riprap material and was placed in a conventional manner, i.e. no matrix material. The Model 1 abutment configuration was used, which as an abutment width (transverse to flow) of 18-inches.
Figure 5.6. Photograph of the abutment with 25 mm riprap material.

33
Figure 5.7. Initial topographic scan of abutment section in the Tilting Bed Flume.
The bed upstream and downstream of the bridge/abutment section was a 0.07-inch well sorted sand. The bed elevation was excavated adjacent to the abutment itself and filled in with model riprap material to a depth of 1.5 D50. A filter screen was placed under the riprap material and over the sand substrate. Prior to turning on water, the initial bed condition was scanned with the topo-scanning system at a sampling resolution of 2mm x 2mm and a vertical resolution of <1mm. For Series A runs the slope of the tilting bed flume was set at 0% slope.
Once the base bed conditions were established, the general procedure for the series was to increase the flow slowly to a test discharge. Once the flow reached the test discharge, the flume was allowed to hold at this flow for at least 20 minutes. During the test period the topographic scanner was used to capture the water surface elevation. Flow was then turned off and visual observations of the bed were made to evaluate if any of the conventional riprap had moved. A topographic scan was also performed to capture document movement of particles.
Results Flow was incrementally increased over six steps ranging from 2 liters per second to 114 L/s. As discharge was increased, the water surface elevation within the channel increased as well. At 12.8 L/s, two riprap particles shifted slightly (Figure 5.8 and 5.9). At 60 L/s the river stage reached the top of the abutment and began overtopping. At 114 L/s, the water discharge greatly exceeded the hydraulic capacity of the abutment section (Figure 5.10 and Figure 5.11).

34
Figure 5.8. Bed elevation change near abutment after 12.8 L/s flow.
Figure 5.9. Cross-section topography of water surface and bed during water discharge of 12.8 L/s for Series A.

35
Figure 5.10. Cross-section topography of water surface and bed during maximum flow (114 L/s) for Series A.
Figure 5.11. Map of final elevations changes at the surface after 114 L/s test.
The goal of the Series A runs was to establish a model design that would fail conventional riprap material and could then be further used to test matrix riprap. It was determined that the riprap material was very robust for the available hydraulic conditions in the Tilting Bed Flume. While movement of riprap material was observed at the higher flows, the facility did not have enough additional flow capacity that would be required to fail the stronger matrix riprap material. Even steepening the flume’s slope would not have yielded the bed stresses necessary to fail the material.

36
5.6. Series B – Conventional 0.2-inch Riprap
Summary Series B runs continued to focus on establishing a model configuration for a spill-through abutment that could be used for both conventional riprap material and matrix riprap. A smaller riprap material was selected that has a D50 of 0.2 inches. The series also examined various slopes and flow rates. The same half-channel configuration was used as in Series A and both Model 1 and Model 2 were examined (Figure 5.12).
Pea Gravel with no matrix, mobile bed Because of high velocities required to get the 1-inch conventional riprap to fail, the research team switched to a 0.2-inch pea gravel. The flume was set to zero slope and 1.7 mm sand was placed upstream and downstream of the riprap in the same way as described for Series A. Flow rates of 5.6, 6.8, 7.8, 8.7, 11 and 20 L/s were evaluated. It was determined that to move the pea gravel, a flow rate higher than 11 L/s was required. Figure 5.9 shows the flume setup for the initial runs, and Figure 5.10 shows the movement of the pea gravel between the 11 L/s flow rate and the 20 L/s flow rate.
Figure 5.12. Flume setup for Model 1 with pea gravel.
HEC-RAS evaluation of flume hydraulics Through the initial Series B run, it was determined that high flow rates and depths would be required to actively mobilize the pea gravel material and that higher slopes in the flume were necessary. Before continuing with physical model testing however, the research team evaluated flume hydraulics using the numerical model HEC-RAS to see how much velocity could be increased based on a change of slope. Two HEC-RAS models were created using Model 1 and Model 2 abutment configurations. Four flow rates (0.5, 1, 1.5, 2 cfs) were run for three different slopes (0%, 0.5%, 1%).

37
The velocities calculated by the hydraulic model were compared to the critical velocity necessary to mobilize the abutment riprap. The critical water velocity for each run was calculated based on the depth of water in the model and the riprap (pea gravel) size (eqn. 10.18, p. 385, Strum Open Channel Hydraulics). If the critical velocity was greater than the velocity calculated in HEC-RAS, it was assumed there would be no movement of the riprap. In summary, the model provided an estimate that the pea gravel alone should fail under bed slope condition between 0.5% - 1% slope and with flow rates between 1.0 cfs - 1.5 cfs (28.32 L/s to 42.5 L/s); both conditions were achievable in the Tilting Bed Flume.
It was determined that these flow rates would cause significant scour of the sand bed upstream and downstream of the abutment. Therefore, the movable sand bed was replaced with a fixed bed. Sheet metal was riveted to the upstream end of the flume and was laid along the top of the sand in the flume. Additionally, sand was glued to the top of the sheet metal to provide roughness to the bed. The sheet metal terminated immediately upstream of the abutment section and resumed immediately downstream.
Pea Gravel with no matrix, fixed bed The Model 1 abutment configuration with pea gravel only was re-run with the fixed bed and 1% slope. Several runs verified that failure of the pea gravel occurred at approximately 10.5 L/s to 11.2 L/s (Figures 5.13 and 5.14). This result was favorable since the flume had much more flow and slope capacity, which would be needed to fail the matrix riprap. Therefore, the research team decided to proceed into testing the pea gravel as a matrix riprap countermeasure.
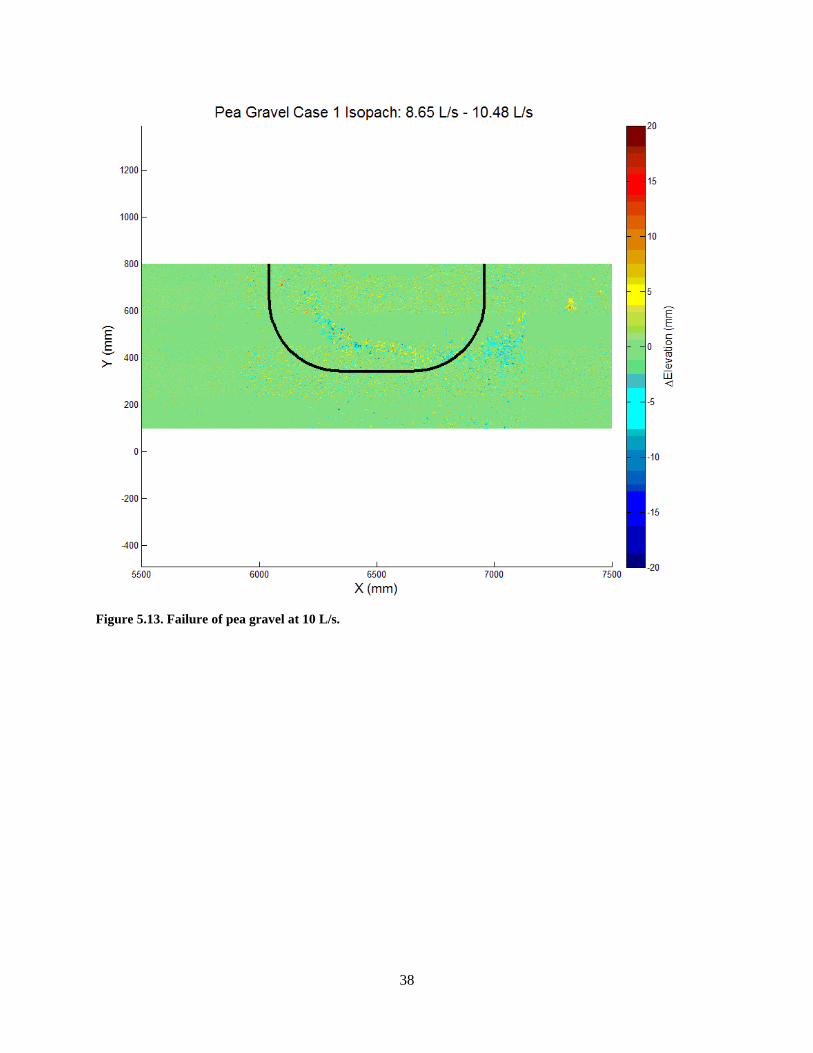
38
Figure 5.13. Failure of pea gravel at 10 L/s.

39
Figure 5.14. Failure of pea gravel at 11.2 L/s
5.7 Series C – Matrix Riprap
Summary Series C focused on experiments of pea gravel (1-inch) matrix riprap. The same pebble material used in Series B was used in these tests. The Model 1 spill-through abutment was used as well as the fixed, sand coated bed upstream and downstream of the abutment. A major task in this series involved identifying a surrogate matrix material that modeled well the strength, flowability and rigidity of concrete grout.
Several materials were tested to see which might best simulate the grout used in matrix riprap when applied to the pea gravel. The following adhesives were examined in the testing: hot glue, wood glue, wood glue with additives to change consistency, Gorilla Glue™, quickrete, cement glue, and Portland cement (with different amounts of water and kaolin to change consistency). Overall, the hot glue seemed to most closely represent the matrix riprap, so this was chosen for evaluation in the flume. The hot glue was applied as was instructed during the field visit, i.e. creating a bond at locations where individual rocks where already touching. Care was taken to ensure there were no loose rocks, but also that the matrix
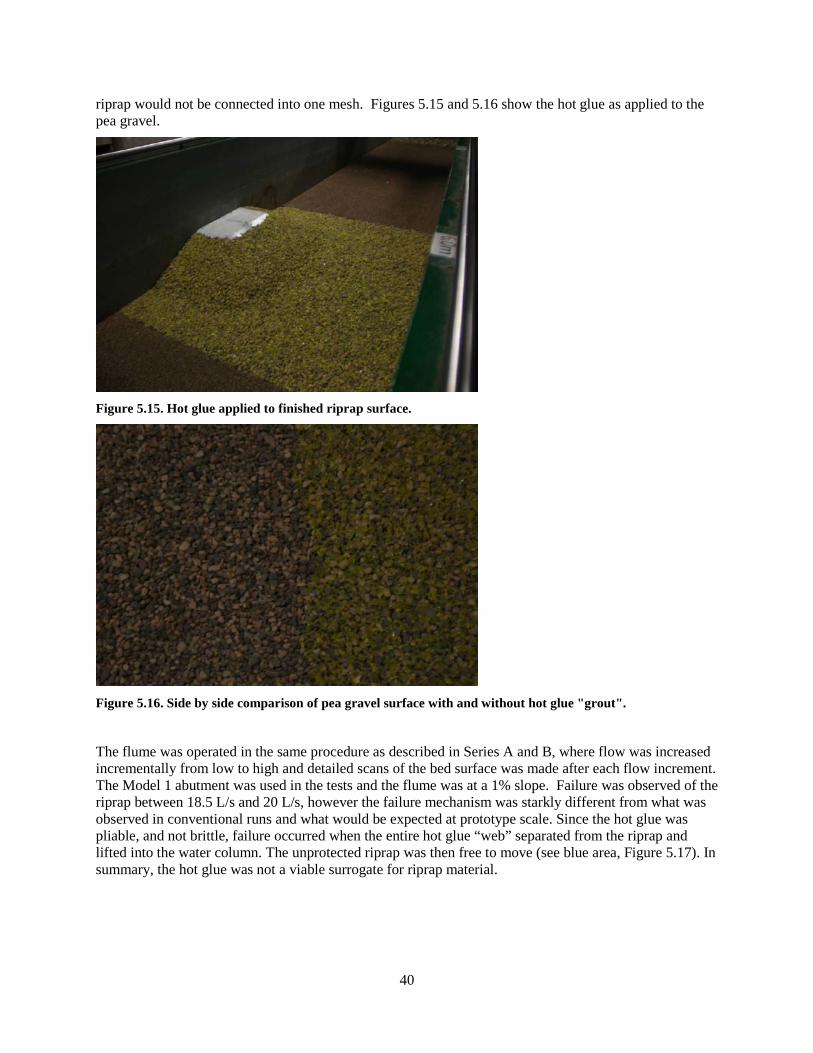
40
riprap would not be connected into one mesh. Figures 5.15 and 5.16 show the hot glue as applied to the pea gravel.
Figure 5.15. Hot glue applied to finished riprap surface.
Figure 5.16. Side by side comparison of pea gravel surface with and without hot glue "grout".
The flume was operated in the same procedure as described in Series A and B, where flow was increased incrementally from low to high and detailed scans of the bed surface was made after each flow increment. The Model 1 abutment was used in the tests and the flume was at a 1% slope. Failure was observed of the riprap between 18.5 L/s and 20 L/s, however the failure mechanism was starkly different from what was observed in conventional runs and what would be expected at prototype scale. Since the hot glue was pliable, and not brittle, failure occurred when the entire hot glue “web” separated from the riprap and lifted into the water column. The unprotected riprap was then free to move (see blue area, Figure 5.17). In summary, the hot glue was not a viable surrogate for riprap material.

41
Figure 5.17. Isopach showing failure of hot glue matrix riprap.
In a second trial, a quickcrete compound was used as the grout material and was applied in the same manner as the hot glue (Figure 5.18). Flows were tested up to 45 L/s and at slopes 1.5%, 2% and 3% without failure of the matrix riprap material. At this point, the flow began to overtop the spill through abutment and the experimental conditions became unrealistic. It was therefore concluded that it was not possible to reach the failure point of the matrix riprap within the Tilting Bed Facility under the Model 1 or Model 2 test setup.
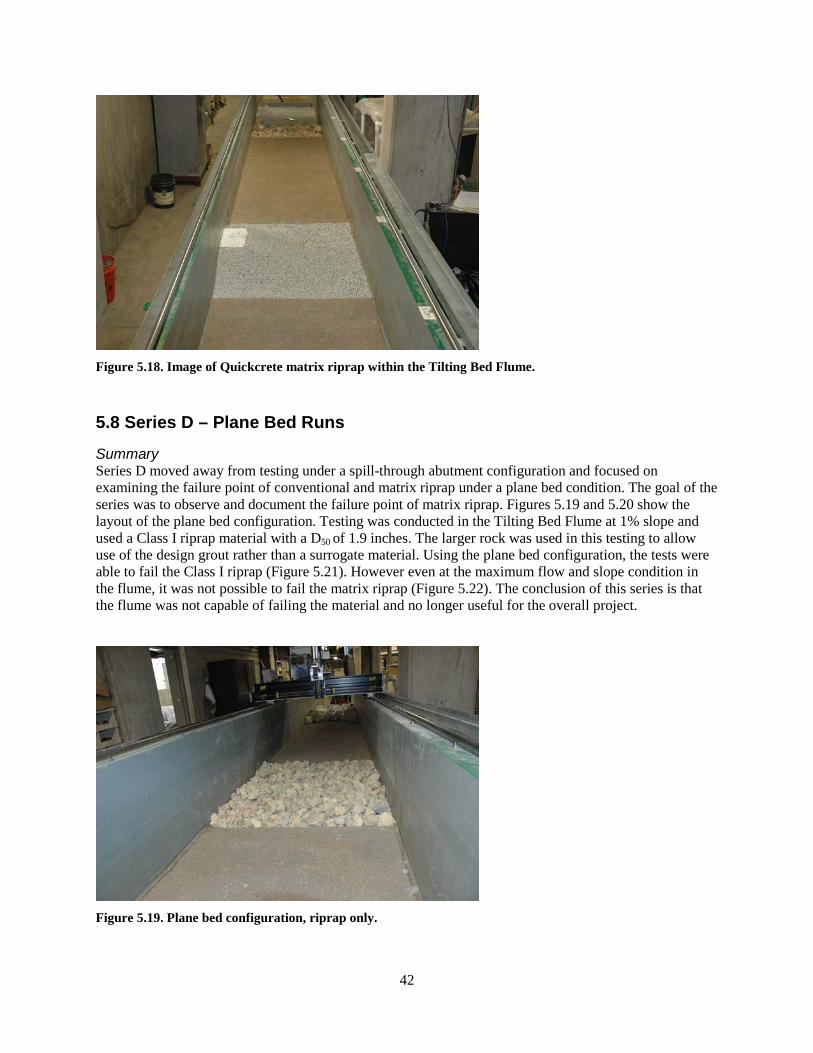
42
Figure 5.18. Image of Quickcrete matrix riprap within the Tilting Bed Flume.
5.8 Series D – Plane Bed Runs
Summary Series D moved away from testing under a spill-through abutment configuration and focused on examining the failure point of conventional and matrix riprap under a plane bed condition. The goal of the series was to observe and document the failure point of matrix riprap. Figures 5.19 and 5.20 show the layout of the plane bed configuration. Testing was conducted in the Tilting Bed Flume at 1% slope and used a Class I riprap material with a D50 of 1.9 inches. The larger rock was used in this testing to allow use of the design grout rather than a surrogate material. Using the plane bed configuration, the tests were able to fail the Class I riprap (Figure 5.21). However even at the maximum flow and slope condition in the flume, it was not possible to fail the matrix riprap (Figure 5.22). The conclusion of this series is that the flume was not capable of failing the material and no longer useful for the overall project.
Figure 5.19. Plane bed configuration, riprap only.

43
Figure 5.20. Plane bed configuration, matrix riprap.
Figure 5.21. Bed change after failure of conventional Class 1 riprap material. Note the movement of material.
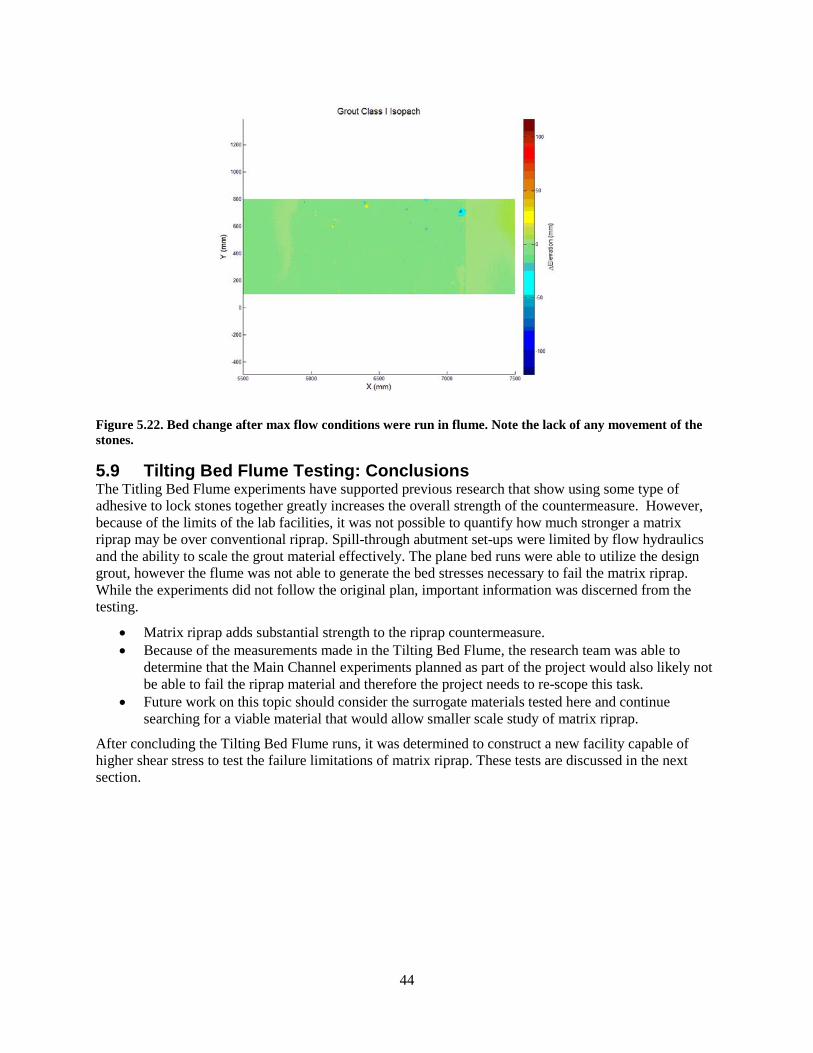
44
Figure 5.22. Bed change after max flow conditions were run in flume. Note the lack of any movement of the stones.
5.9 Tilting Bed Flume Testing: Conclusions The Titling Bed Flume experiments have supported previous research that show using some type of adhesive to lock stones together greatly increases the overall strength of the countermeasure. However, because of the limits of the lab facilities, it was not possible to quantify how much stronger a matrix riprap may be over conventional riprap. Spill-through abutment set-ups were limited by flow hydraulics and the ability to scale the grout material effectively. The plane bed runs were able to utilize the design grout, however the flume was not able to generate the bed stresses necessary to fail the matrix riprap. While the experiments did not follow the original plan, important information was discerned from the testing.
• Matrix riprap adds substantial strength to the riprap countermeasure. • Because of the measurements made in the Tilting Bed Flume, the research team was able to
determine that the Main Channel experiments planned as part of the project would also likely not be able to fail the riprap material and therefore the project needs to re-scope this task.
• Future work on this topic should consider the surrogate materials tested here and continue searching for a viable material that would allow smaller scale study of matrix riprap.
After concluding the Tilting Bed Flume runs, it was determined to construct a new facility capable of higher shear stress to test the failure limitations of matrix riprap. These tests are discussed in the next section.

45
6.0 Steep Flume Experiments
6.1 Steep Flume Construction The Tilting Bed Flume and the out-of-flume materials tests showed that very high shear stresses are required to fail newly installed matrix riprap material. A steep flume was designed and constructed to provide a testing environment with extremely high shear stresses in hope that matrix riprap could be brought to failure.
The steep flume was designed to provide high velocity flows, exceeding 15 ft/s, which was not possible using the Laboratory’s other facilities. These velocities were achieved by a 15 percent flume grade, high water volumes, and removing any tail water effects. Water was supplied to the flume by a gravity fed 12-inch pipe. The supply pipe had a gate valve for flow control and flume shutdown, which was located immediately before the vertical shaft that drops into the head box. Flow conditioning occurred in the head box where water passed through a turbulence reducing flow straightener. The head box was a 35.5-inch by 78-inch rectangle that was 77.5 inches deep. The upstream entrance of the flume was at a height of 48.5 inches from the floor. The first 59 inches of the flume had a 0 percent slope and provided further flow conditioning. This section was 29.5 inches deep and 18.5 inches wide, which continues through the rest of the flume. At the end of the conditioning section the flume transitioned to a 15 percent slope.
The steep flume had a built-in recessed section or sump that was located 171 inches downstream of the beginning of the sloped section. The sump, more often called the test section, allowed for placement of riprap or matrix riprap material. The test section was the full width of the flume and continued for 35.5 inches. The sump was 12 inches deep and its floor matched the slope of the flume. The flume ended 39 inches downstream of the test section, where water plunged 16.5 inches into the tail box. The tail box was 40 inches wide by 87 inches long by 15 inches deep (Figure 6.1).
The steep flume, head box, and tail box were constructed entirely of wood. The flume and sump were painted with epoxy paint to provide a smooth, water tight surface.
Measurement and data collection capabilities on this flume included: flow rate, water surface and time-lapse imaging. Flow rates were measured using a Rosemount differential pressure meter paired with an orifice plate. Point gauges placed at 5 inches and 81 inches upstream of the test section were used to measure water surface elevations.

46
Figure 6.1. Design details of steep flume.

47
6.2 Steep Flume Experiments
6.2.1 Riprap material Two types of riprap rock were used in the experiments, both approximately the same size but differing in angularity. The first was an angular stone, referred to herein as angular gravel. The second was a rounded stone, herein referred to as river rock. Both the angular gravel and the river rock had median sizes around 2 inches. Tests were repeated using both rock types to allow examination of angularity on matrix riprap strength. Table 6.1 provides the D10, D50, and D90 for the two rock types. The reported size distributions were determined by measuring the median axis of a large sample of rocks using a digital micrometer. The sample size to measure the size distribution was 178 total rocks for the angular gravel and 133 total rocks for the river rock. Photographs of the two rock types are also included in Figures 6.2 and 6.3. Table 6.1. Size Gradations for 2-inch Angular gravel and 2-inch River Rock
Distribution angular gravel median axis (inches)
river rock median axis (inches)
D10 1.41 1.81 D50 1.89 2.11 D90 2.31 2.74
Figure 6.2. 2-inch angular gravel.
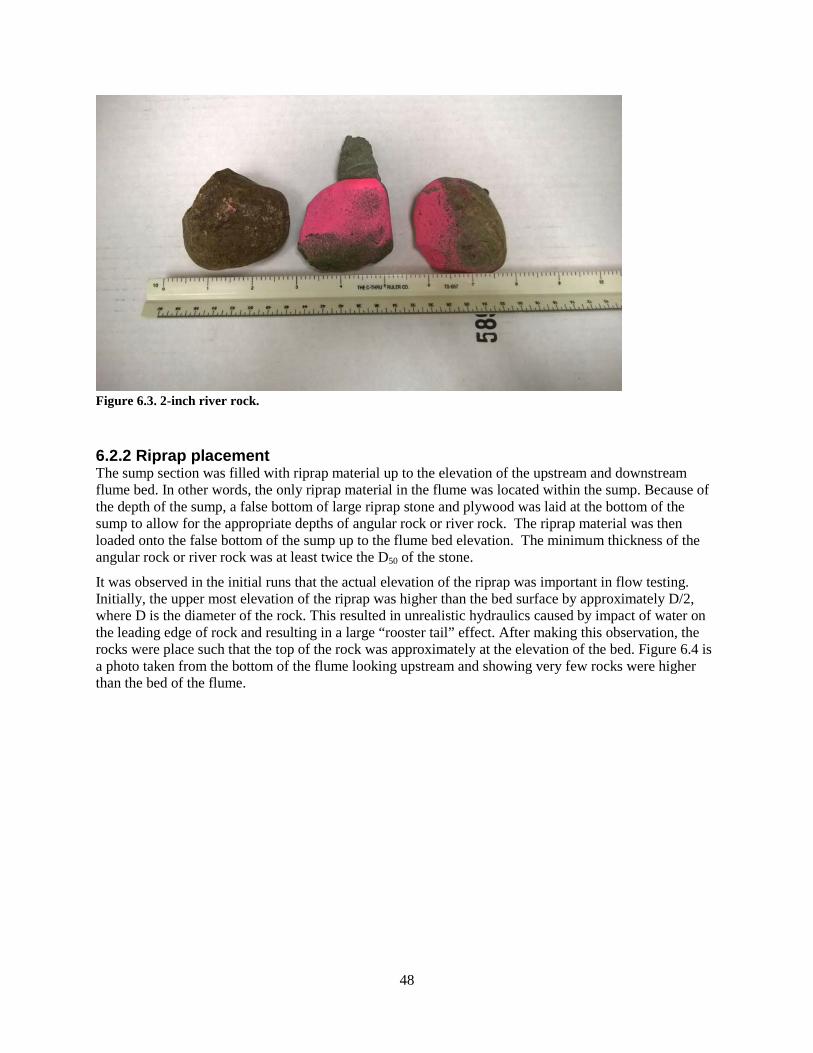
48
Figure 6.3. 2-inch river rock.
6.2.2 Riprap placement The sump section was filled with riprap material up to the elevation of the upstream and downstream flume bed. In other words, the only riprap material in the flume was located within the sump. Because of the depth of the sump, a false bottom of large riprap stone and plywood was laid at the bottom of the sump to allow for the appropriate depths of angular rock or river rock. The riprap material was then loaded onto the false bottom of the sump up to the flume bed elevation. The minimum thickness of the angular rock or river rock was at least twice the D50 of the stone.
It was observed in the initial runs that the actual elevation of the riprap was important in flow testing. Initially, the upper most elevation of the riprap was higher than the bed surface by approximately D/2, where D is the diameter of the rock. This resulted in unrealistic hydraulics caused by impact of water on the leading edge of rock and resulting in a large “rooster tail” effect. After making this observation, the rocks were place such that the top of the rock was approximately at the elevation of the bed. Figure 6.4 is a photo taken from the bottom of the flume looking upstream and showing very few rocks were higher than the bed of the flume.

49
Figure 6.4. Flume floor from downstream to upstream.
6.2.3 Test Flows
Volumetric Flow For each run, the discharge of flow ranged from low (0.1 cfs) up to the point of failure or the maximum flow rate for the facility (11 cfs), whichever was achieved first. Flow was manually adjusted via a 12-inch gate valve located at the upstream end of the facility.
Flow rate was measured using an orifice plate and differential pressure meter. Two orifice plates were used to cover the full range of flows. The larger orifice plate was 8.5 inches and the smaller was 4.0 inches. Upstream and downstream pressure taps were installed to standard specification allowing use of book values for the orifice plate coefficients.
The orifi
𝑄
ce
=
pl
𝑐
ate
×
equa
𝐴 �
tion u
1
s
�
ed i
2(
n t
𝑃
h
−
e c
𝑃
om
)/
put
𝑑 2 1−𝛽4 1 2
Where,
𝜌
ations was:
(Equation 6.1)
Q is the volumetric flow rate (cfs).
Cd is the coefficient of discharge and taken to be 0.62.
A2 is the cross sectional area of the orifice.
β is the ratio of the orifice diameter to the pipe diameter.
P1 is the upstream pressure measured 1 pipe diameter upstream of the orifice.
P2 is the downstream pressure measured ½ pipe diameter downstream of the orifice.
ρ is the density of water.

50
Using Equation 6.1 and the information on orifices and pipe diameters, the following calibration curves for both the 8-inch and 4-inch orifice were generated and are shown in Figures 6.5.
Figure 6.5. Calibration curves for orifice plates.
Velocity and Bed Shear Stress For the steep flume tests, the important quantities to compute were the channel velocity and bed shear stress. The average channel velocity is determined using the orifice plate relationships described above and continuity (Equation 6.2). The velocities used to compare the failure of the grouted versus non-grouted riprap are calculated based on the fo
𝑉
llow
= 𝑄
ing equation:
(Equation 6.2) Where,
V is the vel
/
o
𝐴
city (ft/second) Q is the volumetric flow rate (CFS) A is the flow cross-sectional area (ft2)

51
The flow cross-sectional area was calculated using the width of the flume (1.5-feet) and the depth of water. Depth of water was measured at the lateral midpoint of the flume, approximately 6 inches upstream of the leading edge of the test section. A manual point gauge was used to measure the depth, which has an accuracy of 0.001 feet. Since the flow was supercritical, standing waves, though small, were formed and resulted in some uncertainties in flow depth measurements. This was especially true at the higher flows. To minimize the measurement error, a relationship between flow depth and discharge was developed using all hydraulic data collected from all the runs. The stage/discharge relationship of the steep flume is shown in Figure 6.6.
Figure 6.6. Stage discharge relationship in test flume.
Shear stress at the bed induced by the overriding, high velocity water is the primary hydraulic driver for erosion of bed material. In the tests reported here, our objective was to incrementally increase discharge and thus bed shear stress to the point of riprap failure. Bed shear was calculated for each flow increment using the discharge versus flow depth relationships described above, and bed shear stress was calculated using Equation 6.3.
𝜏𝑏 = 𝛾𝑅ℎ𝑆 (Equation 6.3) Where,
τb is the bed shear stress in the channel (lb/ft2) γ is the specific weight of water (lb/ft3) Rh is the hydraulic radius (ft) S is the bed slope

52
The hydraulic radius is defined in Equation 6.4.
𝑅ℎ = ℎ∗𝑤2ℎ+𝑤
(Equation 6.4) Where,
h is the flow depth, either measured by point gauge or computed from discharge-depth relationship (ft2). w is the flume width of 1.5 ft.
As mentioned previously, flow depth, h, was determined in two ways because of the inaccuracies of the depth measurements. Flow depth was first determined from the measured value of depth using the point gauge. Flow depth was then verified using the relationship developed for stage-discharge as shown in Figure 6.6. Results of the bed shear stress, using both approaches for calculating depth, are shown in the figures below. Figure 6.7 shows the results of the bed shear stress generated in the test flume over the range of test conditions. Bed shear stress ranges from zero up to about 2.75 lb/ft2 or 130 N/m2. The figure also plots the calculated Froude number (Equation 6.5). All flows were supercritical.
𝐹𝑟 = 𝑉�𝑔ℎ
(Equation 6.5)
Figure 6.7. Bed shear stress and Froude developed in the test flume.
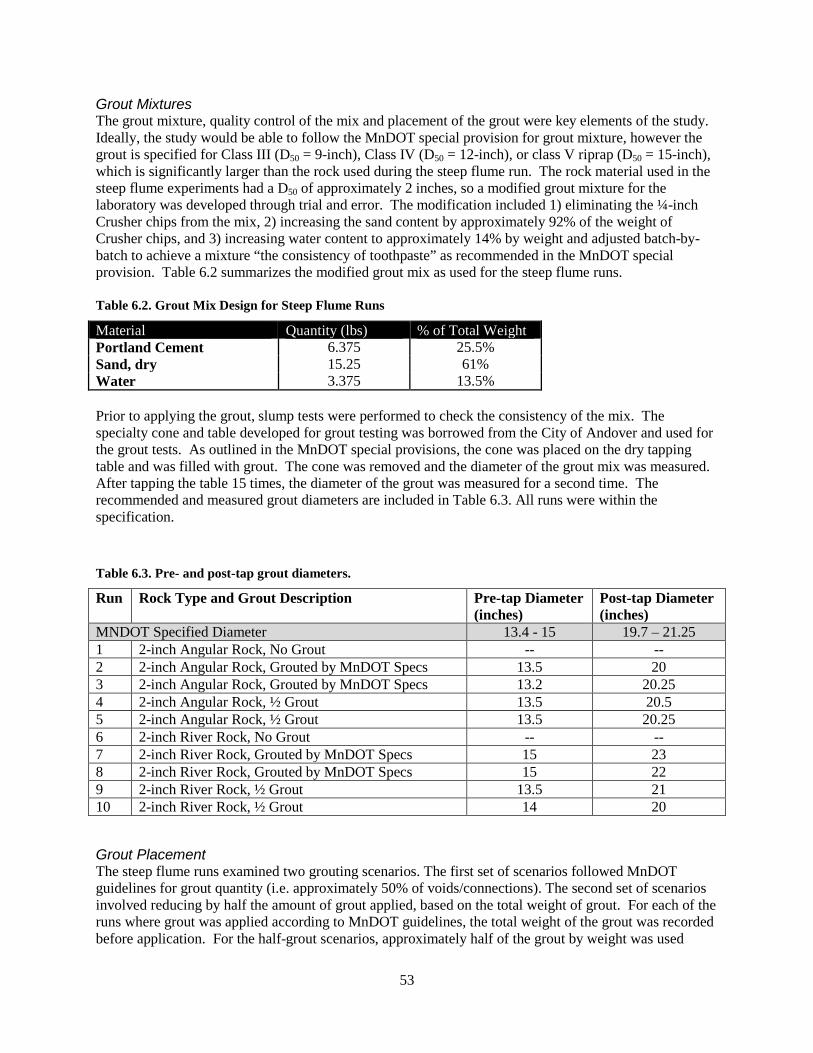
53
Grout Mixtures The grout mixture, quality control of the mix and placement of the grout were key elements of the study. Ideally, the study would be able to follow the MnDOT special provision for grout mixture, however the grout is specified for Class III (D50 = 9-inch), Class IV (D50 = 12-inch), or class V riprap (D50 = 15-inch), which is significantly larger than the rock used during the steep flume run. The rock material used in the steep flume experiments had a D50 of approximately 2 inches, so a modified grout mixture for the laboratory was developed through trial and error. The modification included 1) eliminating the ¼-inch Crusher chips from the mix, 2) increasing the sand content by approximately 92% of the weight of Crusher chips, and 3) increasing water content to approximately 14% by weight and adjusted batch-by-batch to achieve a mixture “the consistency of toothpaste” as recommended in the MnDOT special provision. Table 6.2 summarizes the modified grout mix as used for the steep flume runs. Table 6.2. Grout Mix Design for Steep Flume Runs
Material Quantity (lbs) % of Total Weight Portland Cement 6.375 25.5% Sand, dry 15.25 61% Water 3.375 13.5% Prior to applying the grout, slump tests were performed to check the consistency of the mix. The specialty cone and table developed for grout testing was borrowed from the City of Andover and used for the grout tests. As outlined in the MnDOT special provisions, the cone was placed on the dry tapping table and was filled with grout. The cone was removed and the diameter of the grout mix was measured. After tapping the table 15 times, the diameter of the grout was measured for a second time. The recommended and measured grout diameters are included in Table 6.3. All runs were within the specification.
Table 6.3. Pre- and post-tap grout diameters.
Run Rock Type and Grout Description Pre-tap Diameter (inches)
Post-tap Diameter (inches)
MNDOT Specified Diameter 13.4 - 15 19.7 – 21.25 1 2-inch Angular Rock, No Grout -- -- 2 2-inch Angular Rock, Grouted by MnDOT Specs 13.5 20 3 2-inch Angular Rock, Grouted by MnDOT Specs 13.2 20.25 4 2-inch Angular Rock, ½ Grout 13.5 20.5 5 2-inch Angular Rock, ½ Grout 13.5 20.25 6 2-inch River Rock, No Grout -- -- 7 2-inch River Rock, Grouted by MnDOT Specs 15 23 8 2-inch River Rock, Grouted by MnDOT Specs 15 22 9 2-inch River Rock, ½ Grout 13.5 21 10 2-inch River Rock, ½ Grout 14 20
Grout Placement The steep flume runs examined two grouting scenarios. The first set of scenarios followed MnDOT guidelines for grout quantity (i.e. approximately 50% of voids/connections). The second set of scenarios involved reducing by half the amount of grout applied, based on the total weight of grout. For each of the runs where grout was applied according to MnDOT guidelines, the total weight of the grout was recorded before application. For the half-grout scenarios, approximately half of the grout by weight was used

54
compared to the “MnDOT guidelines” scenarios. Table 6.4 summarizes the weight of grout applied for each of the matrix riprap runs.
Using the MnDOT special provision as guidance, the placement of grout was along the connection points of two adjacent stones and targeted approximately 50% of the original void space. Grout was applied point-by-point using a small funnel with an opening of approximately 1.25 inches. For the runs where the grout was applied based on the MnDOT guidance, grout was placed at each point where rocks made contact with each other to reinforce the connection. For the runs where half the grout was applied, the same methodology was used but fewer connection points were made. For each half grout run, each rock was grouted to at least one other rock, even if it resulted in using slightly more than half of the recommended grout.
Note that the total weight of the grout used for the river rock was several pounds less than that used for the angular rock. This was a result of there being fewer and shorter lengths of contact points between the individual rounded rocks than between the individual angular rocks.
Table 6.4. Weight of grout applied to test setup.
Run Number Rock Type Grout Description Weight of Grout Used (pounds)
1 2-inch Angular Rock No Grout -- 2 2-inch Angular Rock MnDOT specification 12.1 3 2-inch Angular Rock MnDOT specification 12.3 4 2-inch Angular Rock 1/2 Grout by weight 7.7 5 2-inch Angular Rock 1/2 Grout by weight 6.8 6 2-inch River Rock No Grout -- 7 2-inch River Rock MnDOT specification 10.8 8 2-inch River Rock MnDOT specification 8.4 9 2-inch River Rock 1/2 Grout by weight 4.7 10 2-inch River Rock 1/2 Grout by weight 4.8
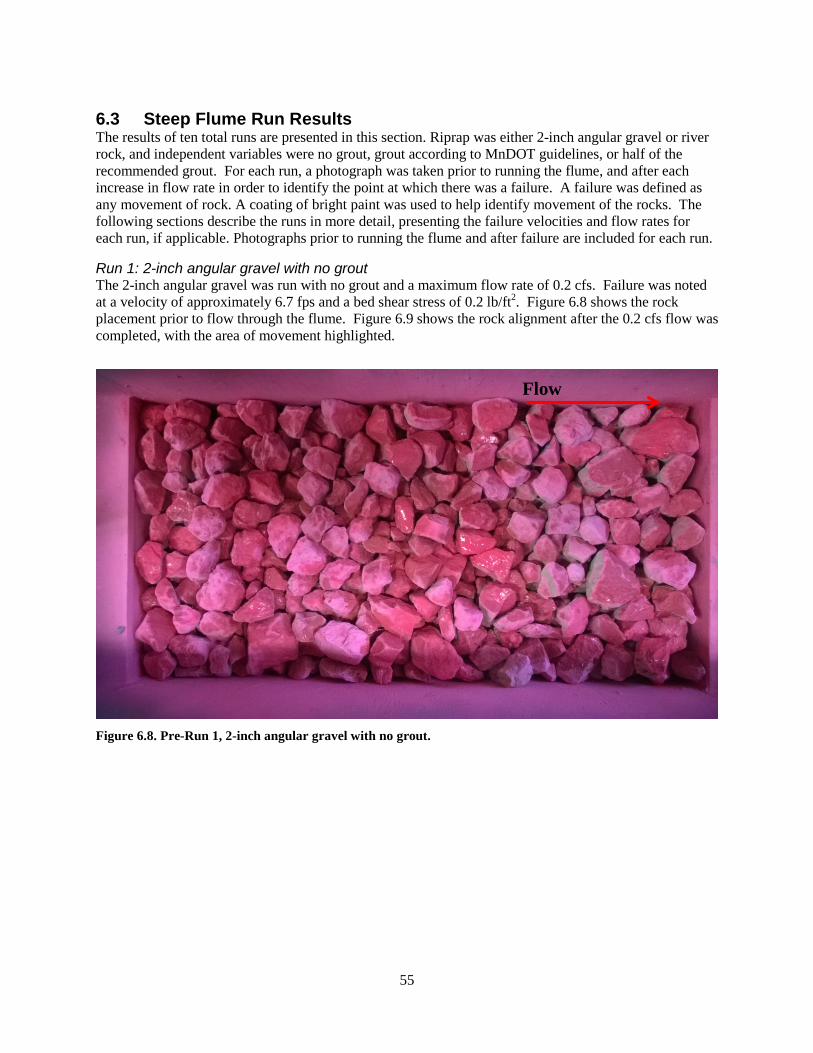
55
6.3 Steep Flume Run Results The results of ten total runs are presented in this section. Riprap was either 2-inch angular gravel or river rock, and independent variables were no grout, grout according to MnDOT guidelines, or half of the recommended grout. For each run, a photograph was taken prior to running the flume, and after each increase in flow rate in order to identify the point at which there was a failure. A failure was defined as any movement of rock. A coating of bright paint was used to help identify movement of the rocks. The following sections describe the runs in more detail, presenting the failure velocities and flow rates for each run, if applicable. Photographs prior to running the flume and after failure are included for each run.
Run 1: 2-inch angular gravel with no grout The 2-inch angular gravel was run with no grout and a maximum flow rate of 0.2 cfs. Failure was noted at a velocity of approximately 6.7 fps and a bed shear stress of 0.2 lb/ft2. Figure 6.8 shows the rock placement prior to flow through the flume. Figure 6.9 shows the rock alignment after the 0.2 cfs flow was completed, with the area of movement highlighted.
Figure 6.8. Pre-Run 1, 2-inch angular gravel with no grout.
Flow

56
Failure Location
Flow
Figure 6.9. Post-Run 1, 2-inch angular gravel with no grout.
Runs 2 and 3: 2-inch angular gravel with grout placed using recommended MnDOT guidelines Two runs were completed using the 2-inch angular gravel with grout placed according to MnDOT recommended guidelines. Maximum flow rates of 10.4 cfs and 10.8 cfs were run through the flume, and there was no failure of the matrix riprap. These maximum flow rates correspond to velocities of approximately 15.4 and 15.7 ft/sec and shear stresses of 2.6 lb/ft2 and 2.7 lb/ft2, respectively. Figures 6.10 and 6.11 show the rock for Run 2 of the original rock placement and final rock locations after the maximum flow rate was run. Figures 6.12 and 6.13 show the Run 3 original rock placement and the final rock locations. No movement of the rock can be discerned from review of the pictures.

57
Figure 6.10. Pre-Run 2, 2-inch angular gravel with grout placed according to MnDOT guidelines.
Flow
Flow
Figure 6.11. Post-Run 2, 2-inch angular gravel with grout placed according to MnDOT guidelines.

58
Figure 6.12. Pre-Run 3, 2-inch angular gravel with grout placed according to MnDOT guidelines.
Flow
Flow
Figure 6.13. Post-Run 3, 2-inch angular gravel with grout placed according to MnDOT guidelines.

59
Runs 4 and 5: 2-inch angular gravel with approximately ½ of the grout per MnDOT Guidelines Two runs were completed using the 2-inch angular gravel with half the recommended grout applied. Maximum flow rates of 1.5 cfs and 1.2 cfs were run through the flume, and the matrix riprap failed during both runs. Figures 6.14 and 6.15 show the original rock placement and final rock locations of Run 4, which had a maximum flow rate of 1.5 cfs and maximum velocity of 10.0 fps (bed shear stress approximately 0.8 lb/ft2). Figures 6.16 and 6.17 show the original rock placement and the final rock locations of Run 5, which had a maximum flow rate of 1.2 cfs and maximum velocity 9.0 fps (bed shear stress approximately 0.8 lb/ft2). The locations of failure are highlighted in Figure 6.15 for Run 4 and Figure 6.17 for Run 5. Failure during these runs was a result of two rocks, grouted together at one seam, shifting downstream. Failure was not a result of a fracture in the grout between the two rocks.

60
Flow
Failure Location
Flow
Figure 6.14. Pre-Run 4, 2-inch angular gravel with half recommended grout.
Figure 6.15. Post-Run 4, 2-inch angular gravel with half recommended grout.

61
Failure Location
Flow
Flow
Figure 6.16. Pre-Run 5, 2-inch angular gravel with half recommended grout.
Figure 6.17. Post-Run 5, 2-inch angular gravel with half recommended grout.

62
Run 6: 2-inch river rock with no grout The 2-inch river rock with no grout was run with a maximum flow rate of 0.3 cfs. Failure was noted at a velocity of approximately 6.7 fps, with a bed shear stress of 0.3 lb/ft2. Figure 6.18 shows the rock placement prior to any flow through the flume. Figure 6.19 shows the rock alignment after the 0.3 cfs flow rate was run and the area of movement is highlighted.
Flow
Failure Location
Flow
Figure 6.18. Pre-Run 6, 2-inch river rock with no grout.
Figure 6.19. Post-Run 6, 2-inch river rock with no grout.

63
Runs 7 and 8: 2-inch river rock with grout placed using recommended MnDOT guidelines Two runs were completed using the 2-inch river rock with grout placed according to MnDOT recommended guidelines. Maximum flow rates of 10.2 cfs and 10.6 cfs were run through the flume, and there was no failure of the matrix riprap. These maximum flow rates correspond to velocities of approximately 15.5 and 15.4 fps, and bed shear stresses of 2.6 lb/ft2 and 2.7 lb/ft2, respectively. Figures 6.20 and 6.21 show the rock for Run 7 of the original rock placement and after the maximum flow rate was run. Figures 6.22 and 6.23 show the Run 8 original rock placement and the final rock locations. No movement of the rock can be discerned from review of the pictures.

64
Figure 6.20. Pre-Run 7, 2-inch river rock with grout placed according to MnDOT guidelines.
Flow
Flow
Figure 6.21. Post-Run 7, 2-inch river rock with grout placed according to MnDOT guidelines.

65
Figure 6.22. Pre-Run 8, 2-inch river rock with grout placed according to MnDOT guidelines.
Flow
Flow
Figure 6.23. Post-Run 8, 2-inch river rock with grout placed according to MnDOT guidelines.

66
Runs 9 and 10: 2-inch river rock with grout approximately ½ of the grout per MnDOT guidelines Two runs were completed using the 2-inch river rock with half of the recommended grout applied. Maximum flow rates of 1.5 cfs and 1.2 cfs were run through the flume, and the matrix riprap failed during both runs. Figure 6.24 shows the original rock placement of Run 9, which had a maximum flow rate of 1.5 cfs and maximum velocity of 10.0 fps (bed shear stress approximately 0.8 lb/ft2). No photograph was available showing the failure of Run 9, however approximately one-fourth of the rocks were lost from the bed. Figures 6.25 and 6.26 show the original rock placement and the final rock locations of Run 10, which had a maximum flow rate of 1.2 cfs and maximum velocity 8.9 fps (bed shear stress approximately 0.8 lb/ft2). The location of failure for Run 10 is shown in Figure 6.26. Failure during these runs was a result of two rocks, grouted together at one seam, shifting downstream. Failure was not a result of a fracture in the grout between the two rocks. During both failures of the river rock with half grout, the loss of the first two stones caused a cascading effect resulting in many more stones being lost before the water could be shut off.

67
Flow
Figure 6.24. Pre-Run 9, 2-inch river rock with half of the recommended grout.

68
Flow
Failure Location
Flow
Figure 6.25. Pre-Run 10, 2-inch river rock with half of the recommended grout.
Figure 6.26. Post-Run 10, 2-inch river rock with half of the recommended grout.
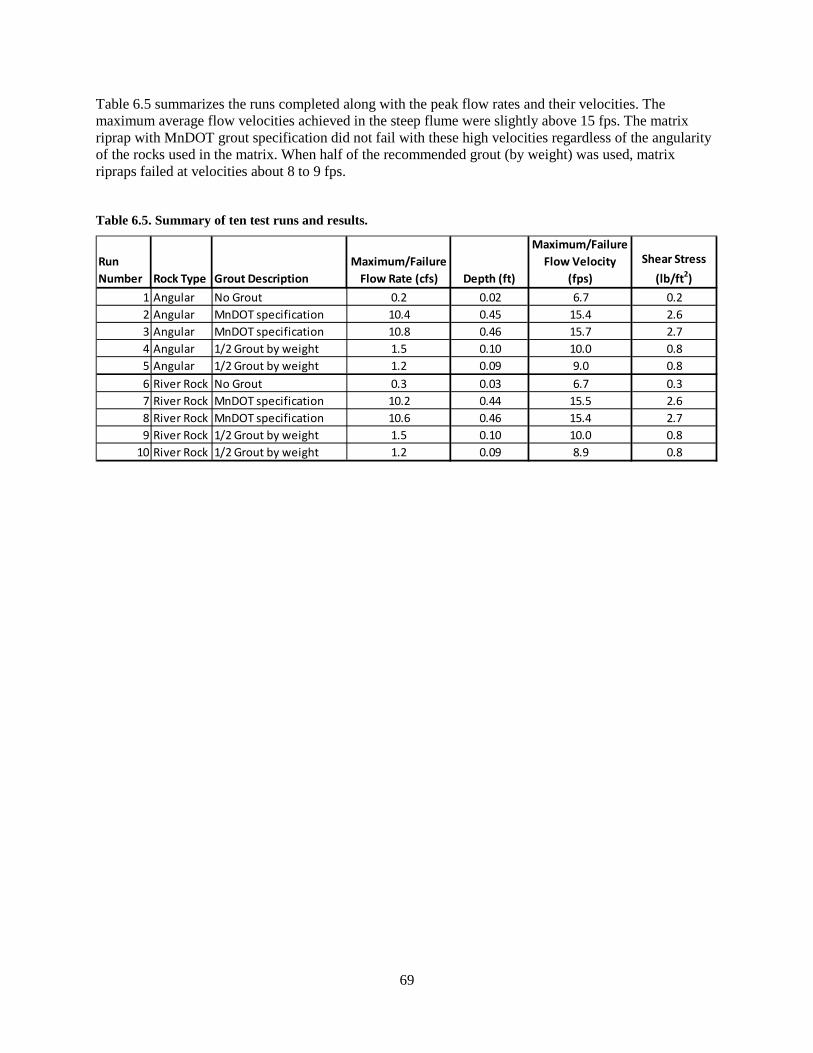
69
Table 6.5 summarizes the runs completed along with the peak flow rates and their velocities. The maximum average flow velocities achieved in the steep flume were slightly above 15 fps. The matrix riprap with MnDOT grout specification did not fail with these high velocities regardless of the angularity of the rocks used in the matrix. When half of the recommended grout (by weight) was used, matrix ripraps failed at velocities about 8 to 9 fps.
Table 6.5. Summary of ten test runs and results.
Run Number Rock Type Grout Description
Maximum/Failure Flow Rate (cfs) Depth (ft)
Maximum/Failure Flow Velocity
(fps)Shear Stress
(lb/ft2)1 Angular No Grout 0.2 0.02 6.7 0.22 Angular MnDOT specification 10.4 0.45 15.4 2.63 Angular MnDOT specification 10.8 0.46 15.7 2.74 Angular 1/2 Grout by weight 1.5 0.10 10.0 0.85 Angular 1/2 Grout by weight 1.2 0.09 9.0 0.86 River Rock No Grout 0.3 0.03 6.7 0.37 River Rock MnDOT specification 10.2 0.44 15.5 2.68 River Rock MnDOT specification 10.6 0.46 15.4 2.79 River Rock 1/2 Grout by weight 1.5 0.10 10.0 0.8
10 River Rock 1/2 Grout by weight 1.2 0.09 8.9 0.8

70
6.4 Steep Flume Conclusions The objective of the testing program was to determine the failure shear stress for 2-inch matrix riprap material and to explore the impact of angularity and amount of grout on the failure threshold. Equation 6.3 defined the depth-slope product formulation of bed shear stress and was used to estimate bed shear stress for the test runs.
It is noted that the bed shear stress estimates were made 6 inches upstream of the test section over the wooden bed of the flume (Figure 6.27). Measurements were not recorded over the rock itself because the high speed flows over the coarse rocks made it impossible to make measurements of depth and/or velocity. For this reason, measurements were made immediately upstream of the test section. This location is approximately 10 flume widths or 30 flow depths downstream of the start of the 15% slope, and the flow was uniform and well developed at the measurement site. It is believed that the bed stress in this location represents the stress imposed on the riprap material.
Direction of Flow
Figure 6.27. Image of measurement location upstream of test section sump.
The calculated shear stress and flow rate for each of the runs are summarized in Table 6.6. As shown, the shear stress for the matrix riprap runs was 8 to 10 times higher than the ungrouted riprap. The matrix riprap runs using half of the recommended grout were significantly less strong, withstanding shear stresses only two to four times higher than the ungrouted riprap.

71
Table 6.6. Summary of failure bed shear stress by amount of grout.
Run Number Rock Type Grout Description
Maximum/Failure Flow Rate (cfs)
Shear Stress (lb/ft2)
1 Angular No Grout 0.2 0.26 River Rock No Grout 0.3 0.34 Angular 1/2 Grout by weight 1.5 0.85 Angular 1/2 Grout by weight 1.2 0.89 River Rock 1/2 Grout by weight 1.5 0.8
10 River Rock 1/2 Grout by weight 1.2 0.82 Angular MnDOT specification 10.4 2.63 Angular MnDOT specification 10.8 2.77 River Rock MnDOT specification 10.2 2.68 River Rock MnDOT specification 10.6 2.7
Figure 6.28 is a plot of the average bed shear stress for the range of runs performed and the failure or maximum shear stress for each of the runs with their associated flow rates. For the runs with matrix riprap following the MnDOT special provision (Runs 2, 3, 7, and 8 and indicated in blue squares), the points plotted were the maximum flow rates and bed shear stress, since there was no failure of the matrix riprap. For the remaining runs, the points represent the flow rate and bed shear stress at the point of failure. In summary, the quantity of grout plays an important role in the critical shear stress or failure point of the grout.
Figure 6.28. Summary of grout quantity on shear strength.
72
Summary of findings • The critical shear stress or bed shear stress at which the riprap fails is strongly dependent on
whether a matrix is present. For matrix riprap grouted to MnDOT specification, the flume tests were not able to fail the material. The critical shear stress of the 2-inch matrix riprap exceeds 2.75 lb/ft2 or 130 N/m2.
• There was no measureable difference in the performance of the matrix riprap due to angularity of the rock. Both the river rock and the angular gravel performed similarly. Note that current MnDOT material specification for riprap requires angular rock.
• The half grout runs involved placing half the weight of grout as in the MnDOT specification. The results suggest a substantially reduced performance of the riprap. The critical shear stress of the 2-inch rock with half the recommended grout was measured at 0.8 lb/ft2.
• The half grout runs were grouted such that each rock was attached to at least one other rock. To increase the riprap strength, a single rock must be grouted to more than one rock to create a true matrix of grouted stone.
• Failure of the half grouted runs was a result of two rocks grouted together moving from their original location. The grout itself did not fracture during these runs.
• The tests performed represent a new installation of matrix riprap. The matrix bonds were intact and there was no simulation of degradation of the matrix. The half grout runs could represent a degraded state of the MNDOT specification and suggest that maintenance of the grouted material is important.
Additional Research Needs Since there was no failure of the matrix riprap, the actual shear strength of matrix riprap could not be determined and the increase in strength over traditional riprap cannot be calculated based on these experiments. Some additional research is being conducted at this time, including the exploration of a “neat” grout mix, without crusher chips, to avoid clogging of the pump. However, the research team acknowledges the need for additional research on this topic. The following are suggestions for additional research on matrix riprap.
• Experimenting in situations with higher hydraulic capacity to quantify the failure point of matrix riprap.
• Experimentation with the strength of matrix riprap up the slope of the abutment and how that affects strength.
• Evaluate environmental impacts regarding placement, especially underwater placement, as we develop the standard specification for install.
• Development of a structural model to evaluate why matrix bonds significantly increase the strength of the countermeasure.
• Further evaluation of placement to improve the MnDOT special provisions, including what pumps and/or nozzles should be used.
• Continue to improve the specifications and/or special provisions (MnDOT) and monitor installations over time to note degradation and if/when maintenance is needed (and what that maintenance might be).

73
References Anderson, A.G., Paintal, A.S., and Davenport, J.T. (1970). NCHRP Report 108: Tentative Design Procedure for Riprap-Lined Channels. National Cooperative Highway Research Program, Washington, D.C.
Anderson, A.G., (1973). Tentative Design Procedure for Riprap Lined Channels – Field Evaluation. NCHRP Project 15-2, Prepared for Highway Research Board by St. Anthony Falls Hydraulic Laboratory, University of Minnesota, MN
Barkdoll, B.D, Ettema, R., and Melville, B.W. (2007). NCHRP Report 587: Countermeasures to Protect Bridge Abutments from Scour. Transportation Research Board of the National Academies, Washington, D.C.
Brown, S.A., and Clyde, E. S., (1989). Design of Riprap Revetment, Hydraulic Engineering Circular (HEC) No. 11, FHWA-IP-89-016, Federal Highway Administration, Washington, D.C.
Cardoso, A., and Fael, C., (2009). “Protecting Vertical-Wall Abutments with Riprap Mattresses,” Journal of Hydraulic Engineering, Vol. 135, No. 6, pp. 457-465, DOI: 10.1061/_ASCE_HY.1943-7900.0000040 Ettema, R., Nakato, T., and Muste, M. (2003). “An Overview of Scour Types and Scour-Estimation Difficulties Faced at Bridge Abutments”, Proceedings of the 2003 Mid-Continent Transportation Research Symposium. Iowa State University, Ames, IA. August 21-22, 2003.
Girard, L., and Clopper, P. (2008). “Integrating European Partially Grouted Riprap for Stream Stability and Bridge Scour Protection”, International Erosion Control Association 2008 Conference. Orlando, FL. February 18-22, 2008.
Hall, J.W., Smith, K.L., Titus-Glover, L., Wambold, J.C., Yager, T.J., Rado, Z., (2009). NCHRP Report 108: Guide for Pavement Friction. Transportation Research Board of the National Academies, Washington, D.C.
Heibaum, M. (2000). “Scour Countermeasures Using Geosynthetics and Partially Grouted Riprap.” Transportation Research Record 1696, Paper No. 580106. pp.244-250.
Korkut, R., Martinez, E., Morales, R., Ettema, R., and Barkdoll, B., “Performance as Scour Countermeasure for Bridge Abutments”, Journal of Hydraulic Engineering, Vol. 133, No. 4, 431-439, DOI: 10.1061/_ASCE_0733-9429_2007_133:4_431_
Lagasse, P., Clopper, P., and Arneson, L. (2008). “Partially Grouted Riprap as a Pier Scour Countermeasure,” World Environmental and Water Resources Congress, 2008. Ahupua’a, Hawaii. May 12-16, 2008.
Lagasse, P.F., Clopper, P.E., Zevenbergen, L.W., and Gerard, L.G. (2007). NCHRP Report 593: Countermeasures to Protect Bridge Piers from Scour. Transportation Research Board of the National Academies, Washington, D.C.
Lagasse, P.F., Clopper, P.E., Zevenbergen, L.W., and Ruff, J.F. (2006). NCHRP Report 568: Riprap Design Criteria. Recommended Specifications, and Quality Control, Transportation Research Board of the National Academies, Washington, D.C.
Lagasse, P.F., Zevenbergen, L.W., Schall, J.D., and Clopper, P.E. (2001). Bridge Scour and Stream Instability Countermeasures: Experience, Selection and Design Guidance. Hydraulic Engineering Circular (HEC) No. 23, FHWA-NHI-01-003, Federal Highway Administration, Washington, D.C.

74
Melville, B., Ballegooy, S., Coleman, S., and Barkdoll, B. (2006). “Countermeasure Toe Protection at Spill-Through Abutments,” Journal of Hydraulic Engineering, pp. 235-245, DOI:10.1061/(ASCE)0733-9429(2006)132:3(235).
Melville, B., Ballegooy, S., Coleman, S., and Barkdoll, B. (2007). “Riprap Size Selection at Wing-Wall Abutments,” Journal of Hydraulic Engineering, pp. 1265-1269, DOI:10.1061/(ASCE)0733-9429(2007)133:11(1265).
MnDOT Specification 2511 (2014). Random Riprap Special, Minnesota Department of Transportation, St. Paul, MN, www.dot.state.mn.us
Parker, G., Toro-Escobar, C., and Voigt, R.L., Jr. (1998). Countermeasures to Protect Bridge Piers from Scour, NCHRP Project 24-7, prepared for National Cooperative Highway Research Program, Transportation Research Board by St. Anthony Falls Hydraulic Laboratory, University of Minnesota, MN.
Richardson, E.V., and Davis, S.R. (2001). Evaluating Scour at Bridges. Hydraulic Engineering Circular (HEC) No. 18, FHWA-NHI-01-001, Federal Highway Administration, Washington, D.C.
Simarro, G., Civeira S., and H. Cardoso A.H., (2012). “Influence of Riprap Apron Shape on Spillthrough Abutments,” Journal of Hydraulic Research, 50:1, 138-141, DOI: 10.1080/00221686.2011.650422
Toro-Escobar, C., Voigt, R., Melville, B., Chiew, M., and Parker, G. (1998). “Riprap Performance at Bridge Piers Under Mobile-Bed Conditions,” Transportation Research Record 1647, No. 98-1165, pp 27-33.
USACE, (1992). Engineering and Design: Design and Construction of Grouted Riprap. Engineer Technical Letter Number 1110-2-334, Department of the Army U.S. Army Corps of Engineers, Washington, DC.

Appendix A
Interviews with Practitioners

A-1
Appendix A - Interviews with Practitioners Interviews were conducted with practitioners who have had experience with matrix riprap installation, including engineers from MnDOT and the City of Andover. This section includes the authors’ interpretation of these interviews. Full transcripts from the MnDOT/Andover interview are available in Appendix A.
MnDOT has designed two matrix riprap abutments that were scheduled to be installed in summer 2012. The City of Andover installed one matrix riprap abutment on Coon Creek in October 2010, and planned one more installation for summer 2012. The primary motivation for the use of matrix riprap was to prevent vandalism at these sites. There were concerns of students from the local school rolling riprap down the abutment, and in similar situations riprap has been moved resulting in small dams in the adjacent waterways. Matrix riprap prevents this type of vandalism. Fully-grouted riprap can also prevent vandalism; however, it is less aesthetically pleasing, and there are concerns of failure because of uplifting pressures.
The greatest perceived weakness of matrix riprap for the interviewees is that it is a new and fairly unknown countermeasure approach, particularly when used at bridge abutments. MnDOT has called out for matrix riprap on one previous project, but it was not installed correctly because the contractor and inspectors did not understand the specifications. It has also been found that retrofitting matrix riprap onto existing bridge abutments is labor intensive. Riprap installation prior to bridge deck installation is preferable. Another issue with the approach was public acceptance; one resident near the Coon Creek project objected to the color of the grout contrasting with the riprap.
In the Coon Creek project, the installation specifications were closely followed. The biggest challenge was the long lead time on special grout testing equipment from Europe. It is expected that the specification will need to be updated as more projects are completed. For example, MnDOT engineers believe that the specifications should emphasize less grout instead of more grout. MnDOT engineers also suspect that the hose diameter should be limited to 2 to 3 inches, due to weight issues during installation. Both MnDOT and the City of Andover engineers feel that harder rock would reduce the risk of fracturing during installation.
The interviewees felt that the largest perceived challenge to the current specifications is percent grout. If 50% is specified, the upper half of the mat will be two-thirds filled while the lower half will be one-third filled. The amount of grout is largely left to the contractor’s judgment and is difficult to quantify percent grout in the field. MnDOT plans to conduct a 10-foot test section at the start of each project to insure that the contractor and inspector agree on the amount of grout to place. The City of Andover agrees that a 10-foot test section would be helpful. Both interviewees liked the idea of using voids space to estimate the grout volume required; however, both felt that it may be difficult to get correct in the field.
Both the City of Andover and MnDOT agree that grout will not be placed underwater. The MnDNR has resisted the use of grout underwater, and there are too many challenges to place grout underwater without leaching. There is some question as to how far above the waterline grouting needs to stop in order to prevent leaching into the water.
Based on the interviews, the questions most sought from this research are:
• The most important parameters to study are percent grout, rock gradation, and matrix riprap thickness.
• Will round rock work in matrix riprap?
• Best method to apply grout?

Appendix B
Matrix Riprap Installations - Field Photos

B-1
Appendix B – Matrix Riprap Installations - Field Photos
This appendix contains images of matrix riprap installations in Minnesota. The images are included to serve as an additional resource of installation and techniques.
Bridge 13001 at Highway 8 over Lake Lindstrom channel, Lindstrom, MN

B-2

B-3

B-4

B-5

B-6

B-7
Bridge 02528 – Prairie Road over Coon Creek, Andover, MN.