MATLAB Tutorial - West Virginia...
29
MATLAB Tutorial EE 327 Signals and Systems 1
-
Upload
trinhhuong -
Category
Documents
-
view
227 -
download
0
Transcript of MATLAB Tutorial - West Virginia...

MATLAB Tutorial
EE 327 Signals and Systems 1

What is MATLAB?
• MATLAB – Matrix Laboratory
• The premier number-crunching software
• Extremely useful for signal processing
– Has many built-in functions useful for learning
signals and systems

MATLAB Functionality
• Fundamental data type is a matrix
• Built-in support for complex numbers
• Many built-in functions
• Ability to create user-defined functions
• Interpreted language
– Easy to write code
– Do not have to compile code

Obtaining and Using MATLAB
• MATLAB can be found on many computers in the
department and ESB
– ESB 813 has MATLAB on 23 computers
– MATLAB is in many of the computer labs on the
second floor of ESB
• Purchasing MATLAB
– www.mathworks.com
– Student version available for $99
– Need the Control Systems Toolbox ($29)

MATLAB Alternatives (FREE)
• Octave
– www.gnu.org/software/octave
• Scilab
– www.scilab.org

Use of Matrices
• MATLAB uses matrices for all math operations
• Can create matrices/vectors in two ways– Specifically define each element in the matrix
A = [ 1 2 3; 4 5 6]
• Commas and spaces separate columns
• Semicolons separate rows
– Use the “colon operator”tt = 0:0.1:1
varname = startval:incrementval:stopval
• Everything “echoes” back to the screen– To suppress echoes, terminate the command with a
semicolon

Accessing Individual Elements of a Variable
• Access individual elements in a matrix– A(row,col)
– e.g. A(1,2) returns a value of 2
• For arrays that are single row or column matrices (called vectors), you only need one position– tt(5)
• Accessing an entire row or column– Use a colon to indicate all elements within a row or
column
– A(:,2) returns all rows in the second column
– This would return 2; 5

Finding the Size of a Variable
• size(variable_name)
• size(A)
• size(tt)
• Returns the size in terms of rows and columns

Determining the Variables in the Workspace
• who lists all variables in the workspace
• whos lists all variables with their sizes

Use of Matrices
MATLAB inherently works with matrices
• All operations default to matrix operations
• Let A = [ 1 2 3; 4 5 6];
• Let B = [1; 1; 1];
• C = A*B
– Returns 6; 15
• If you tell MATLAB to multiply, it assumes you mean matrix multiplication
• The ’ mark performs the transpose of the matrix– Ex. A’ returns 1 4; 2 5; 3 6
For element-by-element operation (multiplication, division, exponentiation, etc.)
• Use the “.” operator – Put a . before the operator
• Ex. tt_squared = tt.*tt;
• This also works with division (/) and exponentiation (^)

Creating Figures
Figures are used to graphically display data
• To create a new figure, type figure
• To create a specific figure number, type figure(number);
• Ex. figure(10);
• MATLAB will always plot to the most
recently selected figure

Plotting
Plotting continuous-time signals (make sure the sampling period is small enough)
• plot(independant_variable,dependant_variable);
• Ex. plot(tt,yy);
• You can change the color of the line with the optional argument plot(tt,yy,'r')
• Can add a second plot to the same figure by running the command hold on;
• Type help plot for more options

Plotting
Plotting discrete-time signals
• stem(independant_variable,dependant_
variable);
• Ex. stem(tt,yy);
• You can change the color of the markers with the optional argument stem(tt,yy,'r')
• Can add a second plot to the same figure by running the command hold on;
• Type help stem for more options

Labeling Plots
• You are able to label the axes and title your figures with text strings
• You must use text strings offset by ' marks within the appropriate function
– Labeling your plots•xlabel('Time (s)')
•ylabel('Output')
– Titling your plots•title('The Example Signal')

Creating Multiple Graphs in the Same Figure
• Use the subplot function to create
multiple graphs in the same figure
• subplot(rows_of_plots,columns
_of_plots,selected_plot)
• Ex. subplot(2,1,1); Creates two
plots (one above the other) and selects the
top one for plotting

Other Useful Plotting Commands
• Create a legend for all the traces on the plot– legend('Signal 1', 'Signal 2')
• Change the axes ranges to display only the range you desire– axis([low_x high_x low_y high_y])
– Ex. axis([-10 10 0 5]);
• Turn the grid on or off– grid Toggles the grid on or off
– grid on Turns the grid on
– grid off Turns the grid off
• Hold the plot to allow another signal to be plotted on the same plot– hold Toggles the hold function
– hold on Turns the hold function on
– hold off Turns the hold function off

Printing and Saving Your Plots
• Plots can be printed directly from the figure window
• Plots can also be saved in a variety of formats– .fig files
• .fig files are the default from the pull-down menu
• .fig files can only be reopened in MATLAB
– Metafile for use in Word documents and PowerPoint slides
• Copies the figure to the clipboard
• print –dmeta
– .eps files
• Encapsulated Post Script files
• Vectorized images
• For use in LaTeX files
• Called file_name.eps
• print –depsc file_name

Help on MATLAB Functions
• To receive help on MATLAB functions, simply type help function_name
• “help” will tell you many useful characteristics about the function
– Input arguments
– Output variables
– Operation of the function
– Related Functions

Saving Your Data
You are able to save all of your data in the workspace using the save function
• save file_name variable_1 variable_2...
• Ex. save ee327_example A tt
• Creates a file called ee327_example.mat
You can later load these variables by using the load function
• load file_name
• Ex. load ee327_example will load all variables contained in the .mat file (A and tt)
• This command will replace any existing variables of the same name that are already in the workspace

Use of Scripts
Instead of entering everything at the command line, you can write scripts (.m files) to allow you to save your steps
Uses the same syntax as the command line
• To create a new script, type edit at the command line
• To edit an existing script, type
edit filename
The % symbol comments everything following it on the line

Example of a Script for Plotting a Line
% script to plot a line
% will plot a straight line of the form y = mx + b
xx = -10:0.01:10;
yy = 2*xx + 5;
figure;
plot(xx,yy)
xlabel(‘Time (sec)’);
ylabel(‘y(t)’);
title(‘An Example of a Straight Line’);

Running a Script
Multiple operations for invoking a script
• Enter the filename of the script at the
command prompt
• Use the pull-down menu in Medit
• Simply press F5

Output of the Example Script
-10 -8 -6 -4 -2 0 2 4 6 8 10-15
-10
-5
0
5
10
15
20
25
Time (sec)
y(t
)An Example of a Straight Line

Debugging a Script
• MATLAB has a powerful debugger – use it!
• Can set breakpoints to stop the execution of commands– Use F12 to place or remove a breakpoint (or use the
“Debug” pull-down menu)
– When in “debug mode”• Can view the values of all variables
• Can run other commands while in “debug” mode
• Can step through the lines of code line by line with the F10 button
• Can resume execution (up to the next breakpoint) with F5
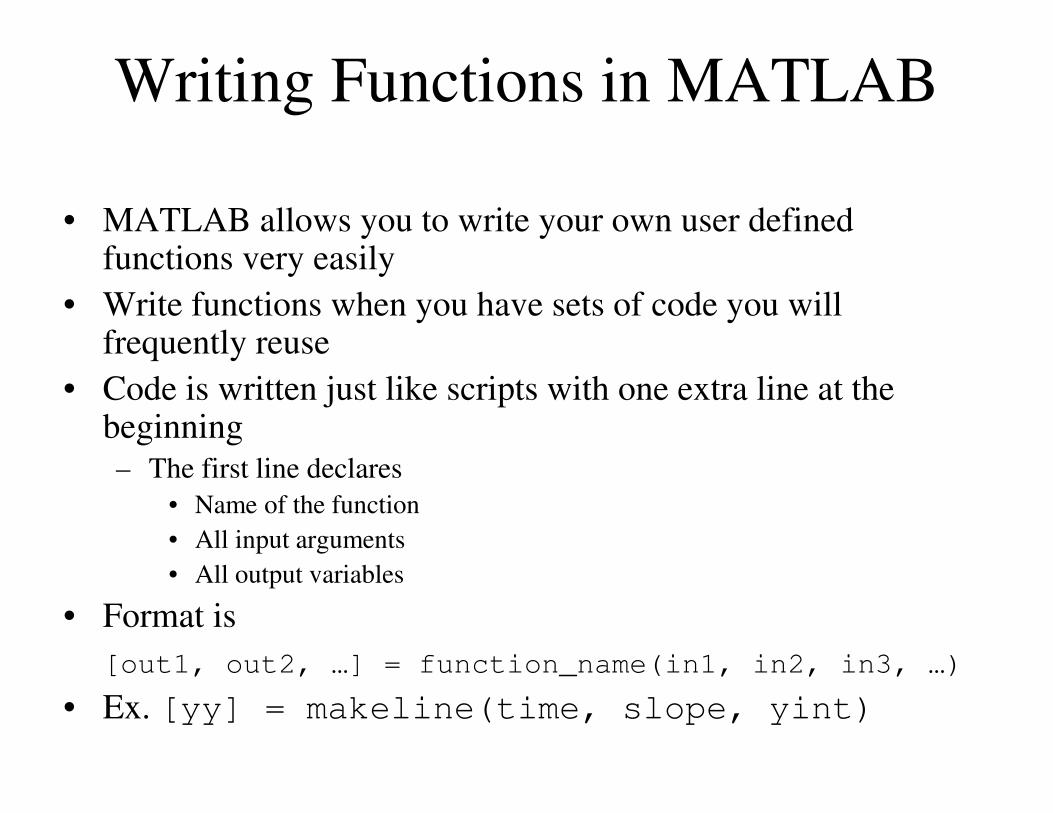
Writing Functions in MATLAB
• MATLAB allows you to write your own user defined functions very easily
• Write functions when you have sets of code you will frequently reuse
• Code is written just like scripts with one extra line at the beginning– The first line declares
• Name of the function
• All input arguments
• All output variables
• Format is
[out1, out2, …] = function_name(in1, in2, in3, …)
• Ex. [yy] = makeline(time, slope, yint)
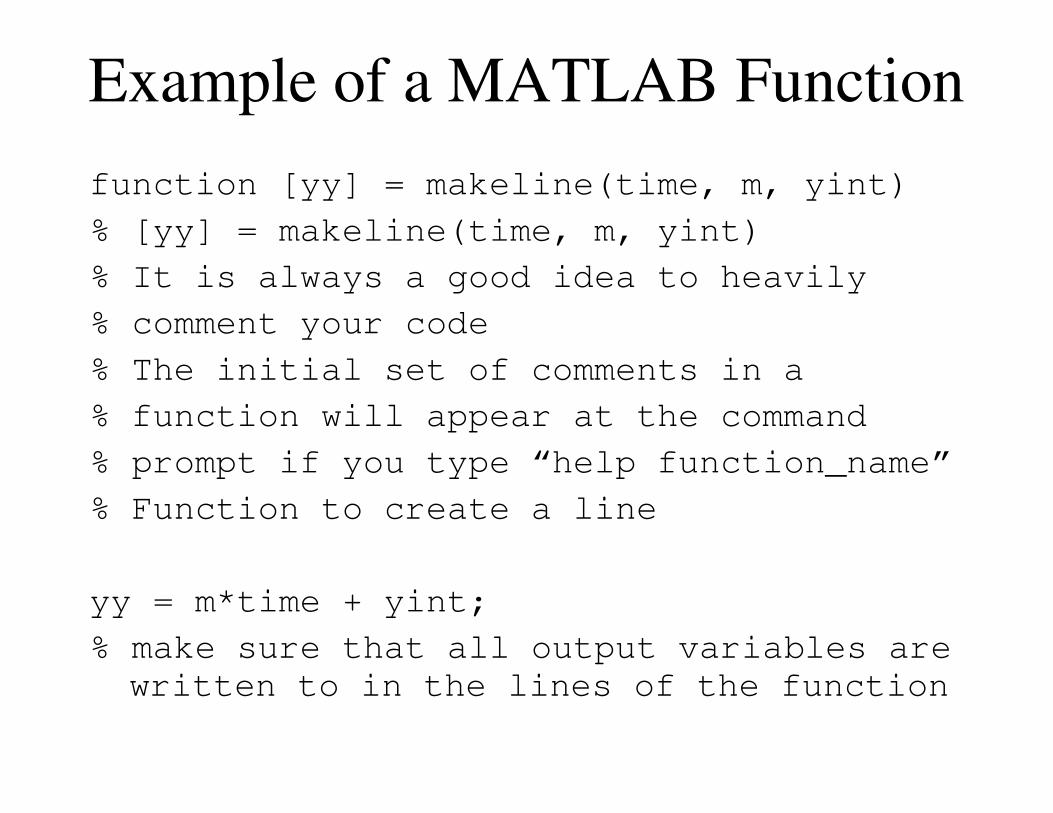
Example of a MATLAB Function
function [yy] = makeline(time, m, yint)
% [yy] = makeline(time, m, yint)
% It is always a good idea to heavily
% comment your code
% The initial set of comments in a
% function will appear at the command
% prompt if you type “help function_name”
% Function to create a line
yy = m*time + yint;
% make sure that all output variables are
written to in the lines of the function

Running a Function from the Command Line
• At the command line, simply call your user-
defined function like you would any other
function
• Ex. [yout] = makeline(tt,2,5);

Loops• You can write loops in MATLAB functions and scripts, much like any coding language
• FOR loopsfor ii=1:2:10
% ii is the loop counter (can call it anything)
% in this example, ii starts at 1, increments by 2 each time
% through the loop, and stops when it equals 10 (after going through
% that iteration)
% can access ii in the loop like any other variable
var1 = tt(ii);
% this would write the value of tt at element number ii
% to the variable var1
end
• WHILE loopswhile(condition)
% lines of code go here
% will execute this loop until the condition has been met
end
Examplewhile(xx < 10)
xx = xx + 2;
end
This will execute the loop until xx is greater than or equal to 10
(make sure you initialize xx before you start the loop)
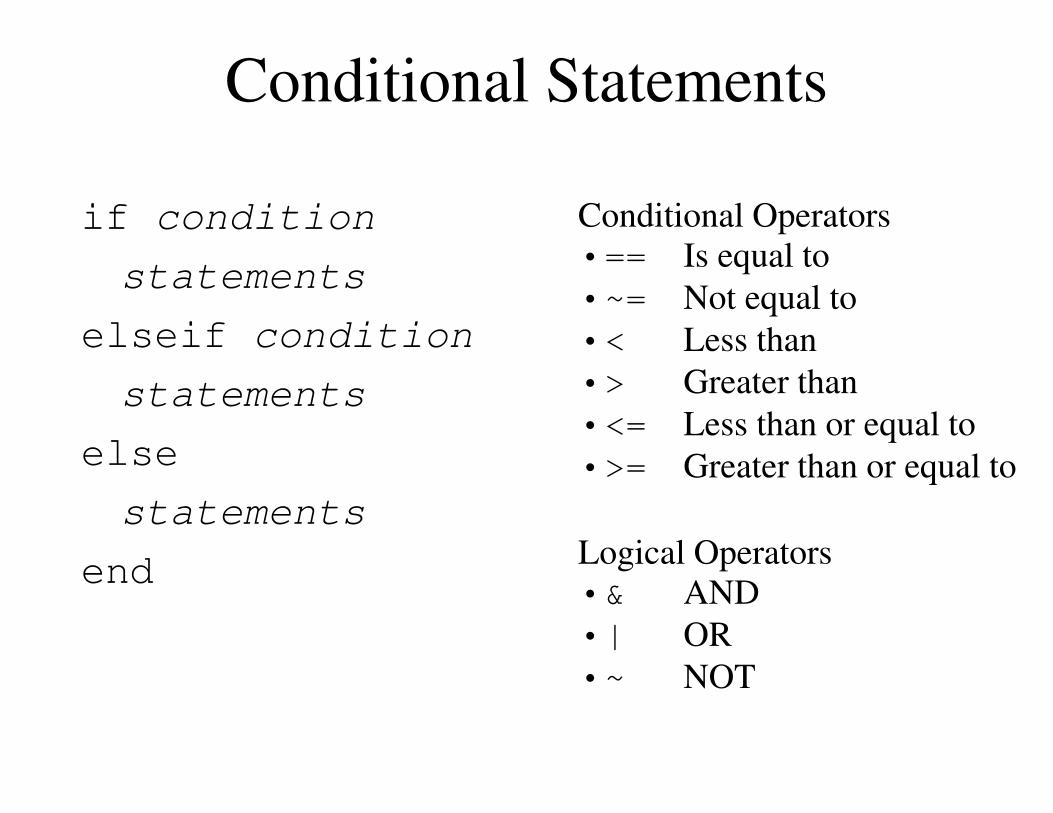
Conditional Statements
if condition
statements
elseif condition
statements
else
statements
end
Conditional Operators•== Is equal to
•~= Not equal to
•< Less than
•> Greater than
•<= Less than or equal to
•>= Greater than or equal to
Logical Operators•& AND
•| OR
•~ NOT