MATLAB Based SIMULATOR, Generating Telemetry Data Streams ...
12
Paper: ASAT-17-098-CE 17 th International Conference on AEROSPACE SCIENCES & AVIATION TECHNOLOGY, ASAT - 17 – April 11 - 13, 2017, E-Mail: [email protected] Military Technical College, Kobry Elkobbah, Cairo, Egypt Tel: +(202) 24025292 – 24036138, Fax: +(202) 22621908 1/12 MATLAB–Based SIMULATOR, Generating Telemetry Data Streams for Research Purposes Mohamed A. Elshafey * Abstract: This paper presents design and implementation of a MATLAB–based SIMULATOR for generating different telemetry data streams, based on different telemetry frame structures, in IRIG–106 telemetry standard. Presented SIMULATOR can be considered a tool for research and design of different efficient algorithms for telemetry data processing, including data compression codes, error correcting based algorithms, and frame synchronization methods. Description of different simulated telemetry signals is provided, including test patterns, harmonic signals, arbitrary digital sequences, recorded data, and filtered signals. The presented SIMULATOR supports different telemetry frame structures till commutation based on three stages of circuit switching with different frame synchronization codes in IRIG-106 standard format. The presented SIMULATOR is able to simulate the effect of imposing the telemetry data stream to Additive White Gaussian Noise (AWGN) on communication channel during transmission, as well as the effect of the noise from the on-board sensors during acquisition phase. Keywords: Telemetry simulator, telemetry data, telemetry frame structure, IRIG-106. 1. Introduction Nowadays, telemetry systems are widely used for both control and gathering information at some remote locations and transmitting data to a convenient distant location to be displayed, analyzed and recorded. The transmission media may be air and space for satellite and airborne applications, or copper wire and fiber cable for stationary ground environment [1,2]. The generic telemetry system is shown in figure, Fig. 1. In data acquisition subsystem, sensors measure the amount of a physical attribute and transform the measurement to an engineering unit value. The commutator measures each of the analog voltages and outputs a single stream of pulses, each with a voltage relative to the respective measured channel (Time Division Multiplexing TDM). The analog multiplexed data is then transformed to a digital form, then modulated and transmitted via radio transmitter and antenna, coax cable, telephone line, tape recorder, etc. to a receiving station. At the receiving station, the received data stream is amplified and the de-commutator recognizes the synchronization pattern and returns the serial digital stream to parallel data [1,2]. * Egyptian Armed Forces, Egypt, [email protected]
Transcript of MATLAB Based SIMULATOR, Generating Telemetry Data Streams ...
Paper: ASAT-17-098-CE
17th International Conference on
AEROSPACE SCIENCES & AVIATION TECHNOLOGY,
ASAT - 17 – April 11 - 13, 2017, E-Mail: [email protected]
Military Technical College, Kobry Elkobbah, Cairo, Egypt
Tel: +(202) 24025292 – 24036138, Fax: +(202) 22621908
1/12
MATLAB–Based SIMULATOR,
Generating Telemetry Data Streams for Research Purposes
Mohamed A. Elshafey*
Abstract: This paper presents design and implementation of a MATLAB–based SIMULATOR
for generating different telemetry data streams, based on different telemetry frame structures,
in IRIG–106 telemetry standard. Presented SIMULATOR can be considered a tool for research
and design of different efficient algorithms for telemetry data processing, including data
compression codes, error correcting based algorithms, and frame synchronization methods.
Description of different simulated telemetry signals is provided, including test patterns,
harmonic signals, arbitrary digital sequences, recorded data, and filtered signals. The presented
SIMULATOR supports different telemetry frame structures till commutation based on three
stages of circuit switching with different frame synchronization codes in IRIG-106 standard
format. The presented SIMULATOR is able to simulate the effect of imposing the telemetry
data stream to Additive White Gaussian Noise (AWGN) on communication channel during
transmission, as well as the effect of the noise from the on-board sensors during acquisition
phase.
Keywords: Telemetry simulator, telemetry data, telemetry frame structure, IRIG-106.
1. Introduction Nowadays, telemetry systems are widely used for both control and gathering information at
some remote locations and transmitting data to a convenient distant location to be displayed,
analyzed and recorded. The transmission media may be air and space for satellite and airborne
applications, or copper wire and fiber cable for stationary ground environment [1,2].
The generic telemetry system is shown in figure, Fig. 1. In data acquisition subsystem, sensors
measure the amount of a physical attribute and transform the measurement to an engineering
unit value. The commutator measures each of the analog voltages and outputs a single stream
of pulses, each with a voltage relative to the respective measured channel (Time Division
Multiplexing TDM). The analog multiplexed data is then transformed to a digital form, then
modulated and transmitted via radio transmitter and antenna, coax cable, telephone line, tape
recorder, etc. to a receiving station. At the receiving station, the received data stream is
amplified and the de-commutator recognizes the synchronization pattern and returns the serial
digital stream to parallel data [1,2].
* Egyptian Armed Forces, Egypt, [email protected]

Paper: ASAT-17-098-CE
2/12
Telemetry stream is a sequentially transmitted telemetry frames. A complete scan by the
commutator (one revolution) produces data words of the telemetry frame, which contains the
value of each measured parameter. Every scan produces the same sequence of words. Only a
value of measured parameter is captured. For the process of de-commutation, a unique frame
synchronization code is added to each frame to serve as a reference and again values of the
parameters are extracted again it into individual measured values, etc. The length of the frame
synchronization code is longer than usual data words to reduce the probability of actual data
matching [1,2].
Fig. 1. Generic telemetry system
This article describes the theoretical basis and practical details of a software simulation for
generation telemetry data streams for research purposes. The SIMULATOR is an important
component of telemetry data registering system. As a rule, the simulators used to test individual
system components at the design stage, and to validate the operation of the system before
experiments at telemetry data receiving stage. The SIMULATOR also allows to simulate
situations that are impossible or very expensive to reproduce in real world.
It should be noted that the functional hardware and software implementations of simulators are
primarily directed to solve problems arising in the manufacture and operation of telemetric
systems for various applications. In these devices, there is no functionality required for
development and research purposes. Some commercially available means of registering
telemetry data including embedded hardware [3,4] or software [5,6,7] simulators. These
simulators allow to generate simple test data series, for example, by increasing or decreasing
values of counters in all channels of the main telemetry frame. Such simulators, primarily
designed to test the readiness of the system before starting reception of telemetry data. They
may also be used for troubleshooting and debugging registration system during its operation.
The proposed SIMULATOR in this work is intended for research purposes for improving
algorithms of real time telemetry data processing such that: telemetry data compression for
transmission or achieving needs [8], implementing of error correcting codes for telemetry data
during transmission over a noisy channel and also studying synchronization methods of
telemetry frames in the received telemetry stream at the registering telemetry system [9]. The
presented SIMULATOR is able to generate various types of signals for transmission over
channels of telemetry data collection system. It can be a simple test signals, such as a constant
value or a digital counter that iterates over all possible values of the commutator, or signals that
simulate the telemetric information, including harmonic, non-harmonic signals as well as
signals generated by linear filters. The presented SIMULATOR allows to simulate the effect of
imposing to Additive White Gaussian Noise (AWGN) in transmission channel, as well as the
distortion of individual parameters measured at collection stage at the on-board circuit
switching and collecting of telemetry data and that is especially valuable in tests of the received
Data acquisition
Commutation
Modulation &
Transmission Communication
channel
Receiving &
Demodulation
De-commutation
Data Processing

Paper: ASAT-17-098-CE
3/12
or de-commutated data blocks, also it provides a simulation capability of failures in service
information, which provides frame synchronization in telemetry stream.
The most challenging modern telemetry systems are used in aerospace research. To achieve a
certain level of standardization, telemetry data streams, generated by the proposed
SIMULATOR, are in accordance with standard IRIG–106 (Class I) [10,11]. It is a widely used
standard in the industry, developed for representing telemetry information. It is an open
standard, that is supported by Telemetry Group Organization, RCC. The standard was originally
developed for use in the aerospace industry, however, now it is used in telemetry systems for
various purposes. Usefulness of the standard proved its wide application in industry.
2. Telemetry Stream in IRIG-106 Standard Format The standard is defined by a switching circuit of up to two stages of commutation. The frame
structure is convenient in order to be able to create efficient algorithms of telemetry data
processing. At the same time, it satisfies the requirements of a wide range of applications.
Figure, Fig. 2. shows a circuit switching, consisting of two stages of commutation.
Fig. 2. Commutation scheme of telemetry information channels
All commutators in the scheme have a fixed number of channels. Single stage commutators
have the same number of channels and some channels may not be used. Commutators of 1st
and 2nd stage, tend to have a different number of channels. To this scheme, it is easy to add a
3rd stage of commutation, in which outputs of 3rd stage of commutation should be connected to
a dedicated channel of the 2nd stage.
The stream of telemetry data is divided into frames. Each frame contains a complete acquisition
cycle of all measured parameters of the TMI system. In standard IRIG–106, that frame is called
a Major_Frame. Format of the Major_Frame [10,11] is shown in figure, Fig. 2, which is limited
by a structure consisting of two commutation stages.
IRIG-106 Frames
MPm-1
MPm
MP1
MP2
MPi
2nd Stage Commutator
1st Stage Commutator
Measurable
Telemetry Parameters

Paper: ASAT-17-098-CE
4/12
In this figure, Fig. 3. Minor_Frame is an output frame from commutator of the 1st stage, starting
with the synchronization code (marker). Major_Frame consists of Z Minor_Frame(s). Z – is the
length of the frame from commutator of the 2nd stage. IRIG–106 standard allows Z value to be
not more than 256. Frame from 2nd stage commutator is called Sub_Frame and is passed in one
of the data words of the frame from 1st stage commutator. In figure, Fig. 3. the Sub_Frame is
added to data word W.
In figure, Fig. 3. telemetry frame is composed of series of data words; each data word holds a
quantized value of a sampled readout of a measurable telemetric parameter. All data words have
the same bit width. For the process of de-commutation, in addition to the data words, the
telemetry frame contains unique synchronization codes, which provide frame synchronization,
indicating start or end of each telemetry frame for each commutator. The length of the frame’s
synchronization code is longer than (or at least equal to) usual data words to reduce the
probability of actual data matching [1,10].
The software implementation of the presented SIMULATOR is performed using MATLAB
developing tool. The basis of selecting MATLAB is its ability for data processing and
visualization, as well as the ability to interact with the functions and subroutines written in C
language.
Fig. 3. Format of IRIG–106 telemetry Major_Frame
3. Functional Parts of the Presented SIMULATOR The SIMULATOR consists of several software components. Each component is implemented
as a separate module in MATLAB. The simulation process is divided into several steps, in each
of them, single or multiple modules are involved. Each simulation project is described by a
DIRECTORY of files containing all files of data and necessary describing information.
In the first step, a set of signals is generated for accommodation in channels of the commutating
system. Each signal is represented on equally spaced time series, containing the digital test
values or quantized values of signals, which simulate sensors’ measured data. For convenience,
the SIMULATOR allows to combine all data of an experiment in a single DIRECTORY. The
presented DIRECTORY has many graphical user interface (GUI) forms, allowing to manage
files relating to the experiment in the same project. At the end of the first stage, samples of test
signals are created and stored in EXCEL files. Then, if there is no need to change the contents
of these files, work on the second step can be started.
Sync. Code (Marker) Minor_Frame 1 2
Sync. Code (Marker) Minor_Frame
1 2
Sub
_F
ram
e
W1
W2
Wz
N
N
Sync. Code (Marker) Minor_Frame 1 2
Sync. Code (Marker) Minor_Frame 1 2

Paper: ASAT-17-098-CE
5/12
In the second step, a desired telemetry frame structure in IRIG–106 format is created, in which
telemetry test samples, from the first stage, are contained. For constructing the required
telemetry frame structure, a specific GUI form is used, which allows to create up to three stages
of commutating structure, of which the first two commutation stages are provided as in standard
IRIG–106 and the third is implemented as described above. In the project, at this simulation
step, a TEXT file is added, which contains the commutation structure of the telemetry frame
format. This structure is later required to reconstruct the sequence of signals from the telemetry
data frames. Additionally, in the project a BINARY file containing a binary data stream of
telemetry frames, based on the previously implemented frame structure, is created. At this step
of simulation, AWGN, in communication channel, can be implemented on the generated binary
telemetry data stream.
At last step, the third, the original telemetry test signals can be reconstructed from the binary
data stream. At this step, additional files, in EXCEL format, are created. In these files the
original measured signals, transmitted over a communication channel imposed to AWGN are
contained. These received samples of measured signals can be used as test data for control
operations and troubleshooting software and hardware telemetry data reception, also can be
implemented as inputs for telemetry data processing algorithms in different research purposes.
At the end of the third step, a BINARY file containing a noised copy of the telemetry data
stream is added to the project.
A brief description of the main functions the SIMULATOR is presented below.
3.1 Generation of Telemetry Test Signals The signal generation module allows creation of different types of series digital values or
quantized signal samples. Each such series simulates a series of data from one channel of the
telemetry. This module describes the type of signal among different allowable types and
additional associated parameters and settings, which specify number of quantization levels, the
sampling frequency, time duration of the signal, etc. An example of such configuration for a
sinusoidal signal shown in figure, Fig. 4.
The following types of signals are allowed to be generated by the SIMULATOR:
• Sine wave
𝑦(𝑡) = 𝐴 𝑠𝑖𝑛(𝜔𝑡 + 𝜑), (1)
• Sawtooth and triangular test signals
𝑦(𝑡) =𝑇
2−
𝑇
𝜋∑
sin(𝑘𝜔𝑡)
𝑘
∞𝑘=1 , (2)
• Rectangular pulses
𝑦(𝑡) =𝜏
𝑇− ∑
2
𝑘𝜋sin (
𝜋𝑘𝜏
𝑇) cos (
𝜋𝑘𝜏
𝑇𝑡)∞
𝑘=1 , (3)
• Reaction of linear control system to a step effect.
𝑦(𝑡) = ∫ ℎ(𝜏)𝐻(𝑡 − 𝜏)𝑑𝜏+∞
−∞ , (4)
• The impulse response of a linear control system.
The last two signals are primarily intended for use in engineering and scientific experiments.
These types of signals are also designed for modeling, complex and difficult reproducible, in
practice, scenarios’ behavior of the controlled object.
Examples of telemetry test signals generated by the presented SIMULATOR are shown below.

Paper: ASAT-17-098-CE
6/12
(a)
(b)
Fig. 4. Setting for (3) sinusoidal signals (a),
the generated signals by the SIMULATOR (b)
(a) (b)
(c) (d)
Fig. 5. Examples of generated telemetry test signals of different types: sawtooth signal and
triangular shape (a), the rectangular pulse and continuous signals (b), reaction of linear control
system to a step effect (c), impulse response of linear control system (d).

Paper: ASAT-17-098-CE
7/12
3.2 Applying Required Telemetry Frame Structure and Generating
the Corresponding Binary Telemetry Data Stream In the proposed SIMULATOR a method for determining telemetry frame structure using a new
GUI form is implemented. Description of the structure created by the operator is used to
generate a binary telemetry data stream in IRIG–106 format from samples of test signals, which
are generated from the previous simulation’s step. The generated stream is then stored in a
specific BINARY file. The frame structure is also stored in specific TEXT file. This structure
is then used for the de-commutation process for the telemetry signals from the generated binary
stream. Figure, Fig. 6. shows a simulation of generating a telemetry frame, which is composed
of (11) channels. The Minor_Frame is composed of (8) words. The Sub_Frame (which is the
generated from the 2nd stage of commutation, which contains (3) signals from Sensor5, Sensor6
and Sensor7) is transmitted in the 5th data word of the Minor_Frame. Sub_Sub_Frame (a frame
generated from the commutation of the 3rd stage, which contains (2) telemetry signals from
Sensor8 and Sensor9) is passed in the 2nd and 6th data word of the Sub_Frame.
(a)
(b)
Fig. 6. Example of a commutation structure of an IRIG-106 frame: Required (a),
Applied by the SIMULATOR (b)

Paper: ASAT-17-098-CE
8/12
The SIMULATOR allows the creation of up to three stages of commutation in the implemented
telemetry frame structure. Initially, in the commutation of the 1st stage, all channels are
allocated for all the test signals. All test signals are displayed in a common list and added to the
Major_Frame, which is then consisting of one Minor_Frame at this step, in which all
Sub_Frames are missing. Next, a list of selected test signals can be connected to the
commutation of the 2nd and 3rd stage of commutation.
The process of implementing the structure of the telemetry frame contains elements of
automation. Limitations are checked in accordance with the requirements of the standard IRIG–
106. Number of bits in the frame of the main commutator (Minor_Frame) and the length of the
Sub_Frames are verified. A pre-selected marker (synchronization code) form a list of available
(18) markers, listed in IRIG-106 standard, is automatically added to the frame of the main
commutator. In Sub_Frames and Sub_Sub_Frames, counters are inserted for frame
synchronization process. Standard synchronization codes for telemetry frame in IRIG–106
standard frame format are presented below.
Table 1. Markers used in IRIG–106 standard
Code length (in bits) Code Format
16 111 010 111 001 000 0
17 111 100 110 101 000 00
18 111 100 110 101 000 000
19 111 110 011 001 010 000 0
20 111 011 011 110 001 000 00
21 111 011 101 001 011 000 000
22 111 100 110 110 101 000 000 0
23 111 101 011 100 110 100 000 00
24 111 110 101 111 001 100 100 000
25 111 110 010 110 111 000 100 000 0
26 111 110 100 110 101 100 110 000 00
27 111 110 101 101 001 100 110 000 000
28 111 101 011 110 010 110 011 000 000 0
29 111 101 011 110 011 001 101 000 000 00
30 111 110 101 111 001 100 110 100 000 000
31 111 111 100 110 111 110 101 000 010 000 0
32 111 111 100 110 101 100 101 000 010 000 00
33 111 110 111 010 011 101 001 010 010 011 000
Fig. 7. shows an example of the TEXT file, which contains description of a telemetry frame
structure, that is created by the presented SIMULATOR.
Fig. 7. Example of a TEXT file describing a telemetry frame structure

Paper: ASAT-17-098-CE
9/12
The length of the Major_Frame (expressed in bits), of the above example, is calculated as:
𝐿𝑜𝑘 = 8𝐿𝑠𝑦𝑛𝑐_𝑓 + 8𝐿𝑠𝑦𝑛𝑐_𝑠𝑓1 + 2𝐿𝑠𝑦𝑛𝑐_𝑠𝑠𝑓1 + 64𝐿𝑑𝑎𝑡𝑎, (5)
where 𝐿𝑠𝑦𝑛𝑐_𝑥𝑥 is the number of bits used to represent synchronization codes of different
commutation stages; 𝐿𝑠𝑦𝑛𝑐_𝑓 − marker for each Minor_Frame, 𝐿𝑠𝑦𝑛𝑐_𝑠𝑓1 − marker of the
Sub_Frame, 𝐿𝑠𝑦𝑛𝑐_𝑠𝑠𝑓1 − marker of the Sub_Sub_Frame and 𝐿𝑑𝑎𝑡𝑎 − length of a telemetry data
word in bits.
3.3 Simulation of AWGN in the Communication Channel The SIMULATOR uses a mathematical model of the communication channel [12], in which
signal to noise ratio (SNR) of binary channel with additive Gaussian noise is defined by:
𝑆𝑁𝑅 =𝐸𝑏
𝑁0=
𝜇2
2𝜎2 , (6)
where 𝐸𝑏 − bit energy, 𝑁0 − The noise power spectral density. parameter 𝜇 = 1 , then SNR
depends only on the variance 𝜎2.
Based on the above theoretical model, algorithm is developed to simulate the effect of imposing
telemetry stream to AWGN in the communication channel. Input for this process is extracted
from the BINARY file, which contains the original telemetry data in standard IRIG–106 frame
format. Simulation’s result is also stored in an additional BINARY file.
Noise modeling procedure in the communication channel is presented below.
function Noised_Data=Add_Noise(Data,BER)
EbN0=(erfcinv(BER*2))^2; % erfinv () - the inverse complementary error function
N0=1/ EbN0; % Eb = 1
var=n0/2; % Variance = N0 / 2
sigma=sqrt(var); % Standard Deviation (sigma)
Data = 2* Data -1; % Binary Phase Shift Keying 0 -> -1; 1 -> 1
Noise=sigma*randn(length(Data),1); % Generation of White Gaussian Noise with a
% given standard deviation (sigma)
Noised_Data = Data + Noise; % Adding AWGN to Data
Noised_Data = Noised_Data > 0;
Fig. 8. BER Curve: Theoretical and by SIMULATOR
Parameter BER in the presented algorithm determines bit error rate. This value is determined
by the formula:
𝐵𝐸𝑅 =1
2𝑒𝑟𝑓𝑐 (√
𝐸𝑏
𝑁𝑜) , (7)
Paper: ASAT-17-098-CE
10/12
where erfc – error function, which is defined by:
𝑒𝑟𝑓𝑐 =2
√𝜋∫ 𝑒−𝑡
2𝑑𝑡
∞
𝑥. (8)
As a result of this algorithm, a BINARY file containing a noisy binary telemetry data stream,
is added to the simulation project.
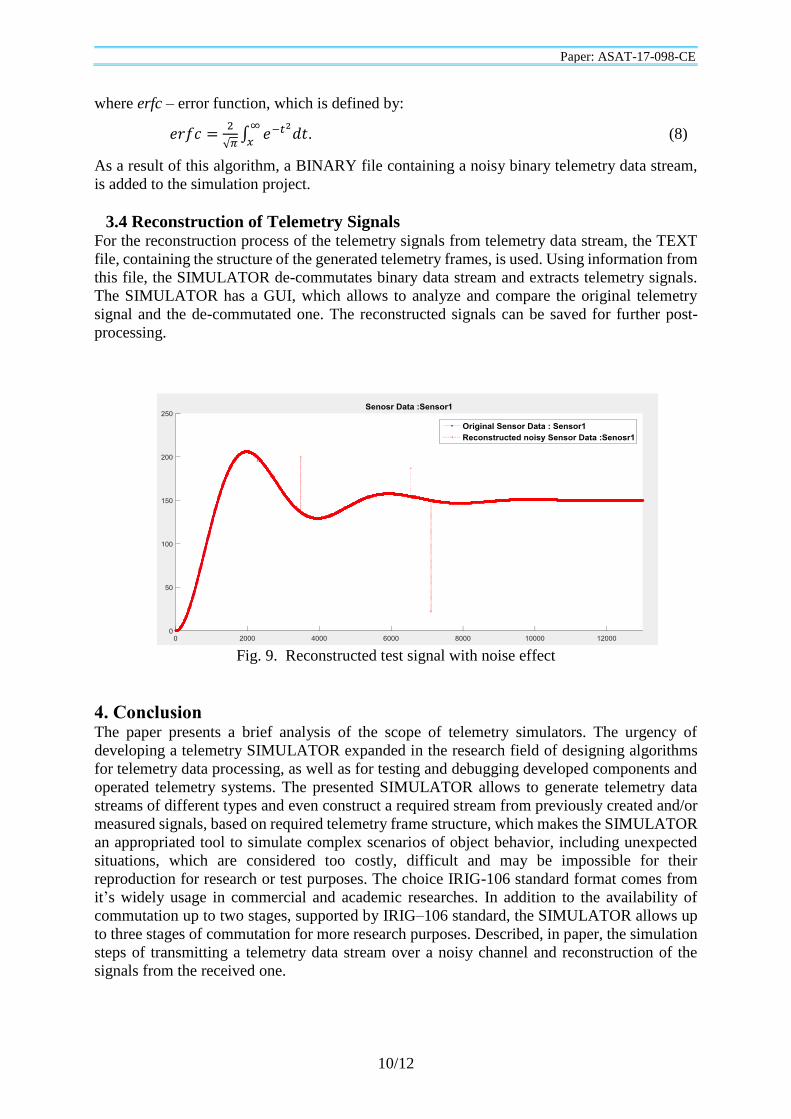
3.4 Reconstruction of Telemetry Signals For the reconstruction process of the telemetry signals from telemetry data stream, the TEXT
file, containing the structure of the generated telemetry frames, is used. Using information from
this file, the SIMULATOR de-commutates binary data stream and extracts telemetry signals.
The SIMULATOR has a GUI, which allows to analyze and compare the original telemetry
signal and the de-commutated one. The reconstructed signals can be saved for further post-
processing.
Fig. 9. Reconstructed test signal with noise effect
4. Conclusion The paper presents a brief analysis of the scope of telemetry simulators. The urgency of
developing a telemetry SIMULATOR expanded in the research field of designing algorithms
for telemetry data processing, as well as for testing and debugging developed components and
operated telemetry systems. The presented SIMULATOR allows to generate telemetry data
streams of different types and even construct a required stream from previously created and/or
measured signals, based on required telemetry frame structure, which makes the SIMULATOR
an appropriated tool to simulate complex scenarios of object behavior, including unexpected
situations, which are considered too costly, difficult and may be impossible for their
reproduction for research or test purposes. The choice IRIG-106 standard format comes from
it’s widely usage in commercial and academic researches. In addition to the availability of
commutation up to two stages, supported by IRIG–106 standard, the SIMULATOR allows up
to three stages of commutation for more research purposes. Described, in paper, the simulation
steps of transmitting a telemetry data stream over a noisy channel and reconstruction of the
signals from the received one.

Paper: ASAT-17-098-CE
11/12
5. References
[1] Carden F., Jedlicka R., Henry R, Telemetry Systems Engineering. London (UK): Artech
House, 2002, 622 p.
[2] Horan S., Introduction to PCM Telemetering Systems. 2nd Edition. USA: CRC Press,
2002, 448 p.
[3] TelSim Telemetry Simulator. ССЕ Corp. URL: http://cctcorp.com/products/telemetry-
acquisition-simulation/telsim/
[4] MAG_200/SIM_RF Mobile RF Telemetry Simulation Station Data Sheet. ADAS
URL: http://www.magali.com/telemesure/pdf/MAG_200_SIM-RF.pdf.
[5] TarsusHS-PCI-01 33Mbps PCM Processor Data Sheet. ULYSSIX Technologies.
URL: http://www.ulyssix.com/Downloads/Brochures/TarsusHS-PCI-01.pdf.
[6] ALSEP Telemetry Data Simulation. Aerospace System Division. 1967, pp. 43 URL:
http://www.lpi.usra.edu/lunar/ALSEP/pdf/ALSEP%20%23222%20-
%20Telemetry%20Data%20Sim_ATM%20646.pdf
[7] Douglas C. et al. Virtual telemetry for dynamic data-driven application simulations //
ICCS'03 Proc. of ICCS. Berlin: Springer Verlag, 2003. pp. 279-288.
[8] Lossless Data Compression. Report Concerning Space Data System Standard,
Informational Report CCSDS 120.0 G-3 Green Book. 2013.
[9] TM Synchronization and Channel Coding-Summary of Concept and Rationale. Report
Concerning Space Data System Standard. Informational Report CCSDS 130.1-G-2.
Green Book. Issue 2. November 2012. Washington, DC, USA, CCSDS, 2012.
[10] Telemetry Standards, IRIG Standard 106-13. New Mexico: Secretariat Range
Commanders Council US Army White Sand Missile Range. 2013.
URL:http://www.irig106.org/docs/106-13/
[11] IRIG 106. Chapter 10 Programming Handbook. New Mexico:
Secretariat Range Commanders Council U.S. Army White Sands Missile
Range. URL: http://www.irig106.org/docs/123-09/IRIG_106
07_Chapter_10_Programming_Handbook.pdf.
[12] Johnson S. J. Iterative Error Correction: Turbo, Low Density Parity Check and Repeat
Accumulate Codes. Cambridge University Press. 2009.

Paper: ASAT-17-098-CE
12/12
Flowchart of the functional parts of the presented Simulator
GUI Display
START
Read Project
Name
1st Sub-
Program?
Select Required
Sub-Program
Creation of Required Signals with
Different Characteristics
Storage Samples in an
EXCEL File
Telemetry Data Processing
Formulation of Initial
Telemetry Frame
Change Sensors Positions to
Obtain Required Frame
Structure
Generation of the Binary
Stream
Generation on AWGN
Input Required BER
Generation on Noisy
Telemetry Stream
GUI Display
END
Storage in an EXCEL
File
Storage of Noisy
Binary Stream in a
BINARY File
Storage of Binary Stream in a
BINARY File
Storage in an EXCEL File
GUI Display
Select Type of Test
Signals
1st Sub-Program
2nd Sub-Program
Addition of Pre-Determined
Markers
Storage of Frame Structure in
a TEXT File
2nd Sub-
Program?
3rd Sub-Program
yes
yes
no
yes no
yes