Matlab-based GUI User’s Guide -...
22
Matlab-based GUI Running Common Rout Command Line Interfac Illinois Structural Health Monitor February 2011 I User’s Guide tines of the ISHMP Toolsuite witho ce ring Project out the
Transcript of Matlab-based GUI User’s Guide -...
Matlab-based GUI User’s Guide
Running Common Routines of the ISHMP Toolsuite without the
Command Line Interface
Illinois Structural Health Monitoring Project
February 2011
based GUI User’s Guide
Running Common Routines of the ISHMP Toolsuite without the
Command Line Interface
Illinois Structural Health Monitoring Project
Running Common Routines of the ISHMP Toolsuite without the
ISHMP Matlab-based GUI
February 2011 2 http://shm.cs.uiuc.edu
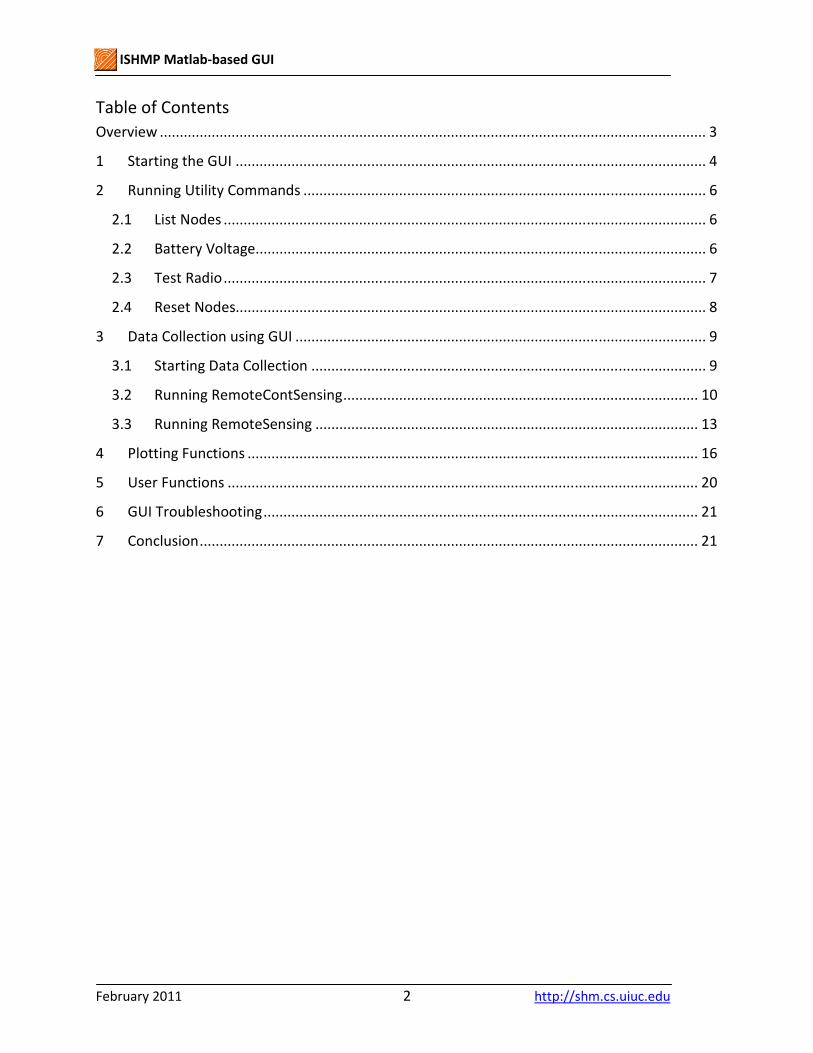
Table of Contents
Overview ......................................................................................................................................... 3
1 Starting the GUI ...................................................................................................................... 4
2 Running Utility Commands ..................................................................................................... 6
2.1 List Nodes ......................................................................................................................... 6
2.2 Battery Voltage ................................................................................................................. 6
2.3 Test Radio ......................................................................................................................... 7
2.4 Reset Nodes...................................................................................................................... 8
3 Data Collection using GUI ....................................................................................................... 9
3.1 Starting Data Collection ................................................................................................... 9
3.2 Running RemoteContSensing ......................................................................................... 10
3.3 Running RemoteSensing ................................................................................................ 13
4 Plotting Functions ................................................................................................................. 16
5 User Functions ...................................................................................................................... 20
6 GUI Troubleshooting ............................................................................................................. 21
7 Conclusion ............................................................................................................................. 21

ISHMP Matlab-based GUI
February 2011 3 http://shm.cs.uiuc.edu
Overview
This guide outlines how to use the Illinois Structural Health Monitoring Project (ISHMP) GUI to
run common routines of the ISHMP Toolsuite without the command line interface. The GUI is a
reference implementation that can be used as is, or can provide a foundation for building your
own interfaces to the Imote2. This guide assumes the user has followed either the “Getting
Started for New Users” or “Getting Started for Advanced Users” guides and has Imote2s
configured with the ISHMP Version 3.0.0 Toolsuite.
Following the instructions in this guide will allow you to:
• Collect and visualize acceleration data using RemoteContSensing or RemoteSensing from
a network of Imote2s using ISM400 sensor boards
• Run basic commands, such as listing nodes in the network and determine battery
voltage
The hardware and software required to use this guide is:
• Computer running the Windows operating system
• Matlab (version 2009a or higher)
• USB to mini cable
• IPR2400 or IPR2420 Imote2 loaded with the ISHMP Toolsuite
• IIB2400 interface board
• IBB2400CA battery board
• ISM400 (formerly the SHM-A) sensor board
Several additional files, ISHMP-GUI-2.0.0.zip, are required to successfully follow this guide. The
files are available for download at the ISHMP website at: http://shm.cs.uiuc.edu/files/ISHMP-
GUI-2.0.0.zip .
You will need at least two Imote2s to create a “network.” One Imote2 will connect to the PC
via the USB and act as the gateway between the PC and your network of remote sensors. This
guide will refer to an Imote2 connected to the PC as a gateway node and nodes in the network
as leaf nodes.
Note that in this document, Matlab commands appear in Courier New font, Imote2
applications appear in the Italicized Calibri font, and filenames appear in the Lucida Console
font.
Comments and Questions:
If you have questions about the software or this guide, or run into problems, please join us on
the Imote2 discussion forum: http://vibration.shef.ac.uk/imote2_forum.
ISHMP Matlab-based GUI
February 2011 4 http://shm.cs.uiuc.edu
1 Starting the GUI
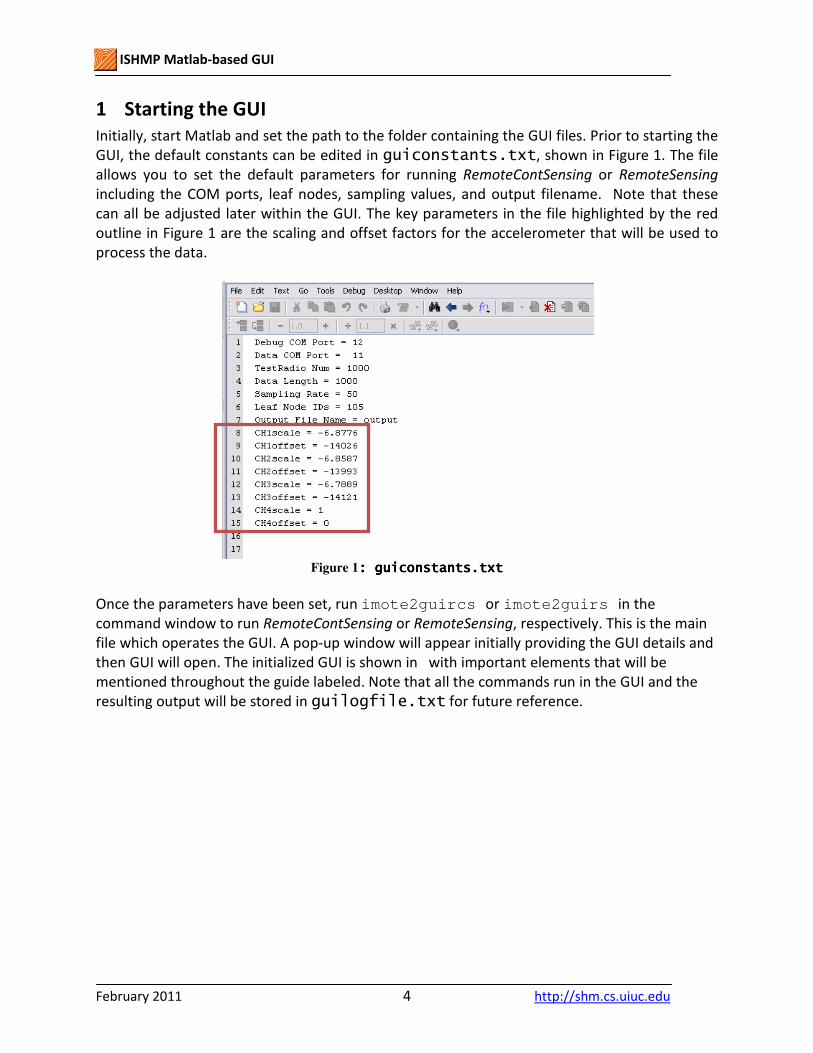
Initially, start Matlab and set the path to the folder containing the GUI files. Prior to starting the
GUI, the default constants can be edited in guiconstants.txt, shown in Figure 1. The file
allows you to set the default parameters for running RemoteContSensing or RemoteSensing
including the COM ports, leaf nodes, sampling values, and output filename. Note that these
can all be adjusted later within the GUI. The key parameters in the file highlighted by the red
outline in Figure 1 are the scaling and offset factors for the accelerometer that will be used to
process the data.
Figure 1: guiconstants.txt: guiconstants.txt: guiconstants.txt: guiconstants.txt
Once the parameters have been set, run imote2guircs or imote2guirs in the
command window to run RemoteContSensing or RemoteSensing, respectively. This is the main
file which operates the GUI. A pop-up window will appear initially providing the GUI details and
then GUI will open. The initialized GUI is shown in with important elements that will be
mentioned throughout the guide labeled. Note that all the commands run in the GUI and the
resulting output will be stored in guilogfile.txt for future reference.
ISHMP Matlab-based GUI
February 2011 5 http://shm.cs.uiuc.edu
Figure 2: ISHMP GUI at startup with key elements highlighted.
Message Window
Command Line
Plot Window
NodeID Box
Progress
Bar
ISHMP Matlab-based GUI
February 2011 6 http://shm.cs.uiuc.edu
2 Running Utility Commands
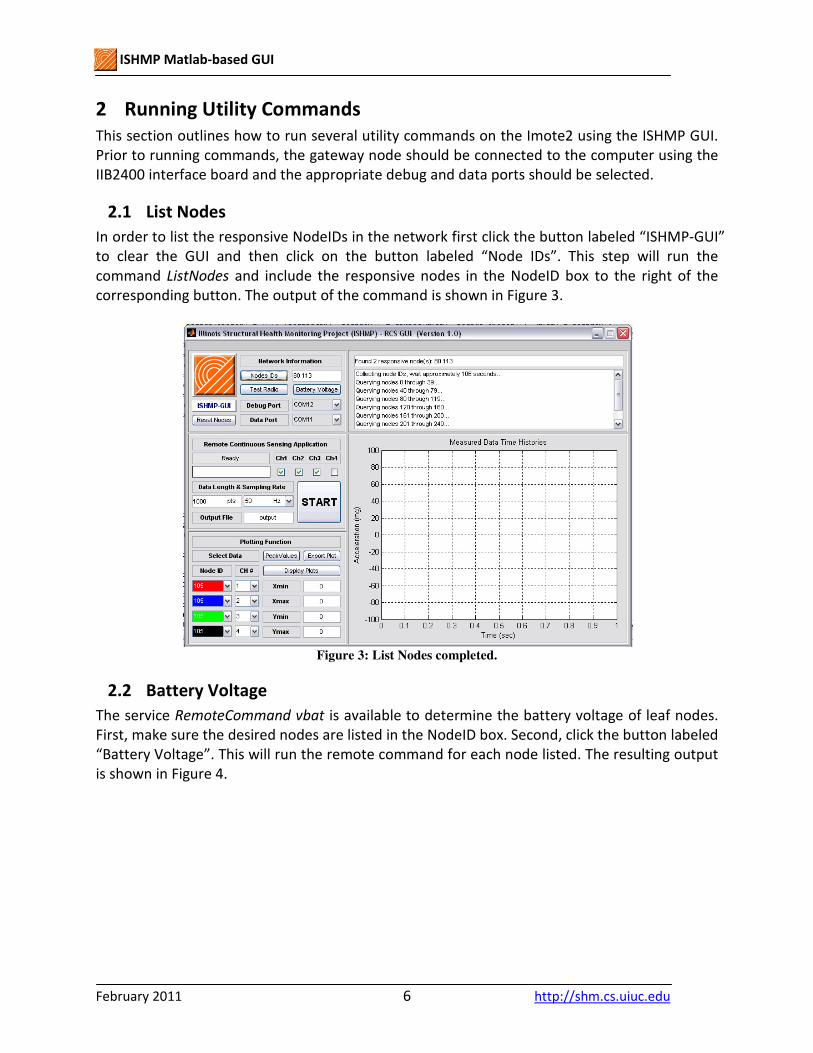
This section outlines how to run several utility commands on the Imote2 using the ISHMP GUI.
Prior to running commands, the gateway node should be connected to the computer using the
IIB2400 interface board and the appropriate debug and data ports should be selected.
2.1 List Nodes
In order to list the responsive NodeIDs in the network first click the button labeled “ISHMP-GUI”
to clear the GUI and then click on the button labeled “Node IDs”. This step will run the
command ListNodes and include the responsive nodes in the NodeID box to the right of the
corresponding button. The output of the command is shown in Figure 3.
Figure 3: List Nodes completed.
2.2 Battery Voltage
The service RemoteCommand vbat is available to determine the battery voltage of leaf nodes.
First, make sure the desired nodes are listed in the NodeID box. Second, click the button labeled
“Battery Voltage”. This will run the remote command for each node listed. The resulting output
is shown in Figure 4.
ISHMP Matlab-based GUI
February 2011 7 http://shm.cs.uiuc.edu
Figure 4: Battery voltage output.
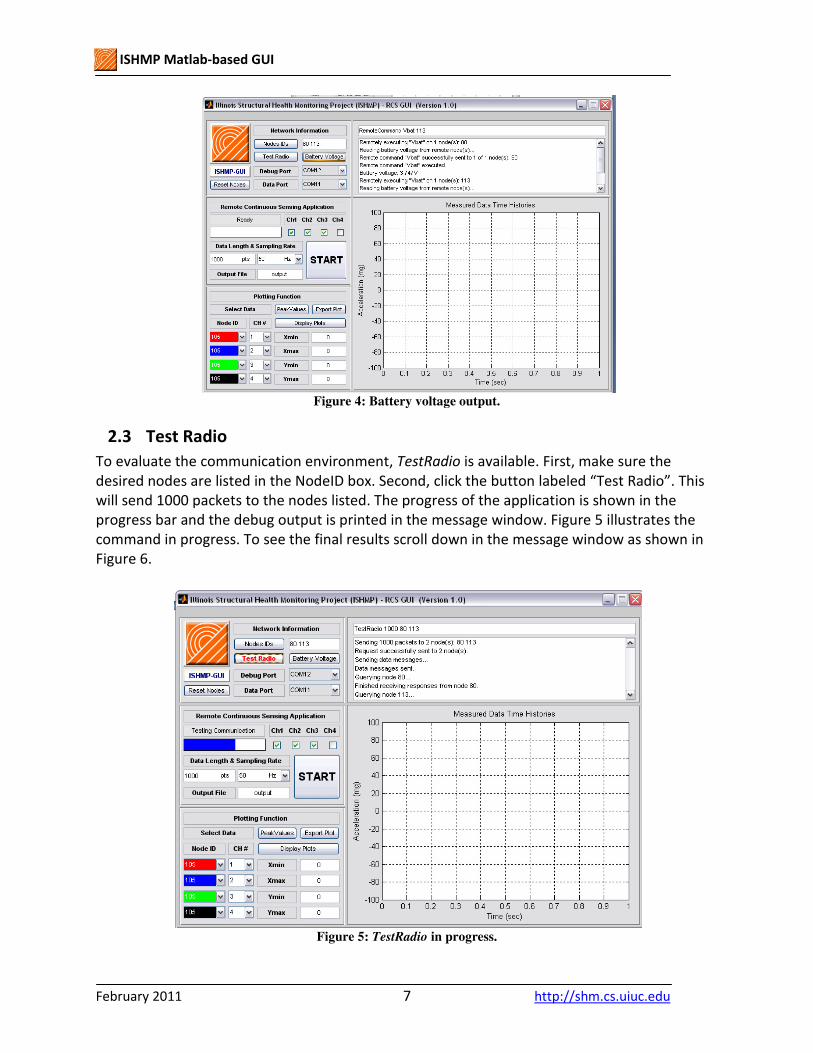
2.3 Test Radio
To evaluate the communication environment, TestRadio is available. First, make sure the
desired nodes are listed in the NodeID box. Second, click the button labeled “Test Radio”. This
will send 1000 packets to the nodes listed. The progress of the application is shown in the
progress bar and the debug output is printed in the message window. Figure 5 illustrates the
command in progress. To see the final results scroll down in the message window as shown in
Figure 6.
Figure 5: TestRadio in progress.
ISHMP Matlab-based GUI
February 2011 8 http://shm.cs.uiuc.edu
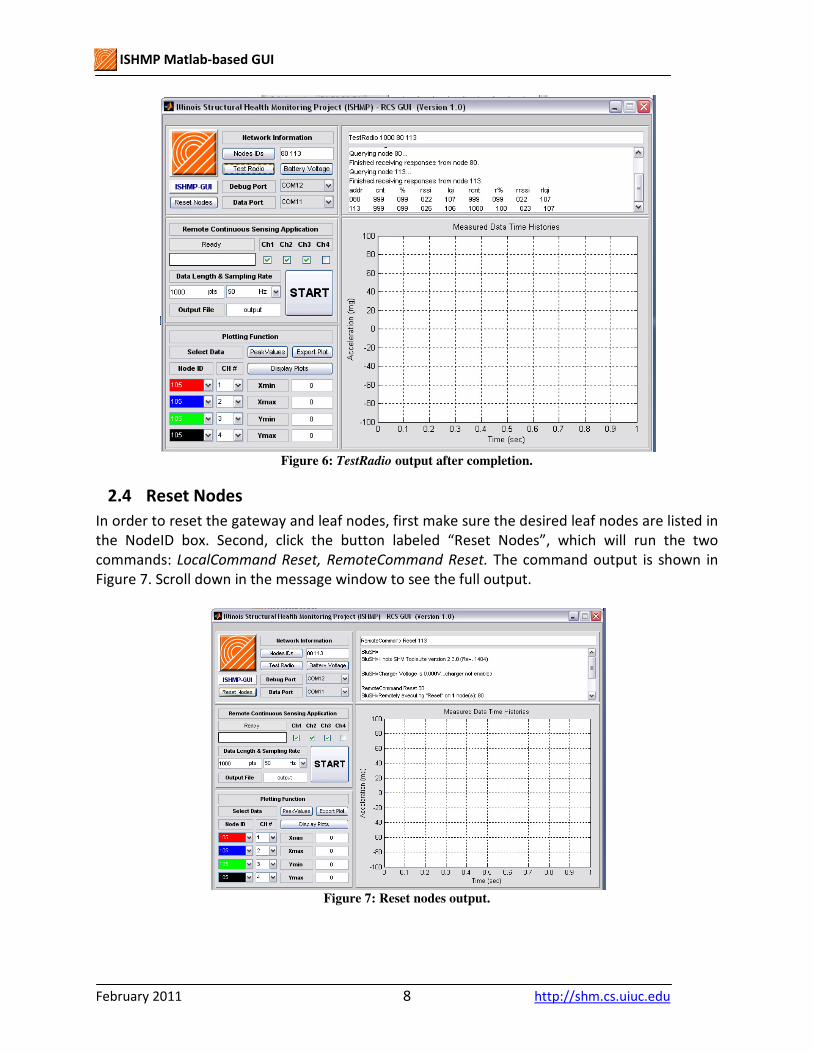
Figure 6: TestRadio output after completion.
2.4 Reset Nodes
In order to reset the gateway and leaf nodes, first make sure the desired leaf nodes are listed in
the NodeID box. Second, click the button labeled “Reset Nodes”, which will run the two
commands: LocalCommand Reset, RemoteCommand Reset. The command output is shown in
Figure 7. Scroll down in the message window to see the full output.
Figure 7: Reset nodes output.
ISHMP Matlab-based GUI
February 2011 9 http://shm.cs.uiuc.edu
3 Data Collection using GUI
The GUI allows the user to acquire acceleration data using either RemoteContSensing or
RemoteSensing and visualize the output. The acceleration data is displayed in near real-time if
RemoteContSensing is running. Furthermore, various combinations of the output can be plotted
and the accompanying peak values can be calculated.
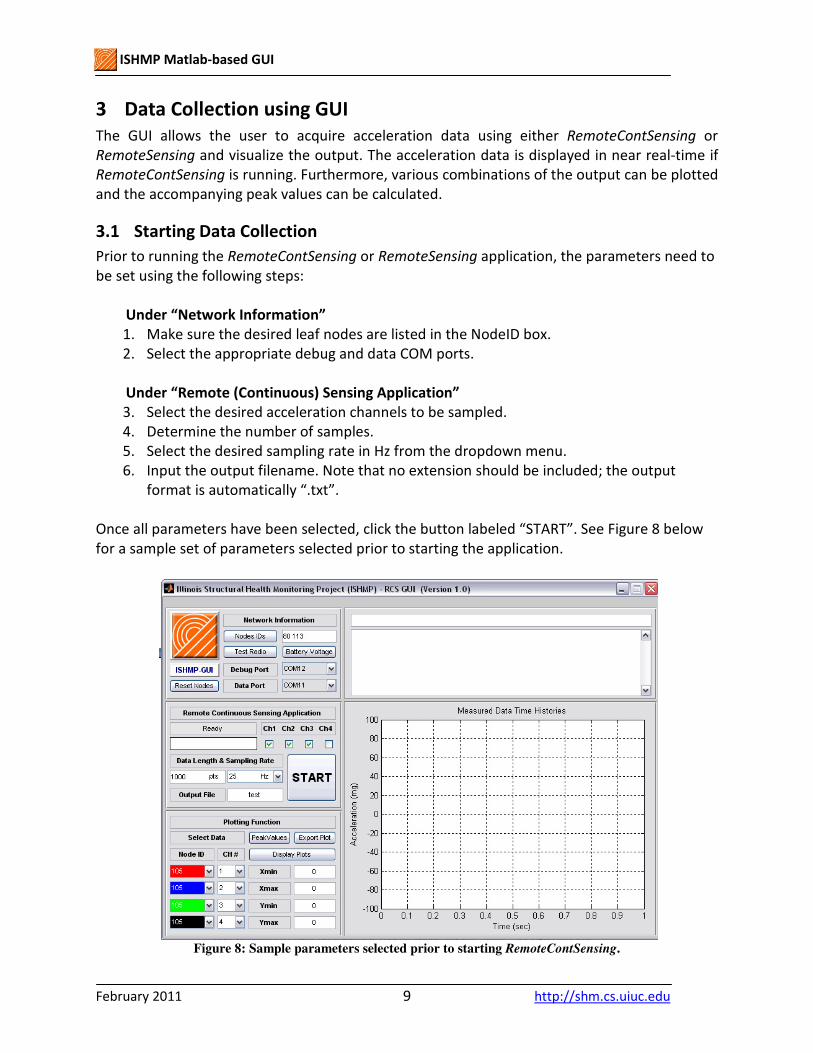
3.1 Starting Data Collection
Prior to running the RemoteContSensing or RemoteSensing application, the parameters need to
be set using the following steps:
Under “Network Information”
1. Make sure the desired leaf nodes are listed in the NodeID box.
2. Select the appropriate debug and data COM ports.
Under “Remote (Continuous) Sensing Application”
3. Select the desired acceleration channels to be sampled.
4. Determine the number of samples.
5. Select the desired sampling rate in Hz from the dropdown menu.
6. Input the output filename. Note that no extension should be included; the output
format is automatically “.txt”.
Once all parameters have been selected, click the button labeled “START”. See Figure 8 below
for a sample set of parameters selected prior to starting the application.
Figure 8: Sample parameters selected prior to starting RemoteContSensing.
ISHMP Matlab-based GUI
February 2011 10 http://shm.cs.uiuc.edu
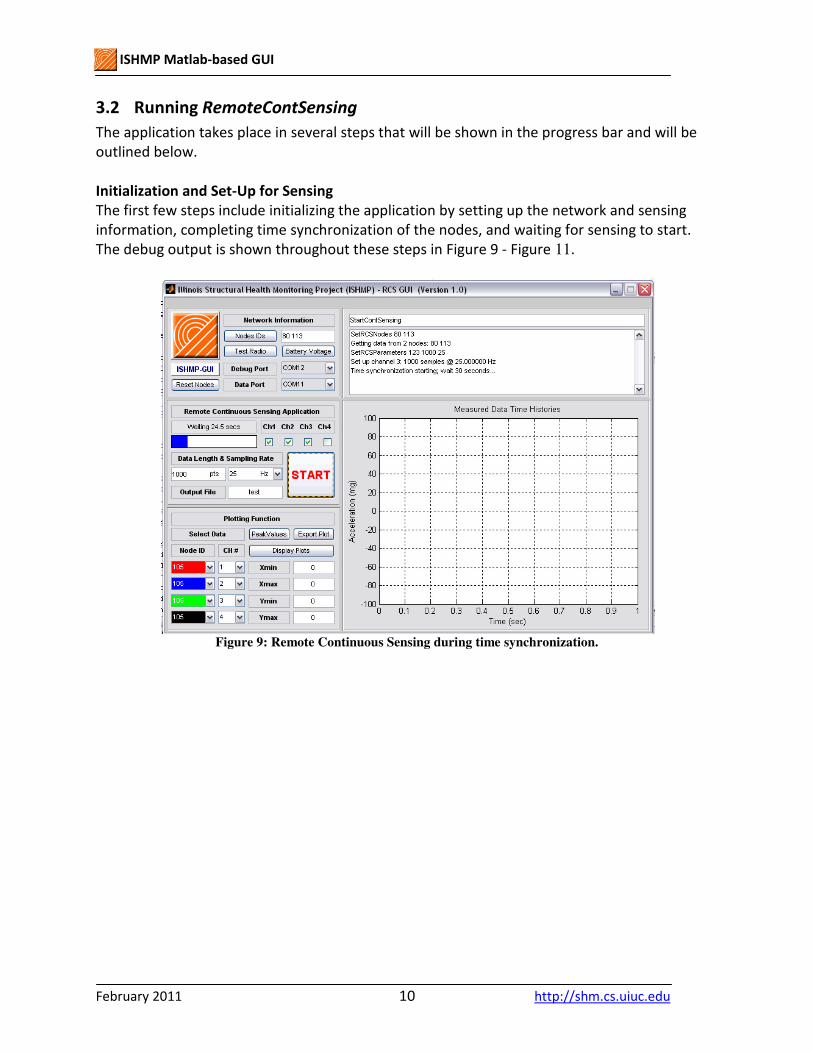
3.2 Running RemoteContSensing
The application takes place in several steps that will be shown in the progress bar and will be
outlined below.
Initialization and Set-Up for Sensing
The first few steps include initializing the application by setting up the network and sensing
information, completing time synchronization of the nodes, and waiting for sensing to start.
The debug output is shown throughout these steps in Figure 9 - Figure 11.
Figure 9: Remote Continuous Sensing during time synchronization.
ISHMP Matlab-based GUI
February 2011 11 http://shm.cs.uiuc.edu
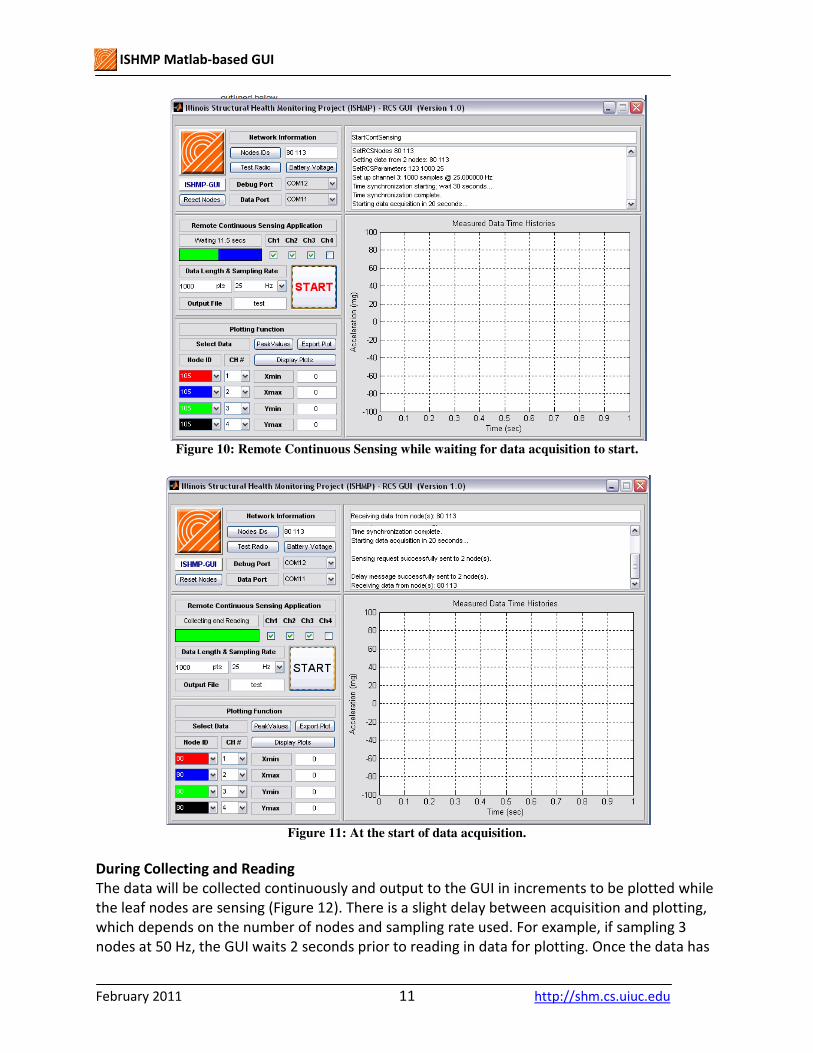
Figure 10: Remote Continuous Sensing while waiting for data acquisition to start.
Figure 11: At the start of data acquisition.
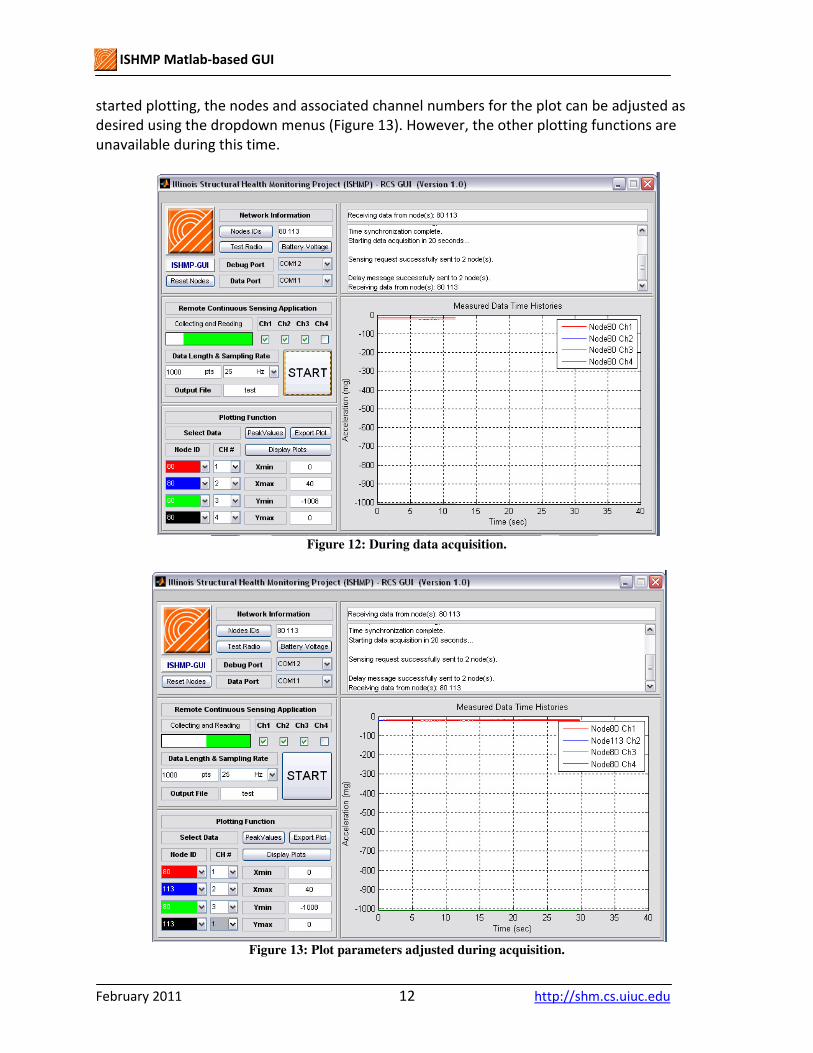
During Collecting and Reading
The data will be collected continuously and output to the GUI in increments to be plotted while
the leaf nodes are sensing (Figure 12). There is a slight delay between acquisition and plotting,
which depends on the number of nodes and sampling rate used. For example, if sampling 3
nodes at 50 Hz, the GUI waits 2 seconds prior to reading in data for plotting. Once the data has
ISHMP Matlab-based GUI
February 2011 12 http://shm.cs.uiuc.edu
started plotting, the nodes and associated channel numbers for the plot can be adjusted as
desired using the dropdown menus (Figure 13). However, the other plotting functions are
unavailable during this time.
Figure 12: During data acquisition.
Figure 13: Plot parameters adjusted during acquisition.
ISHMP Matlab-based GUI
February 2011 13 http://shm.cs.uiuc.edu
End of Collecting and Reading: Data Processing and Output
At the end of “Collecting and Reading”, when all the data has been acquired, the data is
detrended and output to text files for each node in the same directory as the GUI files. The files
are named Node<Node ID>_<output filename>.txt and the format is shown below:
NodeID Time (s) Ch.1 (mg) Ch.2 (mg) Ch.3 (mg) Ch.4 (mg)
----------- ----------- ------------- ------------- ------------- -------------
Within GUI, there are several plotting functions available. These are discussed in more detail in
Section 4.
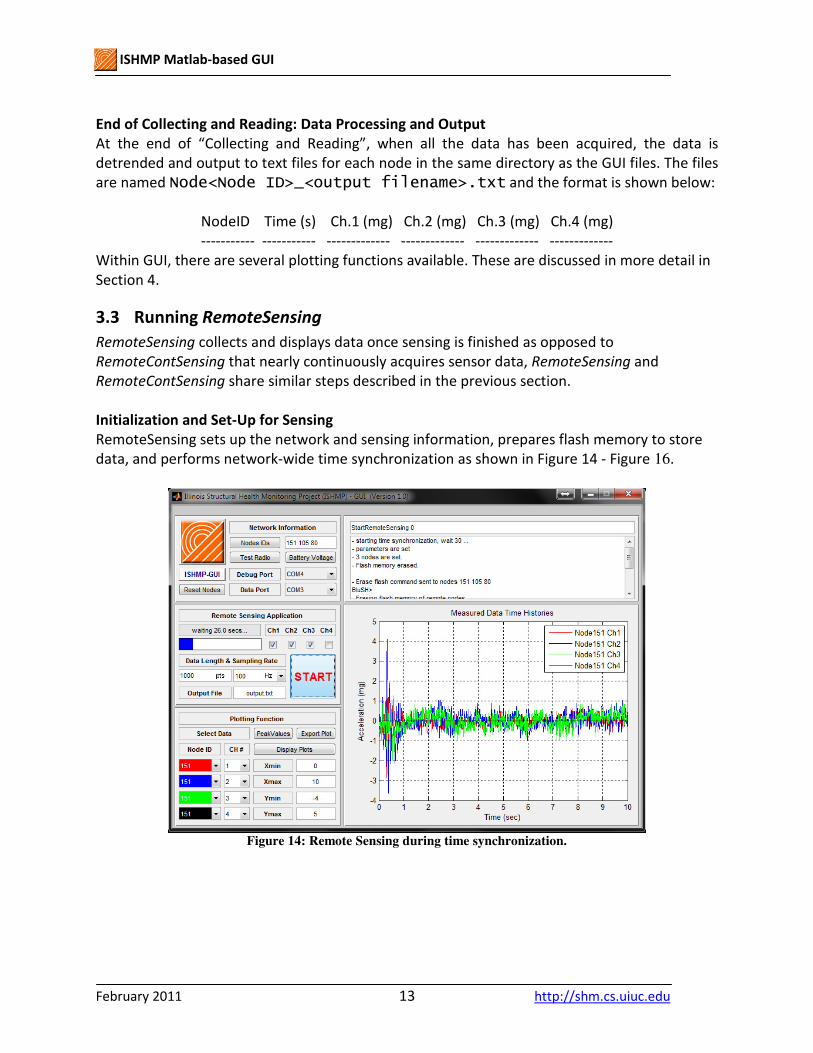
3.3 Running RemoteSensing
RemoteSensing collects and displays data once sensing is finished as opposed to
RemoteContSensing that nearly continuously acquires sensor data, RemoteSensing and
RemoteContSensing share similar steps described in the previous section.
Initialization and Set-Up for Sensing
RemoteSensing sets up the network and sensing information, prepares flash memory to store
data, and performs network-wide time synchronization as shown in Figure 14 - Figure 16.
Figure 14: Remote Sensing during time synchronization.
ISHMP Matlab-based GUI
February 2011 14 http://shm.cs.uiuc.edu
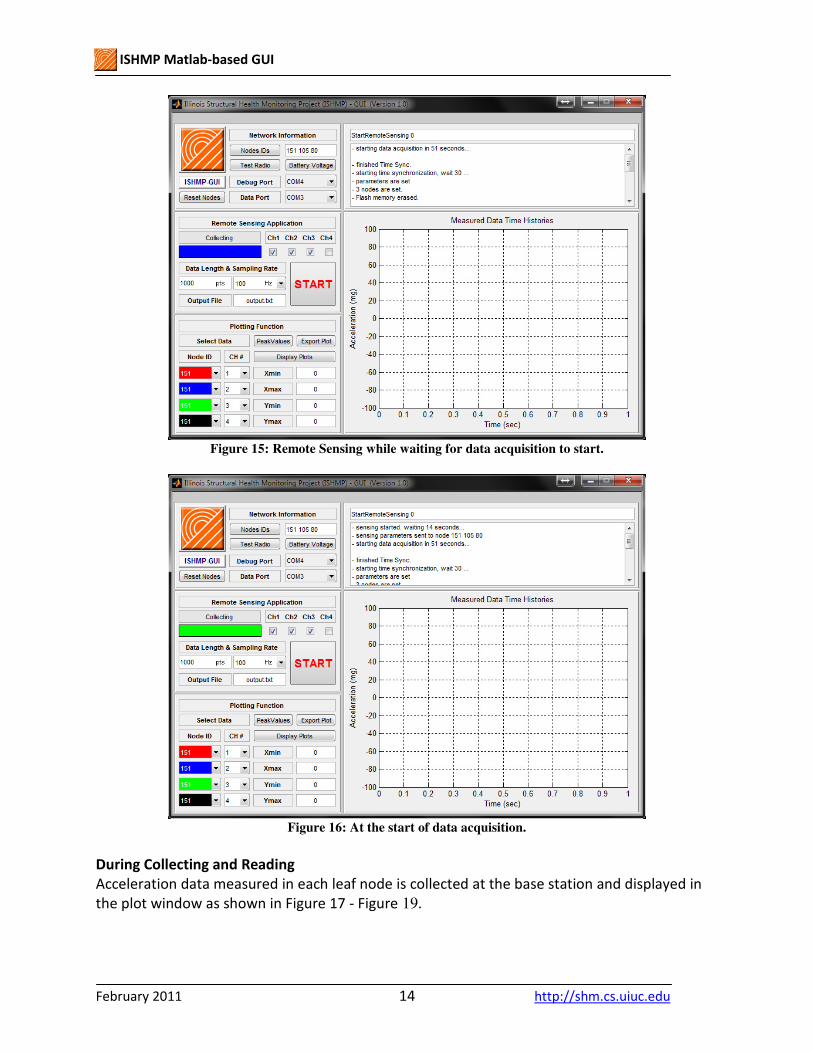
Figure 15: Remote Sensing while waiting for data acquisition to start.
Figure 16: At the start of data acquisition.
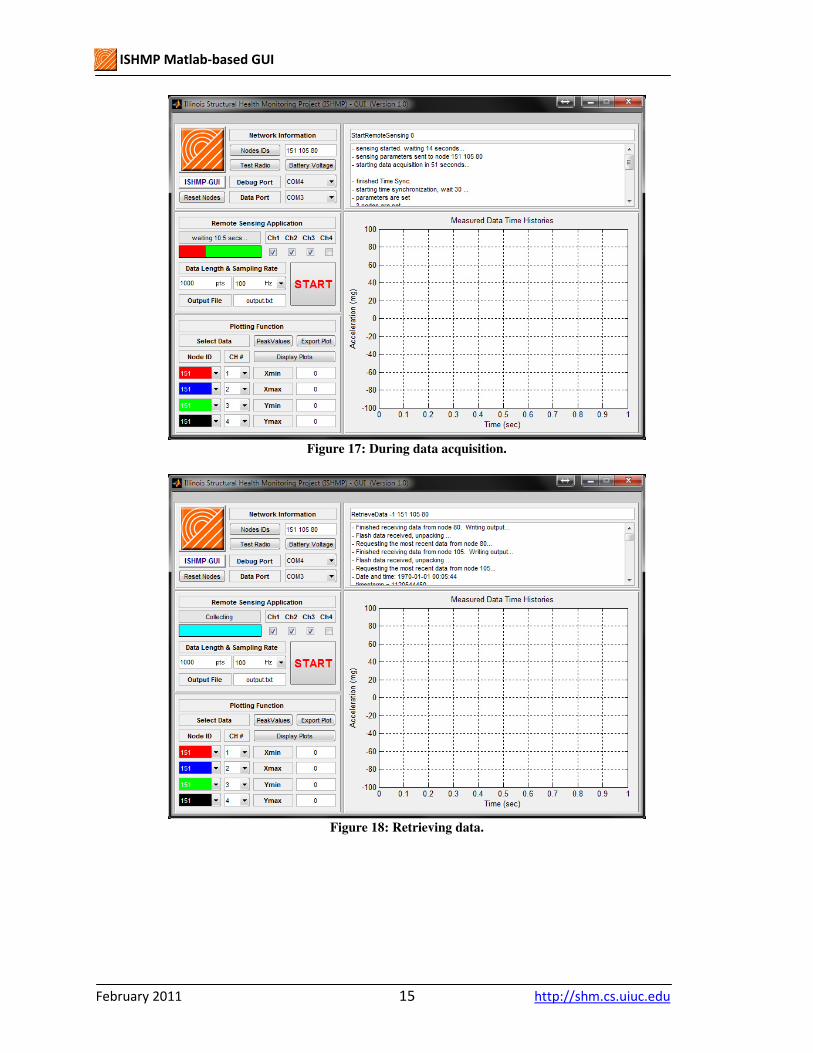
During Collecting and Reading
Acceleration data measured in each leaf node is collected at the base station and displayed in
the plot window as shown in Figure 17 - Figure 19.
ISHMP Matlab-based GUI
February 2011 15 http://shm.cs.uiuc.edu
Figure 17: During data acquisition.
Figure 18: Retrieving data.
ISHMP Matlab-based GUI
February 2011 16 http://shm.cs.uiuc.edu
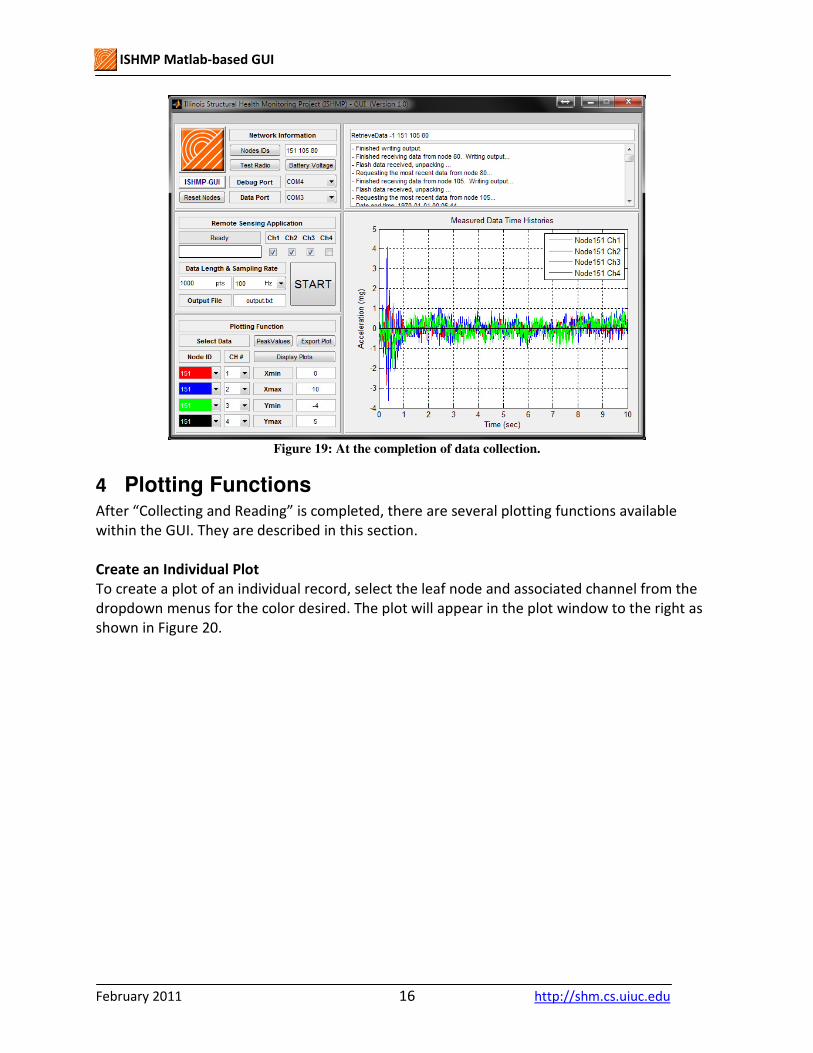
Figure 19: At the completion of data collection.
4 Plotting Functions After “Collecting and Reading” is completed, there are several plotting functions available
within the GUI. They are described in this section.
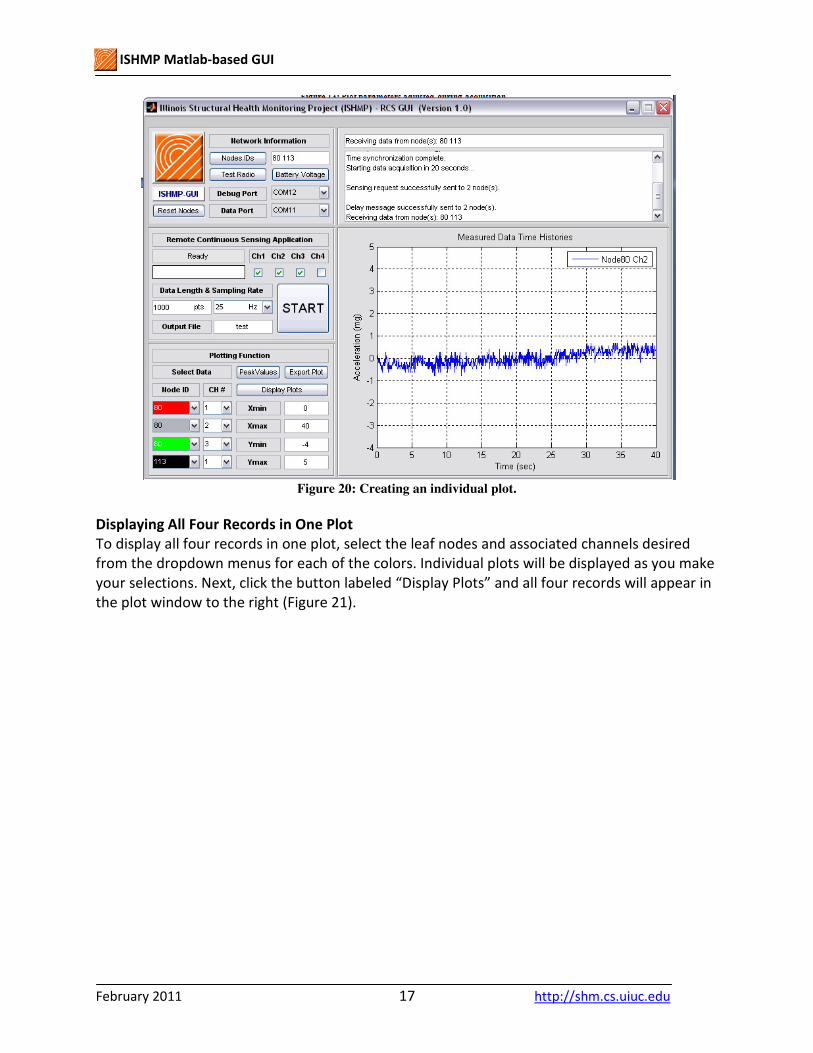
Create an Individual Plot
To create a plot of an individual record, select the leaf node and associated channel from the
dropdown menus for the color desired. The plot will appear in the plot window to the right as
shown in Figure 20.
ISHMP Matlab-based GUI
February 2011 17 http://shm.cs.uiuc.edu
Figure 20: Creating an individual plot.
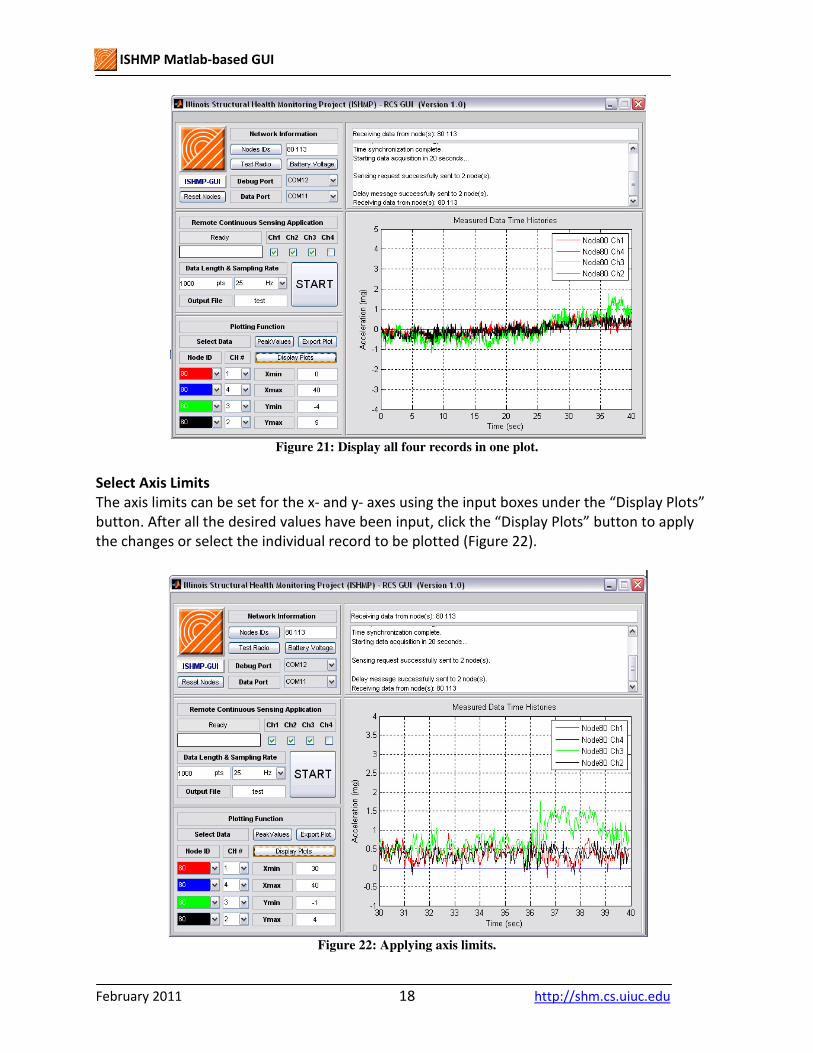
Displaying All Four Records in One Plot
To display all four records in one plot, select the leaf nodes and associated channels desired
from the dropdown menus for each of the colors. Individual plots will be displayed as you make
your selections. Next, click the button labeled “Display Plots” and all four records will appear in
the plot window to the right (Figure 21).
ISHMP Matlab-based GUI
February 2011 18 http://shm.cs.uiuc.edu
Figure 21: Display all four records in one plot.
Select Axis Limits
The axis limits can be set for the x- and y- axes using the input boxes under the “Display Plots”
button. After all the desired values have been input, click the “Display Plots” button to apply
the changes or select the individual record to be plotted (Figure 22).
Figure 22: Applying axis limits.
ISHMP Matlab-based GUI
February 2011 19 http://shm.cs.uiuc.edu
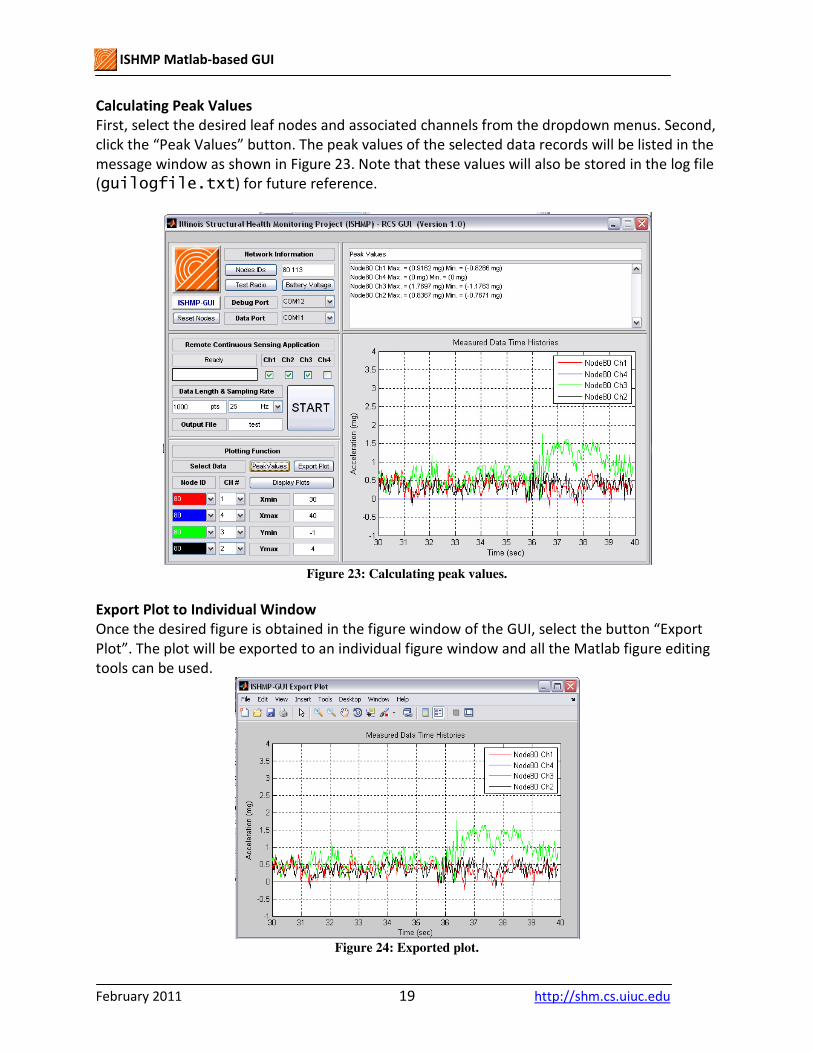
Calculating Peak Values
First, select the desired leaf nodes and associated channels from the dropdown menus. Second,
click the “Peak Values” button. The peak values of the selected data records will be listed in the
message window as shown in Figure 23. Note that these values will also be stored in the log file
(guilogfile.txt) for future reference.
Figure 23: Calculating peak values.
Export Plot to Individual Window
Once the desired figure is obtained in the figure window of the GUI, select the button “Export
Plot”. The plot will be exported to an individual figure window and all the Matlab figure editing
tools can be used.
Figure 24: Exported plot.
ISHMP Matlab-based GUI
February 2011 20 http://shm.cs.uiuc.edu
5 User Functions
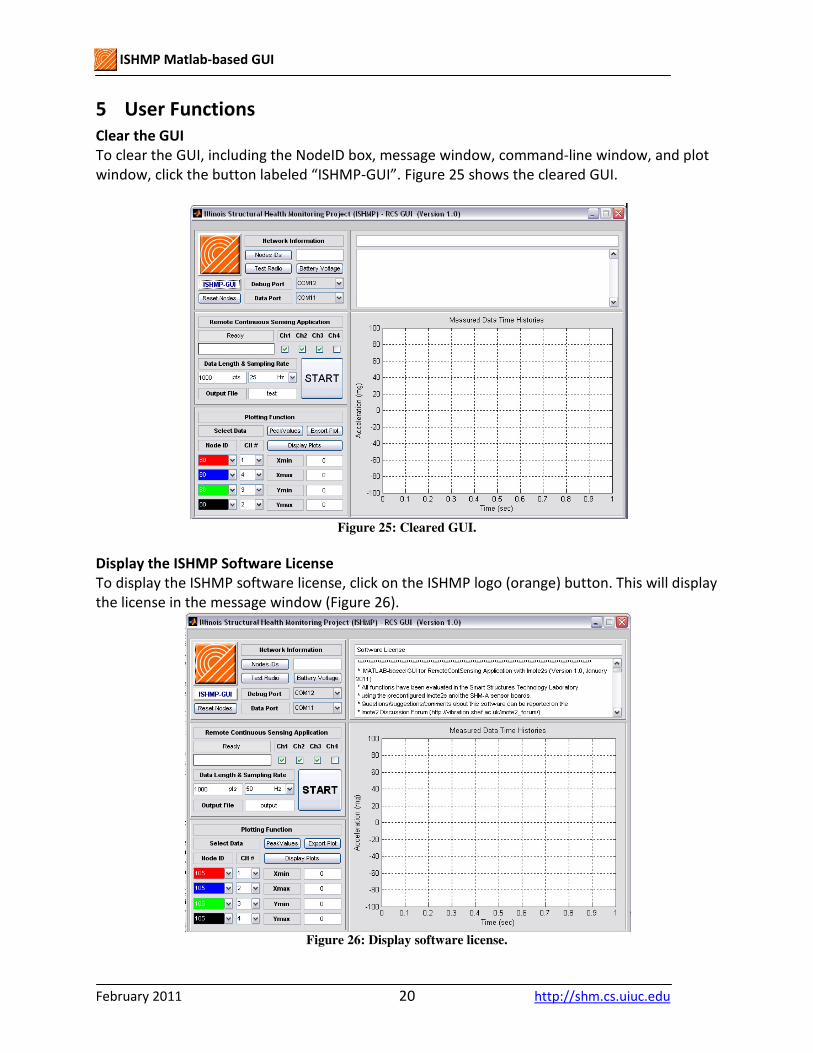
Clear the GUI
To clear the GUI, including the NodeID box, message window, command-line window, and plot
window, click the button labeled “ISHMP-GUI”. Figure 25 shows the cleared GUI.
Figure 25: Cleared GUI.
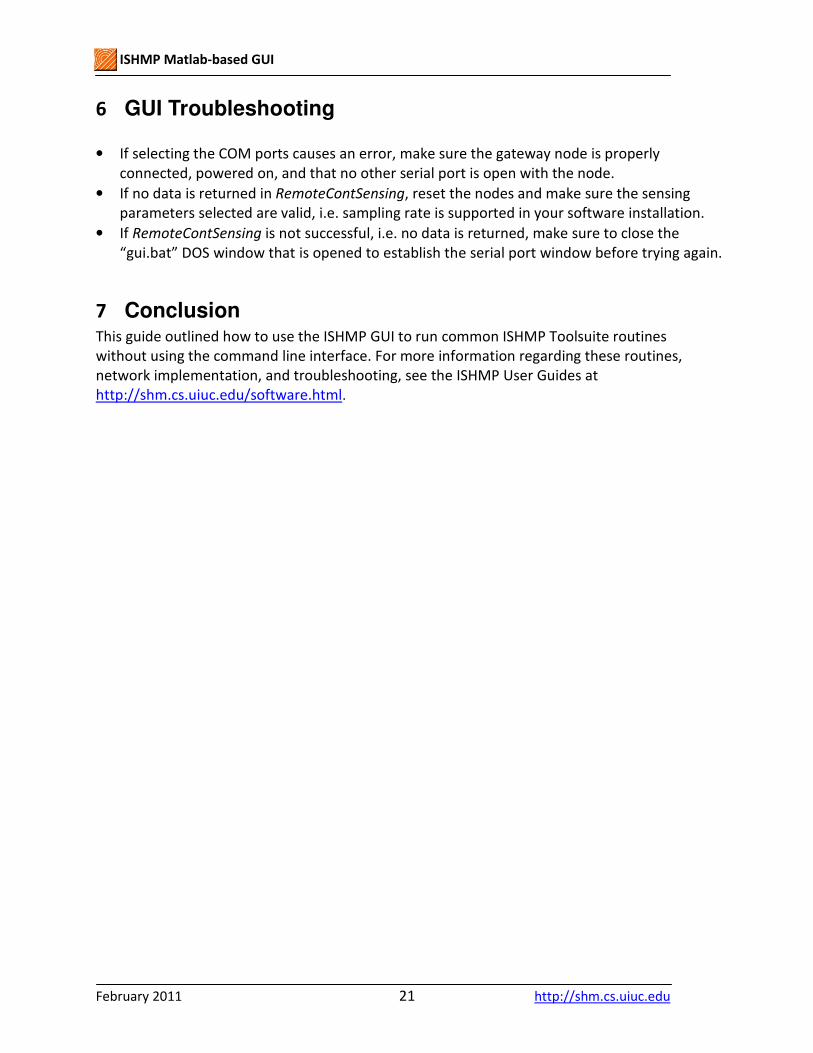
Display the ISHMP Software License
To display the ISHMP software license, click on the ISHMP logo (orange) button. This will display
the license in the message window (Figure 26).
Figure 26: Display software license.
ISHMP Matlab-based GUI
February 2011 21 http://shm.cs.uiuc.edu
6 GUI Troubleshooting
• If selecting the COM ports causes an error, make sure the gateway node is properly
connected, powered on, and that no other serial port is open with the node.
• If no data is returned in RemoteContSensing, reset the nodes and make sure the sensing
parameters selected are valid, i.e. sampling rate is supported in your software installation.
• If RemoteContSensing is not successful, i.e. no data is returned, make sure to close the
“gui.bat” DOS window that is opened to establish the serial port window before trying again.
7 Conclusion This guide outlined how to use the ISHMP GUI to run common ISHMP Toolsuite routines
without using the command line interface. For more information regarding these routines,
network implementation, and troubleshooting, see the ISHMP User Guides at
http://shm.cs.uiuc.edu/software.html.
ISHMP Matlab-based GUI
February 2011 22 http://shm.cs.uiuc.edu
Information provided in this document is connected to the Illinois Structural Health Monitoring Project
(ISHMP) software toolsuite developed at the University of Illinois at Urbana-Champaign. This software is
copyrighted in the name of the Board of Trustees of the University of Illinois.
THE UNIVERSITY OF ILLINOIS MAKES NO REPRESENTATIONS ABOUT THE SUITABILITY OF THE SOFTWARE FOR
ANY PURPOSE. IT IS PROVIDED "AS IS" WITHOUT EXPRESS OR IMPLIED WARRANTY.
For inquiries, please contact:
Professor B.F. Spencer, Jr.
University of Illinois at Urbana-Champaign
Department of Civil and Environmental Engineering
2213 Newmark Civil Engineering Laboratory, MC-250
205 North Mathews Ave
Urbana, IL 61801
USA
Or visit:
http://shm.cs.uiuc.edu