
MathPhysicsFirst2010
5
Mathematics Underlying the Physics First Curriculum: Implications for 8th and 9th Grade Mathematics Try to incorporate examples from the Physics First curriculum into your lessons and/or home- work assignments for 8th and 9th grade mathematics classes. Some examples are singled out below, but ultimately you know best your students so expand this list by collaborating with your colleague(s) teaching Physics First. One important aspect that your students need to understand is that, in a physics course, the quantities measured in an experiment dictate the notation used for the independent and dependent variables. While in their mathematics textbooks x is used for the independent variable (represented on the horizontal axis) and y is used for the dependent variable (represented on the vertical axis), this is not typically the case in the Physics First course. For example, in the study of uniform motion, time is an independent variable, denoted by t and represented on the horizontal axis, while position is a dependent variable, denoted by x and represented on the vertical axis. (I) Literal formulas. Use examples requiring students to substitute values into a given formula. • Evaluate 3ma if m =4 and a =7.5. • If R = ρ L A , evaluate R when ρ = 10 -4 , L = 12, A =9π. • Evaluate v · t + x 0 if v =3 m s , t =3s and x 0 =2.3 m. (II) Literal equations. Use examples requiring students to solve for one variable in terms of the others. • Given that V = IR, V =7 and R =5, solve for I . • d = v · t, solve for v if t =0. • If v f = v i + a · Δt, solve for a knowing that t =0. What is the value of a when v f = 10m/s, v i = 34m/s and Δt =6s? (III) Linear functions. • Emphasize the computation and interpretation of the slope of a line as a rate of change, specifying units whenever possible. • Give a few examples to show that changing the scale on the dependent axis manipulates the graph’s appearance, making the slope of the graph of a linear function appear to be greater or lesser that before the manipulation. As such, if the slopes of the graphs of two linear functions are to be compared only by looking at their graphs, the scales used for the two functions should be the same. • Stress the fact that linear functions are precisely those functions for which the rate of change over any interval is a constant which does not change from one interval to another. Here is why: (this explanation is included for the benefit of the teacher and not necessarily to be done in the classroom) 1 by Dorina Mitrea, Department of Mathematics, University of Missouri, Columbia, MO 65211 [email protected]
-
Upload
meera-chandrasekhar -
Category
Documents
-
view
212 -
download
0
description
http://www.physicsfirstmo.org/files/MathPhysicsFirst2010.pdf
Transcript of MathPhysicsFirst2010

Mathematics Underlying the Physics First Curriculum:Implications for 8th and 9th Grade Mathematics
Try to incorporate examples from the Physics First curriculum into your lessons and/or home-work assignments for 8th and 9th grade mathematics classes. Some examples are singled outbelow, but ultimately you know best your students so expand this list by collaborating with yourcolleague(s) teaching Physics First.
One important aspect that your students need to understand is that, in a physics course, thequantities measured in an experiment dictate the notation used for the independent and dependentvariables. While in their mathematics textbooks x is used for the independent variable (representedon the horizontal axis) and y is used for the dependent variable (represented on the vertical axis),this is not typically the case in the Physics First course. For example, in the study of uniformmotion, time is an independent variable, denoted by t and represented on the horizontal axis, whileposition is a dependent variable, denoted by x and represented on the vertical axis.
(I) Literal formulas. Use examples requiring students to substitute values into a given formula.
• Evaluate 3ma if m = 4 and a = 7.5.
• If R = ρLA
, evaluate R when ρ = 10−4, L = 12, A = 9π.
• Evaluate v · t+ x0 if v = 3 ms
, t = 3s and x0 = 2.3m.
(II) Literal equations. Use examples requiring students to solve for one variable in terms of theothers.
• Given that V = IR, V = 7 and R = 5, solve for I .
• d = v · t, solve for v if t �= 0.
• If vf = vi+a ·Δt, solve for a knowing that t �= 0. What is the value of a when vf = 10m/s,vi = 34m/s and Δt = 6s?
(III) Linear functions.
• Emphasize the computation and interpretation of the slope of a line as a rate of change,specifying units whenever possible.
• Give a few examples to show that changing the scale on the dependent axis manipulates thegraph’s appearance, making the slope of the graph of a linear function appear to be greater or lesserthat before the manipulation. As such, if the slopes of the graphs of two linear functions are to becompared only by looking at their graphs, the scales used for the two functions should be the same.
• Stress the fact that linear functions are precisely those functions for which the rate of changeover any interval is a constant which does not change from one interval to another.
Here is why: (this explanation is included for the benefit of the teacher and not necessarily tobe done in the classroom)
1
by Dorina Mitrea, Department of Mathematics, University of Missouri, Columbia, MO [email protected]
If f is a linear function, then f(x) = mx+ n. The rate of change of f over an interval [a, b] is
f(b)− f(a)
b− a=
mb+ n− (ma + n)
b− a=
mb+ n−ma− n
b− a=
m(b− a)
b− a= m,
so the rate of change of f over any interval is equal to m.Conversely, if you know that a function g has the property that its rate of change over any
interval is constant and equal to a number m, then you can prove that g is a linear function. How?Fix a point a and let x be any number different from a. Then the rate of change of g over the intervalwith endpoints a and x is g(x)−g(a)
x−a= m (recall this is the hypothesis). Multiply by x− a the latter
fraction to obtain g(x)−g(a) = m(x−a), which can be further written as g(x) = mx+g(a)−ma.If you denote g(a)−ma by n, then you obtain g(x) = mx+ n, which is a linear function.
• Help students make the connection between constant ratios and linear relationships.
• Uniform motion problems typically involve something traveling at some fixed and steady(uniform) pace (rate or speed) and the main governing formula is d = st, where d stands fordistance (position), s stands for the (constant or average) speed, and t stands for time. As such,examples in the spirit of the ones in the Uniform Motion unit are well suited when discussing linearfunctions.
(1) Emily and Michell are driving their tractors in opposite directions. Emily is driving at 34miles/hour while Michell is driving at 26 miles/hour. How many hours will it be before theyare 30 miles apart?
(2) A car traveling at 60 miles/hour overtakes a cyclist who, has a speed of 15 miles/hour andhad a 4 hour head start. How far from the starting point does the car overtake the cyclist?
(IV) Piecewise linear functions. Expose students to examples of motion (of a car, of a bicycle,etc.) depicted by piecewise linear graphs (“broken” lines). Use t (time) as the independent variableand x (position) as the dependent variables, each with appropriate units of measure.
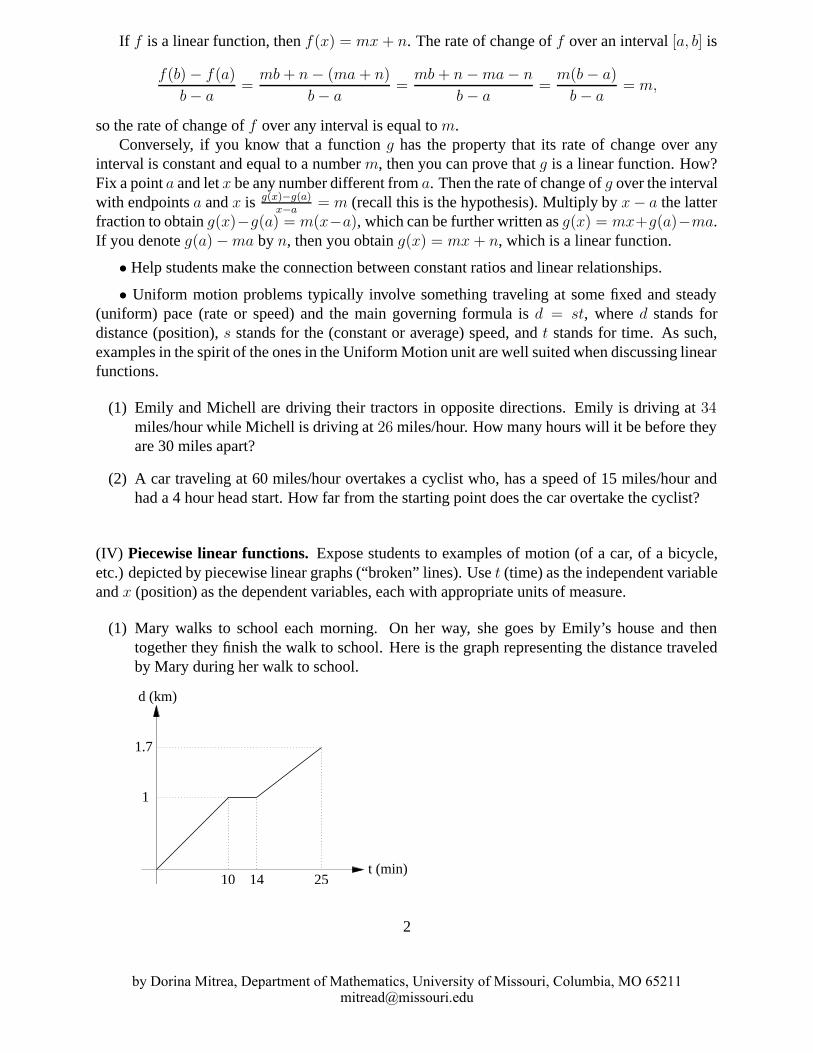
(1) Mary walks to school each morning. On her way, she goes by Emily’s house and thentogether they finish the walk to school. Here is the graph representing the distance traveledby Mary during her walk to school.
d (km)
1
1.7
10 14 25t (min)
2
by Dorina Mitrea, Department of Mathematics, University of Missouri, Columbia, MO [email protected]

(a) How long it takes Mary to get from home to school?
(b) For how long does Mary wait for Emily?
(c) What is the distance that Mary travels from home to school each morning?
(2) The graphs of the distances covered by two cyclists, A and B, in a race is sketched below.
50
12
3
20 40 60t (min)
d (miles)
4.5
Cyclist B
Cyclist A
10 30
(a) Who won the race and in how much time?
(b) There is a very steep hill in this course. How many miles into the race do the riders hitthe hill? How do you know?
(c) Which competitor had the fastest start? How do you know?
(V) Quadratic functions.
• Provide students with an introduction to quadratic functions and their graphs (parabolas)as a first-semester topic in Algebra I without solving quadratic equations based on the quadraticformula or factoring (this is a topic that will likely be covered during the second semester; see theproblems listed below to be used after you discuss solving quadratic equations).
• Include evaluating quadratic expressions (e.g., evaluate y = 5x2 for x = 0, x = 2, x = 3)and graphing parabolas using calculators.
• Use the finite difference method for polynomial functions to contrast between linear functionsand quadratic functions.
(i) For linear functions (uniform motion) the first differences are all equal to a constant. If theposition x is a linear function of time t, x = at + b, then the first differences are equal to a.The table below corresponds to the linear function x = 5t.
t 1 2 3 4 5x 5 10 15 20 25
first differences 5 5 5 5
3
by Dorina Mitrea, Department of Mathematics, University of Missouri, Columbia, MO [email protected]

(ii) For quadratic functions (accelerated motion) the second differences are all equal to a con-stant. If the position x is a quadratic function of time t, x = at2 + bt + c, then the firstdifferences are not equal but the second differences are equal to 2a. The table below corre-sponds to x = 3t2.
t 1 2 3 4 5x 3 12 27 48 75
first differences 9 15 21 27second differences 6 6 6
• After covering the quadratic formula and factoring, you can use problems related to uniformaccelerated motions under gravity (free fall).
(1) An object is launched at 19.6 meters per second (m/s) from a 58.8-meter tall platform. Theequation for the object’s height h at time t seconds after launch is h(t) = 4.9t2+19.6t+58.8,where h is in meters. When does the object strike the ground?
(2) Adrian received a model rocket for his birthday. The launcher is powered by an air pump, andthe height attained by the rocket depends on the number of times he pumps air. Adrian knowsthat 5 pumps will project the rocket upward according to the formula h(t) = −16t2 + 128t,where h(t) is the height of the rocket, measured in feet from the ground, t seconds after takeoff.
(a) Sketch the graph of h(t) for t ≥ 0. Is this the trajectory of the rocket? Explain.
(b) After how many seconds will the rocket start falling? What will be the maximum heightattained by the rocket?
(c) After how many seconds will the rocket hit the ground?
(VI) Solving systems of equations.
• Introduce systems of equations as a first-semester topic. In addition to solving the equation2x− 6 = 4− x using symbol manipulation, consider having students graph the lines y1 = 2x− 6and y2 = 4−x and decide if the two lines intersect. Emphasize the connection between the solutionfor the original equation and the x coordinate of the intersection point of the two lines.
• Explore finding approximate solutions to systems of equations using the trace feature ofgraphing calculator to estimate the point of intersection of two given lines.
• Here are a few examples of word problems related to uniform motion which you can usewhen teaching students analytic methods of solving systems of equations (e.g., by substitution,elimination).
(1) A 300-mile, 3-hour plane trip was flown at two speeds. For the first part of the trip, theaverage speed was 95 miles per hour. Then the tailwind picked up, and the second part ofthe trip was flown at an average speed of 105 miles per hour. For how long did the plane flyat each speed?
4
by Dorina Mitrea, Department of Mathematics, University of Missouri, Columbia, MO [email protected]
(2) A business man had to attend a meeting. He drove from home at an average speed of 45miles per hour to an airport where he boarded a plane. The plane flew him to the meetingplace at an average speed of 85 miles per hour. The entire distance was 260 miles and theentire trip lasted four hours. Find the distance from home to the airport.
(3) A car leaves a buss station 1 hour after a bus left from the same station. The bus is traveling15 miles per hour slower than the car. Find the average speed of the car and that of the bus,if the car overtakes the bus in four hours.
(VII) Area
• When determining the area of geometric figures, include examples of polygonal shapes forwhich the students do not have a direct area formula but which can be partition into familiar shapes(e.g., triangles, rectangles), find the areas of each partition, and sum the areas to get the total area.
• Include a few in-class or homework problems in which students have to compute the area ofthe region under the graph of a piecewise linear function.
(VIII) Measurement• Introduce elements of the metric system early in the school year, especially units of length
(e.g., km, m, cm, mm).
• Provide several examples of unit conversions. Include problems in which the data given isnot all in the same units of measure (e.g., if the speed of a cyclist is 2 meters per second, how longwill it take her to cover 1 kilometer?).
• Require students to include the unit of measure in every step when solving a problem thatinvolves quantities given in units of measure.
(IX) Number and Operation
• Include decimal numbers in examples and problems (e.g., quotient of two decimal numbersin computing the slope of a line, evaluating algebraic expressions for decimal values).
• Encourage proportional reasoning by including appropriate problems as you cover varioustopics.
Amy traveled 9 miles in the first hour. This is 1/8 times more than how long she traveledduring the second hour, and 1/5 times more than she traveled during the third hour. What isthe total distance she covered in these three hours?
5
by Dorina Mitrea, Department of Mathematics, University of Missouri, Columbia, MO [email protected]


