MATHLINKS TEACHER PACKET 11 RATIOS AND UNIT RATES … · Ratios and Unit Rates General Information...
33
MathLinks: Grade 6 (Teacher Packet 11) Table of Contents Teacher Packet Student Packet 11.0 General Information 0 11.1 Ratios Define ratio terminology. Explore equivalent ratios. Represent ratios using symbols, words, tables, and tape diagrams. Solve problems using tables, and tape diagrams. 10 1 11.2 Unit Rates Relate unit rate to ratio. Represent rates using symbols, words, tables, and double number line diagrams. Solve problems using rates, tables and double number line diagrams. 15 9 11.3 Ratio and Unit Rate Problems Solve ratio and unit rate problems using a variety of strategies. 18 17 11.4 Skill Builders, Vocabulary, and Review 25 6-11 TEACHER PACKET MATHLINKS: GRADE 6 TEACHER PACKET 11 RATIOS AND UNIT RATES ANNOTATIONS in this teacher packet provide additional program information for prospective users. Please go to http://mathandteaching.org/register/ and register to view all content components. There are 16 student packets in the Grade 6 Program. This excerpt from the Teacher Guide accompanies Student Packet 11. For easy reference, the color of the cover of student packet will match the teacher packet. ANNOTATED
Transcript of MATHLINKS TEACHER PACKET 11 RATIOS AND UNIT RATES … · Ratios and Unit Rates General Information...

MathLinks: Grade 6 (Teacher Packet 11)
Table of Contents Teacher Packet
Student Packet
11.0 General Information 0
11.1 Ratios Define ratio terminology. Explore equivalent ratios. Represent ratios using symbols, words, tables, and tape
diagrams. Solve problems using tables, and tape diagrams.
10 1
11.2 Unit Rates Relate unit rate to ratio. Represent rates using symbols, words, tables, and double
number line diagrams. Solve problems using rates, tables and double number line
diagrams.
15 9
11.3 Ratio and Unit Rate Problems Solve ratio and unit rate problems using a variety of strategies.
18 17
11.4 Skill Builders, Vocabulary, and Review 25
6-11
TEACHER PACKET
MATHLINKS: GRADE 6 TEACHER PACKET 11
RATIOS AND UNIT RATES
ANNOTATIONS in this teacher packet provide additional program information for prospective users. Please go to http://mathandteaching.org/register/ and register to view all content components.
There are 16 student packets in the Grade 6 Program. This excerpt from the Teacher Guide accompanies Student Packet 11. For easy reference, the color of the cover of student packet will match the teacher packet. ANNOTATED

Ratios and Unit Rates General Information
MathLinks: Grade 6 (Teacher Packet 11)
0
GENERAL INFORMATION
PACING PLAN SUGGESTIONS
TRADITIONAL MATH SCHEDULE
Days-Modified Days-Basic Days-Enriched Lesson Review/Practice
3 4 4 [11.1] Pages 0, 1-8 Pages 25-27
4 5 5 [11.2] Pages 0, 9-16 Pages 28-30
3 4 4 [11.3] Pages 0, 17-24 Pages 31-36
3 4 4 Catch up, Tasks, Assessment
BLOCK SCHEDULE
Days-Modified Days-Basic Days-Enriched Lesson Review/Practice
2 3 3 [11.1] Pages 0, 1-8 Pages 25-27
3 3 3 [11.2] Pages 0, 9-16 Pages 28-30
2 2 2 [11.3] Pages 0, 17-24 Pages 31-36
2 2 3 Catch up, Tasks, Assessment
Lesson pages are not intended to be used only as class work, and review/practice pages are not intended to
be used only as homework. How they are used is up to the teacher.
The number of days estimated for each lesson will vary depending on school schedules, instruction styles, and student proficiency.
Although they are listed at the end of the tables, use catch up days when needed.
Tasks may be assigned at any time after students have completed the prerequisite content work. Multiple assessment measures are encouraged, including (but not limited to) quizzes, tasks, proficiency
challenges, strategically selected student pages, skill builders, selected response page, knowledge check, etc.
Consider requiring a math journal, to be collected and checked periodically, or collecting an “exit slip” at the end of selected class periods. Journals and exits slips may include short skills review, explanations of concepts, or anything else the instructor may want to assess.
As part of a modified program, consider omitting the following, depending upon time constraints: Student Packet 11: Pages 18-32 (select problems)
Every student packet includes three concept lessons and a review section. Packets generally take 1-3 weeks. Because of the importance of the content and nature of activities in this packet, it may take a little longer.

Ratios and Unit Rates General Information
MathLinks: Grade 6 (Teacher Packet 11)
1
COMMON CORE STATE STANDARDS – MATHEMATICS
STANDARDS FOR MATHEMATICAL CONTENT
6.RP.A Understand ratio concepts and use ratio reasoning to solve problems.1
6.RP.1 Understand the concept of a ratio and use ratio language to describe a ratio relationship between two quantities. For example, “The ratio of wings to beaks in the bird house at the zoo was 2:1, because for every 2 wings there was 1 beak.” “For every vote candidate A received, candidate C received nearly three votes.”
6.RP.2 Understand the concept of a unit rate a/b associated with a ratio a:b with b ≠0, and use rate language in the context of a ratio relationship. For example, “This recipe has a ratio of 3 cups of flour to 4 cups of sugar, so there is 3/4 cup of flour for each cup of sugar.” “We paid $75 for 15 hamburgers, which is a rate of $5 per hamburger.”
6.RP.3a Use ratio and rate reasoning to solve real-world and mathematical problems, e.g., by reasoning about tables of equivalent ratios, tape diagrams, double number line diagrams, or equations: Make tables of equivalent ratios relating quantities with whole number measurements, find missing values in the tables, and plot the pairs of values on the coordinate plane. Use tables to compare ratios.
6.RP.3b Use ratio and rate reasoning to solve real-world and mathematical problems, e.g., by reasoning about tables of equivalent ratios, tape diagrams, double number line diagrams, or equations: Solve unit rate problems including those involving unit pricing and constant speed. For example, if it took 7 hours to mow 4 lawns, then at that rate, how many lawns could be mowed in 35 hours? At what rate were lawns being mowed?
1 A major cluster for the grade level.
STANDARDS FOR MATHEMATICAL PRACTICE
MP1 Make sense of problems and persevere in solving them.
MP3 Construct viable arguments and critique the reasoning of others.
MP4 Model with mathematics.
MP7 Look for and make use of structure.

Ratios and Unit Rates General Information
MathLinks: Grade 6 (Teacher Packet 11)
2
PACKET PLANNING INFORMATION
Assessments*, Reproducibles**, and Tasks** Quiz 11A, 11B Proficiency Challenge 11 Test Part 11 (See Assessment Tab, page iv) Reproducible 26: Grape Juice Mixture Cards (1/pair or group) [11.1] Reproducible 27: Blank Cards (1/group) [11.1] Reproducible 28: Poster Problems 3 (1/group) [11.2] Task, Page 14: Grapey Mixtures [11.1] *Located in the assessment envelope and on the secure website **Located in the back of the Teacher Guide
Materials Scissors (1/student or pair) [11.1] 11 X 17 (or larger) poster-size paper (1/student or
pair) [11.1] Markers (1/pair or group )[11.1,11.2] Tape or glue (1/pair or group) [11.1] Strips of paper (1/partner) [11.1] Chart paper (1 per group) [11.2]
MathLinks: Grade 6 Resource Guide (Part 2) Key vocabulary in the Word Bank: double number line
diagram unit price
equivalent ratios unit rate
ratio value of a ratio
tape diagram Explanations and examples: Ratios and Proportional Relationships
Prepare Ahead
Go to www.mathandteaching.org for additional resources. Lessons 11.1, 11.2, 11.3: The approach to ratios and rates taken follows
recommendations made in the “Progressions” documents that accompany CCSS-M. Read the math notes, teacher notes, and complete the lessons ahead of time to become familiar with a new approach to this topic.
Technology Resources
Have students play “Ratio Rumble” at www.MathSnacks.org. This engaging game requires students to identify equivalent fractions. Show the video “Math Snacks: Bad Date,” which was created by the MathSnacks team and is available on their website and on YouTube at https://www.youtube.com/watch?v=BZ1M01YBKhk This applet allows you to vary the gear ratio of a bike http://illuminations.nctm.org/Activity.aspx?id=3549 A good source for simple games students can play for free can be found at the link below. The ratio games are near the bottom of the web page. http://www.sheppardsoftware.com/math.htm
Options for a Substitute Any time: Pages 25-27 After 11.1: Pages 5, 8, 28-29 After 11.2: Pages 15-16, 30 After 11.3: Pages 31-36
This page summarizes planning information to get you started.

Ratios and Unit Rates General Information
MathLinks: Grade 6 (Teacher Packet 11)
3
TEACHER CONTENT INFORMATION
MATH NOTES
MN1: Ratios Are Everywhere [11.1, 11.2, 11.3]
Under every rug there is a ratio. In mathematics:
the ratio of the circumference of a circle to its diameter ( ) the ratio of lengths of corresponding sides of similar triangles the ratios of side lengths of right triangles (trigonometric ratios) the ratio of the “increase in the y-variable” to the “increase in the x-variable” (slope of a line)
In science:
laws of physics, such as the ratio of momentum to velocity of falling objects conversion rates, such as feet to meters or minutes to hours comparisons, such as nineteen out of twenty glaciers are receding
In daily activities:
two cups water for every cup oatmeal (recipe) a dozen almonds per serving thirty miles per hour (a speed limit) twenty-seven miles per gallon (fuel consumption)
In pricing:
cheese at $5 per pound farmland at $8000 per acre
In sports and exercise:
odds of Boston winning the World Series calories burned in fifteen minutes jogging
Whenever we refer to percentages, we are using ratios. The battery life of our electronic device, the sales tax on our pizza, and the discount on sale items are given as a percentage.
Most Math Notes were written by our mathematicians. They provide additional content information for teachers, often beyond what students will learn.

Ratios and Unit Rates General Information
MathLinks: Grade 6 (Teacher Packet 11)
4
MATH NOTES (Continued)
MN2: Ratio, Rate, Unit Rate, and Value [11.1, 11.2, 11.3]
The words “ratio” and “rate” have various shades of meaning in common language. The definitions in school mathematics textbooks vary. The Common Core State Standards for Mathematics (CCSS-M) and Progressions prescribe a formal definition of “ratio,” and at least implicitly a definition of “unit rate.” On the other hand, “rate” is treated as a term in common language. No formal definition of “rate” appears in the documents.
A ratio is an ordered pair of nonnegative numbers, not both zero. The ratio of a to b is denoted by a
: b (read “a to b,” or “a for every b”).
Examples of ratios: 3 : 2, 3
2 : 2, 3.14 : 10, 8 : 0, 0 : 8.
These are NOT ratios: 0 : 0, 2 : -3.
Unit rate associated with a ratio: Suppose a : b is a ratio, and b ≠ 0. The unit rate associated to a : b is the number a ÷ b. which may have units attached to it. If a and b have units attached to them, say “a-units” and “b-units,” the appropriate unit of measure for the unit rate is “a-units per b-unit.”
Example: The ratio “400 miles every 8 hours” has unit rate “50 miles per hour.” There is a convenient calculation device that leads to the unit for the unit rate:
400 miles 400 miles miles = = 50 = 50 miles per hour.
8 hours 8 hours hours
Value of a ratio: The value of a ratio a : b , b ≠ 0, is the quotient number a ÷ b.
Example: The value of the ratio 6 : 3 is 6 ÷ 3 = 2. The value of the ratio 5 : 2 is 2.5.
The value of the ratio “400 miles every 8 hours” is 4008
= 50.
Both terms “value” and “unit rate” are based on the same numerical value, the quotient number a ÷ b. The difference between the terms is that all ratios a : b with b ≠ 0 have a value, whereas we generally talk about unit rates only for ratios that have units attached to them. In the latter case, the unit rate is equal to the value of the ratio with “something per something” attached.
MN3: Dual Definitions and Common Language [11.1, 11.2, 11.3]
It is common in mathematics to use the same term to refer to two concepts that are closely related though technically different. Examples include “fraction” and “ratio.” When this occurs, it is generally easy to determine the appropriate interpretation from context.
There are two interpretations of “fraction.” We can view a fraction as a division problem, or we can view a
fraction as the number that is the result of the division. The fractions 32
and are different when they are
viewed as division problems. Dividing 3 cookies among 2 children has a different meaning than dividing 6 cookies among 4 children. However, both situations result in the same number of 1.5 cookies per child. It is easy to determine which interpretation is appropriate from context. Similarly, there are two interpretations of “ratio.” We can interpret a ratio as a number pair, such as 3 : 2. However, in common language the word “ratio” is often used to refer to the value of the ratio. We may say for instance that “the ratio of 3 to 2 is 1.5.” When we refer to as being the ratio of circumference to diameter, we have in mind the numerical value of the ratio. When we refer to the slope of a line as the ratio of “rise” to “run,” we have in mind the numerical value of the ratio. It is easy to determine from context the specific interpretation of “ratio.”
64

Ratios and Unit Rates General Information
MathLinks: Grade 6 (Teacher Packet 11)
5
x
y
(a, b)
(ca,cb)
MATH NOTES (Continued)
MN4: Attaching Units of Measure to Quantities [11.1, 11.2, 11.3]
Ratios usually arise from concrete situations in which the numbers are measures of things. When we say that the ratio of girls to boys in the class is 6 : 5, it is usually clear from context what we are measuring, and we focus on the pure numbers. In many applications, it is important to keep track of exactly what we are measuring, and in particular what units we are using for measurement. In this case we attach units to the numbers to make precise what the numbers mean. This attachment of units is not part of the formal math structure – it is done unofficially to clarify the meaning of the numbers in our minds. It can be a wonderfully useful and effective device for making sense of the mathematics. The ratio for converting centimeters to inches is “2.54 centimeters per inch.” Stripped of units, this ratio becomes simply 2.54 : 1, which by itself lacks meaning. We attach the units of measurement “cm,” “in,” and “cm per in” to remind ourselves what we are measuring and to clarify its meaning in context. The corresponding unit rate (conversion rate) is expressed with units attached as
2.54 cm 2.54 cm cm = = 2.54 = 2.54 cm per in.
1 in 1 in in
Theoretically, it is possible to attach units to any ratio, even ratios of pure numbers. In the ratio 12 : 6 of pure numbers, we may think of the number “one” as being the unit, and the ratio becomes “12 ones to 6 ones.”
MN5: Geometric Interpretation of Equivalent Ratios [11.1]
Two ratios are equivalent if each number in one ratio is a multiple of the corresponding number in the other ratio by the same positive number. Thus the ratio a : b is equivalent to the ratio ca : cb for all numbers c > 0. When b ≠ 0, the value of a ratio a : b is the quotient number a ÷ b. We extend the definition of value to ratios a : b with b = 0 by declaring that the value of the ratio a : 0 is + . This is analogous to thinking of a vertical line in the plane as having slope + . Though + this is not a number, it is a perfectly legitimate value for a function. Now that we have extended the definition of value of a ratio to cover the case when b = 0, we can give a simple geometrical characterization of equivalent ratios in terms of rays in the plane. Each ratio a : b determines a point (a, b) in the first quadrant of the coordinate plane. This correspondence a : b → (a, b) maps ratios to the first quadrant, including the positive x-axis and y-axis but omitting the origin. Ratios 0 : b with value 0 are mapped to points (0, b) on the positive x-axis, and ratios a : 0 with value + are mapped to points (a, 0) on the positive y-axis. Under this correspondence, the ratios ca : cb equivalent to a : b correspond to the points (ca, cb) on the ray through (a, b) emanating from the origin. In fact, if we assign a slope of + to a vertical line, then the following statements are valid for all ratios:
The ratios equivalent to a : b correspond to the ray (half-line) issuing from the origin through (a, b).
The slope of the ray through (a, b) is the value of the ratio a : b. Two ratios are equivalent if, and only if, they have the same value.

Ratios and Unit Rates General Information
MathLinks: Grade 6 (Teacher Packet 11)
6
MATH NOTES (Continued)
MN6: Ratios and Rates – Then and Now [11.1, 11.2, 11.3]
Many definitions in mathematics have metamorphosed over time. Originally, the definition of “rectangles” did not include “squares,” but it has become standard to include squares as a subset of the rectangle family because it makes many properties easier to explain. To complicate the picture even more, some mathematical terms are defined differently in different textbooks and in different parts of the world. For example, some books define a trapezoid as a quadrilateral with exactly one pair of parallel sides, while others define it as a quadrilateral with at least one pair of parallel sides. Here we observe changes in the definitions of ratio and rate, as a result of the Common Core State Standards in Mathematics (CCSS-M). In the first column are samples of definitions that have been used in the past.
Before CCSS-M (Some Examples) Definitions Based on CCSS-M
A ratio is a comparison of two numbers by division. The ratio of a to b is denoted by a : b
(read “a to b”), or by ab
, where b ≠ 0.
Example: The ratio of 3 to 2 may be denoted by
3 : 2 or by = 1.5.
A ratio is a pair of nonnegative numbers, not both zero, in a specific order. The ratio of a to b is denoted by a : b (read “a to b,” or “a for every b”). Example: If there are 3 coins and 2 paperclips in
your pocket, then the ratio of coins to paperclips may be denoted 3 to 2 or 3 : 2.
The value of a ratio a : b is the number , b ≠ 0.
Example: The value of the ratio of 3 : 2 is = 1.5.
Two ratios are equivalent if they have the same value. Example: The ratios 3 : 2 and 9 : 6 are equivalent
because = .
Two ratios are equivalent if each number in one ratio is a multiple of the corresponding number in the other ratio by the same positive number. Example: This arrow diagram
shows that the ratios 3 : 2 and 9 : 6 are
equivalent.
A rate is a ratio in which the numbers have units attached to them.
Example: is a rate.
There is no formal definition of “rate.” It is treated as a word in common language. Such phrases as “at that rate” or “at the same rate” are used. Example: Sally runs 10 miles in 50 minutes. If she
runs the entire marathon at that rate, what will be her marathon time?
A unit rate is a rate for one unit of measure. Example: 80 miles per hour may be written
or 80 .
The unit rate associated to a ratio a : b, where a and
b have units attached, is the number , with the
units “a-units per b-unit” attached. Example: The ratio of 400 miles for every 8 hours
corresponds to the unit rate 50 miles per hour.
32
ab
32
32
9
6
20 miles
10 minutes
80 miles
1 hour
miles
hour
ab
3 : 2
9 : 6
3 3
This is one of our favorite math notes because it shows changes in definitions based on the Common Core documents. This Math Note had direct implications for how we developed concepts in the lessons.
Ratios and Unit Rates General Information
MathLinks: Grade 6 (Teacher Packet 11)
7
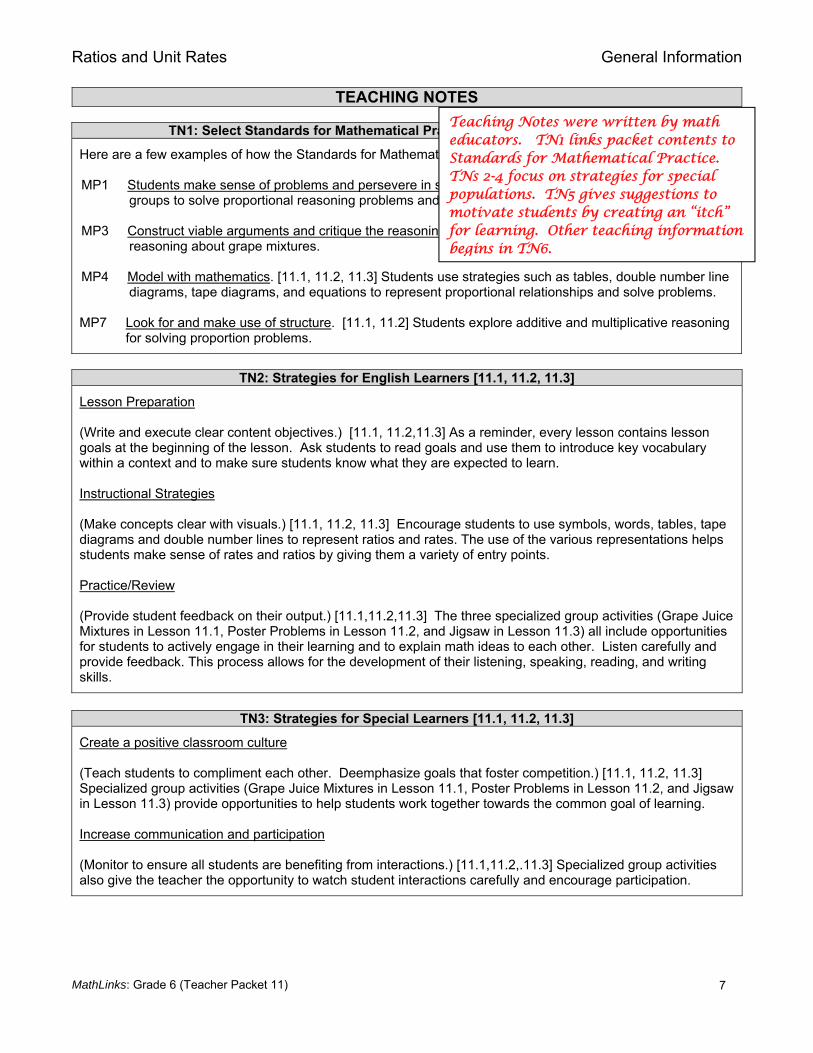
TEACHING NOTES
TN1: Select Standards for Mathematical Practice Examples [11.1, 11.2, 11.3]
Here are a few examples of how the Standards for Mathematical Practice are applied in these lessons. MP1 Students make sense of problems and persevere in solving them. [11.3] Students work in expert
groups to solve proportional reasoning problems and then return to home groups to help solve them. MP3 Construct viable arguments and critique the reasoning of others. [11.2] Students analyze student
reasoning about grape mixtures. MP4 Model with mathematics. [11.1, 11.2, 11.3] Students use strategies such as tables, double number line
diagrams, tape diagrams, and equations to represent proportional relationships and solve problems. MP7 Look for and make use of structure. [11.1, 11.2] Students explore additive and multiplicative reasoning
for solving proportion problems.
TN2: Strategies for English Learners [11.1, 11.2, 11.3]
Lesson Preparation (Write and execute clear content objectives.) [11.1, 11.2,11.3] As a reminder, every lesson contains lesson goals at the beginning of the lesson. Ask students to read goals and use them to introduce key vocabulary within a context and to make sure students know what they are expected to learn. Instructional Strategies (Make concepts clear with visuals.) [11.1, 11.2, 11.3] Encourage students to use symbols, words, tables, tape diagrams and double number lines to represent ratios and rates. The use of the various representations helps students make sense of rates and ratios by giving them a variety of entry points. Practice/Review (Provide student feedback on their output.) [11.1,11.2,11.3] The three specialized group activities (Grape Juice Mixtures in Lesson 11.1, Poster Problems in Lesson 11.2, and Jigsaw in Lesson 11.3) all include opportunities for students to actively engage in their learning and to explain math ideas to each other. Listen carefully and provide feedback. This process allows for the development of their listening, speaking, reading, and writing skills.
TN3: Strategies for Special Learners [11.1, 11.2, 11.3]
Create a positive classroom culture (Teach students to compliment each other. Deemphasize goals that foster competition.) [11.1, 11.2, 11.3] Specialized group activities (Grape Juice Mixtures in Lesson 11.1, Poster Problems in Lesson 11.2, and Jigsaw in Lesson 11.3) provide opportunities to help students work together towards the common goal of learning. Increase communication and participation (Monitor to ensure all students are benefiting from interactions.) [11.1,11.2,.11.3] Specialized group activities also give the teacher the opportunity to watch student interactions carefully and encourage participation.
Teaching Notes were written by math educators. TN1 links packet contents to Standards for Mathematical Practice. TNs 2-4 focus on strategies for special populations. TN5 gives suggestions to motivate students by creating an “itch” for learning. Other teaching information begins in TN6.

Ratios and Unit Rates General Information
MathLinks: Grade 6 (Teacher Packet 11)
8
TEACHING NOTES (Continued)
TN4: Strategies for Enrichment [ 11.1, 11.2, 11.3 ]
[11.1, 11.2, 11.3] Challenge students to solve proportional reasoning problems using multiple representations, including tables, diagrams, and equations.
TN5: Creating an Itch [11.1 ]
[11.1] Where do we use ratios in everyday life? See Math Note 1 for some ideas. [11.2] Ask students how far they think it is to a local theme park, and how long it takes to get there. After agreeing on a typical time and distance, use this information as the example for the introduction of rates. [11.3] This lesson contains seven different contexts for using ratios and rates. Hopefully, students will see the utility of learning this mathematics from these examples.
TN6: Equivalent Ratios and Tables [11.1]
The Common Core State Standards in Mathematics refer to “tables of equivalent ratios.” The “progressions” document on the 6th and 7th grade Ratios and Proportional Relationships domain (written by authors of CCSS-M) refer to “ratio tables”; however, these tables do not have ratios as entries. Rather, they are tables of numbers that are pedagogical recording devices used for teaching about ratios. The table to the right has two variables in rows, and the columns have entries that indicate equivalent ratios. For example, 2 stars : 3 circles is equivalent to 4 stars : 6 circles and 6 stars : 9 circles. These tables may also have variables as column heads. In this case, the rows would have entries that indicate equivalent ratios. Tables may have more than two rows or columns, corresponding to more than two variables. In this case, any two columns or rows determine number pairs that form equivalent ratios.
TN7: Tape Diagrams [11.1, 11.2, 11.3]
A tape diagram is a visual model consisting of strips divided into rectangular segments whose areas represent relative sizes of quantities. Tape diagrams are typically used when quantities have the same units.
Example: Here are two tape diagrams that show the ratio of grape concentrate to water is 2:4.
W W W WG G
grape
water
# of Stars 2 4 6# of Circles 3 6 9

Ratios and Unit Rates General Information
MathLinks: Grade 6 (Teacher Packet 11)
9
TEACHING NOTES (Continued)
TN8: Double Number Line Diagrams [11.1, 11.2]
A double number line diagram is a graphical representation of two variables, in which the corresponding values are placed on two parallel number lines for easy comparison. Double number lines are often used to compare two quantities that have different units. Example: This double number line shows corresponding ratios if a car goes 70 miles for every 2 hours. According to the Progressions for the Common Core State Standards in Mathematics document for proportional reasoning, a ratio is a pair of non-negative numbers A : B, which are not both zero. Thus we do not show negative numbers on our number lines that correspond to ratios.
While Math Notes and Teaching Notes were written to support instruction, we strongly recommend professional development to help teachers learn content and strategies for effective implementation of a Common Core program using MathLinks resources.
0 35 70 105 140 175
Distance (miles)
Time (hours) 0 1 2 3 4 5

Ratios and Unit Rates 11.1 Ratios
MathLinks: Grade 6 (Teacher Packet 11)
10
Every lesson begins with a black bar title, and summary and goals, which are also listed in the student packet.
RATIOS
Summary Students define ratio and explore when ratios are equivalent. Students represent ratios using tables and diagrams, and solve problems involving ratios. 6.RP.A
Goals
Define ratio terminology. Explore equivalent ratios. Represent ratios using symbols, words, tables,
and tape diagrams. Solve problems using tables and tape
diagrams.
PREVIEW / WARMUP
Whole Class / Partners Page 0 Word Bank Page 1 Ratios
Introduce the goals and standards of the lesson. Discuss important vocabulary as relevant.
Students analyze Gretchen’s work and identify her error.
What is Gretchen’s error? Gretchen “added across.” When adding fractions, we must use a common denominator to add equal size parts. Looking closely at the addends and sums also shows that the results make
no sense. For example, 3 2 3 3
7 2 7 7+ = + 1 = 1 .
If students struggle with an explanation for the error, write 3 2 6
7 2 14 = on the
board. How is this equation different than Gretchen’s? This is a multiplication
sentence. Multiplying by 22
(this “big one”) does not change the value of the
fraction. If we multiply across, the result is 614
.
Why is this a correct procedure? With an area model, we double the number of shaded parts and the number of parts in the whole, so the value of the fraction remains the same. In the diagram below, the size of the whole remains the same and the size of each part is half as large.
.
Create an “itch” here. See Teaching Note 5.
The Student Packet IS NOT intended to be a stand-alone workbook! It is structured workspace to support all learners. Lesson plans in the teacher guide provide guidance for classroom activities, interactions, and questioning.

Ratios and Unit Rates 11.1 Ratios
MathLinks: Grade 6 (Teacher Packet 11)
11
INTRODUCE
Whole Class Page 2 Introduction to Ratios Page 3 Equivalent Ratios in Tables
Draw three circles and two stars on the board. What are some ways to describe the relationship between circles and stars? Students may give additive responses, such as “there are three circles and two stars.” Record student responses, and listen closely for multiplicative thinking. If students do not volunteer it, repeat the pattern two more times, and provide sentence starters to help them. For example: For every ____ circles, there are ____ stars. The ratio of circles to stars is ____ to ____.
Show students different ways to record ratios. Some possibilities are: 3 to 2, 3 : 2, and 3 circles for every 2 stars.
As suggested in the CCSS-M Progressions Document, written by authors of CCSS-M to add clarity, we do not use fraction notation for ratios here. If students offer a fraction as an option, simply identify it as the value of the ratio. This will be explored in the next lesson. See Math Notes for more details.
What are some other ratios that can be created from this diagram? Record student responses. Some possibilities include: 9 circles for every 6 stars, (written 9:6), or the ratio of stars to total objects is 2 to 5.
Explain to students that two ratios are equivalent if each number in one ratio is a multiple of the corresponding number in the other ratio. What is the multiplier that verifies that the ratio of 2 stars for every 3 circles is the same as the ratio of 6 stars for every 9 circles? 3. Show students how to record this with an arrow diagram.
Finally, show students how to make a table to record ratios.
Do columns in this a table represent equivalent ratios? Yes. How do you know? The ratios 2 : 3, 4 : 6, and 6 : 9 are all equivalent. Have students determine some of the common multipliers. Notice that multiplier need not be a whole number.
Ask students to read the definitions and explanations in the boxes on pages 2 and 3. What are some ways to write ratios? a : b, a to b, a for every b. How can we check if two ratios are equivalent? Look for a common multiplier. Students may also notice that if ratios are written as fractions, those fractions are equivalent. Identify this as the value of the ratio, which will be explored later. How might we keep track of equivalent ratios? One way is in a table.
Every lesson follows a general pattern (warmup, introduce, explore, summarize, practice, extend, closure). Grouping strategies, student packet page(s), and materials needed for each phase of the lesson are in the left column.
Stars 2 4 6Circles 3 6 9
×2
×2
×1.5
×1.5
3 : 2
9 : 6
3 3

Ratios and Unit Rates 11.1 Ratios
MathLinks: Grade 6 (Teacher Packet 11)
12
EXPLORE 1 / SUMMARIZE 1
Whole Class/ Partners Page 2 Introduction to Ratios Page 3 Equivalent Ratios in Tables Page 4 Exploring Ratios
Students complete problems that focus on the language and notation of ratios, and determine if ratios are equivalent. Discuss. (Page 3, problem 1) How many frogs are there if there are 10 fish? 2. How did you get that? Students may observe that 5 + 5 = 10 and 1 + 1 = 2. This is additive thinking. Encourage students to rephrase using multiplicative thinking (e.g., “we double the number of fish, so we double the number of frogs”). What is the common multiplier for this ratio? The multiplier is 2. What multiplier can you use to determine the number of fish and frogs when the total is 600? 100 because 6 100 = 600. Therefore, 5 100 = 500 fish and 1 100 = 100 frogs. (Page 3, problem 2b) Create a table and record some of the student values. How can we verify that these are equivalent ratios? Look for common multipliers, which may be fractions. (Page 4, problem 4) How do you know that the numbers in rows in this table do not represent equivalent ratios? None of the ratios of numbers of feet to numbers of eyes are equivalent. There is no common multiplier for any of these pairs of numbers.
PRACTICE 1
Individuals Page 5 Practice 1
This page is appropriate for classwork or homework.
EXPLORE 2A / SUMMARIZE 2A
Whole Class / Partners Page 6 Grape Juice Mixtures Reproducible 26 Grape Juice Mixture Cards Materials Scissors Strips of paper
(optional)
Distribute one set of cards to each pair and ask students to cut them up.
Students organize the cards from “least grapey” to “most grapey” on their table. As students work, circulate and ask for explanations. Encourage them to rewrite representations on the cards in different ways to help them justify their ordering decisions.
If desired, give each partner a strip of paper, and ask them to record their order. Post
them for discussion. (The correct order is H, A = D, C, B = E, F = J).
Compare ordering and discuss. Choose a discrepancy and ask students to discuss the ordering of the pair with their partners. Then record their explanations on the board. Encourage students to challenge each other’s reasoning. For example:
Student 1: “I think D and F represent the same grapeyness because they are both 23
grape concentrate.”
Student 2: “ I agree that F is 23
grape concentrate, but D is 23
water, so it is only 13
grape concentrate.

Ratios and Unit Rates 11.1 Ratios
MathLinks: Grade 6 (Teacher Packet 11)
13
EXPLORE 2B / SUMMARIZE 2B
Whole Class / Partners Page 6 Grape Juice Mixtures Reproducible 26 Grape Juice Mixture Cards
Students discuss and critique the reasoning of the four students’ statements. Then they compare the “grapeyness” of mixture J to mixtures with different units of measure. Possible true statements for problem 3 are: (1) J is more grapey than A because though they have the same amount of grape
concentrate, A has much more water.
(2) J is more grapey because it is 23
cups of grape concentrate and A is only 13
cups
of grape. (3) If the cups in J are doubled (use 2 as the multiplier), there are 4 cups grape
concentrate for every 2 cups water. A has 2 cups grape for every 4 cups water.
Challenge students with questions related to changing of units of measure. Generalize comparisons of specific units (such as cups) to any equal units of measure (called “parts”). (Problem 7) Last period some students said that this mixture is less grapey because ounces are less than cups. Were they correct? No. As long as the units are consistent (cups : cups, ounces : ounces, or in general parts : parts), the ratios are equivalent. (Problem 9) Will this mixture taste the same as J ? No. J has twice as much grape as water. 2 ounces of grape is much less than 1 gallon of water, so it will taste much more watery. This is no longer the same ratio of parts to parts.
EXPLORE 2C / SUMMARIZE 2C Whole class / Partners Page 7 Tape Diagrams Reproducible 26 Grape Juice Mixture Cards
Read the description of tape diagrams and discuss the examples. Students draw tape diagrams for four more cards.
(Problem 3) How can you draw the tape diagram for F? Answers may vary. One way is to use a table (or repeated addition) to arrive at the fact that this ratio is equivalent to 2 cups grape concentrate : 3 cups water . Some students may see that using 3 as a multiplier leads to the same conclusion.
cups grape
2
3
3
4
3
6
cups water
1 2 3
(Problem 4) How can you draw the tape diagram for H? Using a variety of multipliers, one can determine that all of the grape concentrate : water ratios in the table are equivalent. Draw one rectangle for grape concentrate and three for water.
G W W G W
3
3

Ratios and Unit Rates 11.1 Ratios
MathLinks: Grade 6 (Teacher Packet 11)
14
EXPLORE 2C / SUMMARIZE 2C (Continued) Whole Class Page 7 Tape Diagrams
Discuss two fundamentally different methods for using tape diagrams.
How do Alex’s and Andrea’s methods differ? Card A represents 2 parts grape concentrate and 4 parts water, for a total of 6 parts mixture. The students are asked to make 12 gallons. Alex notices that he can double the number of parts to make 12, so his picture represents doubling parts. Andrea notices that each part can represent 2 gallons, so rather than doubling the parts, she doubles how much the parts each represent.
Students use the different methods to solve two problems. (Problem 7) Why might Alex’s method be difficult to use here? We would have to draw a lot of boxes to make our tape diagram represent 72 parts. Anderea’s method is much more efficient.
EXTEND Whole Class Task, Page 14 Grapey Mixtures Reproducible 26 Grape Mixture Cards Reproducible 27 Blank Cards Materials poster-sized paper markers tape or glue
For this project, provide clean copies of grape mixture cards and other supplies to students. Students create a poster that shows mixtures from least grapey to most grapey using different representations. They also include additional mixture(s) and representations of their own.
What are some representations we might use to illustrate grape mixtures?
Pictures, tape diagrams, a : b notation, “for every…” statement, etc. How might we organize cards on a poster? Answers will vary. One possibility is:
least grapey <- - - - - - - - - - - - - -> most grapey picture tape diagram a : b notation verbal statement (“for every…”) table
PRACTICE 2 Whole Class Page 8 Practice 2
This page is appropriate for classwork or homework.
CLOSURE Whole Class Page 0 Word Bank Page 1 Ratios
Review the goals, standards, and vocabulary of the lesson.

Ratios and Unit Rates 11.2 Unit Rates
MathLinks: Grade 6 (Teacher Packet 11)
15
Create an “itch” here. See Teaching Note 5.
EL Tip
Use color, circle the value, and label it “unit rate.”
UNIT RATES
Summary Students explore the relationship between ratios and rates, and unit rate is defined. Students represent ratios and rates with tables and double number line diagrams, and solve problems using rates. 6.RP.A
Goals
Relate unit rate to ratio. Represent rates using symbols, words, tables,
and double number line diagrams. Solve problems using rates, tables and double
number line diagrams.
PREVIEW / WARMUP
Whole Class / Individuals Page 0 Word Bank Page 9 Unit Rates
Introduce the goals and standards of the lesson. Discuss important vocabulary as relevant.
Students choose statements that describe a picture accurately. Discuss. (Statements
1, 2, 3, 4, and 8 are true.)
INTRODUCE
Whole Class
Gather time and distance data from students by asking them a question about the time it takes to drive a local distance. Use student data for this introduction. (Example) How long does it typically take to drive to our closest theme park? 2 hours. How far is it? 70 miles.
Begin a table that shows this distance and time. If we drive for 4 hours at that rate, how far will we go? 140 miles. Record in the table. If we drive 35 miles at this rate, how long will it take? 1 hour. Record in the table. State this relationship as a ratio statement. We drive 2 hours for every 70 miles. Some students may say “35 miles per hour.” Use this statement to introduce unit rate. Are the ratios in our table equivalent? Yes. Identify multipliers to support this conclusion.
Introduce the concept of unit rate (the value of the ratio, or the ratio a : b written as the
fraction a
b with units attached). In the example above, the unit rate is
70
2 = 35 miles
per hour. The value of the ratio is 35, and the unit rate is measured in units of miles per hour. The unit rate is then 35 miles per hour. Which value in our table indicates the unit rate? 35 miles in 1 hour.
Distance (miles) 70 Time (hours) 2

Ratios and Unit Rates 11.2 Unit Rates
MathLinks: Grade 6 (Teacher Packet 11)
16
INTRODUCE (Continued)
Whole Class Page 0 Word Bank Page 10 Unit Rates Associated with Ratios
Explain to students that when we have equivalent ratios that involve different units (say miles and hours), we can represent them with a double number line diagram. Show students how to display this information on a double number line. Include other values that fit on the line as well.
Compare the double number line to the table we created. How is information on the double number line different than the table? The numbers are scaled and in order on a double number line. Tables may have values in any order. Where do we identify the unit rate on this double number line? Look for the number of miles traveled for one unit of time (one hour).
Ask students to read the definition of unit rate and explain it to each other. Then have
them complete the questions on the page and discuss as needed.
EXPLORE
Partners Page 11 Rates and Tables Pages 12-13 Ratios and Double Number Lines
Students work together to answer questions related to rates, tables, and double number lines. Circulate to identify misconceptions or sticking points. Encourage students to ask each other for help as needed.
SUMMARIZE
Partners Page 11 Rates and Tables Pages 12-13 Ratios and Double Number Lines
Discuss problems where students had difficulty. (Page 11, Problem 4) How do you know that prices and quantities in columns in Table III represent equivalent ratios? One way is to calculate their unit rate. In all cases, the unit rate is 0.10. (Page 11, Problem 4) How can we verify that these prices and quantities represent equivalent ratios using a constant multiplier? We can find a constant multiplier for any pair of bags. For example, the multiplier for prices and quantities for B and D is 3. The multiplier for prices and quantities for C and D is 0.75. (Pages 12 and 13) What table values were difficult to find? Answers will vary. How did you find them? Encourage students to explain how they found values using unit rates, multipliers, or other strategies. Do you prefer to find unit rates or multipliers to determine if ratios are equivalent? Answers will vary. It probably depends on the numbers in the ratios.
0 35 70 105 140 175 Distance (miles)
Time (hours)
0 1 2 3 4 5

Ratios and Unit Rates 11.2 Unit Rates
MathLinks: Grade 6 (Teacher Packet 11)
17
PRACTICE 1
Groups of 4 Page 14 Poster Problems Reproducible 28 Poster Problems 3 Materials Chart Paper Markers
“Poster Problems” allow students to practice math in groups as they move around the room. To prepare, print one copy of the reproducible for each group, and create numbered posters (chart paper) equal to the number of groups you have in your classroom. Put chart paper around the room.
(For Poster Problems) Arrange students into groups no larger than four. Students
identify themselves as A, B, C, or D. Give each group a different color marker for accountability purposes.
Each group begins at their numbered poster. (1) Student “A” writes the answer to part A of the poster problem with the group’s colored marker. Other members support and help. (2) After about 3-4 minutes, say “Move to the next problem,” and all groups move to the next poster. The entire group checks the previous work on the poster for that problem. Then Student “B” writes the answer to part B for that problem with the group’s colored marker. Other members support and help. (3) Repeat Step 2 two more times to complete parts C and D.
After problems are completed, ask students to return to their table groups. Ask
students to complete the problems in their packets and discuss all problems. Encourage students to share constructive feedback that would improve explanations for placement of fractions using conceptual strategies.
What are the “twists” in each problem? For problem 1, you can purchase 1 marker for 60¢ and there will be money leftover. For problem 2, the team will not play
22
3 games in a week. They will play more games in one week and fewer games
another. For problem 3, when milk and flour are mixed together, the milk absorbs the flour so there are not really 7 cups of mixture. Furthermore, For problem 4, people do not grow at a constant rate forever. If that happened, we would all be REALLY tall!
PRACTICE 2
Groups Page 15-16 Practice
These pages are appropriate for classwork or homework.
CLOSURE Whole Class Page 0 Word Bank Page 9 Unit Rates
Review the goals, standards, and vocabulary of the lesson.
EL Tip Use color, circle the value, and label it “unit rate.”

Ratios and Unit Rates 11.3 Ratio and Unit Rate Problems
MathLinks: Grade 6 (Teacher Packet 11)
18
Create an “itch” here. See Teaching Note 5.
RATIO AND UNIT RATE PROBLEMS
Summary Students solve ratio and rate problems using tables, diagrams, and equations. 6.RP.A
Goals
Solve ratio and unit rate problems using a variety of strategies.
PREVIEW / WARMUP
Whole Class Page 0 Word Bank Page 17 Ratio and Unit Rate Problems
Introduce the goals and standards of the lesson. Discuss important vocabulary as relevant.
Students review ratios and unit rates.
INTRODUCE 1
Whole Class Page 18 The Green Grocer Page 19 The Toothpaste Problem Page 20 Apples, Apples, Apples
This lesson contains seven situations where students apply proportional reasoning to solve problems. Consider assigning the first three together.
(The Green Grocer) This problem requires students to identify the unit rate within
different representations and then solve a problem. What information is given? A ratio: It costs $3.50 for every 2 melons. What are you asked to do? Create a unit rate, a table, a double number line, and solve two problems.
(The Toothpaste Problem) This problem asks students to solve a problem using tables to represent equivalent ratios. They need to determine appropriate multipliers that will lead them to a fractional solution. What information is given? A ratio: Pippy uses 3 tubes for every 5 months. What are you asked to do? Determine the number of tubes used in a year. Explain how to estimate the number of tubes needed for one year. From the first table, 6 is too few and 9 is too many, so it is somewhere in between.
(Apples, Apples, Apples) Students determine the best buy given costs for apples at different stores. What information is given? The amount of apples you want to buy. The cost for apples at different stores.
What are you asked to do? Determine the best buy. In other words, get the most pounds of apples for some amount of money, or spending the least amount of money for some number of pounds of apples.

Ratios and Unit Rates 11.3 Ratio and Unit Rate Problems
MathLinks: Grade 6 (Teacher Packet 11)
19
EXPLORE 1 / SUMMARIZE 1 Partners Page 18 The Green Grocer Page 19 The Toothpaste Problem Page 20 Apples, Apples, Apples
Students work together to solve the problems. As they work, circulate and encourage students to explain their thinking in different ways and to ask questions of each other. Some group discussion questions are included here. (The Green Grocer) Explain how to find the unit rate in the different representations? Problem 1 asked for it explicitly. For problem 2, it was the last entry in the table. For problem 3, it is the dollars for 1 melon. For problem 4, it is the coefficient of M. Follow up with student explanations for how they used unit rates or another strategy to solve problems 6 and 7. (The Toothpaste Problem) Why was this problem not solved quickly with a table? The result is not a whole number. How is Zippy’s strategy different than Tippy’s strategy? Tippy recorded the unit rate in the table by dividing the first entry by 5. Then she multiplied entries by 2 and then by 6. Instead of dividing initial table entries by 5 and then multiplying by 12 in
several steps, Zippy multiplied both numbers in the initial ratio by 12
5.
(Apples, Apples, Apples) How did you start this problem? Most likely with Store A. At this store, 5 pounds will cost $10.00. What did you do then? Students may have determined the unit price for each store, but if they compare to Store A, they can eliminate some options. Which calculations were difficult? Some students may have difficulties with Stores C and D if they are trying to convert the given bags to their 5 lb equivalent prices. Some students may be challenged by the fractional pound savings statements for Stores E and F.
Invite students to present solutions to problems. Encourage students to ask clarifying
questions when explanations are unclear.
PRACTICE 1 Individuals Page 21 Building a Deck
This is appropriate for classwork or homework. Calculators are useful for this problem.
INTRODUCE 2
Groups Page 22 The Grain Grocer Page 23 The Assembly Page 24 The Paint Mistake
For the final three situations, consider a jigsaw structure. In “home groups,” have students number off 1, 2, 3, 1, 2, 3 … Then ask all 1s to work with other 1s to solve The Grain Grocer problem. Ask all 2s to work with other 2s to solve The Assembly problem. Ask all 3s to work with other 3s to solve The Paint Mistake problem. Experts then return to their “home groups” and help each other solve all three problems.
Explain the jigsaw structure to students and have them number off (1, 2, 3, 1, 2, 3, etc)
in their home groups. Then have students regroup themselves (all 1s will work in the northeast corner of the room, etc) and create three working groups. Assign one problem to each working group.

Ratios and Unit Rates 11.3 Ratio and Unit Rate Problems
MathLinks: Grade 6 (Teacher Packet 11)
20
EXPLORE 2A Groups Page 22 The Grain Grocer Page 23 The Assembly Page 24 The Paint Mistake
Once in working groups, students may want to work individually or with a partner to solve problems, and then compare and discuss solutions. Allow students to struggle with representations and explanations. Encourage students who are creating double number lines or tape diagrams to share with others. Once they have solved the problems, they will be “experts” for that problem. What representation might be useful for the Grain Grocer? Double number line. What representation might be useful for the Assembly? Tape diagram. What representation might be useful for the Paint Mistake? Tape diagram.
EXPLORE 2B
Groups Page 22 The Grain Grocer Page 23 The Assembly Page 24 The Paint Mistake
Students return to their home groups and continue to work on the problems. Students should be able to complete all three problems with the help of the “expert,” who returned from the working group. Encourage experts to ask good questions rather than just give partners answers.
SUMMARIZE 2 Whole Class Page 22 The Grain Grocer Page 23 The Assembly Page 24 The Paint Mistake
Discuss the process and the problems. Which representations were useful for the problems? Hopefully students recognize the utility of double number line diagrams or tape diagrams for solving these problems. If you were an “expert,” where did people in your group get stuck on your problem? How did you help them get unstuck? Answers will vary.
CLOSURE Whole Class Page 0 Word Bank Page 17 Ratio and Unit Rate Problems
Review the goals, standards, and vocabulary of the lesson.

Name ___________________________ Period __________ Date ____________
MathLinks: Grade 6
QUIZ 11A 1. The teacher drew these shapes to the right
on the whiteboard. a. Complete the table comparing the number of circles and triangles in the ratio pictured.
Be sure to include the labels in the left column.
1 150 6
3 9
Total 44 b. Using columns in the table, write two ratios that
represent the ratio of circles to the total number of shapes. Show the multiplier with an arrow diagram.
3. Lita is painting her bedroom. She wants her bedroom to be painted lilac. In order to make this color she mixes together purple and white paint in a ratio of 2 : 5. a. Draw a tape diagram to represent this.
b. How many cups of white paint will she need to make 63 cups of lilac paint?
2. Using the table to the right, do the numbers in the rows represent equivalent ratios? ____ Explain. Number of
pencils Number of notebooks
Period 1 62 31
Period 2 76 38
Period 3 33 33
Period 4 94 47
×___ ×___
____ to ____
____ to ____
Two parallel forms of quizzes assess basic knowledge in the packet. They are typically two pages long, contain structured workspace (as in the packet), and ask for short answer responses.

Name ___________________________ Period __________ Date ____________
MathLinks: Grade 6
QUIZ 11A (Continued)
4. It takes Raul 4 weeks to read 3 books.
a. Complete the double number line diagram below.
b. At that rate, how many books can he read in 28 weeks? _____
c. At that rate, how long will it take him to read 24 books? _____ 5. Ben gets $30 in allowance every two weeks. He is saving all of his allowance to buy a
game system that costs $360. How many weeks will it take him to save up enough money for the system? Use a table, tape diagram, or double number line to show your reasoning.
6. During exercise, Sonia’s heart beats 675 times in 5 minutes. How many times does it beat per minute?
7. You buy 7 pounds of potatoes every 4 weeks.
a. How many pounds of potatoes do you buy per week?
b. At that rate how many pounds of potatoes would you buy in 6 weeks? 8. Sana and Bill are shopping in the grocery store. They see the sign that says “8 pounds of
apples for $6.00.” Sana says that the sign means you can get 1 13
pounds of apples for
one dollar. Bill says Sana is wrong and that the sign means it cost $0.75 per one pound of apples. Who is correct Sana, Bill or both of them? Explain.
# of weeks
# of books
0 4

Name ___________________________ Period __________ Date ____________
MathLinks: Grade 6
QUIZ 11B 1. The teacher drew these shapes to the right
on the whiteboard.
a. Complete the table comparing the number of circles and triangles in the ratio pictured. Be sure to include the labels in the left column.
2 140 12
3 9
Total 55 b. Using columns in the table, write two ratios that
represent the ratio of circles to the total number of shapes. Show the multiplier with an arrow diagram.
3. Lita is painting her bedroom. She wants her bedroom to be painted lilac. In order to make this color she mixes together purple and white paint in a ratio of 3 : 4. a. Draw a tape diagram to represent this.
b. How many cups of white paint will she need to make 56 cups of lilac paint?
2. Using the table to the right, do the numbers in the rows represent equivalent ratios? ____ Explain. Number of
pencils Number of notebooks
Period 1 64 16
Period 2 48 12
Period 3 16 4
Period 4 128 32
×___ ×___
____ to ____
____ to ____
Form A and Form B are parallel quizzes.

Name ___________________________ Period __________ Date ____________
MathLinks: Grade 6
QUIZ 11B (Continued)
4. It takes Raul 3 weeks to read 5 books.
a. Complete the double number line diagram below.
b. At that rate, how many books can he read in 27 weeks? _____
c. At that rate, how long will it take him to read 30 books? _____ 5. Ben gets $40 in allowance every three weeks. He is saving all of his allowance to buy a
game system that costs $360. How many weeks will it take him to save up enough money for the system? Use a table, tape diagram, or double number line to show your reasoning.
6. During exercise, Sonia’s heart beats 810 times in 6 minutes. How many times does it beat per minute?
7. You buy 9 pounds of potatoes every 5 weeks.
c. How many pounds of potatoes do you buy per week?
d. At that rate how many pounds of potatoes would you buy in 7 weeks? 8. Sana and Bill are shopping in the grocery store. They see the sign that says “10 pounds of
apples for $4.00.” Sana says that the sign means you can get 2
15
pounds of apples for
one dollar. Bill says Sana is wrong and that the sign means it cost $0.40 per one pound of apples. Who is correct Sana, Bill or both of them? Explain.
# of weeks
# of books
0 3

Name ___________________________ Period __________ Date ____________
MathLinks: Grade 6
TEST PART 11
Show your work on a separate sheet of paper. 1. Choose all ratios that are equivalent to 24 : 16.
A. 3 : 2 B. 48 : 32 C. 9 : 4 D. 36 : 24
2. This incomplete table shows how much money a grocery store receives for selling different
amounts of potatoes. If the ratio of numbers of pounds to total cost does not change, what are the total sales for 10 pounds of potatoes?
Number of Pounds 4 8 10 12 Total Cost $12
A. $30 B. $36 C. $25 D. $40
3. Using the information from problem 2, how many pounds of potatoes can be purchased for
$132?
A. 33 B. 14 C. 60 D. 44
4. Using the information from problem 2, what is the unit rate of cost (in dollars) per pounds of
potatoes?
5. Miranda babysat 3 hours each night for 8 nights. She earned a total of $192 babysitting.
How much did she earn per hour? A. $24 B. $8 C. $17 D. $64
6. McKinley Middle School has a total enrollment of 270 students. The ratio of boys to girls at
the school is 5:4. How many girls are at McKinley Middle School? A. 216 B. 120 C. 185 D. 135
7. These two rate statements are NOT the same. Use words and numbers to explain the
difference. a. Zeek earns 15 dollars in 3 hours.
b. Caleb earns 3 dollars in 15 hours.
A. $ 3 B. $ 0.33 C. $ 4 D. $ 12
Since students continue to practice what they’ve learned in skill builders, we recommend that summative tests be given at least a few weeks after the packet is completed. Tests (written in parts to correspond with packets) are intended to be combined to create periodic assessments. For example, Test Parts 9, 10, 11, 12 may be combined for a summative test, given after Packet 13.

Name ___________________________ Period __________ Date ____________
MathLinks: Grade 6
PROFICIENCY CHALLENGE 11
1. A geometric sequence is a sequence in which each term after the first term is obtained by multiplying (or dividing) the previous term by the same value. State the multiplier (or “divider”) for each geometric sequence below.
a. 6, 12, 24, 48 …
b. 18, 54, 162, 486 …
c. 100, 1000, 10000, 100000 …
d. 1024, 512, 256, 128 …
2. Find the missing values in each of the geometric sequences below.
Then find the multiplier or divider. Explain your reasoning for each answer.
a. 60, ___, 240, 480 …
b. 16, 8, ___, 2 …
c. ___, 12, 36, 108, ____ …
d. ___, ___, 16, 64, 256 … 3. Explain why the following sequences of numbers are not geometric sequences.
a. 3, 6, 9, 12 …
b. 24, 22, 20, 18 …
Each packet includes a Proficiency Challenge. Questions assess skills , concepts, and applications with more rigorous questions than those found on quizzes. Many questions are based on released items from the Smarter Balanced Assessment Consortium.

Name ___________________________ Period __________ Date ____________
MathLinks: Grade 6
PROFICIENCY CHALLENGE 11 (Continued) 4. Change exactly two of the numbers in this table to create a table where columns of
numbers represent equivalent ratios.
Wendy Xandra Yonie Zeke bracelets completed 10 50 20 15
hours worked 4 40 8 2
5. Use each of these numbers exactly once to create a table that contains rows of numbers that represent equivalent ratios.
6, 42, 24, 72, 11, 2, 14, 33
Do you think your table is the only solution? Explain your reasoning. 6. Create three different algebraic equations that have the following solution.
a. x = 3 b. 1
2=x
7. Before Mr. Moneybags died, he wrote a “last will” to distribute his estate in this way:
• He would first leave half of his estate to his wife.
• Then he would leave $100,000 to his daughter.
• Then he leaves half of what remains to his butler.
• The final $30,000 is donated to a charity.
What was the value of his estate?

MathLinks: Grade 6 (Reproducibles) 26
GRAPE JUICE MIXTURE CARDS A.
B.
Cups of Grape : Cups of Water
4 : 5
C.
D.
Cups of Water to Mixture (total)
2 to 3
E.
F.
For every 1 cup water,
there is 23 cups grape.
J.
H.
Cups Grape 1 4 2 7
Cups Water 3 12 6 21
Students sort these cards from “least grapey” to “most grapey” as part of an activity in Lesson 11.1 . This leads to the introduction of tape diagrams.

MathLinks: Grade 6 (Reproducibles) 27
BLANK CARDS
Blank cards for the Grapey task.

MathLinks: Grade 6 (Reproducibles) 28
POSTER PROBLEMS 3
Problem 1 (or Problem 5): Dee Dee can buy 12 markers for $7.20. A. Copy the fact statement. Then make a ratio table to illustrate this situation. B. Make a tape diagram or double number line to illustrate this situation. C. What is the cost per marker? D. How much would it cost her to buy 8 markers at this rate?
Problem 2 (or Problem 6): A baseball team plays 8 games in 3 weeks. A. Copy the fact statement. Then make a ratio table to illustrate the situation. B. Make a tape diagram or double number line to illustrate the situation. C. How many games are played per week? D. At this rate, how many games would be played in 12 weeks?
Problem 3 (or Problem 7): A recipe has a ratio of 3 cups of milk to 4 cups of flour. A. Copy the fact statement. Then make a ratio table to illustrate the situation. B. Make a tape diagram or double number line diagram to illustrate the situation. C. How many cups of milk are needed for each one cup of flour? D. At this rate, how many cups of milk are needed for a recipe that uses 16 cups of flour?
Problem 4 (or Problem 8): Danisha grows 2 inches in 40 weeks. A. Copy the fact statement. Then make a ratio table to illustrate the situation. B. Make a tape diagram or double number line diagram to illustrate the situation. C. What is Danisha’s growth rate per week? D. At this rate, how much would Danisha grow in 10 weeks?
Each group gets this question sheet, which is used as part of the Poster Problem group activity in Lesson 11.1

MathLinks: Grade 6 (Tasks) 14
GRAPEY MIXTURES Lesson 11.1
You will need a cut up a copy of the Grape Mixture Cards, some blank cards, and a large sheet of paper (or poster), markers, tape or glue.
• Organize all the cards from least grapey to most grapey.
• Create additional cards that show the mixtures using different representations.
• Create at least one additional mixture and include it with different representations.
• Create poster that shows all the mixtures in an organized way. Be sure to include titles and labels to explain the meaning of your poster.
Every packet includes at least one task. The tasks are made of skill building challenges, conceptual development extensions, real world problems, performance tasks, or open-ended questions. This particular task extends concepts introduced in the “Grapey Mixtures” problem in Lesson 11.1 .