MATHLINKS: GRADE 6
64
Name ____________________________ Period __________ Date _____________ MathLinks: Grade 6 (Resource Guide: Part 1) Table of Contents Pages Word Bank 1 Mathematical Symbols and Language 18 Mathematical Properties 19 Whole Numbers: Multiplication and Division 20 Factors and Multiples 23 GCF and LCM 25 Order of Operations 27 Models for Fractions 29 Fraction Ordering and Equivalence 31 Fraction Addition and Subtraction 36 Fraction Multiplication and Division 43 Decimal Concepts 49 Decimal Operations 50 Statistics 53 Data Displays 57 MATHLINKS: GRADE 6 RESOURCE GUIDE: PART 1 GRADE 6 RESOURCE GUIDE PART 1
Transcript of MATHLINKS: GRADE 6

Name ____________________________ Period __________ Date _____________
MathLinks: Grade 6 (Resource Guide: Part 1)
Table of Contents Pages
Word Bank 1
Mathematical Symbols and Language 18
Mathematical Properties 19
Whole Numbers: Multiplication and Division 20
Factors and Multiples 23
GCF and LCM 25
Order of Operations 27
Models for Fractions 29
Fraction Ordering and Equivalence 31
Fraction Addition and Subtraction 36
Fraction Multiplication and Division 43
Decimal Concepts 49
Decimal Operations 50
Statistics 53
Data Displays 57
MATHLINKS: GRADE 6
RESOURCE GUIDE: PART 1
GRADE 6 RESOURCE GUIDE
PART 1

Resource Guide: Part 1
MathLinks: Grade 6 (Resource Guide: Part 1) 0
THE STANDARDS FOR MATHEMATICAL PRACTICE In addition to the mathematical topics you will learn about in this course, your teacher will help you become better at what are called the Mathematical Practices. The Standards for Mathematical Practice describe a variety of processes and strategies to help you to be more mathematically proficient and fluent students. One way to think about the practices is in groupings.
HA
BIT
S O
F M
IND
MP
1 M
ake
sens
e of
pro
blem
s an
d pe
rsev
ere
in s
olvi
ng t
hem
MP
6 A
tten
d to
pre
cisi
on
REASONING AND EXPLAINING
MP2 Reason abstractly and quantitatively
MP3 Construct viable arguments and critique the reasoning of others
MODELING AND USING TOOLS
MP4 Model with mathematics
MP5 Use appropriate tools strategically
SEEING STRUCTURE AND GENERALIZING
MP7 Look for and make use of structure
MP8 Look for and make use of repeated reasoning

Resource Guide: Part 1 Word Bank
MathLinks: Grade 6 (Resource Guide: Part 1) 1
WORD BANK
Word or Phrase
Definition
addend In an addition problem, an addend is a number to be added. See sum. Example: 7 + 5 = 12 addend addend sum
algorithm An algorithm is an organized procedure, or step-by-step recipe, for performing a calculation or finding a solution.
Example: The traditional procedure for dividing whole numbers is called the long division algorithm.
area
The area of a two-dimensional figure is a measure of the size of the figure, expressed in square units. The area of a rectangle is the product of its length and its width. Example: If a rectangle has a length of 12 inches and a width of 5 inches, its area is (5)(12) = 60 square inches.
area model for fractions
An area model for fractions represents fractions pictorially using figures in the plane. In this model, a figure is divided into pieces of equal area, and some of the pieces are shaded. The number of shaded pieces is the numerator of the fraction, and the total number of pieces is the denominator.
Example: A figure representing 38
:
wid
th
length
Area = (length) (width)

Resource Guide: Part 1 Word Bank
MathLinks: Grade 6 (Resource Guide: Part 1) 2
area model for multiplication
An area model for multiplication is a pictorial way of representing multiplication using rectangles. The length and width of a rectangle represent factors, and the area of the rectangle represents their product.
Example: (multiplying whole numbers) 13 12 = 156
1002030 6
156
Example: (multiplying proper fractions) 1 2
2 3
1 2 2 =
2 3 6
associative property of addition
The associative property of addition states that a + (b + c) = (a + b) + c for any three numbers a, b, and c. In other words, the sum does not depend on the grouping of the addends.
Example: 9 + (1 + 14) = (9 + 1) + 14
associative property of multiplication
The associative property of multiplication states that
(a b) c = a (b c) for any three numbers a, b, and c. In other words, the product does not depend on the grouping of the factors.
Example: (3 4) 5 = 3 (4 5)
benchmark fraction
A benchmark fraction refers to a fraction that is easily recognizable. It is easily identified on the number line, and it is more commonly used in everyday experiences.
Example: Some benchmark fractions are 1 1 1 2 3
, , , , 2 3 4 3 4
.
10 + 3
10
+ 2
100 30
20 6
+ +
+
13
13
13
12
12

Resource Guide: Part 1 Word Bank
MathLinks: Grade 6 (Resource Guide: Part 1) 3
box plot A box plot, or box-and-whiskers plot, is a graphical representation of the five-number summary of a data set. There are several variants of box plots. In one of these, the minimum, maximum, median, and quartiles of the data set are indicated by dots on a number line, a box from the first quartile to the third quartile encloses the middle half of the data set, and whiskers reach out from the box to the minimum and maximum. See five-number summary.
Example: A box-and-whiskers plot for test scores ranging from a minimum score of min = 65 to a maximum score of max = 95, with median score M = 77, first quartile Q1 = 70, and third quartile Q3 = 88.
60 65 70 75 80 85 90 95 100
common denominator
A common denominator of two or more fractions is a number that is divisible by each of the denominators of the fractions.
Example: A common denominator of the fractions 16
and 34
is
24, since 24 is divisible by both 6 and 4. Another common denominator of these fractions is 36. The least (smallest) common denominator of these fractions is 12.
commutative property of addition
The commutative property of addition states that a + b = b + a for any two numbers a and b. In other words, changing the order of the addends does not change the sum.
Example: 14 + 6 = 6 + 14
commutative property of multiplication
The commutative property of multiplication states that a b = b a for any two numbers a and b. In other words, changing the order of the factors does not change the product.
Example: 3 5 = 5 3
Resource Guide: Part 1 Word Bank
MathLinks: Grade 6 (Resource Guide: Part 1) 4
composite number
A number is composite if it has more than two divisors or factors.
Example: 12 has six factors 1, 2, 3, 4, 6, 12 because 12 = 1 • 12, 12 = 2 • 6, and 12 = 3 • 4. Since 12 has more than two factors, 12 is a composite number.
counting numbers
The counting numbers are the numbers 1, 2, 3, … . See natural numbers.
decimal A decimal is an expression of the form n.abc … , where n is a whole number written in standard form, and a, b, c, … are digits. Each decimal represents a unique nonnegative real number and is referred to as a decimal expansion of the number.
Example: The decimal expansion of 43
is 1.333333… .
The decimal expansion of is 3.14159… .
decimal fraction
A decimal fraction is a fraction that can be written in the form 10
= m
ka ,
where k and m are whole numbers. The decimal expansion of the decimal fraction a has the form a = n.a…c, where n is a whole number and a, …, c are digits.
Example: The fraction 23150
is a decimal fraction, since it can be
represented as 462100
= 4.62.
denominator The denominator of the fraction ab
is b.
Example: The denominator of 37
is 7.
difference In a subtraction problem, the difference is the result of subtraction. The minuend is the number from which another number is being subtracted, and the subtrahend is the number that is being subtracted. Example: 12 – 4 = 8 minuend subtrahend difference
digit A digit in the base-10 number system is one of the ten symbols: 0, 1, 2, 3, 4, 5, 6, 7, 8, 9. Example: In the number 7,863, the digits are 7, 8, 6, and 3.
Resource Guide: Part 1 Word Bank
MathLinks: Grade 6 (Resource Guide: Part 1) 5
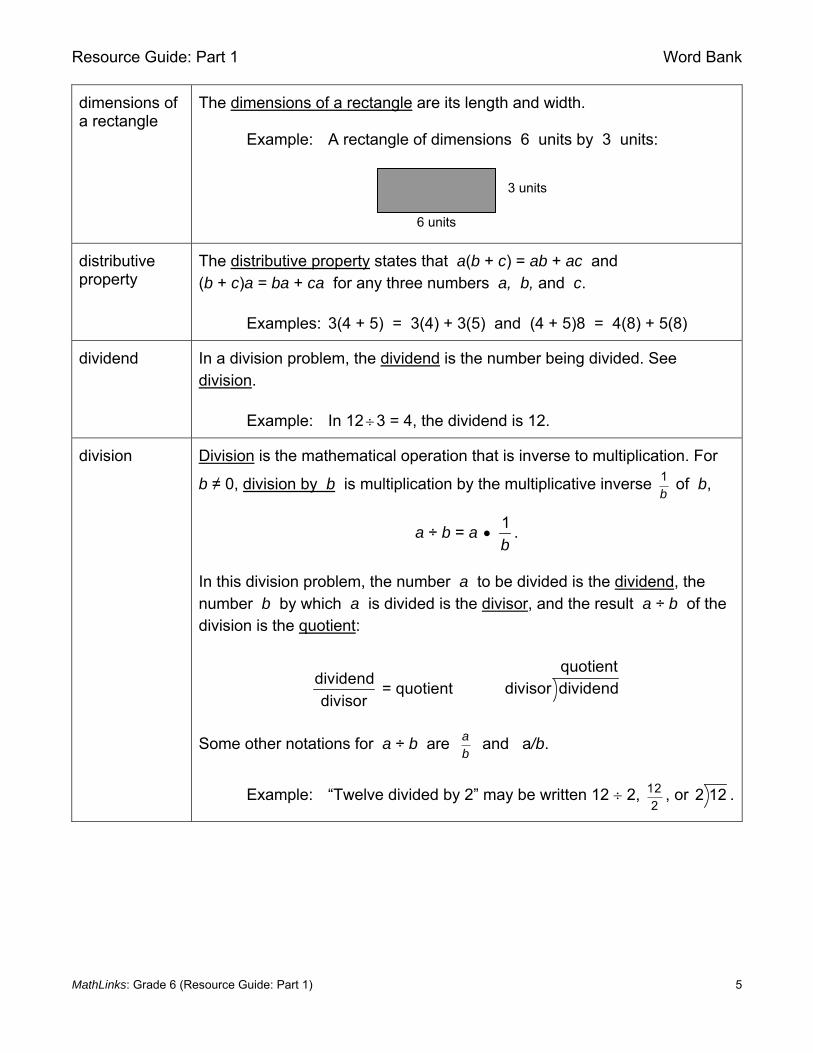
dimensions of a rectangle
The dimensions of a rectangle are its length and width.
Example: A rectangle of dimensions 6 units by 3 units:
distributive property
The distributive property states that a(b + c) = ab + ac and (b + c)a = ba + ca for any three numbers a, b, and c. Examples: 3(4 + 5) = 3(4) + 3(5) and (4 + 5)8 = 4(8) + 5(8)
dividend In a division problem, the dividend is the number being divided. See division. Example: In 123 = 4, the dividend is 12.
division Division is the mathematical operation that is inverse to multiplication. For
b ≠ 0, division by b is multiplication by the multiplicative inverse 1b
of b,
a ÷ b = a 1
b .
In this division problem, the number a to be divided is the dividend, the number b by which a is divided is the divisor, and the result a ÷ b of the division is the quotient:
dividend= quotient
divisor
quotientdivisor dividend
Some other notations for a ÷ b are ab
and a/b.
Example: “Twelve divided by 2” may be written 12 2, 122
, or 2 12 .
6 units
3 units
Resource Guide: Part 1 Word Bank
MathLinks: Grade 6 (Resource Guide: Part 1) 6
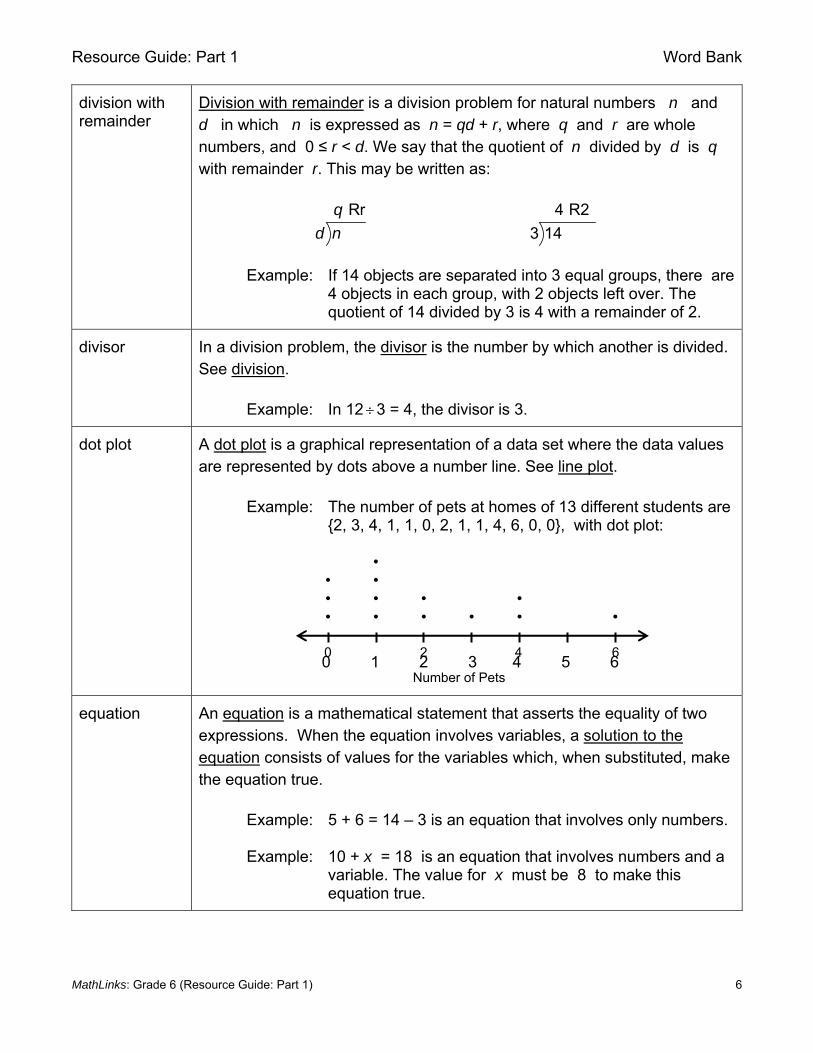
division with remainder
Division with remainder is a division problem for natural numbers n and d in which n is expressed as n = qd + r, where q and r are whole numbers, and 0 ≤ r < d. We say that the quotient of n divided by d is q with remainder r. This may be written as:
Rr
q
d n
4 R2
3 14
Example: If 14 objects are separated into 3 equal groups, there are
4 objects in each group, with 2 objects left over. The quotient of 14 divided by 3 is 4 with a remainder of 2.
divisor
In a division problem, the divisor is the number by which another is divided. See division.
Example: In 123 = 4, the divisor is 3.
dot plot
A dot plot is a graphical representation of a data set where the data values are represented by dots above a number line. See line plot.
Example: The number of pets at homes of 13 different students are {2, 3, 4, 1, 1, 0, 2, 1, 1, 4, 6, 0, 0}, with dot plot:
• • • • • • • • • • • • •
.
equation An equation is a mathematical statement that asserts the equality of two expressions. When the equation involves variables, a solution to the equation consists of values for the variables which, when substituted, make the equation true.
Example: 5 + 6 = 14 – 3 is an equation that involves only numbers. Example: 10 + x = 18 is an equation that involves numbers and a
variable. The value for x must be 8 to make this equation true.
0 1 2 3 4 5 6 Number of Pets
0 2 4 6

Resource Guide: Part 1 Word Bank
MathLinks: Grade 6 (Resource Guide: Part 1) 7
equivalent fractions
The fractions ab
and cd
are equivalent if they represent the same point
on the number line. This occurs if the results of the division problems a ÷ b and c ÷ d are equal.
Example: Since 12
= 1 ÷ 2 = 0.5 and 36
= 3 ÷ 6 = 0.5, the
fractions 12
and 36
are equivalent.
Pictorially:
estimate
An estimate is an educated guess.
Example: If the price of avocados is 89 cents each, and you wish to buy 4 avocados, a good estimate of the total cost might be 4 times 90 cents, or $3.60.
expanded form of a number
An expanded form of a number is an expression for the number that shows explicitly the place value of each digit. Example: 4,279 = (4 × 10³) + (2 × 10²) + (7 × 101) + (9 × 100) 4,279 = (4 × 1,000) + (2 × 100) + (7 × 10) + (9 × 1) 4,279 = 4,000 + 200 + 70 + 9
exponential notation
The exponential notation bn (read as “ b to the power n ”) is used to express n factors of b. The number b is the base, and the number n is the exponent.
Example: 23 = 2 • 2 • 2 = 8 The base is 2 and the exponent is 3.
Example: 32 • 53 = 3 • 3 • 5 • 5 • 5 = 1,125 The bases are 3 and 5.
expression A mathematical expression is a combination of numbers, variables, and operation symbols. When values are assigned to the variables, an expression represents a number.
Example: Some mathematical expressions are 19, 7x, a + b, and 4v – w.

Resource Guide: Part 1 Word Bank
MathLinks: Grade 6 (Resource Guide: Part 1) 8
factor of a number
A factor of a number is a divisor of the number. See divisor. Example: The factors of 12 are 1, 2, 3, 4, 6, and 12.
factor tree See prime factorization.
fair-share division problem
In a fair-share division problem, a total quantity and the number of groups among which it is to be distributed equally are known, but the amount to be given to each group is unknown. See partitive division.
Example: If 18 plums are divided equally among 3 students, how many does each student get? 6 plums each.
Example: Dealing cards so that each player gets the same amount is an example of fair-share division.
five-number summary
The five-number summary of a data set consists of its minimum value (min), first quartile Q1, median M, third quartile Q3, and maximum value (max). The five-number summary is usually written in the form (min, Q1, M, Q3, max).
Example: The five-number summary of the data set {1, 1, 1, 3, 5, 5, 6, 7, 23} is given by (min, Q1, M, Q3, max) = (1, 1, 5, 6.5, 23).
fraction
The fraction is a number expressible in the form ab
where a is a whole
number and b is a positive whole number.
Example: The fraction 35
is represented by the dot on the
number line.
fundamental theorem of arithmetic
The fundamental theorem of arithmetic states that every number n ≥ 2 has a unique factorization as a product of prime numbers. Example: 10 = 2 • 5, 21 = 3 • 7, 43 = 43 Example: 60 = 2 • 2 • 3 • 5 = 22 • 3 • 5
0 351

Resource Guide: Part 1 Word Bank
MathLinks: Grade 6 (Resource Guide: Part 1) 9
greatest common factor
The greatest common factor (GCF) of two numbers is the greatest factor that divides the two numbers.
Example: The factors of 12 are 1, 2, 3, 4, 6, and 12. The factors of 18 are 1, 2, 3, 6, 9, and 18. Therefore the GCF of 12 and 18 is 6.
histogram
A histogram is a graphical representation of frequencies of a numerical variable using rectangles. For a histogram, the horizontal axis is divided into intervals. Each interval forms the base of a rectangle whose height corresponds to the frequency of values of the variable in that interval.
Example: A histogram of quiz scores of a class of 16 students:
5
4
3
2
1
Num
ber
Stu
dent
s
Scores < 4 4 5 6 7 8 9 10 .
improper fraction
An improper fraction is a fraction of the form mn
, where m ≥ n and n > 0.
Example: The fractions 32
, 174
, 99
and 3216
are improper fractions.
inequality
An inequality is a mathematical statement that asserts the relative size or order of two objects. When the expressions involve variables, a solution to the inequality consists of values for the variables which, when substituted, make the inequality true. Example: 5 > 3 is an inequality. Example: x + 3 > 4 is an inequality. Its solution (which is also an inequality) is x > 1.

Resource Guide: Part 1 Word Bank
MathLinks: Grade 6 (Resource Guide: Part 1) 10
interquartile range
The interquartile range (IQR) of a numerical data set is the distance between the first and third quartiles of the data set. The interquartile range is a measure of the variation of the data set.
Example: For the data set {1, 3, 6, 7, 10, 12, 14, 15, 22, 120}, the
first quartile is Q1 = 6, the third quartile is Q3 = 15, and the interquartile range is IQR = Q3 – Q1 = 15 – 6 = 9.
least common denominator
The least common denominator of two fractions is the least common multiple of their denominators.
Example: The least common denominator of 14
and 23
is 12.
least common multiple
The least common multiple (LCM) of two numbers is the least number that is a multiple of both numbers.
Example: The multiples of 8 are 8, 16, 24, 32, 40, ... . The multiples of 12 are 12, 24, 36, 48, … . Therefore the LCM of 8 and 12 is 24.
linear model for fractions
A linear model for fractions represents fractions as points on a number line.
Example: This is 34
on a number line.
line plot
A line plot is a graphical representation of a data set where the data values are represented by marks, such as dots or Х’s, above a number line. See dot plot.
mean
The mean of a data set is the average of the values in the data set. The mean is calculated by adding the values in the data set and dividing by the number of data values.
Example: To find the mean of the data set {1, 1, 1, 3, 5, 5, 6, 7, 23}, (1) first find the sum of all nine values, 1 + 1 + 1 + 3 + 5 + 5 + 6 + 7 + 23 = 52, (2) then divide by the number of values,
52 9 = 79
5 = 5.77… .
04 1
4 2
4 3
4 4
4

Resource Guide: Part 1 Word Bank
MathLinks: Grade 6 (Resource Guide: Part 1) 11
mean absolute deviation
The mean absolute deviation (MAD) of a data set is the average of the distances of the values in the data set from the mean.
Example: For the data set {3, 3, 5, 6, 6}, the mean is 4.6. The distances of the data points to the mean are 1.6, 1.6, 0.4, 1.4, and 1.4. The MAD is
1.6 + 1.6 + 0.4 + 1.4 + 1.4
= 1.285
measure of center
A measure of center is a statistic describing the middle of a data set. The mean, the median, and the mode are three commonly used measures of center of a numerical data set.
Example: For the data set {3, 3, 5, 6, 6}, the mean (average) is (3 + 3 + 5 + 6 + 6)
5= 4.6, and the median is 5. There are
two modes, 3 and 6. Each of these numbers can be viewed as the “center” of the data set in some way.
measure of spread
A measure of spread is a statistic describing the variability of a data set. It describes how far the values in a data set are from the mean. The standard deviation, the mean absolute deviation (MAD), and the interquartile range (IQR) are three measures of spread of a numerical data set.
measure-out division problem
In a measure-out division problem, a total quantity and a group size are known, and the number of groups among which the quantity is to be distributed is unknown. See quotative division.
Example: If 18 plums are to be packed 6 to a bag, how many bags are needed? In other words, how many groups of 6 are in 18? 3 bags.
median The median of a data set is the middle number in the data set, when the values are placed in order from least to greatest. If there is an even number of values in the data set, the median is taken to be the mean (average) of the two middle values.
Example: The median of the data set {1, 1, 1, 3, 5, 5, 6, 7, 23} is 5, since the first 5 is the middle value.
Example: The median of the data set {5, 6, 7, 23} is the mean
(average) of the two middle numbers, (6 + 7) 2 = 6.5.

Resource Guide: Part 1 Word Bank
MathLinks: Grade 6 (Resource Guide: Part 1) 12
minuend
A minuend is the number from which another is subtracted. See difference. Example: In 12 – 4 = 8, the minuend is 12.
mixed number A mixed number is an expression of the form n pq
, which is a shorthand
for n + pq
, where n, p, and q are positive whole numbers.
Example: The mixed number 4 14
(“four and one fourth”) is
shorthand for 4 + 14
. It should not be confused with the
product 4 14
= 1.
mode
The mode of a data set is the value (or values) that occurs most often. A data set may have more than one mode.
Example: The mode of the data set {1, 1, 1, 3, 5, 6, 6, 7, 23} is 1,
since the data value 1 occurs more frequently than any other data value.
multiple A multiple of a number m is a number of the form k m for any integer k.
Example: The numbers 5, 10, 15, and 20 are multiples of 5, since 1 5 = 5, 2 5 = 10, 3 5 = 15, and 4 5 = 20.
multiplicative identity property
The multiplicative identity property states that a 1 = 1 a = a for all numbers a. In other words, 1 is a multiplicative identity. The multiplicative identity property is sometimes called the multiplication property of 1.
Example: 4 1 = 4, 1 (-5) = -5.
multiplicative inverse
For b ≠ 0, the multiplicative inverse of b is the number, denoted by 1b
,
that satisfies 1 = 1b
b . The multiplicative inverse of b is also called
the reciprocal of b.
Example: The multiplicative inverse of 4 is 14
, since 14
4 = 1 .

Resource Guide: Part 1 Word Bank
MathLinks: Grade 6 (Resource Guide: Part 1) 13
multiplicative inverse property
The multiplicative inverse property states that 1 1 = = 1
a aa a for
every number a ≠ 0. See multiplicative inverse.
Example: 1 1
25 2525 = 25 = 1
natural numbers
The natural numbers are the numbers 1, 2, 3, … . Natural numbers are also referred to as counting numbers.
numerator The numerator of the fraction ab
is a.
Example: The numerator of 37
is 3.
order of operations
An order of operations is a convention, or set of rules, that specifies in what order to perform the operations in an expression. The standard order of operations is as follows:
1. Do the operations in parentheses first. (Use rules 2-4 inside the parentheses.)
2. Calculate all the expressions with exponents. 3. Multiply and divide in order from left to right. 4. Add and subtract in order from left to right.
In particular, multiplications and divisions are carried out before additions and subtractions.
Example:
2 2 23 + (6 2 1) 3 + (12 1) 3 + (11) 9 + (11) 20= = = = = 4
5 5 5 5 5
outlier An outlier of a data set is a data value that is a striking deviation from the overall pattern of values in the data set.
Example: For the data set {1, 1, 1, 3, 5, 6, 6, 7, 23}, the data value
23 is a potential outlier. It appears unusually large relative to the other data values.
partitive division
Partitive division, or fair-share division, involves partitioning a set of size a into b groups of equal size. The size c of each group formed is the quotient of a and b, c = a ÷ b. See fair-share division problem.
perfect square See square number.

Resource Guide: Part 1 Word Bank
MathLinks: Grade 6 (Resource Guide: Part 1) 14
percent
A percent is a number expressed in terms of the unit 1% = 1
100.
To convert a positive number to a percent, multiply the number by 100. To convert a percent to a number, divide the percent by 100.
Example: Fifteen percent = 15% = 15100
= 0.15.
Example: 4 = 4 × 100% = 400%.
perimeter The perimeter of a plane figure is the length of the boundary of the figure.
Example: The perimeter of a square is four times its side-length. The perimeter of a rectangle is twice the length plus twice the width. The perimeter of a circular disc is its circumference, which is times its diameter.
place value number system
A place value number system is a positional number system in which the value of a digit in a number is determined by its location or place.
Example: In the number 7,863.21, the 8 is in the hundreds place and represents 800. The 1 is in the hundredths place and represents 0.01.
ten
mill
ions
mill
ions
hund
red
thou
sand
s
ten
thou
sand
s
thou
sand
s
hund
reds
tens
ones
tent
hs
hund
redt
hs
thou
sand
ths
ten
thou
sand
ths
.
prime factorization
The prime factorization of a number is an expression of that number as a product of primes. There is a unique way to express any number as a product of primes, except for order.
Example: 40 = 2 2 2 5 = 23 5 40 = 2 5 2 2 = 23 5
The two prime factorization trees above illustrate that even though the order of the prime factors is different, the products are the same.
40
4 10
2 2 2 5
5
40
20 2
4
2 2

Resource Guide: Part 1 Word Bank
MathLinks: Grade 6 (Resource Guide: Part 1) 15
prime number
A prime number is a natural number that has exactly two factors, namely 1 and itself.
Example: The first six prime numbers are 2, 3, 5, 7, 11, and 13. Example: 1 is not a prime number It has exactly one factor.
probability The probability of an event is a measure of the likelihood of that event occurring. The probability P(E) of the event E occurring satisfies 0 ≤ P(E) ≤ 1. If the event E is certain to occur, then P(E) = 1. If the event E is impossible, then P(E) = 0.
Example: When flipping a coin, the probability that it will land on
heads is 12
= 0.5 = 50%.
product A product is the result of multiplying two or more numbers or expressions. The numbers or expressions being multiplied to form the product are factors of the product.
Example: The product of 7 and 8 is 56, written 7 8 = 56. The numbers 7 and 8 are both factors of 56.
proper fraction A proper fraction is a fraction of the form mn
, where 1 m < n.
Example: The fractions 12
and 56
are proper fractions.

Resource Guide: Part 1 Word Bank
MathLinks: Grade 6 (Resource Guide: Part 1) 16
quartiles
The quartiles of a data set are points that divide the data set into four equally sized groups, when the values are placed in order from least to greatest. The second quartile is the median, denoted by M or Q2. The first quartile, denoted by Q1, is the median of the lower half of the data set (the data values less than the middle data value), and the third quartile, denoted by Q3, is the median of the upper half of the data set.
Example: Given the ordered data set {1, 1, 1, 3, 5, 5, 6, 7, 23}, The middle value is the first 5: Median = 5. The lower half of the data set is {1, 1, 1, 3}. The first quartile (Q1) is the median of the lower half:
Q1 = 1. The upper half of the data set is {5, 6, 7, 23}. The third quartile (Q3) is the median of the upper half:
Q3 = 6.5. The second quartile (Q2) of the data set is the median:
Q2 = 5.
Q1 = 10 Q2 = 50 Q3 = 6.5
1, 1, 1, 3, 5, 5, 6, 7, 23
lower half median upper half
quotative division
Quotative division, or measure-out division, involves taking a set of size a and forming groups of size b. The size c of each group formed is the quotient of a and b, c = a ÷ b. See measure-out division problem.
quotient In a division problem, the quotient is the result of the division. See division.
Example: In 12 3 = 4, the quotient is 4.
range of a data set
The range of a numerical data set is the difference between the greatest and least values in the data set.
Example: The range of the data set {1, 1, 1, 3, 5, 5, 6, 7, 23} is 22, since 22 = 23 – 1.
reciprocal The reciprocal of a nonzero number is its multiplicative inverse. See multiplicative inverse.
Example: The reciprocal of 3 is 13
. The reciprocal of 45
is 54
.

Resource Guide: Part 1 Word Bank
MathLinks: Grade 6 (Resource Guide: Part 1) 17
relatively prime
Two numbers are relatively prime if their greatest common factor is 1.
Example: The factors of 6 are 1, 2, 3, and 6. The factors of 11 are 1 and 11. Since the greatest common factor of 6 and 11 is 1, the two numbers are relatively prime.
remainder See division with remainder.
set model for fractions
A set model for fractions represents a fraction as a ratio of number of elements of a subset to number of elements of a set. The number of elements in the subset is the numerator of the fraction, and the number of elements in the entire set is the denominator of the fraction.
Example: In a bag containing 2 red cubes and 5 green cubes, 27
of the cubes are red, and 57
are green.
simplify Simplify refers to converting an expression to a simpler form. A fraction might be simplified by dividing the numerator and denominator by a common divisor.
Example: 8 8 4 2
= = 12 12 4 3
square number
A square number, or perfect square, is a number that is a square of a natural number.
Example: The area of a square with integral side-length is a square number. The square numbers are 1 = 12,
4 = 22, 9 = 32, 16 = 42, 25 = 52, … .
standard form of a number
The standard form of a number is the usual expression for the number, with one digit for each place value. Example: In standard form, four thousand nine is written 4,009.
subtrahend In a subtraction problem, the subtrahend is the number that is being subtracted from another. See difference. Example: In 12 – 4 = 8, the subtrahend is 4.
Resource Guide: Part 1 Word Bank
MathLinks: Grade 6 (Resource Guide: Part 1) 18
sum A sum is the result of addition. In an addition problem, the numbers to be added are addends. Example: 7 + 5 = 12 addend addend sum
Example: In 3 + 4 + 6 = 13, the addends are 3, 4, and 6, and the sum is 13.
unit fraction A unit fraction is a fraction of the form 1m
, where m is a natural number.
Example: The unit fractions are 1 1 1 1 11 2 3 4 5, , , , … .
whole numbers
The whole numbers are the natural numbers together with 0. They are the numbers 0, 1, 2, 3, … .
Resource Guide: Part 1 Mathematical Symbols and Language
MathLinks: Grade 6 (Resource Guide: Part 1) 19
MATHEMATICAL SYMBOLS AND LANGUAGE
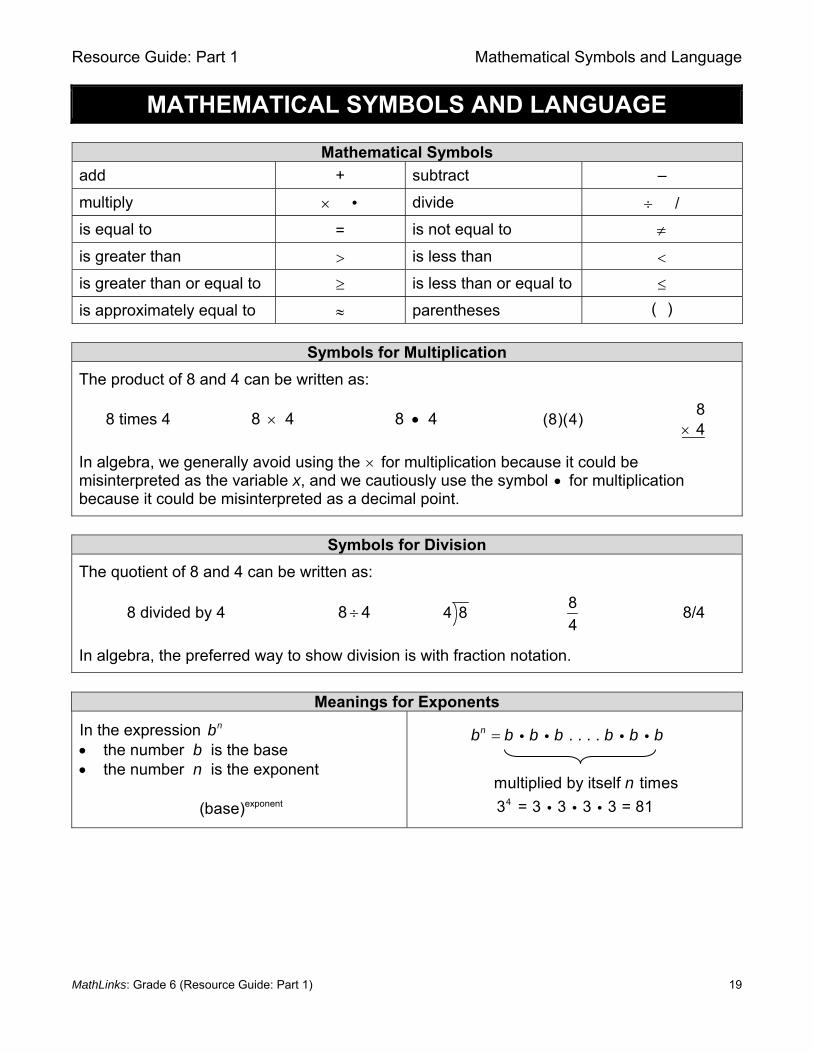
Mathematical Symbols
add + subtract –
multiply • divide /
is equal to = is not equal to
is greater than is less than
is greater than or equal to is less than or equal to
is approximately equal to parentheses ( )
Symbols for Multiplication
The product of 8 and 4 can be written as:
8 times 4 8 4 8 4 (8)(4) 84
In algebra, we generally avoid using the for multiplication because it could be misinterpreted as the variable x, and we cautiously use the symbol for multiplication because it could be misinterpreted as a decimal point.
Symbols for Division
The quotient of 8 and 4 can be written as:
8 divided by 4 8 4 4 8 8
4 8/4
In algebra, the preferred way to show division is with fraction notation.
Meanings for Exponents
In the expression nb the number b is the base the number n is the exponent
exponent(base)
. . . .
multiplied by itself times
nb b b b b b b
n
43 = 3 3 3 3 = 81
Resource Guide: Part 1 Mathematical Properties
MathLinks: Grade 6 (Resource Guide: Part 1) 20
MATHEMATICAL PROPERTIES
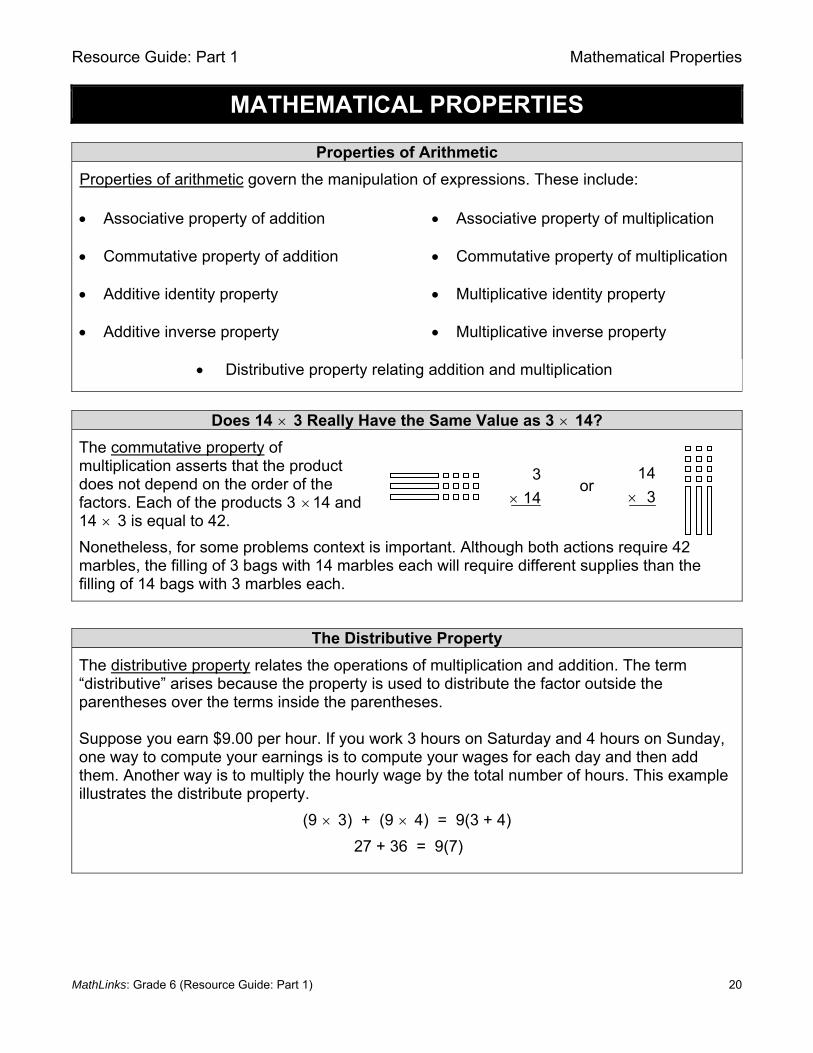
Properties of Arithmetic
Properties of arithmetic govern the manipulation of expressions. These include: Associative property of addition Commutative property of addition Additive identity property Additive inverse property
Associative property of multiplication Commutative property of multiplication Multiplicative identity property Multiplicative inverse property
Distributive property relating addition and multiplication
Does 14 3 Really Have the Same Value as 3 14?
The commutative property of multiplication asserts that the product does not depend on the order of the factors. Each of the products 3 14 and 14 3 is equal to 42.
Nonetheless, for some problems context is important. Although both actions require 42 marbles, the filling of 3 bags with 14 marbles each will require different supplies than the filling of 14 bags with 3 marbles each.
The Distributive Property
The distributive property relates the operations of multiplication and addition. The term “distributive” arises because the property is used to distribute the factor outside the parentheses over the terms inside the parentheses. Suppose you earn $9.00 per hour. If you work 3 hours on Saturday and 4 hours on Sunday, one way to compute your earnings is to compute your wages for each day and then add them. Another way is to multiply the hourly wage by the total number of hours. This example illustrates the distribute property.
(9 3) + (9 4) = 9(3 + 4)
27 + 36 = 9(7)
14
3
3
14 or

Resource Guide: Part 1 Whole Numbers: Multiplication and Division
MathLinks: Grade 6 (Resource Guide: Part 1) 21
WHOLE NUMBERS: MULTIPLICATION AND DIVISION
Expanded Forms of Numbers Standard
Form Expanded Form #1
Expanded Form #2
Expanded Form #3
25 20 5 2(10) 5(1) 2(101) 5(100)
302 300 2 3(100) 0(10) 2(1) 3(102) 0(101) 2(100)
Multiplication Strategies
Skip Count Double Halve Add On Take Away
3 6 9 12 15
3 7 = 21,
so
6 7 = 42
7 6 = 42
6 10 = 60,
so
6 5 = 30
5 6 = 30
6 3 = 18
Think 19, 20, 21 so
7 3 = 21
3 7 = 21
10 3 = 30
30 – 3 = 27 so
9 3 = 27
3 9 = 27
Multiplication Strategies (12 x 13)
Traditional Algorithm 1
12 1336
120156
Traditional Algorithm 2
12 13
6 = 2 330 = 10 320 = 10 2
100 = 10 10156
Area Model
1002030 6
156
10
10
2
3
+100 30
20 6
+

Resource Guide: Part 1 Whole Numbers: Multiplication and Division
MathLinks: Grade 6 (Resource Guide: Part 1) 22
The Standard Division Algorithm
The standard division algorithm is an efficient process for dividing. It involves a cyclical process: divide, multiply, subtract, “bring down”… until the remainder is less than the divisor.
1 4 9 6 3 Determine
where to start
Look at the divisor. Choose digits in the dividend so that the quotient using these digits is between 1 and 9.
1 4 9 6 3 Divide How many 14s in 96? _____ Write this number above the 96.
61 4 9 6 3
8 4 Multiply
Find the product of 6 and 14. Write this below the 96.
61 4 9 6 3
8 41 2
Subtract
Find the difference between 96 and 84. Write this below the 84.
61 4 9 6 3
8 41 2 3
Bring down Bring down the next digit.
6 81 4 9 6 3
8 41 2 31 1 2
11 1
Divide
Multiply
Subtract
Bring down (remainder)
Repeat the divide, multiply, subtract, bring down (if necessary) process until the remainder is less than the divisor.
Some ways to represent the dividend, divisor, quotient, and remainder:
quotient remainder
divisor dividend dividend = (divisor)(quotient) + remainder
6 8 R 111 4 9 6 3
1114
6 8
1 4 9 6 3 9 6 3 = (1 4)(6 8) + 11

Resource Guide: Part 1 Whole Numbers: Multiplication and Division
MathLinks: Grade 6 (Resource Guide: Part 1) 23
A Chunking Division Procedure
This chunking division procedure keeps the dividend intact as we “close in” on the quotient. If you do not know all your multiplication facts, this procedure may be easier than the standard division algorithm because you subtract out groups of the divisor more flexibly, but still arrive at the correct quotient. If the largest amount possible is chosen to subtract at each step, this procedure is very efficient. Divide 761 highlighters into 3 boxes. Step 1. Rewrite problem
3 761
Step 2: Make a toolkit of multiplication facts that may be useful for this problem.
3 1 = 3 3 10 = 30 3 100 = 300 3 2 = 6 3 20 = 60 3 200 = 600 3 3 = 9 3 30 = 90 3 300 = 900 3 4 = 12 3 40 = 120 3 400 = 1,200
Step 3: Select a fact from the toolkit that is less than or equal to the dividend, and record.
3 761
600 200161
Repeat Step 3: Continue the routine until the remainder is less than the divisor.
3 761
600 200161
120 4041
3 761
600 200161120 4041
30 1011
253 R 2
3 761
600 200161120 4041
30 1011
9 3253
The last calculation shows that the quotient is (200 + 40 + 10 + 3) = 253, and the remainder is 2.

Resource Guide: Part 1 Factors and Multiples
MathLinks: Grade 6 (Resource Guide: Part 1) 24
FACTORS AND MULTIPLES
Using Rectangles to Visualize Prime and Composite Numbers
Building rectangles whose sides have whole number lengths is a geometric way to describe factors and multiples of numbers. If the area of the rectangle represents the product, then the side lengths of the rectangle represent the factors of the number. A prime number p corresponds to only one rectangle, since p can be factored as a product in only one way, p = 1 p. (Here we regard the factorization p = 1 p as the same as p = p 1, and we regard a 1 p rectangle as being the same as a p 1 rectangle.) A composite number n always corresponds to more than one rectangle. A number such as 16 is called a square number (or perfect square) because one of the rectangles it corresponds to is a square (4 4).
Why is 1 Neither Prime nor Composite?
Euclid (about 300 BC) included “1” in the definition of a prime number. However, the number had to be treated as a special case in so many theorems that, by the time of Gauss (about 1800 AD), the definition was changed to exclude it. There are many definitions in mathematics that have changed over time. Originally, the definition of “rectangles” did not include “squares,” but it has become standard to include square as a subset of the rectangle family because it makes many properties easier to explain.
4
4
15
5 = 1 5 1 and 5 are factors of 5.
7
21 14
14 = 1 14 14 = 2 7 1, 2, 7, and 14 factors of 14.
8
2
1 16
16 = 1 16 16 = 2 8 16 = 4 4 1, 2, 4, 8, and 16 factors of 16.

Resource Guide: Part 1 Factors and Multiples
MathLinks: Grade 6 (Resource Guide: Part 1) 25
Factor Trees
A factor tree is a useful tool for organizing and recording the factors of a number. There may be different ways to make a factor tree for a given number, but the end result (prime factorization) will always be the same. Here are two different factor trees to illustrate that the prime factorization of 36 is 22 32. The factorization 36 = 22 32 is unique, except for the order of the factors.
Some Divisibility Rules
A number is divisible by…
2 if the ones digit is 0, 2, 4, 6, or 8.
3 if the sum of the digits is divisible by 3.
4 if the number represented by the last two digits is divisible by 4, or divide by 2 and then check for divisibility by 2.
5 if the ones digit is 0 or 5.
6 if it is divisible by both 2 and 3.
7 if the number formed by subtracting twice the last digit from the number formed by all digits except the last is divisible by 7.
8 if the number represented by the last three digits is divisible by 8, or divide by 2 and check for divisibility by 4.
9 if the sum of the digits is divisible by 9.
10 if the ones digit is 0.
2 3
6
36
182
3
36
3 3
9 4
2 2

Resource Guide: Part 1 GCF and LCM
MathLinks: Grade 6 (Resource Guide: Part 1) 26
GCF AND LCM
Greatest Common Factor (GCF)
The greatest common factor (GCF) of two numbers is the greatest factor that divides the two numbers. Here are three different ways to find the GCF of two numbers. Tensaye has 12 bottles of water and 18 granola bars. She wants to use them to make care packages for the homeless. How many care packages can Tensaye make so that there are the same number of bottles of water and granola bars in each package? Method 1: Use a list to find the GCF of 12 and 18 List all the factors of 12: 1, 2, 3, 4, 6, and 12.
List all the factors of 18: 1, 2, 3, 6, 9, and 18. We can see that the factors 1, 2, 3, and 6 appear in both lists. Since 6 is the greatest factor from both lists that divides 12 and 18, the greatest common factor (GCF) of 12 and 18 is 6. Method 2: Use a Venn Diagram to find the GCF of 12 and 18 Write each number as a product of primes.
12 = 2 2 3 and 18 = 2 3 3 Write all the prime factors of 12 and 18 in a Venn Diagram, including overlapping factors. The product of the prime factors in the overlap is 6, so the GCF of 12 and 18 is 6. Method 3: Use “repeated division” to find the GCF of 12 and 18 Divide each number by any common factor greater than 1. In this case, we can begin by dividing both numbers by 2. The resulting quotients are 6 and 9. Keep dividing until both resulting quotients have no factors in common greater than 1. In this case, we can still divide by 3. The resulting quotients are now 2 and 3, and they have no common factors greater than 1. The GCF is the product of the factors along the side. Therefore, the GCF of 12 and 18 is 6. Since the GCF of 12 and 18 is 6, Tensaye can make 6 care packages for the homeless.
2
6 9
12 18
2
6 9
12 18
2 3
3
12 18
2 3 32

Resource Guide: Part 1 GCF and LCM
MathLinks: Grade 6 (Resource Guide: Part 1) 27
Least Common Multiple (LCM)
The least common multiple (LCM) of two numbers is the least number that is a positive multiple of both numbers. Here are three different ways to find the LCM of two numbers. Tensaye wants buy bottles of water and granola bars to make care packages for the homeless. Bottle of water come in packages of 12, and granola bars are sold in packages of 18. How many bottles of water and how many granola bars should Tensaye buy so that she has the same number of each item? Method 1: Use a list to find the LCM of 12 and 18 The multiples of 18 are: 18, 36, 54, 72, 90, 108, 126, 144, 162, 180, ... .
The multiples of 12 are: 12, 24, 36, 48, 60, 72, 84, 96, 108, 120,… . The multiples that 12 and 18 have in common are 36, 72, 108, ... . We can see that 36 is the least multiple the two numbers have in common. Therefore, the LCM of 12 and 18 is 36. Method 2: Use a Venn Diagram to find the LCM of 12 and 18 Write each number as a product of primes.
12 = 2 2 3 and 18 = 2 3 3 Write all the prime factors of 12 and 18 in a Venn Diagram, including overlapping factors. The product of all the prime factors in the diagram is 36, so the LCM of 12 and 18 is 36. Method 3: Use “repeated division” to find the LCM of 12 and 18 Divide each number by any common factor greater than 1. In this case, we can begin by dividing both numbers by 2. The resulting quotients are 6 and 9. Keep dividing until both resulting quotients have no factors in common greater than 1. In this case, we can still divide by 3. The resulting quotients are now 2 and 3, and they have no common factors greater than 1. The LCM is the product of the factors along the side and the bottom. Therefore, the LCM of 12 and 18 is 36. Since the LCM of 12 and 18 is 36, Tensaye should buy 36 bottles (or 3 packages) of water and 36 granola bars (or 2 packages) so that she has the same number of each item.
2
6 9
12 18
2
6 9
12 18
2 3
3
12 18
2 3 32
Resource Guide: Part 1 Order of Operations
MathLinks: Grade 6 (Resource Guide: Part 1) 28
ORDER OF OPERATIONS
Order of Operations
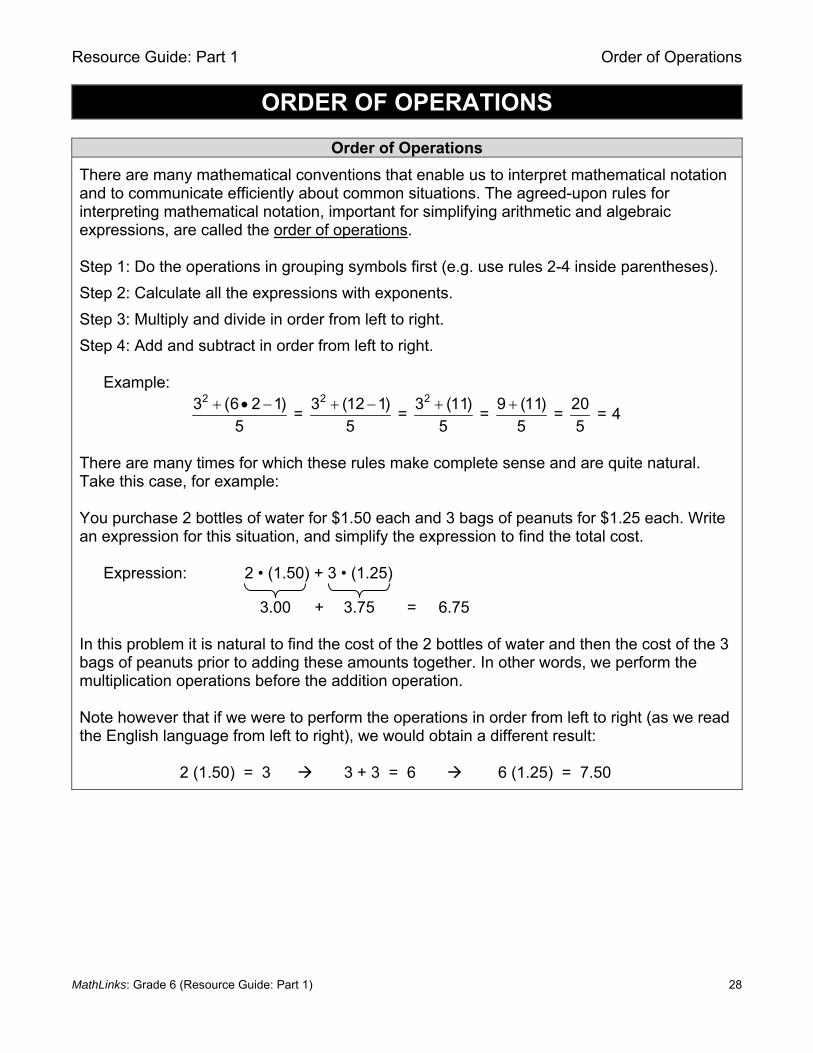
There are many mathematical conventions that enable us to interpret mathematical notation and to communicate efficiently about common situations. The agreed-upon rules for interpreting mathematical notation, important for simplifying arithmetic and algebraic expressions, are called the order of operations. Step 1: Do the operations in grouping symbols first (e.g. use rules 2-4 inside parentheses).
Step 2: Calculate all the expressions with exponents.
Step 3: Multiply and divide in order from left to right.
Step 4: Add and subtract in order from left to right.
Example: 2 2 23 (6 2 1) 3 (12 1) 3 (11) 9 (11) 20
= = = = = 45 5 5 5 5
There are many times for which these rules make complete sense and are quite natural. Take this case, for example: You purchase 2 bottles of water for $1.50 each and 3 bags of peanuts for $1.25 each. Write an expression for this situation, and simplify the expression to find the total cost.
Expression: 2 • (1.50) + 3 • (1.25)
3.00 + 3.75 = 6.75 In this problem it is natural to find the cost of the 2 bottles of water and then the cost of the 3 bags of peanuts prior to adding these amounts together. In other words, we perform the multiplication operations before the addition operation. Note however that if we were to perform the operations in order from left to right (as we read the English language from left to right), we would obtain a different result: 2 (1.50) = 3 3 + 3 = 6 6 (1.25) = 7.50
Resource Guide: Part 1 Order of Operations
MathLinks: Grade 6 (Resource Guide: Part 1) 29
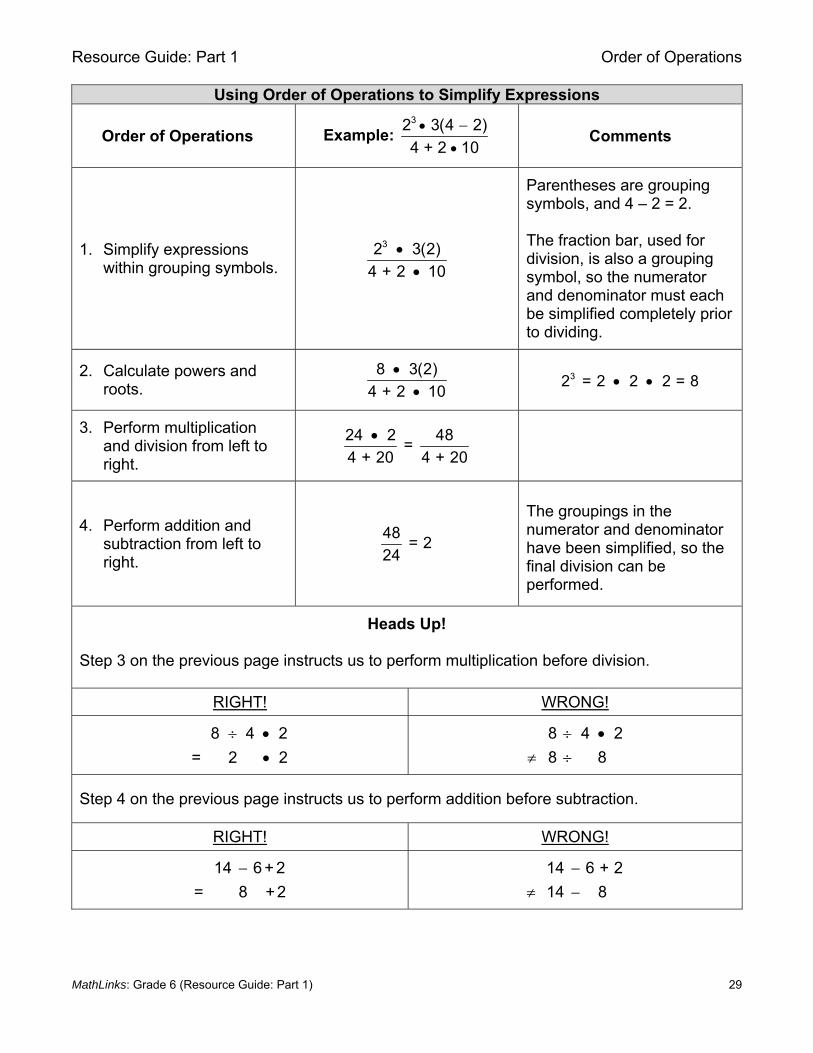
Using Order of Operations to Simplify Expressions
Order of Operations Example: 32 3(4 2)
4 + 2 10
Comments
1. Simplify expressions within grouping symbols.
3 2 3(2)
4 + 2 10
Parentheses are grouping symbols, and 4 – 2 = 2. The fraction bar, used for division, is also a grouping symbol, so the numerator and denominator must each be simplified completely prior to dividing.
2. Calculate powers and roots.
8 3(2)
4 + 2 10
32 = 2 2 2 = 8
3. Perform multiplication and division from left to right.
24 2 48 =
4 + 20 4 + 20
4. Perform addition and subtraction from left to right.
48= 2
24
The groupings in the numerator and denominator have been simplified, so the final division can be performed.
Heads Up!
Step 3 on the previous page instructs us to perform multiplication before division.
RIGHT! WRONG!
8 4 2
= 2 2
8 4 2
8 8
Step 4 on the previous page instructs us to perform addition before subtraction.
RIGHT! WRONG!
14 6 + 2
= 8 +2
14 6 + 2
14 8
Resource Guide: Part 1 Models for Fractions
MathLinks: Grade 6 (Resource Guide: Part 1) 30
MODELS FOR FRACTIONS
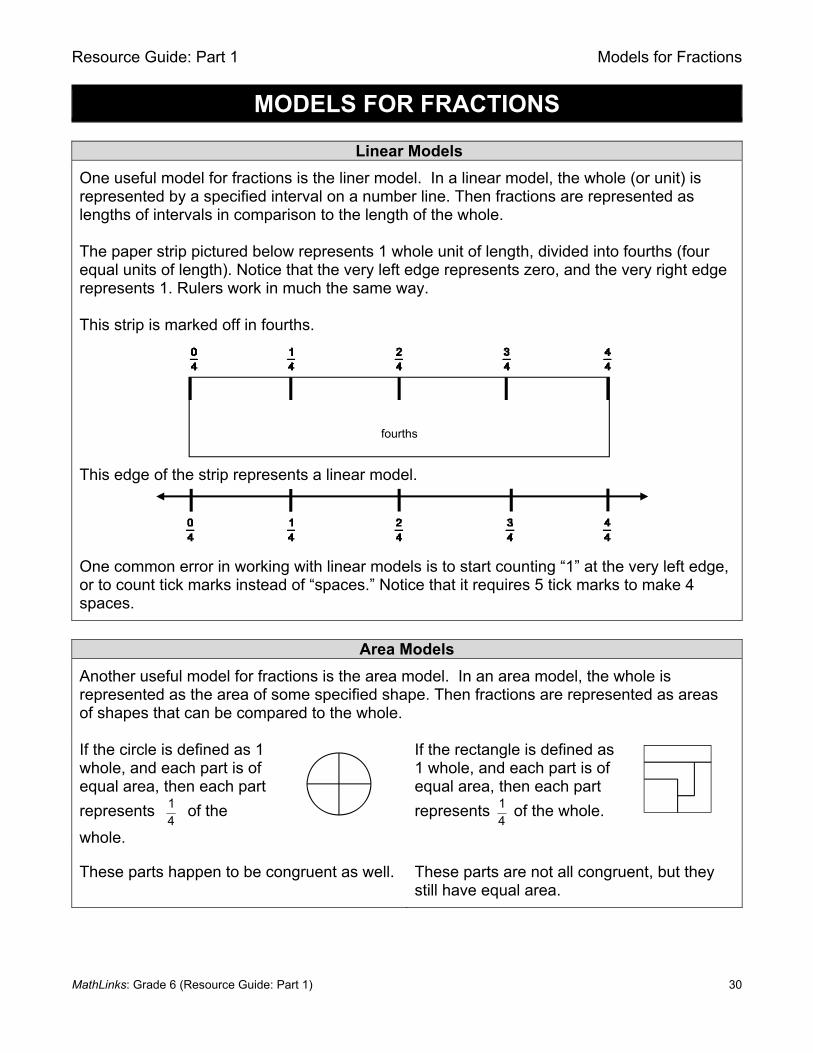
Linear Models
One useful model for fractions is the liner model. In a linear model, the whole (or unit) is represented by a specified interval on a number line. Then fractions are represented as lengths of intervals in comparison to the length of the whole. The paper strip pictured below represents 1 whole unit of length, divided into fourths (four equal units of length). Notice that the very left edge represents zero, and the very right edge represents 1. Rulers work in much the same way. This strip is marked off in fourths. This edge of the strip represents a linear model. One common error in working with linear models is to start counting “1” at the very left edge, or to count tick marks instead of “spaces.” Notice that it requires 5 tick marks to make 4 spaces.
Area Models
Another useful model for fractions is the area model. In an area model, the whole is represented as the area of some specified shape. Then fractions are represented as areas of shapes that can be compared to the whole. If the circle is defined as 1 whole, and each part is of equal area, then each part
represents 14
of the
whole.
If the rectangle is defined as 1 whole, and each part is of equal area, then each part
represents 14
of the whole.
These parts happen to be congruent as well. These parts are not all congruent, but they still have equal area.
fourths
Resource Guide: Part 1 Models for Fractions
MathLinks: Grade 6 (Resource Guide: Part 1) 31
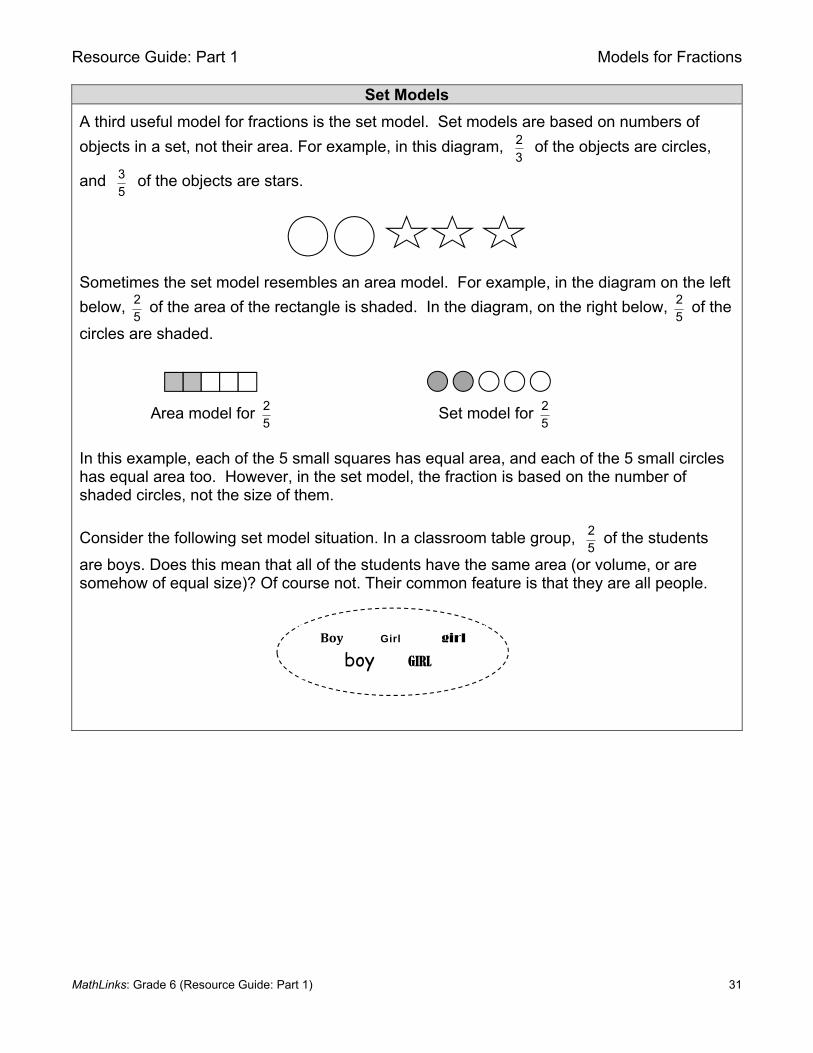
Set Models
A third useful model for fractions is the set model. Set models are based on numbers of
objects in a set, not their area. For example, in this diagram, 23
of the objects are circles,
and 35
of the objects are stars.
Sometimes the set model resembles an area model. For example, in the diagram on the left
below, 25
of the area of the rectangle is shaded. In the diagram, on the right below, 25
of the
circles are shaded.
Area model for 25
Set model for 25
In this example, each of the 5 small squares has equal area, and each of the 5 small circles has equal area too. However, in the set model, the fraction is based on the number of shaded circles, not the size of them.
Consider the following set model situation. In a classroom table group, 25
of the students
are boys. Does this mean that all of the students have the same area (or volume, or are somehow of equal size)? Of course not. Their common feature is that they are all people.
Boy Girl girl
boy GIRL

Resource Guide: Part 1 Fraction Ordering and Equivalence
MathLinks: Grade 6 (Resource Guide: Part 1) 32
FRACTION ORDERING AND EQUIVALENCE
Sense-Making Strategies for Comparing and Ordering Fractions
Examples Name Ordering Strategy
1 1 3
3 2 4 Benchmark
fractions
Benchmark fractions are fractions that are
easily recognizable, such as 12
. For example,
3 1
8 2 , because 3 is less than half of 8.
1 1 1
8 5 4
Unit fractions
When comparing unit fractions, the fraction with the greater denominator has a smaller value. Think: “When you are very hungry, do you want to share a pizza equally among 8 friends or 4 friends? In which situation do you get more pizza?”
3 3 3
8 5 4
Fractions with common numerators
When comparing fractions with common numerators, the fraction with the greater denominator has a smaller value. Using similar reasoning as above: “If ONE-fourth is greater than ONE-eighth, then THREE-fourths must be greater than THREE-eighths.”
1 3 8
12 12 12
Fractions with common denominators
When comparing fractions with common denominators, the fraction with the greater numerator has a greater value. Think: “A pizza is divided into 8 equal parts. If you eat 1 slice and your friend eats 3 slices, who ate more pizza?”
3 4 7
4 5 8 1 minus a unit
fraction
All of these are less than 1 whole by a unit
fraction (Think of it as the “missing piece.”) 78
has a smaller piece missing ( 18
); 34
has a larger
piece missing ( 14
); therefore, 7 3
8 4 .
In these comparisons, we assume that all fractions in each example refer to the same whole. This is important
because 12
of the circle to the right has a greater area
than 910
of the square to the right.

Resource Guide: Part 1 Fraction Ordering and Equivalence
MathLinks: Grade 6 (Resource Guide: Part 1) 33
The Big One
The “big 1” is a notation for 1 in the form of a fraction n
n (n ≠ 0). For example,
1 = 11
= 2
2 = = = = …
We can use the following picture to help remind us that these fractions are equivalent to 1:
1 = 88
The “big 1” can be used to show equivalence of fractions. For example,
2 10 20
5 10 50 =
or 20 10 2
50 10 5 = .
Why Can’t You Divide by Zero?
Strategy 1
Consider the fact 6 ÷ 2 = 3 or 3
2 6 . We can convince ourselves that this is correct,
because we know that 2 3 = 6.
Now consider 6 ÷ 0 = ? or ?
0 6 . What can be multiplied by 0 to get a result of 6? Nothing!
Strategy 2
Division can be thought of as repeated subtraction.
Consider the same fact 6 ÷ 2 = 3 or 3
2 6 .
Rewrite the division statement as follows:
2 6
2
4
2
2
2
0
Now consider 6 ÷ 0 = ? or ?
0 6 .
Rewrite the division statement as follows:
etc.
0 6
0
6
0
6
0
6
We conclude that division by zero cannot be performed, and we say that it is undefined.
3
344
55
We count that there are 3 subtractions of 2 from 6, and then there is nothing remaining to subtract. Done!
We see that this process will never end!

Resource Guide: Part 1 Fraction Ordering and Equivalence
MathLinks: Grade 6 (Resource Guide: Part 1) 34
“Splitting Diagrams” and Equivalent Fractions
A “splitting a diagram” illustrates equivalent fractions. For example, to show that 1 4=
2 8, we
split the first diagram into eight equal parts to get the second diagram.
Using the “big 1,” this equivalence can be written:
1 4 4 = .
2 4 8
In a “splitting a diagram,” the size of the whole does not change.
“Replicating Diagrams” and Equivalent Fractions
“Replicating patterns” visually illustrate equivalent fractions that have the same fractional
amount shaded. For example, to show that 3 1520 100
= we replicate this 20-square pattern to
obtain a 100-square grid. Using the “big 1,” this equivalence can be written:
3 5 15 = .
20 5 100
Visually, multiplying the numerator by 5 represents replicating the shaded parts five times, and multiplying the denominator by 5 represents replicating the number of parts in the denominator five times. In a “replicating diagram,” the size of the part does not change.
=
Resource Guide: Part 1 Fraction Ordering and Equivalence
MathLinks: Grade 6 (Resource Guide: Part 1) 35
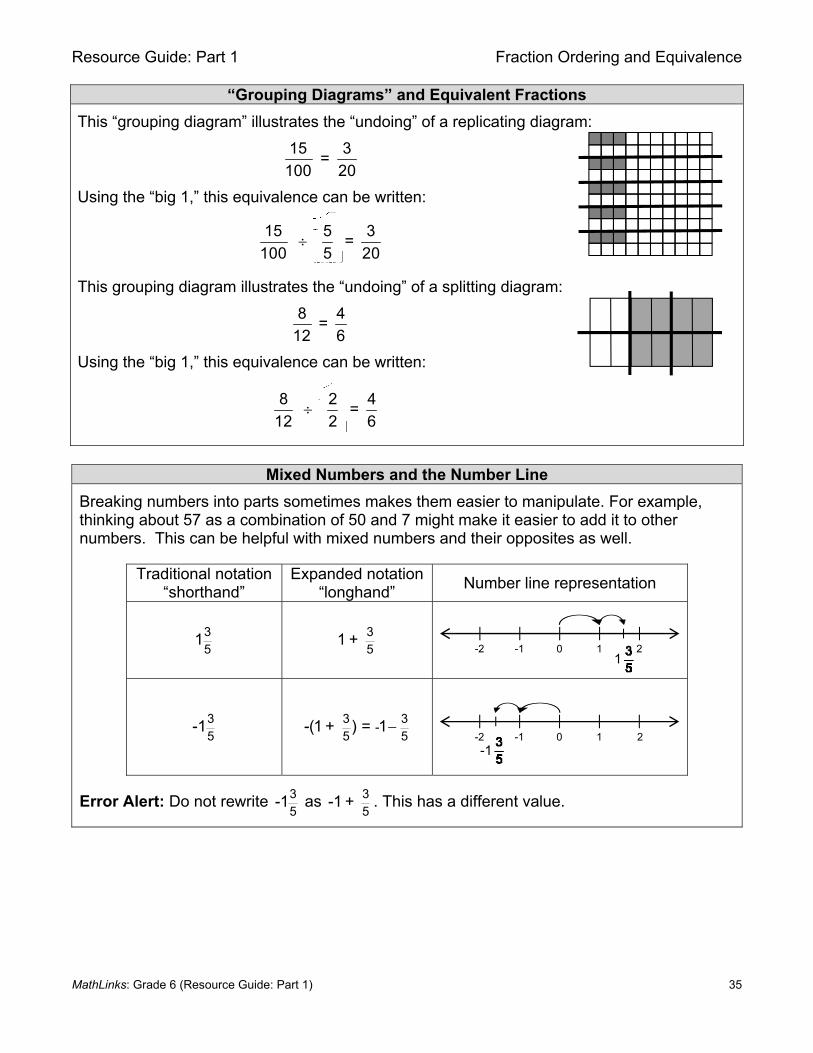
“Grouping Diagrams” and Equivalent Fractions
This “grouping diagram” illustrates the “undoing” of a replicating diagram:
15 3=
100 20
Using the “big 1,” this equivalence can be written:
15 5 3 =
100 5 20
This grouping diagram illustrates the “undoing” of a splitting diagram:
8 4 =
12 6
Using the “big 1,” this equivalence can be written:
8 2 4 =
12 2 6
Mixed Numbers and the Number Line
Breaking numbers into parts sometimes makes them easier to manipulate. For example, thinking about 57 as a combination of 50 and 7 might make it easier to add it to other numbers. This can be helpful with mixed numbers and their opposites as well.
Error Alert: Do not rewrite 35
-1 as 35
-1 + . This has a different value.
Traditional notation “shorthand”
Expanded notation“longhand”
Number line representation
35
1 35
1 +
35
-1 3 3-
5 5-(1 + ) = 1
-2 -1 0 1 2 -1
-2 -1 0 1 2 1

Resource Guide: Part 1 Fraction Ordering and Equivalence
MathLinks: Grade 6 (Resource Guide: Part 1) 36
Improper Fractions and Mixed Numbers
Improper fractions may be represented as mixed numbers and vice versa.
Example: Change 5 78
into an improper fraction.
Since 5 = 40
8, 5
7
8 =
40
8 +
7
8 =
47
8.
Here is a shortcut. Think: “5 times 8 is 40, and 40 + 7 is 47.
So 57
8 =
47
8.”
5 x 8 = 40 57
8 40 + 7 = 47
(40 eighths) (47 eighths)
Example: Change 173
into a mixed number.
Recall that 173
can be written as 17 ÷ 3
17 ÷ 3 = 5, with a remainder of 2
17
3 =
15
3 +
2
3 = 5 +
2
3 = 5
2
3
33
+ 33
+ 33
+ 33
+ 33
+ 23
= 173
1 + 1 + 1 + 1 + 1 + 23 = 2
35

Resource Guide: Part 1 Fraction Addition and Subtraction
MathLinks: Grade 6 (Resource Guide: Part 1) 37
FRACTION ADDITION AND SUBTRACTION
Fraction Addition with Diagrams
The standard procedure for adding fractions requires that the fractions have common denominators. Area and linear models support why this is reasonable.
Example 1: 1 3
+ 5 5
A linear model
Start at 15
and count forward 35
. Therefore 15
+ 35
= 45
An area model
Start with 15
. Then add 35
. Therefore 15
+ 35
= 45
Example 2: 1 1
+ 2 3
A linear model
1 3
= 2 6
1 2=
3 6
0
2 1
2 2
2 0
3 1
3 2
3 3
3
Start at 36
and count forward 26
.
3
6 +
2
6 =
5
6
An area model
1
2
1
2 =
3
6
3
6 +
2
6 =
5
6
0
6 1
6 2
6 3
6 4
6 5
6 6
6

Resource Guide: Part 1 Fraction Addition and Subtraction
MathLinks: Grade 6 (Resource Guide: Part 1) 38
Fraction Subtraction with Diagrams
The standard procedure for subtracting fractions requires that the fractions have common denominators. Area and linear models support why this is reasonable.
Example 1: 5 1
8 8
A linear model 0
8 1
8 2
8 3
8 4
8 5
8 6
8 7
8 8
8
Start with 58
. Then count back 18
. Therefore 5 1 48 8 8
.
An area model
Start with 58
. Then, remove 18
. Therefore 5 1 48 8 8
.
Example 2: 1 1
2 3
A linear model 1 3
= 2 6
1 2=
3 6
0
2 1
2 2
2 0
3 1
3 2
3 3
3
Start at 36
and count back 26
.
3
6 –
2
6 =
1
6
An area model
1
2
1
2 =
3
6
3
6 –
2
6 =
1
6

Resource Guide: Part 1 Fraction Addition and Subtraction
MathLinks: Grade 6 (Resource Guide: Part 1) 39
Adding “Friendly” Fractions
Consider this example: 1 1 2
6 2 43 4 3
1 1 2 1 1 26 + 2 + 4 = 6 + + 2 + + 4 +
3 4 3 3 4 3
1 1 2= (6 + 2 + 4) + + +
3 4 3
1 1 2= 12 + + +
3 4 3
1= 12 + 1 +
4
1= 13
4
Subtracting A Fraction From a Whole Number
Here is a simple way to subtract a fraction from a whole number, illustrated with diagrams and numbers.
Example 1: 1
15
Start with 1 whole. Then remove 1
5.
Therefore, we can see without doing any computation that 1 4
5 51 = .
Example 2: 3 1
3 = 24 4
Start with 3 whole rectangles. Divide one of them into fourths. Then remove 3
4 from one of
the rectangles.
Therefore, we can see without doing any computation that 3 1
24 4
3 = .
To make calculations simpler, add the whole numbers first.
Then look for mental math opportunities.
(In this case,
1 23 3
1 )

Resource Guide: Part 1 Fraction Addition and Subtraction
MathLinks: Grade 6 (Resource Guide: Part 1) 40
Examples: Adding Mixed Numbers Words Diagrams Mixed Numbers Improper Fractions
You have two and three-fourths waffles. Your friend has one and one-eighth waffles. How many waffles do you have together?
3 1
2 + 14 8
3 1= 2 + + 1 +
4 8
3 1= (2 + 1) + +
4 8
6 1= (3) + +
=
8 8
7= 3 +
8
7 3
8
3 1
2 + 14 8
11 9= +
4 8
22 9= +
8 8
31=
=
8
7= 3
8
Think: A common multiple of 4 and 8 is 8.
8 is a common denominator. (It is also the LCM.)
You have two and one-half waffles. Your friend has one and one-third waffles. How many waffles are there in all?
1 1
2 + 12 3
1 1= 2 + + 1 +
2 3
1 1= (2 + 1) + +
2 3
3 2= (3) + +
=
6 6
5= 3 +
6
5 3
6
1 1
2 + 12 3
5 4= +
2 3
15 8= +
6 6
23=
=
6
5= 3
6
Think: A common multiple of 2 and 3 is 6.
6 is a common denominator.

Resource Guide: Part 1 Fraction Addition and Subtraction
MathLinks: Grade 6 (Resource Guide: Part 1) 41
Examples: Subtracting Mixed Numbers Words Diagrams Mixed Numbers Improper Fractions
You have two and three-eighths bars. You give one-fourth bar away. How much bar is left?
Start with 38
2 (shaded)
Remove 1
14
(crossed out)
Count what’s left
3 1
2 18 4
3 1= 2 + 1
8 4
3 1= 2 1 +
8 4
3 1= 1 +
8 4
3 2= 1 +
8 8
1= 1 +
8
1= 1
=
8
3 1
2 18 4
19 5=
8 4
19 10=
8 8
9=
8
1=
=
18
Think: A common multiple of 4 and 8 is 8.
8 is a common denominator.
You have three and two-thirds sandwiches. You give two and one-half to a friend. How much remains?
Start with 23
3 (shaded)
Remove 12
2 (crossed out)
Count what’s left
2 1
3 23 2
2 1= 3 + 2
3 2
2 1= 3 2 +
=
3 2
2 1= 1 +
3 2
4 3= 1 +
6 6
1= 1 +
6
1= 1
6
2 1
3 23 2
11 5=
3 2
22 15=
6 6
7=
6
1= 1
=
6
Think: A common multiple of 3 and 2 is 6.
6 is a common denominator.

Resource Guide: Part 1 Fraction Addition and Subtraction
MathLinks: Grade 6 (Resource Guide: Part 1) 42
Examples: Subtracting Mixed Numbers Words Diagrams Mixed Numbers Improper Fractions
You have five and one-eighths bars. You give away two and one-fourth bar. How much is left?
Start with 18
5 (shaded)
Remove 14
2 (crossed out)
Count what’s left
1 1
5 28 4
1 1= 5 2 +
4 8
1 1= 3 +
4 8
3 1= 2 +
4 8
6 1= 2 + +
8 8
7= 2 +
8
7= 2
8
=
1 1
5 28 4
41 9=
8 4
41 18=
8 8
23=
8
7=
=
28
Think: A common multiple of 4 and 8 is 8.
8 is a common denominator.

Resource Guide: Part 1 Fraction Addition and Subtraction
MathLinks: Grade 6 (Resource Guide: Part 1) 43
Why Do We Add and Subtract Fractions Horizontally?
In previous grades, you may have been taught to add and subtract fractions vertically. In this program, we encourage you to record steps horizontally because it makes equivalent expressions more evident.
Consider the problem: 31
2 + 2
2
3 . Your work might look like this:
31
2 + 2
2
3 = 3 +
1
2 + 2 +
2
3 meaning of mixed fraction addition
= (3 + 2) + (1
2 +
2
3) combine whole numbers and fractions
= 5 + 1 3
2 3
+ 2 2
3 2
multiplication property of 1
= 5 + 3
6 +
4
6 = 5
7
6
= 61
6
finish the computation
Consider the problem: 31
2 – 2
2
3. The work might look like this:
31
2 – 2
2
3 = 3 +
1
2 – 2 –
2
3 meaning of the mixed fraction subtraction
= (3 – 2) + 1 2
2 3 –
group whole numbers together
= (1 – 2
3) +
1
2
subtract the fraction from the whole number to create an addition problem
= 1
3 +
1
2
= 1 2
3 2
+ 1 3
2 3
multiplication property of 1
= 2 3
+ 6 6
finish the computation =
5
6

Resource Guide: Part 1 Fraction Multiplication and Division
MathLinks: Grade 6 (Resource Guide: Part 1) 44
FRACTION MULTIPLICATION AND DIVISION
Visualizing Fraction Multiplication
Thinking about “groups of” is useful when multiplying a whole number times a fraction. For
example, 3 groups of 34
can be written as:
3 3 3 3 9 1
3 = + + = = 24 4 4 4 4 4
An area model is useful for multiplying proper fractions. This is a square whose side length is 1 unit.
A rectangle that is 12
by 23
is shaded inside of it. The shaded area
shows that 1 2 22 3 6
= . This square is to scale.
We can use an area model that is not to scale to record partial products and add them to get
a final product. This rectangle shows 12
2 by 34
3 .
Find the area of each smaller rectangle and add.
1 3 6 3 32 4 4 2 8
12 12 38 8 8
278
3 38 8
2 3 = 6 + + +
= 6 + + +
= 6 +
= 6 + 3 = 9
3
3
4
2
1
2
6 6
4
3
2
3
8
The Multiply-Across Rule for Fraction Multiplication
The multiply-across rule for fraction multiplication is:
=
a c a c
b d b d
Example 1: 3 3 3 3 3 9 1
3 = = = = 24 1 4 1 4 4 4
Example 2: 1 3 5 15 5 15 75 3
2 3 = = = = 92 4 2 4 2 4 8 8

Resource Guide: Part 1 Fraction Multiplication and Division
MathLinks: Grade 6 (Resource Guide: Part 1) 45
Using the Distributive Property to Multiply Fractions
We can use the distributive property to multiply fractions.
1 2 1 23 2 = 3 + 2 +
2 3 2 3
decompose the numbers
1 1 2
= 3 + 2 + 3 + 2 2 3
distributive property
1 2 1 2= 3 2 + 2 + 3 +
2 3 2 3
distributive property
1
= 6 + 1 + 2 + 3
Multiply each term
1
= 9 + 3
Combine whole numbers
1
= 93
Finish the computation
Examples: Multiplying Fractions
Words Diagrams Use the multiply across
rule with “the big 1” Use “the big 1”
shortcut notation
A puppy eats two times per day. If the
puppy eats 34
cup of kibble at each feeding, how much does it eat in one day?
Start with two groups
of 34
(shaded)
Combine the parts 3 3 6 3 1
+ = = = 14 4 4 2 2
3 2 32 =
4 1 4
2 3=
1 2 2
1 3=
1 1 2
3=
2
13 2
2 =4
3
1 4
2
1 3=
1 2
3=
2

Resource Guide: Part 1 Fraction Multiplication and Division
MathLinks: Grade 6 (Resource Guide: Part 1) 46
Visualizing Fraction Division as “Divvie Up”
A partitive (divvie up) division problem poses the question:
“How can we divide ___ into ___ equal groups?
Suppose we want to divide 34
cups of grape juice equally among two people. This division
problem 3
4 2 , can be interpreted as “how can we divide 3
4 into 2 equal parts?
Let the rectangle represent 1 full cup. It is filled with 34
cups of grape juice
From the diagram we see that each person will get 38
cup of juice.
Therefore, 3 3
4 8 2 =
Visualizing Fraction Division as “Measure Out”
A quotative (measure out) division problem poses the question:
“How many ___ are in ___?”
Suppose a two-foot sandwich is cut into pieces that are 34
foot long each. This division
problem 2 34 can be interpreted as “how many 3
4ft. are in 2 ft.?” The unit of measure is
34ft. From the diagram, we see that there are TWO 3
4ft. sandwiches in the 2 ft. sandwich.
We see further that there is 12ft. of sandwich leftover. Since 1 2
2 3
= of 34
, the leftover
represents 23
of the unit of measure.
Therefore, 3 2
2 = 24 3
.
cut-up pieces
2-foot long sandwich
1 + 1 = 2
Resource Guide: Part 1 Fraction Multiplication and Division
MathLinks: Grade 6 (Resource Guide: Part 1) 47
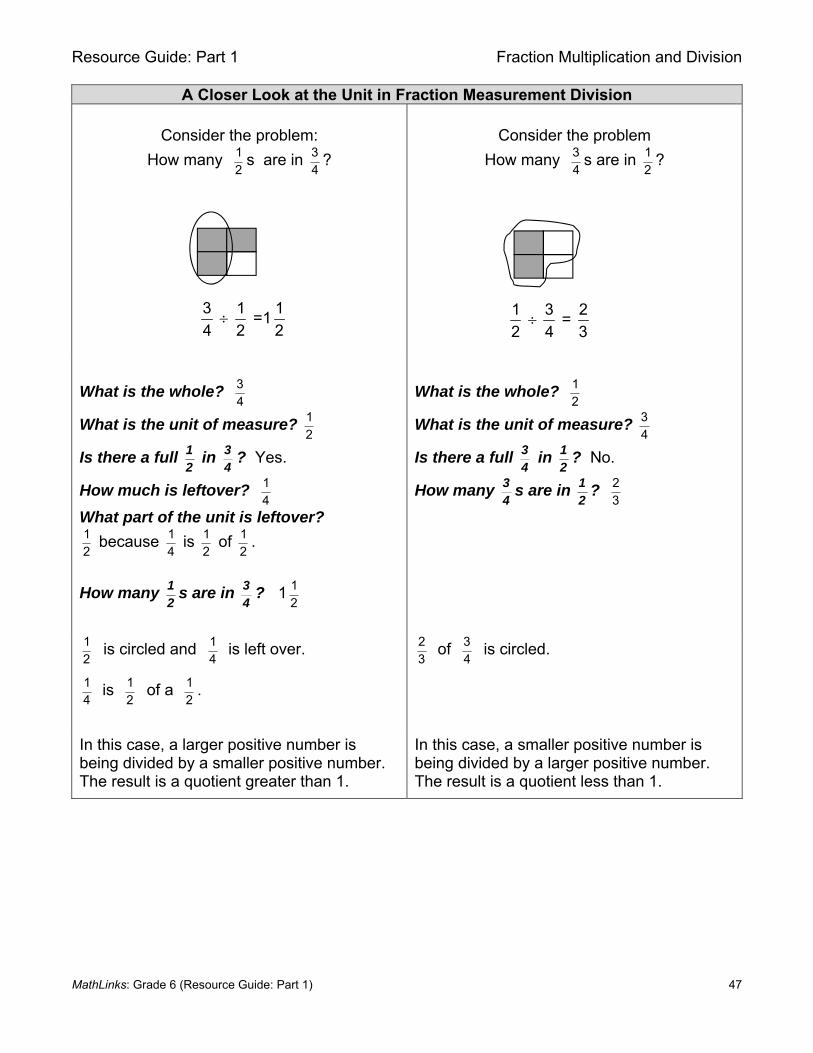
A Closer Look at the Unit in Fraction Measurement Division
Consider the problem:
How many 12
s are in 34
?
Consider the problem
How many 34
s are in 12
?
3
4
1
2 =1
1
2
1
2
3
4 =
2
3
What is the whole? 34
What is the unit of measure?
12
Is there a full 12
in 34
? Yes.
How much is leftover? 14
What part of the unit is leftover? 12
because 14
is 12
of 12
.
How many 12
s are in 34
? 1 12
What is the whole? 12
What is the unit of measure?
34
Is there a full 34
in 12
? No.
How many 34
s are in 12
? 23
12
is circled and 14 is left over.
14 is 1
2 of a 1
2.
23 of 3
4 is circled.
In this case, a larger positive number is being divided by a smaller positive number. The result is a quotient greater than 1.
In this case, a smaller positive number is being divided by a larger positive number. The result is a quotient less than 1.

Resource Guide: Part 1 Fraction Multiplication and Division
MathLinks: Grade 6 (Resource Guide: Part 1) 48
Rules for Dividing Fractions
Divide Across Multiply by the Reciprocal
a
b
c
d =
a c
b d
b ≠ 0, d ≠ 0,
a
b
c
d =
a
b
d
c
b ≠ 0, d ≠ 0,
Examples: Dividing Fractions
Words or Diagrams
Divide Across Multiply by the Reciprocal
How many 12
s are in 34
?
3 1 3 1 =
4 2 4 2
3 =
2
1 = 1
2
In this case, whole number division of the denominators results in a whole number.
3 1 3 2 =
4 2 4 1
3 2=
4 1
6 =
4
3 =
2
1 = 1
2
How many
34
s are in 12
?
1 3 2 3 =
2 4 4 4
2 3 2 3 = =
4 4 1
223 = =
1 3
In this case, division of the denominators will not result in a whole number value. Therefore, we rewrite with common denominators before dividing.
1 3 1 4 =
2 4 2 3
1 4=
2 3
4=
6
2=
3
Resource Guide: Part 1 Fraction Multiplication and Division
MathLinks: Grade 6 (Resource Guide: Part 1) 49
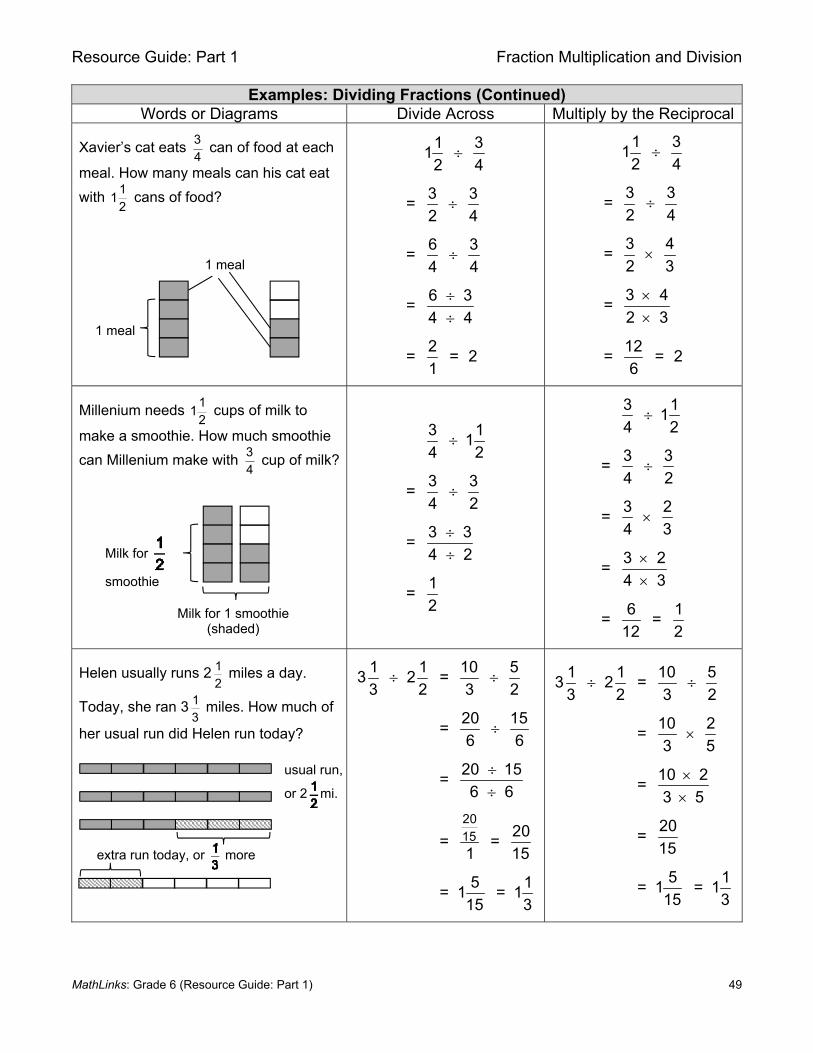
Examples: Dividing Fractions (Continued) Words or Diagrams Divide Across Multiply by the Reciprocal
Xavier’s cat eats 34
can of food at each
meal. How many meals can his cat eat
with 12
1 cans of food?
1 31
2 4
3 3=
2 4
6 3=
4 4
6 3=
4 4
2= = 2
=
1
1 31
2 4
3 3=
2 4
3 4=
2 3
3 4=
2 3
12= =
2
=
6
Millenium needs 12
1 cups of milk to
make a smoothie. How much smoothie
can Millenium make with 34
cup of milk?
3 1 14 2
3 3=
4 2
3 3=
4 2
1=
2
=
3 1 1
4 2
3 3=
4 2
3 2=
4 3
3 2=
4 3
6 1= =
12 2
=
Helen usually runs 2 12
miles a day.
Today, she ran 3 13
miles. How much of
her usual run did Helen run today?
2015
1 1 10 53 2 =
3 2 3 2
20 15=
6 6
20 15=
6 6
20= =
1 15
5 1= 1 = 1
15 3
1 1 10 53 2 =
3 2 3 2
10 2=
3 5
10 2=
3 5
20=
15
5 1= 1 = 1
15 3
1 meal
1 meal
Milk for
smoothie
Milk for 1 smoothie (shaded)
usual run,
or 2 mi.
extra run today, or more

Resource Guide: Part 1 Decimal Concepts
MathLinks: Grade 6 (Resource Guide: Part 1) 50
DECIMAL CONCEPTS
Decimal Place Value
Our place value number system is a positional number system in which the value of a digit in the number is determined by its location or place. In our “base-10” place value system, each place represents a power of 10.
Name of place hu
ndre
ds
tens
ones
tent
hs
hund
redt
hs
thou
sand
ths
Value of the Place as a Power of 10 (fraction form)
2100 10
110 10 1
1 1
10 10
2
1 1
100 10
3
1 1
1000 10
Value of the Place as a Power of 10 (decimal form)
100 10 1 0.1 0.01 0.001
For the number: 274.843
Name of place hu
ndre
ds
tens
ones
tent
hs
hund
redt
hs
thou
sand
ths
Expanded form #1 200 70 4 0.8 0.04 0.003
Expanded form #2 2(100) 7(10) 4(1) 81
10
42
1
10
33
1
10
Expanded form #3 2(100) 7(10) 4(1) 8(0.1) 4(0.01) 3(0.001)
In words: Two hundred seventy-four and eight hundred forty-three thousandths
1

Resource Guide: Part 1 Decimal Operations
MathLinks: Grade 6 (Resource Guide: Part 1) 51
DECIMAL OPERATIONS
Standard Algorithms for Addition and Subtraction
Addition
Set up the problem in columns, with place values lined up to add tens with tens, ones with ones, tenths with tenths, etc. When the digits are properly lined up, the decimal points will also align.
(Optional) Include trailing zeroes to the right of the decimal points as place holders if needed, as in this problem where 1 thousandth is added to 0 thousandths.
Add with regrouping as usual. Since the place values in the sum line up with the place values in the two addends, the decimal point in the sum will align with the decimal points in the addends.
1 1
4 8 . 5 6
+ 3 6. 5 2 1
8
0
5 . 0 8 1
Subtraction
Set up the problem in columns, with place values lined up to subtract tens from tens, ones from ones, tenths from tenths, etc. When the digits are properly lined up, the decimal points will also align.
Include trailing zeroes to the right of the decimal point as place holders in the minuend (top number) as needed to line up with any trailing nonzero digit in the subtrahend (bottom number).
Subtract as though the decimal points are not there. When done calculating, place the decimal point in the difference directly below the decimal points in the problem.
6 13 10
7. 4
+ 3. 5 1
0
3. 8 9

Resource Guide: Part 1 Decimal Operations
MathLinks: Grade 6 (Resource Guide: Part 1) 52
Multiplying Decimals
Repeated Addition Example 1: 3 0.4 Each strip represents one whole. Each part represents 0.1. Shade 0.4, a second 0.4, and then a third 0.4. for a total of 1.2.
0.4
0.4
+ 0.4
1.2
Area Model Example 2: 0.2 0.4 As with fractions, an area model can be used for decimal multiplication. Start with a unit square (a 1 x 1 square with an area of 1 square unit). The factors (0.2 and 0.4) represent the side lengths of a rectangle, and the product (0.08) is its area. Fraction Equivalents Example 3: 0.03 0.2
Since 0.03 = 3100
and 0.2 = 210
, 0.03 0.2 = 3100
210
.
Using the fraction multiplication rule: 3 2 6100 10 1,000
= .
Since 61,000
= 0.006, 0.03 0.2 = 0.006 .
The examples above show that when multiplying decimals, the number of digits to the right of the decimal point in the product is equal to the sum of the number of digits to the right of the decimal point of each factor.
3 0.4 = 1.2 0.2 0.4 = 0.08 0.03 0.2 = 0.006
0 digits 1 digit 1 digit 1 digit 1 digit 2 digits 2 digits 1 digit 3 digits
0.2
0.4
.01
.01
.01
.01
.01
.01
.01
.01

Resource Guide: Part 1 Decimal Operations
MathLinks: Grade 6 (Resource Guide: Part 1) 53
Dividing Decimals
The procedure for dividing decimals involves “moving the decimal point.” The reason this is done is because we usually consider dividing by a whole number to be an easier process.
Consider 12.5 0.25 , which can be written as 0.25 12.5 or 12.5
0.25.
Since 12.5 0.25 may be multiplied by 1 in the form of 100100
, it is equal to 1250 25 .
That is, 12.5 100 12500.25 100 25
= . Now we can divide by a whole number. This process often
is depicted this way:
50..0.25 12.5 0.25 12.50 025. 1250. 25. 1250.
Standard Algorithms for Multiplication and Division
Multiplication
Multiply, ignoring the decimal points.
Then put the decimal point in the product. The product will have as many places to the right of the decimal point as the two original factors combined.
3. 4
4. 0 5
1 7 0
+ 1 3 6 0
1 3.7 7 0
Division
Multiply the divisor and dividend by the same power of 10 (10,
100, 1000, etc.) so that the divisor is a whole number.
Divide as usual, lining up the digits of the quotient above the dividend so that the tens line up with tens, ones with ones, tenths with tenths, and so on. Place the decimal in the quotient in the same location as the dividend.
0 . 0 2 0 . 3 5 8
1 7 . 9 2 3 5 . 8
2
1 5
1 4
1 8
1 8
0

Resource Guide: Part 1 Statistics
MathLinks: Grade 6 (Resource Guide: Part 1) 54
STATISTICS Statisticsis the study of the collection, organization, analysis, interpretation, and presentation of data. Statistics help us answer questions about a population. Statistics such as measures of center and spread may be used to summarize data sets.
Statistical Questions
Answers to statistical questions generally require many data values. Example of a statistical question: “How much TV do students in my class watch?” This question anticipates variability in the number of hours spent watching TV. NOT a good statistical question: “How many hours of TV did you watch last week?” This question has only one value as an answer.
Finding Measures of Center
Here are the number of siblings for 13 different students:
3, 4, 5, 2, 2, 3, 3, 2, 2, 5, 7, 1, 1 To find the mean (average) of a data set, add all the values in the data set and divide it by the number of values (number of observations). Number of observations: 13 To find the mean: 3 + 4 + 5 + 2 + 2 + 3 + 3 + 2 + 2 + 5 + 7 + 1 + 1 = 40 40 13 3.08 To find the median (M), order the value from least to greatest and find the middle number. If there is an even number of values in the data set, the median is the mean (average) of the two middle numbers. For the siblings data set: {1, 1, 2, 2, 2, 2, 3, 3, 3, 4, 5, 5, 7} median To find the mode, find the value(s) that occur(s) most often.
For the siblings data set: The value of 2 occurs most often, as illustrated in the line plot below.
X X X X X X X X X X X X X 1 2 3 4 5 6 7

Resource Guide: Part 1 Statistics
MathLinks: Grade 6 (Resource Guide: Part 1) 55
Finding the Range and the Quartiles
Here are the number of siblings for 13 different students:
3, 4, 5, 2, 2, 3, 3, 2, 2, 5, 7, 1, 1 To find the range of a data set, find the difference between the greatest value and the least value in the data set. For the siblings data set, the range is 6, since 7 – 1 = 6 To find quartiles, first put the numbers in numerical order. Then locate the points that divide the set into four equal parts.
1 1 2 2 2 2 3 3 3 4 5 5 7
Min
Q1
Q2 = M median
Q3
Max
For the siblings data set: Q1 = 2 (the 1st quartile)
Q2 = 3 (the 2nd quartile)
Q3 = 4.5 (the 3rd quartile) Note that Q1 is the median of the first half of the data set
and Q3 is the median of the second half.

Resource Guide: Part 1 Statistics
MathLinks: Grade 6 (Resource Guide: Part 1) 56
Using Strips to Find the Five-Number Summary
Suppose these numbers represent the number of siblings for 13 different students.
3, 4, 5, 2, 2, 3, 3, 2, 2, 5, 7, 1, 1 1. Enter the numbers, in numerical order, on a blank strip
1 1 2 2 2 2 3 3 3 4 5 5 7
2. Fold the strip as shown to locate the minimum, 1st quartile (Q1), median (Q2), 3rd quartile (Q3), and maximum. Q1 median (Q2) Q3 1st quartile 3rd quartile
minimum maximum
Class Siblings
Minimum 1
1st Quartile (Q1) 2
Median (Q2 = M) 3
3rd Quartile (Q3) 4.5
Maximum 7
11
22 2
2 3 33 4
55
7

Resource Guide: Part 1 Statistics
MathLinks: Grade 6 (Resource Guide: Part 1) 57
Mean Absolute Deviation
The mean absolute deviation (MAD) is a measure of spread of a data set. It is the average of the distance of each data point to the mean of the data set. Consider Lin’s and Abdul’s math scores.
Lin’s scores: Abdul’s scores:
90 75 60 55 80 95 80 85 55 45
Finding MAD Lin Abdul
1. Find the arithmetic mean of the data. Mark these locations on each number line with an “X.”
90 + 75 + 60 + 55 + 80
5
Mean = 72
95 + 80 + 85 + 55 + 45
5
Mean = 72
2. Find the distance between each data point and the mean on the number lines.
Distance between… 90 and 72: 18 75 and 72: 3 60 and 72: 12 55 and 72: 17 80 and 72: 8
Distance between… 95 and 72: 23 80 and 72: 8 85 and 72: 13 55 and 72: 17 45 and 72: 27
3. Find the sum of these distances to the mean.
18 + 3 + 12 + 17 + 8 Sum = 58
23 + 8 + 13 + 17 + 27 Sum = 88
4. Find the mean of these five distances.
18 + 3 +12 +17 + 8
5
MAD = 11.6
23 + 8 +13 +17 + 27
5
MAD = 17.6
Both students have the same mean (average) for their five scores. But Abdul’s MAD statistic is larger than Lin’s, because Abdul’s scores have more variability (are more spread out).
40 100 40 100
40 100 40 100
40 100 40 100
40 100 40 100
40 100 40 100
X Mean=72
X
X
X
X
X Mean=72
X
X
X
X
90 95
75 80
60 85
55
45
55
80
18 23
3 8
12
17
8 27
17
13

Resource Guide: Part 1 Data Displays
MathLinks: Grade 6 (Resource Guide: Part 1) 58
DATA DISPLAYS
How to Construct a Dot Plot
A dot plot (also called a line plot) displays data on a number line with a dot ( ) or an X to show the frequency of data values. Here are the number of siblings for 13 different students:
3, 4, 5, 2, 2, 3, 3, 2, 2, 5, 7, 1, 1 1. Make a number line that extends from the minimum data value to the maximum data
value.
2. Mark a dot or an X for every data value.
• • • • • • • • • • • • •
3. Write a title and add vertical and horizontal labels.
Number of Siblings that Students Have
Num
ber
of
Stu
dent
s
• • • • • • • • • • • • •
Number of Siblings
1 2 3 4 5 6 7
1 2 3 4 5 6 7
1 2 3 4 5 6 7
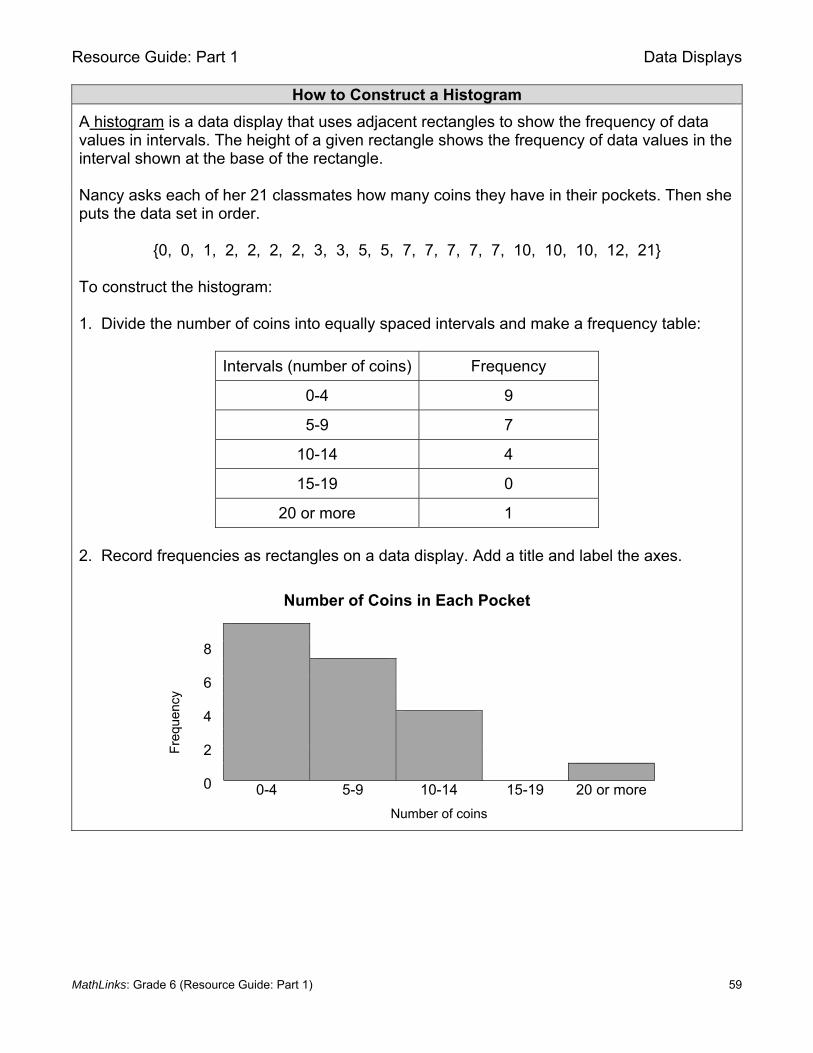
Resource Guide: Part 1 Data Displays
MathLinks: Grade 6 (Resource Guide: Part 1) 59
How to Construct a Histogram
A histogram is a data display that uses adjacent rectangles to show the frequency of data values in intervals. The height of a given rectangle shows the frequency of data values in the interval shown at the base of the rectangle. Nancy asks each of her 21 classmates how many coins they have in their pockets. Then she puts the data set in order.
{0, 0, 1, 2, 2, 2, 2, 3, 3, 5, 5, 7, 7, 7, 7, 7, 10, 10, 10, 12, 21} To construct the histogram: 1. Divide the number of coins into equally spaced intervals and make a frequency table:
Intervals (number of coins) Frequency
0-4 9
5-9 7
10-14 4
15-19 0
20 or more 1
2. Record frequencies as rectangles on a data display. Add a title and label the axes.
Number of Coins in Each Pocket
Fre
quen
cy
8
6
4
2
0
0-4 5-9 10-14 15-19 20 or more
Number of coins .

Resource Guide: Part 1 Data Displays
MathLinks: Grade 6 (Resource Guide: Part 1) 60
How to Construct a Box-and-Whisker Plot
A box plot (or box-and-whisker plot) is a visual representation of the center and spread of a data set. The display is based on the five-number summary. Here are the ages of 15 people:
21, 12, 28, 17, 46, 35, 7, 38, 42, 33, 19, 9, 31, 25, 28 1. Write the values of the data set from least to greatest.
{7, 9, 12, 17, 19, 21, 25, 28, 28, 31, 33, 35, 38, 42, 46} 2. Find the five-number summary.
7 9 12 17 19 21 25 28 28 31 33 35 38 42 46
minimum Q1 Q2 median
Q3 maximum
3. Locate the five-number summary values on a number line, and indicate with vertical segments. minimum Q1 Q2 Q3 maximum median
6 8 10 12 14 16 18 20 22 24 26 28 30 32 34 36 38 40 42 44 46
4. Create a “box” to highlight the interval from the first to the third quartile, and draw
“whiskers” that extend to the minimum and maximum. minimum Q1 Q2 Q3 maximum median
6 8 10 12 14 16 18 20 22 24 26 28 30 32 34 36 38 40 42 44 46
Heads Up! Be sure to scale the box and whisker plot properly. This plot is WRONG:
7 17 28 35 46

Resource Guide: Part 1
MathLinks: Grade 6 (Resource Guide: Part 1) 61
This page is intentionally left blank.

Resource Guide: Part 1
MathLinks: Grade 6 (Resource Guide: Part 1) 62
© 2016 Center for Mathematics and Teaching