Mathew, J., Benekohal, R.F., and Medina, J.C., 1docs.trb.org/prp/17-06159.pdf · ·...
17
Mathew, J., Benekohal, R.F., and Medina, J.C., 1 NESTED SORTING AND CLUSTERING FOR VISUALIZATION OF ACCIDENTS AT 1 HIGHWAY-RAIL GRADE CROSSINGS 2 3 4 5 Jacob Mathew 6 Graduate Research Assistant, Department of Civil and Environmental Engineering 7 Room B106, Newmark Civil Engineering Laboratory 8 University of Illinois at Urbana-Champaign, Urbana, IL 61801 USA 9 Phone: (630)-877-8920 10 [email protected] 11 12 13 Rahim (Ray) F. Benekohal 14 Professor, Department of Civil and Environmental Engineering 15 1213, Newmark Civil Engineering Laboratory 16 University of Illinois at Urbana-Champaign, Urbana, IL 61801 USA 17 Phone: (217)-244-6288, Fax: (217)-333-1924 18 [email protected] 19 20 21 Juan C. Medina 22 Research Assistant Professor 23 Department of Civil and Environmental Engineering 24 CME 122 S Central Campus Dr, Room 413 25 Salt Lake City, UT 84112 26 University of Utah 27 Phone: (801)-585-1952 28 [email protected] 29 30 31 Resubmitted for Publication 32 33 34 Word Count: 4746 35 Number of Figures and Tables: 7 Figures, 4 Tables 36 37 38 39 40 41 November 15, 2016 42 43
Transcript of Mathew, J., Benekohal, R.F., and Medina, J.C., 1docs.trb.org/prp/17-06159.pdf · ·...
Mathew, J., Benekohal, R.F., and Medina, J.C., 1
NESTED SORTING AND CLUSTERING FOR VISUALIZATION OF ACCIDENTS AT 1
HIGHWAY-RAIL GRADE CROSSINGS 2
3
4
5
Jacob Mathew 6
Graduate Research Assistant, Department of Civil and Environmental Engineering 7
Room B106, Newmark Civil Engineering Laboratory 8
University of Illinois at Urbana-Champaign, Urbana, IL 61801 USA 9
Phone: (630)-877-8920 10
12
13
Rahim (Ray) F. Benekohal 14
Professor, Department of Civil and Environmental Engineering 15
1213, Newmark Civil Engineering Laboratory 16
University of Illinois at Urbana-Champaign, Urbana, IL 61801 USA 17
Phone: (217)-244-6288, Fax: (217)-333-1924 18
20
21
Juan C. Medina 22
Research Assistant Professor 23
Department of Civil and Environmental Engineering 24
CME 122 S Central Campus Dr, Room 413 25
Salt Lake City, UT 84112 26
University of Utah 27
Phone: (801)-585-1952 28
30
31
Resubmitted for Publication 32
33
34
Word Count: 4746 35
Number of Figures and Tables: 7 Figures, 4 Tables 36
37
38
39
40
41
November 15, 2016 42
43

Mathew, J., Benekohal, R.F., and Medina, J.C., 2
ABSTRACT 1
Safety at railroad grade crossings is a critical issue for highway and rail networks. Analyzing 2
relevant databases to find the cause or contributing factors to the crossing accidents would help to 3
select appropriate countermeasures. Manually establishing the order of the contributing factors of 4
the accidents and extracting useful information from accident databases is not feasible because of 5
the enormous number of possible permutations of the contributing factors involved. This paper 6
presents a new automated method to sort and cluster the accident attributes to identify and visualize 7
trends in the accident databases. The method is called modified nested sorting and crossing cluster 8
(M+C). The method creates a dynamic tree visualization that highlights attribute values resulting 9
in the greatest accident concentration along a tree branch, uncovering the most common nested 10
accident factors. This is a significant improvement over static methods that rely on fixed hierarchy 11
of attributes. With the M+C method a unique hierarchy of the attributes can be determined for a 12
single grade crossing or for a set of crossings combined. This approach is completely data-driven 13
and suitable for corridors and large groups of accidents that are otherwise difficult to analyze. The 14
method is illustrated for single crossings and a corridor with several crossings based on the records 15
from the Federal Railroad Administration (FRA) online database. Absolute sorting and nested 16
sorting are discussed and the evolution of M+C is presented. The M+C method is useful tool for 17
assessing a large number of single grade crossings or the crossing that are along a corridor or with 18
in a region. 19
20
Mathew, J., Benekohal, R.F., and Medina, J.C., 3
INTRODUCTION 1
In 2013, a total of 232 fatalities and 974 injuries were attributed to grade crossing accidents in the 2
United States, down from 372 fatalities and 1092 injuries ten years before, in 2004 (1). Even 3
though the number of accidents at highway-railway grade crossings has decreased over the years, 4
continued efforts for further reducing accident frequency and severity are needed considering that 5
grade crossing accidents are “…the most severe in terms of fatalities, personal injuries and 6
property damage per accident of all types experienced on American highways” (2). Even in recent 7
years, “…because of significant mass difference the train–vehicle crash injury and fatality rates 8
are much higher than other types of traffic crashes” (3). Thus, grade crossing safety is as relevant 9
today as ever, and more so when demand in both highway and railroad systems continue to 10
increase. 11
In the US, grade crossing accident records are maintained by Federal Railroad 12
Administration (FRA) in databases that are publicly available. Analyzing the databases to find the 13
cause or contributing factors to the crossing accidents would help to select appropriate 14
countermeasures. However, manually extracting useful information from accident databases could 15
be very time consuming and at times infeasible for the following reasons. First, there is a need to 16
establish an order of importance for the attributes at each of the crossings so that the significant 17
contributing factors are ranked properly. If this ranking is not established properly, the trends and 18
significance of the contributing factors may be lost due to dividing the data to subcategories that 19
are not the most frequent ones. Second, the number of possible combinations for ranking of the 20
contributing factors can become very large to make it nearly impossible to analyze it manually. 21
For example, if only 6 contributing factors are selected from the FRA accident database, there are 22
720 (which is 6!) possible combinations of the ordered contributing factors for each crossing. 23
Third, the order of the contributing factors for different crossings could be different and so each 24
crossing would require individual analysis. Fourth, the complexity of this problem increases 25
exponentially if analysis is done for multiple crossing combined (such as all crossings along a 26
corridor or within a region). Fifth, broadening the analysis to include more contributing factor 27
could result in a significantly high number of combination of contributing factors. For example, 28
for 20 contributing factor the permutations are in the order of 1.12*1018! Therefore, manually 29
determining the order of the contributing factors to accidents is not feasible especially if the 30
analysis is to be repeated on a yearly or semi-yearly basis. Hence, there is a need for a computerized 31
procedure to establish the order of the contributing factors for each location (or group of locations) 32
analyzed. 33
The objective of this paper is to develop a new, easy method to extract the most frequent 34
nested accident trends and to help visualize them, particularly when many records need to be 35
analyzed for a location or a corridor with many crossings. The data visualization is based on a 36
dynamic tree structure that shows the hierarchy of the most common accident attributes. A unique 37
hierarchy is created for each grade crossing or a set of crossings combined which depends on the 38
accident characteristics on the crossing(s), thus, increasing potential for discovering more useful 39
information regarding accident trends at those crossings. 40
This paper expands the idea of a tree-style visualization of accident trends by developing 41
a new method to overcome the limitations of a static method previously proposed by the authors 42
(4). The proposed “modified nested sorting and crossing cluster” is a micro-level analysis approach 43
with the intent to highlight the trends or contributing factors at high accident crossings or in a 44
group of crossings combined. This method also determines which attributes should be used first 45
and prioritizes the accident attributes instead of relying on a pre-determined hierarchy. The method 46

Mathew, J., Benekohal, R.F., and Medina, J.C., 4
is data-driven and suitable for automation using a computer program. The dynamic method may 1
also be used as a tool to help a team prepare for inspection of public grade crossings, 2
complementing the prioritization of crossings proposed in the Federal Highway Administration’s 3
Grade Crossing Handbook (5). 4
DYNAMIC METHOD OF ACCIDENT ANALYSIS AT GRADE CROSSINGS 5
The dynamic method builds on a previous static method developed by the authors, and provides 6
essential features to enhance the potential for effective accident trend visualization. A brief 7
description of the static method is given first to help better understand the dynamic method. 8
In previous work (4,6), the authors described a static tree structure to explore the common 9
traits that could be identified for groups of accidents, and some of these results were also observed 10
to be significant at a macro scale accident analysis using a state-level accident prediction model. 11
The static method used nine attributes from the FRA accident database (7), and these attributes 12
were selected and used in a fixed order to form a tree structure (this is referred hereafter as the 13
“static method” which produced a “static tree”). 14
The nine attributes used in the static method and their hierarchy are given in Table 1. 15
Examples of the implementation of the static tree are given later in this paper along with 16
comparisons with the proposed dynamic method. 17
TABLE 1: Attributes used in Static Method 18
No. Attribute Definition Remarks
1 TYPVEH Highway User
Type
Pedestrian, motorist or others
2 MOTORIST Action of
Highway User
Drove around or through gate, stopped and then
proceeded, did not stop, stopped on crossing,
others
3 VEHDIR Highway User
Direction
North, south, east, west
4 TRNDIR Timetable
Direction
North, south, east, west
5 TYPACC Circumstance of
Accident
Train hit highway vehicle, highway vehicle hit
train
6 DRIVAGE Vehicle driver age Numerical value for highway user’s age
7 DRIVGEN Vehicle driver
gender
Male, female
8 WEATHER Weather
Conditions
Clear, Cloudy, Rain, Fog, Sleet, Snow
9 VISIBLTY Visibility Dawn, Day, Dusk, Dark
19
In the static method, a tree structure is created based on the fixed hierarchy listed in Table 1. Using 20
only the nine attributes does not allow a chance for other attributes that may identify the accident 21
trends more clearly to be considered. Moreover, the pre-determined hierarchy that is suitable for 22
a single crossing may not be the appropriate order for a group of crossings along a corridor. The 23
static method needs to be improved to provide a better visualization of the accidents and to extract 24
more useful information out of the FRA accident database. 25

Mathew, J., Benekohal, R.F., and Medina, J.C., 5
The key features of the dynamic method highlighted in this paper are: 1) considering all potential 1
attributes in the FRA accident database (22 attributes) or other data bases, 2) data-driven selection 2
of the hierarchy of attributes, and 3) development of a computerized process to reduce time 3
requirements and potential human errors. 4
The accident database provided by the FRA has 103 attributes. Out of these, the authors 5
chose those attributes which described 6
1. the time of the accident (e.g. MONTH, AMPM etc.) 7
2. the crossing condition at the time of the accident (LOCWARN, WARNSIG, VIEW etc.) 8
3. the characteristics and behavior of the highway vehicle driver involved in the accident 9
(MOTORIST, DRIVAGE etc.) 10
4. the speed and direction of the vehicle/train involved at the crossing (VEHSPD, TRNDIR 11
etc.) 12
The attributes which were not chosen include those 13
1. specifying the location of the crossing (e.g. STATION, COUNTY etc.) 14
2. redundant attributes (e.g. IYR, IYR2 etc. which carry the same value) 15
3. describing the consequence of accident (e.g. TOTALKLD, TOTALINJ etc.) 16
4. accident narrative (NARR1, NARR2 etc.) 17
5. blank dummy fields. 18
Though some of the attributes mentioned in Table 2 may not seem applicable for single 19
crossing evaluations, they may play an important role in multiple crossing (e.g. corridor) 20
evaluations. The attributes are listed in the order they appear in the database and this order has no 21
significance in this study. The 22 attributes are prioritized based on criterion discussed later to 22
form a dynamic tree. Then, the accidents are grouped into subcategories of each attribute. The 23
attributes considered and their sub-categories are listed in Table 2. 24
TABLE 2: Attributes used in Dynamic Method 25
No. Attribute Number of
Sub-Categories
Definition (8) Remarks
1 MONTH 4 Month of Incident Month of incident. Classified depending on season
2 AMPM 2 AM or PM AM or PM
3 VEHSPD 4 Vehicle estimated speed Vehicle Speed: <20, 20-40, 40-60, >60
4 TYPVEH 3 Highway user type Vehicle Type: Pedestrian, Motorist and Others
5 VEHDIR 4 Highway user direction Direction of Highway User
6 POSITION 4 Position of highway user Stalled, Stopped, Moving, Trapped
7 TYPACC 2 Circumstance of accident Train struck HW user OR Train struck by HW user
8 VISIBLTY 4 Visibility Dawn, Day, Dusk Dark
9 WEATHER 6 Weather conditions Clear, Cloudy, Rain, Fog, Sleet, Snow
10 TYPTRK 4 Type of track Track Type: Main, Yard, Siding, Industry
11
TRKCLAS 10 FRA track class FRA Track Class 1 through 5 (FRA track classes are
explained in detail in (9)) 12 TRNSPD 4 Speed of train Train Speed: <20, 20-40, 40-60, >60
13 TRNDIR 4 Timetable direction North, south, east, west
14 LOCWARN 3 Location of warning Both Sides, Side of Vehicle Approach, Opposite Side
15
WARNSIG 3 Crossing warning interconnected with
highway signal
Yes, No, Unknown
16
LIGHTS 3 Crossing illuminated by street lights
or special lights
Yes, No, Unknown
17
MOTORIST 5 Action of highway user Drove around or through gate, stopped and then
proceeded, did not stop, stopped on crossing, others
18
VIEW 8 Primary obstruction of track view Permanent structure, standing RR equipment, passing
train, topography, vegetation, highway vehicles, other,
not obstructed
19 CROSSING 2 Type of warning device at crossing Some warning device or No warning device
20 PUBLIC 2 Public crossing Public or Private
21 DRIVAGE 3 Highway user’s age 0-30, 30-60, >60
22 DRIVGEN 2 Highway user’s gender Male, female

Mathew, J., Benekohal, R.F., and Medina, J.C., 6
The prioritization of the 22 attributes in the Dynamic Method is not a simple task. 1
DETERMINING HIERARCHY OF ATTRIBUTES 2
Various methods to establish a hierarchy for attributes were considered. They are described below 3
and the order in which the methods are presented show how the selected method was evolved. 4
5
Absolute Sorting Prioritizing Method 6
A step-by-step procedure for using the absolute sorting (AS) method is given below: 7
1. The total number of accidents is divided into the sub-categories of the 22 attributes. 8
2. The subcategory in each attribute which holds the highest number of accidents is identified. 9
3. The largest subcategories (found in step 2) are sorted in the descending order. This order 10
gives the hierarchy of attributes. 11
4. The tree is built following the order of attributes. 12
13
For the purpose of explanation, consider three attributes A1, A2, A3 are used for the formation of 14
the tree. Each of the three attributes has two subcategories. Attribute 1 has subcategories A11 and 15
A12, attribute 2 has subcategories A21 and A22 while attribute 3 has subcategories A31 and A32. 16
Assume that the total number of accidents at this hypothetical crossing is 12. The details of this 17
crossing are given in Table 3. 18
19
TABLE 3: Accident Details for Hypothetical Crossing 20
Accident Number Attribute 1 Attribute 2 Attribute 3
1 A11 A21 A31
2 A11 A22 A31
3 A11 A21 A31
4 A11 A21 A32
5 A11 A21 A31
6 A11 A21 A32
7 A11 A22 A31
8 A11 A21 A32
9 A11 A21 A31
10 A11 A22 A32
11 A12 A22 A31
12 A12 A22 A31
21
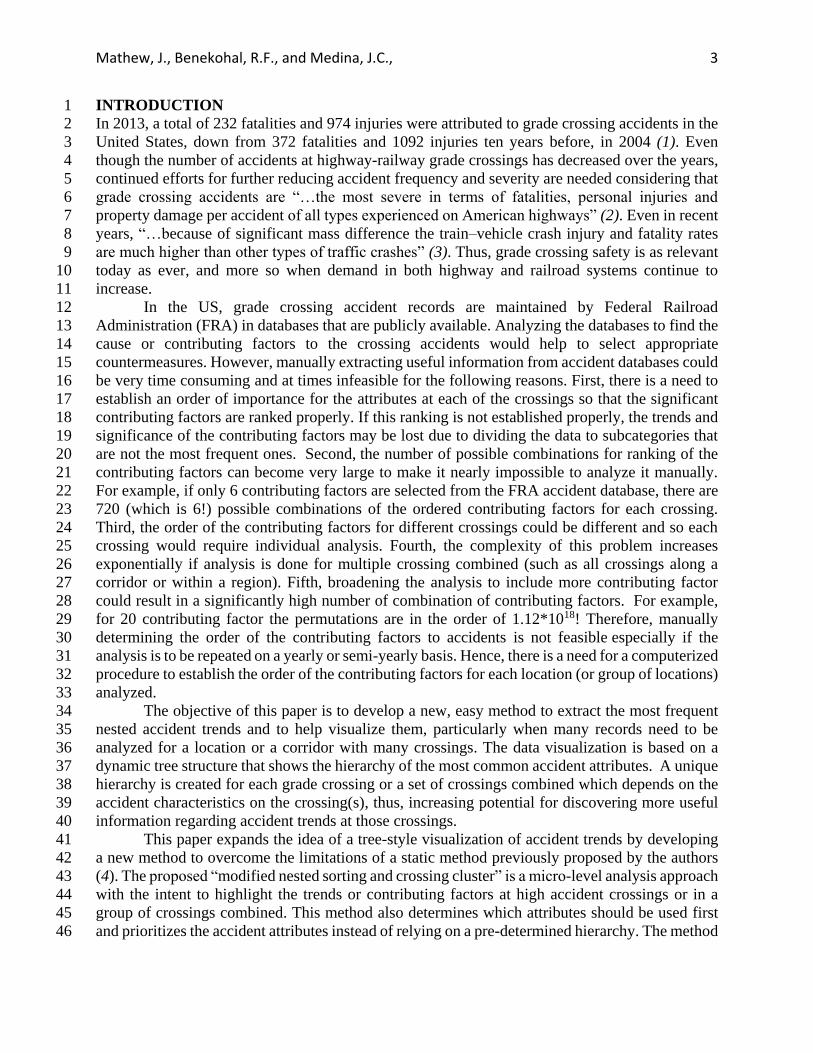
In the AS method, the accidents are first grouped into sub-categories of all the attributes used. In 22
our example in Table 3, attribute A1 groups 10 accidents into the subcategory A11 and the 23
remaining accidents into A12. Attribute A2 groups 7 accidents into A21 and the remaining into 24
A22, and attribute A3 groups 8 accidents into A31 and the remaining into A32. The subcategories 25
with the highest number of accidents from each attribute are selected, thus A11, A21 and A31 are 26
selected and these are used to sort the attributes in the descending order. The resulting order of the 27
attributes is A1, A3, and finally A2. The tree is formed by subdividing the highest node in each 28
level of the tree according to the above determined hierarchy of attributes, as shown in Figure 1. 29
30
Mathew, J., Benekohal, R.F., and Medina, J.C., 7
1
2 3 4
FIGURE 1: Dynamic tree generation using AS for Accidents shown in Table 3 5
The AS method is an improvement over the procedure used in static method because it uses up to 6
22 attributes and sorts them based on the accident data, however it does not follow through the 7
“main branch” (the branch that groups the largest number of accidents). Although the order of the 8
attributes used in the AS method depends on the data for that location, it could not find the 9
strongest trend in some cases tested. Nonetheless, the advantage of this method is that it is 10
relatively simple and the hierarchy obtained depends on the distribution of the accidents into 11
subcategories. 12
13
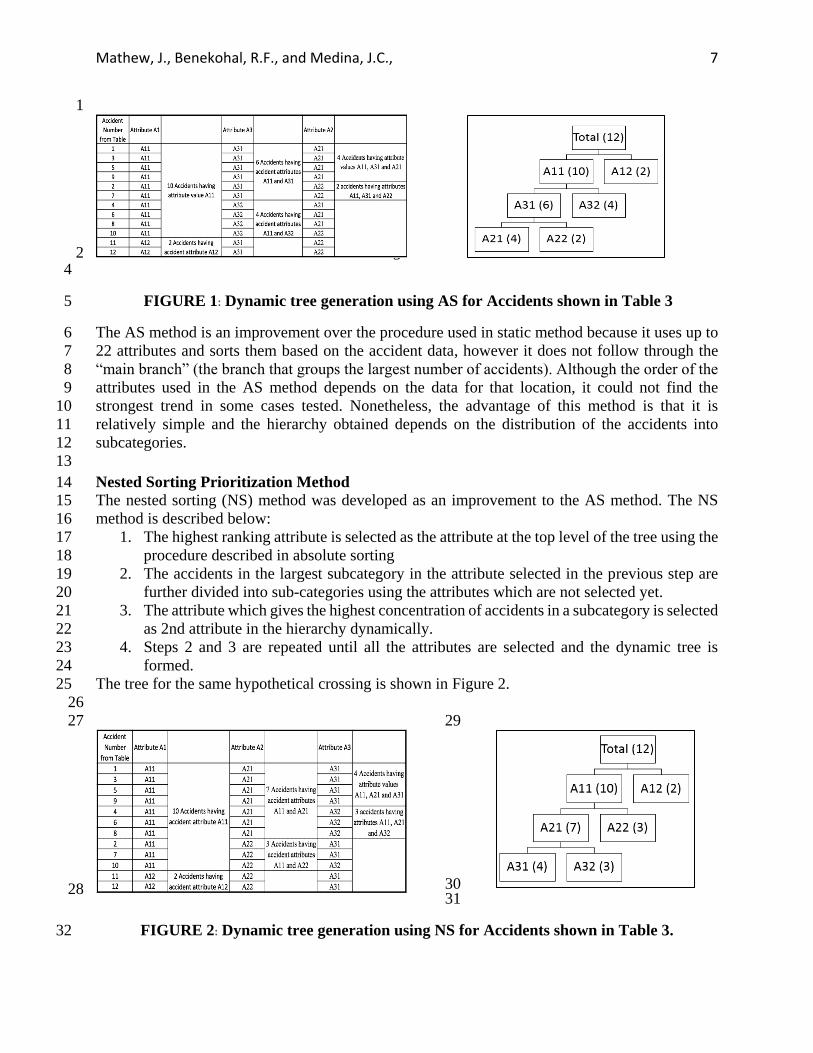
Nested Sorting Prioritization Method 14 The nested sorting (NS) method was developed as an improvement to the AS method. The NS 15
method is described below: 16
1. The highest ranking attribute is selected as the attribute at the top level of the tree using the 17
procedure described in absolute sorting 18
2. The accidents in the largest subcategory in the attribute selected in the previous step are 19
further divided into sub-categories using the attributes which are not selected yet. 20
3. The attribute which gives the highest concentration of accidents in a subcategory is selected 21
as 2nd attribute in the hierarchy dynamically. 22
4. Steps 2 and 3 are repeated until all the attributes are selected and the dynamic tree is 23
formed. 24
The tree for the same hypothetical crossing is shown in Figure 2. 25
26
27
28
29
30 31
FIGURE 2: Dynamic tree generation using NS for Accidents shown in Table 3. 32

Mathew, J., Benekohal, R.F., and Medina, J.C., 8
The NS method is an improvement over the AS method, but has its own limitations. One of the 1
limitations is that the NS method is unable to resolve ties while determining the hierarchy (step 3 2
in the procedure). To resolve ties in the NS method, we used the order in which the attributes 3
appear in the database. Another limitation of NS is that the analysis of the accidents on the main 4
branch may take the focus of the analyst away from the accidents on the other branch. To address 5
these limitations, the Modified Nested Sorting Method was developed. 6
7
Modified Nested Sorting Method 8
The modified nested sorting (MNS) method improves the NS method by removing the limitations 9
mentioned above. The limitation due to ties in ranking is resolved by computing a Tie Score for 10
each attribute and ranking them based on the Tie Score values. The Tie Score is computed using 11
the historic accident data from the database. The Tie Score for an attribute is the sum of the number 12
of accidents in the largest subcategory of that attribute in all the crossings present in the database 13
analyzed. 14
To understand the logic used to break the ties and how the Tie Score are computed, consider 15
a database with 10 locations (crossings) and three attributes, each with two subcategories, as shown 16
in Table 4. 17
TABLE 4: Hypothetical Database to Explain Procedure to Resolve Ties 18
Locations No of Accidents
at Location
Attribute A1 Attribute A2 Attribute A3
A11 A12 A21 A22 A31 A32
1 10 10 0 8 2 6 4
2 5 5 0 4 1 3 2
3 3 2 1 2 1 1 2
4 1 1 0 1 0 1 0
5 7 6 1 4 3 3 4
6 3 2 1 2 1 1 2
7 6 6 0 4 2 3 3
8 1 1 0 1 0 1 0
9 1 0 1 1 0 1 0
10 1 1 0 0 1 1 0
Tie Score 35 28 24 * Accident frequencies in bold are used to estimate the Tie Score 19
20
The Tie Score of attribute A1 is calculated as the sum of the values in the largest subcategories in 21
all 10 locations. For A1 this number is the sum of 10, 5, 2, 1, 6, 2, 6, 1, 1 and 1; the sum is equal 22
to 35. The Tie Scores of attributes A2 and A3 are calculated similarly, resulting in 28 and 24, 23
respectively. The numerical value of a Tie Score indicates a tendency of an attribute to cluster 24
accidents into one of its subcategories. An attribute with a higher Tie Score has a stronger tendency 25
to cluster more accidents into one of its subcategories as opposed to an attribute with a lower Tie 26
Score. Hence, an attribute with a higher Tie Score will appear in the tree above an attribute with a 27
lower Tie Score in case of a tie. 28
A stepwise procedure for MNS method is given below. 29
1. The same as in Step 1 of the NS method. 30
2. The same as in Step 2 of the NS method. 31
3. The same as in Step 3 of the NS method. 32
Mathew, J., Benekohal, R.F., and Medina, J.C., 9
4. If two or more attributes has a tie in the hierarchy, compute the Tie Score and use it to 1
break the tie. 2
5. The procedure is repeated until all the attributes are ranked and the dynamic tree is formed. 3
The MNS method has a shortcoming. Even though it follows the main branch, it does not 4
consider the contribution of the other branches to the trend identified in the main branch. A 5
different trend or a stronger trend may emerge when the contributions of other subcategories are 6
considered. To remedy this shortcoming, a variable called “Crossing Cluster” is computed for each 7
of the attributes that is ranked in by the major branch. The Crossing Cluster is the sum of the 8
number of accidents in a given subcategory for all the branches in the MNS. This is illustrated in 9
Figure 3(e). 10
Thus, the final preferred method uses a combination of the MNS method and the Crossing 11
Cluster (M+C). The MNS method is used to build the dynamic fault tree structure and the Crossing 12
Cluster is used to add the contribution of other branches to the main branch for a given subcategory. 13
The M+C method provides information that is more revealing than the MNS and may provide 14
information that strengthens the trend found by the MNS method or may highlight a new trend. 15
16
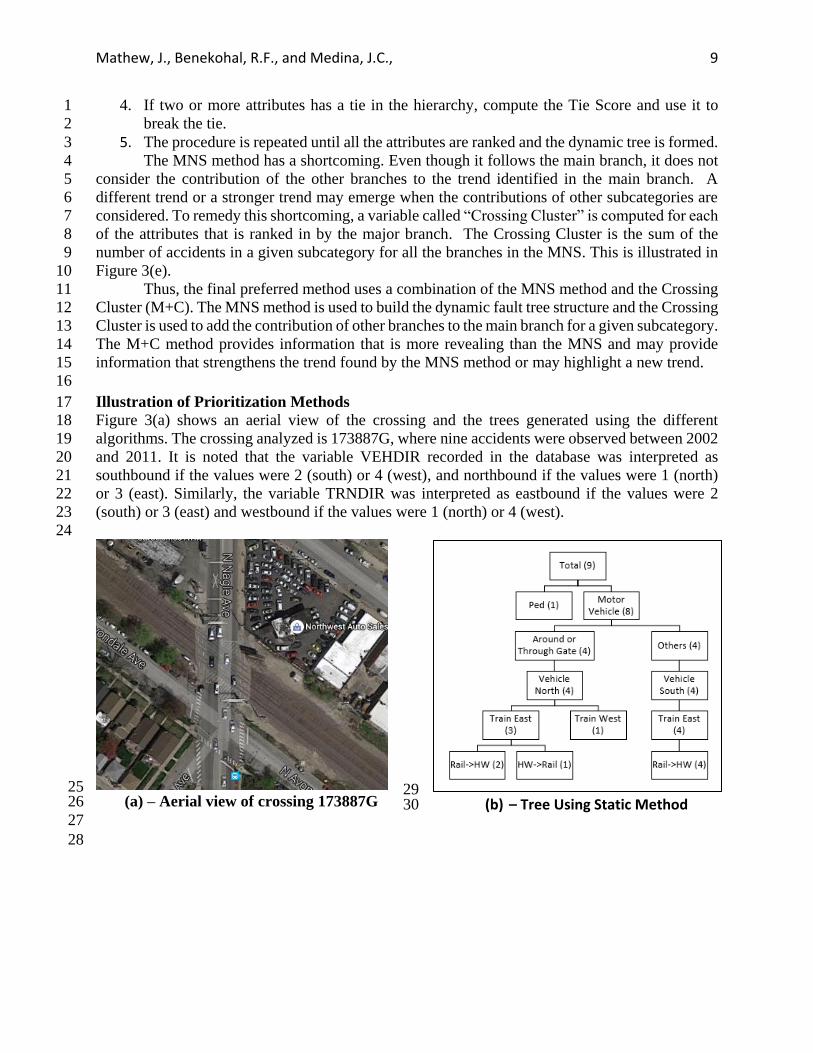
Illustration of Prioritization Methods 17
Figure 3(a) shows an aerial view of the crossing and the trees generated using the different 18
algorithms. The crossing analyzed is 173887G, where nine accidents were observed between 2002 19
and 2011. It is noted that the variable VEHDIR recorded in the database was interpreted as 20
southbound if the values were 2 (south) or 4 (west), and northbound if the values were 1 (north) 21
or 3 (east). Similarly, the variable TRNDIR was interpreted as eastbound if the values were 2 22
(south) or 3 (east) and westbound if the values were 1 (north) or 4 (west). 23
24
25 (a) – Aerial view of crossing 173887G 26
27
28
29 (b) – Tree Using Static Method 30

Mathew, J., Benekohal, R.F., and Medina, J.C., 10
1 (c)– Tree Using AS 2
3
4 (d) – Tree Using NS5
6 (e) Tree Using M+C 7
FIGURE 3: Accident visualization trees for crossing 173887G 8
Figure 3(b) shows the implementation of the static tree for the crossing 173887G. This tree 9
follows the fixed hierarchy as given in Table 1. This tree reveals 4 cases of gate violations and 4 10
cases where the action of the motorist was “others” (stopped at the crossing before the gate was 11
lowered as read from the narrative). This tree also tells the analyst that 7 accidents involved a train 12
traveling east. 13

Mathew, J., Benekohal, R.F., and Medina, J.C., 11
Figure 3(c) shows the implementation of AS. It can be seen that the order of the attributes 1
in this method depends on the accidents at this location. Although more attributes are used, no 2
useful information is extracted from this tree. 3
From Figure 3(d) (NS), it is observed that out of the 8 accidents with vehicle speeds lower 4
than 20 mph, in 7 of these occasions trains were traveling east, in 6 of them struck the highway 5
user (highlighted in the figure). The position of the vehicle was coded as ‘stopped on crossing’ in 6
5 cases while the action of the motorist was ‘others’ in 4 of the accidents as seen in the main branch 7
of the tree (highlighted in the figure). This method does not give any information about the 8
accidents that are not represented in the main branch of the dynamic tree which is identified as one 9
of its shortcoming. 10
From the dynamic tree using M+C in Figure 3(e) it is observed that all the accidents 11
involved vehicle speeds under 20mph and 7 out of 8 accidents involved an eastbound train. It 12
further shows that in 6 out of the 7 accidents, the rail equipment struck the highway vehicle, and 13
in 5 occasions the vehicles were stopped on the crossing (highlighted in the MNS tree). M+C was 14
able to reveal that higher number of eastbound trains were involved in accidents at the crossing 15
and hence suggest that the directionality of the train could be an important attribute to look into. 16
The action of the motorist was described as stopped at the crossing before the gates were lowered. 17
(The narrative in the FRA accident database supports this). The crossing cluster is also given at 18
the right side in this method tells the analyst about the number of gate violations (highlighted in 19
the crossing cluster) as well. (This information is unavailable in the NS method). The M+C method 20
was able to gather more information from the accident database than the other algorithms tested. 21
With this information the analyst should be interested in looking at directionality of train as well 22
as reasons for gate violations/cars stopping on crossing. 23
The following section gives examples of dynamic tree generated for two different crossings 24
and a corridor to explain how this data visualization technique can aid in information extraction 25
from the FRA accident database. 26
27
VISUALIZATION TREES FROM SELECTED CASE STUDIES 28
The FRA accident records for 10 years (from 2005 to 2014) is used in the following two examples. 29
High accident locations were analyzed using the M+C method. These case studies are used to 30
validate the method and to show that this method is not just restricted to the database used to 31
develop it (i.e. database 6180.57 for the state of Illinois between 2002 and 2011). Accident 32
database for the state of Illinois between 2005 and 2014 and accident database for the state of 33
California between 2005 and 2014 are used for this purpose. 34
35
High Accident Crossing in Illinois: Frequent Gate Violations Identified 36
The crossing with ID 608311K had 7 accidents between 2005 and 2014. It is located at the crossing 37
of Northeast Illinois Regional Commuter Corp. Railroad rail line and W 119th Street in Blue 38
Island. The tree developed using the Static Method and the dynamic method are given in Figure 39
4(b) and Figure 4(c) respectively. 40
Additional information is extracted from the M+C method (dynamic method) compared to 41
the static method. In five accidents the highway user drove around the gates as shown by both the 42
static and dynamic methods. Four out of 7 accidents occurred on FRA class 1 track where the train 43
speed limit is lower (highlighted in the crossing cluster in Figure 4(c)). The highway user’s action 44
in 5 of the cases (moving and drove around or through the gate which is highlighted in the dynamic 45
tree) indicates that the drivers did not strictly follow the warning devices. It is also seen that 3 out 46

Mathew, J., Benekohal, R.F., and Medina, J.C., 12
of 5 accidents which involved the driver driving around the gate involved the vehicle striking the 1
train (which is less common in the database as opposed to accidents involving the train striking 2
the vehicle). The crossing cluster variable reveals that there were 3 accidents out of 7 that involved 3
the vehicle striking the train. Using this information extracted from the dynamic tree an analyst 4
should be interested in further examining the cause of these frequent gate violations. 5
6
7 (a) - Aerial view of Crossing 608311K 8
9 (b) – Static Tree for Crossing 10
11
12 (c) Tree Using M+C 13
FIGURE 4: Accident visualization tree for crossing 608311K. 14

Mathew, J., Benekohal, R.F., and Medina, J.C., 13
1
High Accident Crossing in California: Vehicles Frequently Stopped/Trapped on Crossing 2
The crossing with ID 811479J is located at the crossing of Nogales St and UP rail line in Los 3
Angeles, California. 9 accidents occurred in 10 years (2005-2014). The tree developed for 811479J 4
using the static method and dynamic method using nested sorting method is given in Figure 5(b) 5
and Figure 5(c) respectively. 6
7 (a) - Aerial view of Crossing 811479J 8
9 (b) Static Tree for Crossing 10
11
12 *A trailer was involved in one accident, #4 accidents occurred on FRA Track Class 4 13
(c) Tree Using M+C 14
FIGURE 5: Accident visualization tree for crossing 811479J. 15
s s s s
*
#

Mathew, J., Benekohal, R.F., and Medina, J.C., 14
More information about the accidents at crossing 811479J is observed from M+C, as seen in Figure 1
5(c). All the nine accidents involved a south bound vehicle and eight out of the nine accidents 2
happened during PM hours. Five out of the 8 motorist accidents were in the subcategory of 3
“stopped on the crossing” while three of them were in “trapped”, the latter being a less common 4
subcategory in general (highlighted in the crossing cluster). Five out of the 9 accidents involved 5
trains on FRA track class 5, indicating the speed limit of the trains. From the tree, it could be 6
deduced that the safety of the crossing is adversely affected during the PM hours. An analyst 7
should be interested in further investing the reason for such an occurrence. The dynamic tree thus 8
gives more information about the accidents at the crossing as compared to the Static Method. 9
The next example illustrates the use of M+C method on a rail corridor with several grade 10
level crossings. Low frequency of accidents poses a challenge in identifying accident trends at a 11
location. A corridor based analysis can overcome this challenge and this procedure helps the 12
analyst to visually observe the data and identify the accident trends over various locations. This is 13
explained in the following example. 14
15
Corridor in Illinois: Disproportionate Distribution of Train Direction Identified 16
8 crossings (as shown in Figure 6) were selected along the Northeast Illinois Regional Commuter 17
Corridor. A total of 23 accidents were observed on the 8 crossings over a span of 10 years from 18
2002 to 2011. 19
20 FIGURE 6: Selected crossings along corridor. 21
The dynamic tree generated using M+C is given in Figure 7. 22

Mathew, J., Benekohal, R.F., and Medina, J.C., 15
1 FIGURE 7: Tree Using M+C for corridor. 2
There is a disproportionate number of southbound trains (highlighted in the figure) within the 17 3
accidents that involved a train striking a highway vehicle. The 6 accidents (highlighted at the 4
bottom of the tree) involving a driver moving over the crossing also involved the drivers moving 5
around the gate. From the crossing cluster, it is seen that 14 out of 23 accidents occurred during 6
PM hours. Among the information found from the tree, the analyst with the newly found 7
information should be interested in examining a reason for frequent accidents involving 8
southbound trains and for the frequent gate violations (in 15 cases out of 22 highlighted in the 9
corridor cluster). 10
It is noted that these observations cannot be made by analyzing each individual crossing 11
because of the low number of accidents. This procedure thus aids in the collective investigation of 12
the accidents over multiple crossings. 13
14

Mathew, J., Benekohal, R.F., and Medina, J.C., 16
It has been shown from the various examples illustrated in this paper that the M+C method is 1
effective in spotting contributing factors to accidents at a local level. The unique tree-based 2
structure created for each crossing(s) analyzed makes it easy for an analyst to detect trends which 3
could otherwise remain hidden in the database if not for careful and time-consuming inspection. 4
This micro-level approach could be easily used to focus on the characteristics of a given crossing 5
or group of crossings to suggest improvements specific to each analyzed crossing(s). 6
7
SUGGESTIONS TO EXTRACT ADDITIONAL INFORMATION FROM DATABASE 8
The dynamic tree method has been shown to be useful to extract information from a database. An 9
improved database can be used to extract more information. Some of the suggested improvements 10
to the accident database are 11
12
1. Use of hybrid attributes like day of the week (using YEAR, MONTH, DAY), time of 13
incident (using TIMEHR, AMPM) etc. to generate new information from existing data 14
available in the FRA database. 15
2. Linking the FRA accident database to other external databases (e.g. census database). This 16
added data could be very useful in further exploration of the accident contributing factors. 17
18
CONCLUSIONS AND FUTURE WORK 19
Extracting useful information from the FRA accident database for safety improvements is a 20
cumbersome task and this paper presented a new tool to overcome this difficulty. The M+C method 21
creates a data-driven dynamic tree that prioritizes attribute values to find the greatest accident 22
concentration along a tree branch. A computer program implementing the M+C method was 23
developed in C++ to significantly reduce analysis time, avoid human error, and allow distribution 24
to researchers and practitioners upon request to the authors. 25
M+C is an improvement over static algorithms as it uses a more comprehensive set of 26
variables and a prioritization algorithm. The algorithm also uses a mechanism to prioritize 27
attributes that show equally strong trends within a single crossing by considering the attribute 28
trends across multiple crossings in the analysis. Examples illustrated in this paper showed that the 29
M+C method can be used to analyze a single crossing or a group of crossings altogether, for 30
example along a corridor. The method was also able to reveal useful information towards 31
identification of safety improvements, and it is more effective at doing so than a method where the 32
order in which the attributes are analyzed is pre-determined. The inclusion of additional computed 33
variables derived from fields in the current database, such as “Day of the week” or “Time of day” 34
may be also explored by an analyst to extract time-related patterns. In addition, linking additional 35
data sources (e.g. census data, geographic features, GIS layers) to this method may open a wide 36
range of otherwise unforeseen trends that can be uncovered by the dynamic tree. 37
The computerization of the M+C algorithm opens new avenues for future research. For 38
example, the simultaneous analysis of extended number of crashes and locations can reveal local 39
and regional trends not accessible to analysts before. Also, the algorithm can help group crossings 40
with “similar” nested accident trends, pointing to common crossing characteristics for safety 41
improvements that would otherwise be very difficult to identify. Furthermore, the dynamic tree 42
has the potential to be used to improve macro-level accident prediction models by identifying 43
factors from the M+C method to be tested in the model when analyzing specific crossings. 44
45

Mathew, J., Benekohal, R.F., and Medina, J.C., 17
REFERENCES 1
2
1. "Crossing Collisions and Casualties by Year." Operation Lifesaver, Inc. N.p., n.d. Web. 23 3
July 2016. https://oli.org/about-us/news/collisions-casulties. 4
5
2. Schultz, Thomas Gordon (1965). "Evaluation of Safety at Railroad Highway Grade 6
Crossing." 7
8
3. Yan, X., Richards, S., & Su, X. (2010). Using hierarchical tree-based regression model to 9
predict train–vehicle crashes at passive highway-rail grade crossings. Accident Analysis 10
& Prevention, 42(1), 64-74. 11
12
4. Medina, J. C., Shen, S., & Benekohal, R. F. (2014, May). Microscopic Analysis for 13
Accident Data at Railroad Grade Crossings. In T&DI Congress 2014. pp. 366-375. ASCE. 14
15
5. U.S. DOT and Federal Highway Administration. Railroad-highway Grade Crossing 16
Handbook. Washington D.C., 2007 17
18
6. Medina, J. C., & Benekohal, R. R. F. (2015). Macroscopic Models for Accident Prediction 19
at Railroad Grade Crossings and Comparisons with the USDOT Accident Prediction 20
Formula. In Transportation Research Board 94th Annual Meeting (No. 15-5109). 21
22
7. Accident Database from the FRA website http://safetydata.fra.dot.gov/ 23
24
8. Accident Database File Structure from FRA website http://safetydata.fra.dot.gov/ 25
26
9. Office of Railroad Safety, Federal Railroad Administration (2014, Jan). Track and Rail and 27
Infrastructure Integrity Compliance Manual: Volume II-Chapter 1-Track Safety Standards- 28
Classes 1 through 5. Pages 15-16 29
30
31
32


![[Nielsen L.E., Landel R.F.] Mechanical Properties (BookFi.org)](https://static.fdocuments.in/doc/165x107/563dbb9e550346aa9aaec22d/nielsen-le-landel-rf-mechanical-properties-bookfiorg.jpg)


![Romanism & the Reformers [1915] - Sample, R.F.](https://static.fdocuments.in/doc/165x107/577cdda71a28ab9e78ad7b32/romanism-the-reformers-1915-sample-rf-pdf.jpg)