MSc Statistics MSc Statistics (Financial Statistics) MSc ...
Upload
truongcongCategory
view
218download
0
9th Annual International Conference on Mathematics & Statistics: Education & Applications, 1st Annual International Conference on Formal Sciences, 9th Annual International Conference on Statistics, 29-30 June &
1-2 July 2015, Athens, Greece: Abstract Book
1
Mathematics & Statistics, Formal Sciences, Statistics Abstracts Ninth Annual International Conference on Mathematics & Statistics: Education & Applications, First Annual International Conference on Formal Sciences, Ninth Annual International Conference on Statistics, 29-30 June & 1-2 July 2015, Athens, Greece Edited by Gregory T. Papanikos
2015
THE ATHENS INSTITUTE FOR EDUCATION AND RESEARCH

9th Annual International Conference on Mathematics & Statistics: Education & Applications, 1st Annual International Conference on Formal Sciences, 9th Annual International Conference on Statistics, 29-30 June &
1-2 July 2015, Athens, Greece: Abstract Book
2
9th Annual International Conference on Mathematics & Statistics: Education & Applications, 1st Annual International Conference on Formal Sciences, 9th Annual International Conference on Statistics, 29-30 June &
1-2 July 2015, Athens, Greece: Abstract Book
3
Mathematics & Statistics, Formal Sciences, Statistics
Abstracts
9th Annual International Conference on Mathematics &
Statistics: Education & Applications, 1st Annual
International Conference on Formal Sciences, 9th Annual International Conference on
Statistics, 29-30 June & 1-2 July 2015, Athens, Greece
Edited by Gregory T. Papanikos

9th Annual International Conference on Mathematics & Statistics: Education & Applications, 1st Annual International Conference on Formal Sciences, 9th Annual International Conference on Statistics, 29-30 June &
1-2 July 2015, Athens, Greece: Abstract Book
4
First Published in Athens, Greece by the Athens Institute for Education and
Research.
ISBN: 978-960-598-013-9
All rights reserved. No part of this publication may be reproduced, stored,
retrieved system, or transmitted, in any form or by any means, without the
written permission of the publisher, nor be otherwise circulated in any form of
binding or cover.
8 Valaoritou Street
Kolonaki, 10671 Athens, Greece
www.atiner.gr
©Copyright 2015 by the Athens Institute for Education and Research. The individual essays remain the intellectual properties of the contributors.

9th Annual International Conference on Mathematics & Statistics: Education & Applications, 1st Annual International Conference on Formal Sciences, 9th Annual International Conference on Statistics, 29-30 June &
1-2 July 2015, Athens, Greece: Abstract Book
5
TABLE OF CONTENTS
(In Alphabetical Order by Author's Family name) Preface 9
Conference Program 11
1. Characterizations of Distributions via Regression Properties of Order Statistics from Extended Sample Mohammad Ahsanullah
16
2. Aggregation of AR Models for Prediction using Online Optimization Basad Al-Sarray, Stephane Chretien, Yacouba Boubacar Mainassara & Bruno Saussereau
17
3. Some Notes on the Calculations of the Continued Exponents Hossein Behforooz
18
4. A Statistical Analysis of Preference of Wall Colour in Long-Term Healthcare Environments Penelope Bidgood
19
5. Visual Representation of Natural Frequencies Improves Bayesian Reasoning Karin Binder, Stefan Krauss & Georg Bruckmaier
20
6. Mathematical Education in the Italian Project FSTF Enzo Bonacci
21
7. ARIMA Method for Estimation and Forecasting of Data from Higher Education Marilena Aura Din
22
8. Wavelet Analysis on Homogenous Spaces Fatemeh Esmaeelzadeh
23
9. Children’s Mathematical Knowledge: What is being Assessed? Ali Fleming, Azita Manouchehri & Monelle Gomez
24
10. Increasing K-12 Mathematics Teachers’ Content Knowledge Monelle Gomez, Azita Manouchehri & Ali Fleming
25
11. Exchangeability and Extreme Value Distributions: Applications to Financial Risk Modelling Chun-Kai Huang, Delia North & Temesgan Zewotir
27
12. An Empirical Analysis of the Permanent Income Hypothesis (PIH) in the Context of BRICS Countries Chun-Sung Huang, Natasha Collier, Jenna McWilliams & Benjamin Rath
28
13. Measuring Impact of Correlations on Final-Weights of Technical Attributes in Quality Function Deployment Zafar Iqbal, Nigel Grigg & Nicky Campbell-Allen
29
14. Applications of Large Deviations to some Nonparametric Tests Cyrille Joutard
30
15. Joint Variance Prior for the Analysis of Random Effects Models Zeynep Kalaylioglu & Haydar Demirhan
31

9th Annual International Conference on Mathematics & Statistics: Education & Applications, 1st Annual International Conference on Formal Sciences, 9th Annual International Conference on Statistics, 29-30 June &
1-2 July 2015, Athens, Greece: Abstract Book
6
16. The New Psychometric Entrance Test – A Multi – Faceted Validity Analysis Dvir Kleper & Noa Saka
32
17. Modelling with Mathematics and Structural Knowledge: Building Capacity among K-12 Teachers Azita Manouchehri, Monelle Gomez & Ali Fleming
33
18. Uptake of Mammography Screening: Is Obesity an Impediment? Abhinav Mehta
34
19. Two-Sample Hypothesis Testing on Evolutionary Trees Martina Mincheva
36
20. Semi-Closed Fuzzy Sets and Semi-Continuous Functions in Fuzzy Topological Spaces Ashwini Kumar Mishra
37
21. On Using Copulas to Test for a Two Component Bivariate Mixture Distribution Ampalavanar Nanthakumar
38
22. Making Use of Dynamic Software and Mathematical Tools in the Solution of Extremum Problems in Triangle Geometry Victor Oxman, Moshe Stupel & Ruti Segal
40
23. Revising Some Design Criteria Diarmuid O’Driscoll & Donald Ramirez
41
24. The Pedagogical Aspects of Non-Routine Problem Solving in Mathematics Santhanam Ramachandran
42
25. Some Existence Results on Competitive Economic Equilibrium by Using Variational Approach Francesco Rania & Giovanni Anello
43
26. Dimensions of Knowledge and Ways of Thinking of Irrational Numbers Layal Saikaly & Nina Hayfa
44
27. Surprising Investigation of Loci Using Dynamic Software Ruti Segal, Moshe Stupel & Victor Oxman
45
28. Cross-curriculum Integration of Mathematics in Secondary Schools Praneetha Singh
47
29. Large and Moderate Deviation Principles for Nonrecursive and Recursive Estimators of a Regression Function Yousri Slaoui
48
30. Exponential Dichotomy versus Exponential Splitting for Skew-evolution Semiflows in Infinite Dimensional Spaces Codruta Stoica
49
31. An Examination of Plausible Score Correlation from the Trend in Mathematics and Science Study Jianjun Wang & Xin Ma
50
32. Statistical Methods in the Educational Researches Olga Yanushkevichiene & Romanas Yanushkevichius
51

9th Annual International Conference on Mathematics & Statistics: Education & Applications, 1st Annual International Conference on Formal Sciences, 9th Annual International Conference on Statistics, 29-30 June &
1-2 July 2015, Athens, Greece: Abstract Book
7
33. Selecting Models via Multivariate Weighted Information Measures Salimeh Yasaei Sekeh & Adriano Polpo de Campos
52
34. Variable Selection and Flexible Smoothing in Semiparametric Regression Takuma Yoshida
53
35. Choosing a Covariate-Adaptive Rule Maroussa Zagoraiou
54
36. Dynamic D-Vine Copula Model with Applications to Value-at-Risk (VaR) Flavio Ziegelmann, Paula Tofoli, Osvaldo Candido Silva-Filho & Pedro Valls Pereira
55

9th Annual International Conference on Mathematics & Statistics: Education & Applications, 1st Annual International Conference on Formal Sciences, 9th Annual International Conference on Statistics, 29-30 June &
1-2 July 2015, Athens, Greece: Abstract Book
8

9th Annual International Conference on Mathematics & Statistics: Education & Applications, 1st Annual International Conference on Formal Sciences, 9th Annual International Conference on Statistics, 29-30 June &
1-2 July 2015, Athens, Greece: Abstract Book
9
Preface
This abstract book includes all the abstracts of the papers presented at the 9th Annual International Conference on Mathematics & Statistics: Education & Applications, 1st Annual International Conference on Formal Sciences and 9th Annual International Conference on Statistics, 29-30 June & 1-2 July 2015, Athens, Greece, organized by the Athens Institute for Education and Research. In total there were 36 papers and presenters, coming from 18 different countries (Australia, Brazil, France, Germany, India, Iran, Ireland, Israel, Italy, Japan, Lebanon, Lithuania, New Zealand, Romania, South Africa, Turkey, UK and USA). The conference was organized into eight sessions that included areas of Mathematics and Statistics. As it is the publication policy of the Institute, the papers presented in this conference will be considered for publication in one of the books and/or journals of ATINER.
The Institute was established in 1995 as an independent academic organization with the mission to become a forum where academics and researchers from all over the world could meet in Athens and exchange ideas on their research and consider the future developments of their fields of study. Our mission is to make ATHENS a place where academics and researchers from all over the world meet to discuss the developments of their discipline and present their work. To serve this purpose, conferences are organized along the lines of well established and well defined scientific disciplines. In addition, interdisciplinary conferences are also organized because they serve the mission statement of the Institute. Since 1995, ATINER has organized more than 150 international conferences and has published over 100 books. Academically, the Institute is organized into four research divisions and nineteen research units. Each research unit organizes at least one annual conference and undertakes various small and large research projects.
I would like to thank all the participants, the members of the organizing and academic committee and most importantly the administration staff of ATINER for putting this conference together.
Gregory T. Papanikos President

9th Annual International Conference on Mathematics & Statistics: Education & Applications, 1st Annual International Conference on Formal Sciences, 9th Annual International Conference on Statistics, 29-30 June &
1-2 July 2015, Athens, Greece: Abstract Book
10

9th Annual International Conference on Mathematics & Statistics: Education & Applications, 1st Annual International Conference on Formal Sciences, 9th Annual International Conference on Statistics, 29-30 June &
1-2 July 2015, Athens, Greece: Abstract Book
11
FINAL CONFERENCE PROGRAM 9th Annual International Conference on Mathematics & Statistics:
Education & Applications, 1st Annual International Conference on Formal Sciences, 9th Annual International Conference on Statistics,
29-30 June & 1-2 July 2015, Athens, Greece
PROGRAM
Conference Venue: Titania Hotel, 52 Panepistimiou Avenue, Athens, Greece
1. Dr. Gregory T. Papanikos, President, ATINER & Honorary Professor, University
of Stirling, UK. 2. Dr. George Poulos, Vice-President of Research, ATINER & Emeritus Professor,
University of South Africa, South Africa. 3. Dr. Alexander Makedon, Head, Education Research Unit, ATINER& Professor of
Philosophy of Education, Arellano University, Philippines. 4. Dr. Constantine Georgakis, Academic Member, ATINER & Associate
Professor, DePaulUniversity, USA. 5. Dr. Codruta Stoica, Head, Formal Research Unit, ATINER & Associate
Professor, Aurel Vlaicu University, Romania. 6. Dr. Panagiotis Petratos, Vice President of ICT, ATINER, Fellow, Institution of
Engineering and Technology & Professor, Department of Computer Information Systems, California State University, Stanislaus, USA.
7. Dr. Nicholas Pappas, Vice-President of Academics, ATINER, Greece & Professor, Sam Houston University, USA.
8. Dr. Chris Sakellariou, Vice President of Financial Affairs, ATINER, Greece & Associate Professor, Nanyang Technological University, Singapore.
9. Ms. Olga Gkounta, Researcher, ATINER.
Administration Stavroula Kyritsi, Konstantinos Manolidis, Katerina Maraki & Kostas Spiropoulos
Monday 29 June 2015 (all sessions include 10 minutes break)
08:00-08:30 Registration and Refreshments
08:30-09:00 (ROOM A) Welcome & Opening Remarks
Dr. Gregory T. Papanikos, President, ATINER & Honorary Professor, University of Stirling, UK.
Dr. George Poulos, Vice-President of Research, ATINER & Emeritus Professor, University of South Africa, South Africa.

9th Annual International Conference on Mathematics & Statistics: Education & Applications, 1st Annual International Conference on Formal Sciences, 9th Annual International Conference on Statistics, 29-30 June &
1-2 July 2015, Athens, Greece: Abstract Book
12
09:00-11:00 Session I (ROOM A): Mathematics and Statistics: Education & Applications I
Chair: George Poulos, Vice-President of Research, ATINER & Emeritus Professor, University of South Africa, South Africa.
1. *Diarmuid O’Driscoll, Head, Department of Mathematics, Mary Immaculate College, Ireland & Donald Ramirez, Professor, University of Virginia, USA. Revising Some Design Criteria. (EMS)
2. Jianjun Wang, Professor, California State University, USA & Xin Ma, University of Kentucky, USA. An Examination of Plausible Score Correlation from the Trend in Mathematics and Science Study. (STA)
3. Marilena Aura Din, Associate Professor, Romanian American University of Bucharest, Romania. ARIMA Method for Estimation and Forecasting of Data from Higher Education. (EMS)
4. Abhinav Mehta, Associate Lecturer, The Australian National University, Australia. Uptake of Mammography Screening: Is Obesity an Impediment? (STA)
5. Olga Yanushkevichiene, Professor, Vilnius University, Lithuania & Romanas Yanushkevichius, Professor, Lithuanian University of Educational Sciences, Lithuania. Statistical Methods in the Educational Researches. (EMS)
6. Victor Oxman, Senior Lecturer, Western Galilee College, Shaanan College, Israel, Moshe Stupel, Professor, Shaanan College, Israel & Ruti Segal, Senior Lecturer, Oranim College, Shaanan College, Israel. Making Use of Dynamic Software and Mathematical Tools in the Solution of Extremum Problems in Triangle Geometry. (EMS)
11:00-12:30 Session II (ROOM A): Statistics I
Chair: *Diarmuid O’Driscoll, Head, Department of Mathematics, Mary Immaculate College, Ireland
1. *Mohammad Ahsanullah, Professor, Rider University, USA. Characterizations of Distributions via Regression Properties of Order Statistics from Extended Sample. (STA)
2. Yousri Slaoui, Associate Professor, University of Poitiers, France. Large and Moderate Deviation Principles for Nonrecursive and Recursive Estimators of a Regression Function. (STA)
3. Cyrille Joutard, Associate Professor, Paul Valery University of Montpellier, France. Applications of Large Deviations to some Nonparametric Tests. (STA)
4. Zafar Iqbal, Ph.D. Student, Massey University, New Zealand, Nigel Grigg & Nicky Campbell-Allen, Massey University, New Zealand. Measuring Impact of Correlations on Final-Weights of Technical Attributes in Quality Function Deployment. (STA)
12:30-13:30 Lunch

9th Annual International Conference on Mathematics & Statistics: Education & Applications, 1st Annual International Conference on Formal Sciences, 9th Annual International Conference on Statistics, 29-30 June &
1-2 July 2015, Athens, Greece: Abstract Book
13
13:30-15:30 Session III (ROOM A): Statistics II
Chair: *Mohammad Ahsanullah, Professor, Rider University, USA.
1. *Flavio Ziegelmann, Associate Professor, Federal University of Rio Grande do Sul – UFRGS, Brazil, Paula Tofoli, Professor, Catholic University of Brasilia, Brazil, Osvaldo Candido Silva-Filho, Professor, Catholic University of Brasilia, Brazil & Pedro Valls Pereira, Professor, Fundacao Getulio Vargas Sao Paulo, Brazil. Dynamic D-Vine Copula Model with Applications to Value-at-Risk (VaR). (STA)
2. Zeynep Kalaylioglu, Associate Professor, Middle East Technical University, Turkey & Haydar Demirhan, Hacettepe University, Turkey. Joint Variance Prior for the Analysis of Random Effects Models. (STA)
3. Martina Mincheva, Assistant Professor, Temple University, USA. Two-Sample Hypothesis Testing on Evolutionary Trees. (STA)
4. Takuma Yoshida, Assistant Professor, Kagoshima University, Japan. Variable Selection and Flexible Smoothing in Semiparametric Regression. (STA)
5. Salimeh Yasaei Sekeh, Post Doctoral Fellow, Federal University of Sao Carlos, Brazil & Adriano Polpo de Campos, Associate Professor, Federal University of Sao Carlos, Brazil. Selecting Models via Multivariate Weighted Information Measures. (STA)
15:30-17:30 Session IV (ROOM A): Mathematics and Statistics: Education &
Applications II
Chair: *Flavio Ziegelmann, Associate Professor, Federal University of Rio Grande do Sul – UFRGS, Brazil
1. *Santhanam Ramachandran, Secretary, The Association of Mathematics Teachers of India, India. The Pedagogical Aspects of Non-Routine Problem Solving in Mathematics. (EMS)
2. Monelle Gomez, Ph.D. Student, The Ohio State University, USA, Azita Manouchehri, Professor & Ali Fleming, Ph.D. Student, The Ohio State University, USA. Increasing K-12 Mathematics Teachers’ Content Knowledge. (EMS)
3. Dvir Kleper, Research Scientist, National Institute for Testing and Evaluation, Israel & Noa Saka, Senior Lecturer, Hebrew University of Jerusalem and National Institute for Testing and Evaluation, Israel. The New Psychometric Entrance Test – A Multi – Faceted Validity Analysis. (EMS)
4. *Praneetha Singh, Assistant Head of Mathematics and Convener, The Hills Grammar School, NSW and Australian Independent School Mathematics Professional Learning, Australia. Cross-curriculum Integration of Mathematics in Secondary Schools. (EMS)
21:00-23:00 Greek Night and Dinner (Details during registration)

9th Annual International Conference on Mathematics & Statistics: Education & Applications, 1st Annual International Conference on Formal Sciences, 9th Annual International Conference on Statistics, 29-30 June &
1-2 July 2015, Athens, Greece: Abstract Book
14
Tuesday 30 June 2015
09:00-11:00 Session V (ROOM A): Statistics III
Chair: *Santhanam Ramachandran, Secretary, The Association of Mathematics Teachers of India, India.
1. *Ampalavanar Nanthakumar, Professor, State University of New York at Oswego, USA. On Using Copulas to Test for a Two Component Bivariate Mixture Distribution. (STA)
2. Maroussa Zagoraiou, Assistant Professor, University of Calabria, Italy. Choosing a Covariate-Adaptive Rule. (STA)
3. Chun-Sung Huang, Senior Lecturer, University of Cape Town, South Africa, Natasha Collier, Jenna McWilliams & Benjamin Rath, University of Cape Town, South Africa. An Empirical Analysis of the Permanent Income Hypothesis (PIH) in the Context of BRICS Countries. (STA)
4. Chun-Kai Huang, Lecturer, University of Cape Town, South Africa, Delia North, Associate Professor, University of KwaZulu-Natal, South Africa & Temesgan Zewotir, Associate Professor, University of KwaZulu-Natal, South Africa. Exchangeability and Extreme Value Distributions: Applications to Financial Risk Modelling. (STA)
Basad Al-Sarray, Ph.D. Student, University of Franche-Comté, France, Stephane Chretien, Professor, University of Franche-Comté, France, Yacouba Boubacar Maĩnassara, Assistant Professor, University of Franche-Comté, France & Bruno Saussereau, Professor, University of Franche-Comté, France. Aggregation of AR Models for Prediction using Online Optimization. (STA)
11:00-12:30 Session VI (ROOM A): Mathematics and Statistics: Education & Applications III
Chair: *Codruta Stoica, Associate Professor, Aurel Vlaicu University of Arad, Romania.
1. Hossein Behforooz, Professor, Utica College, USA. Some Notes on the Calculations of the Continued Exponents. (EMS)
2. Francesco Rania, Assistant Professor, University Magna Graecia of Catanzaro, Italy & Giovanni Anello, Associate Professor, University of Messina, Italy. Some Existence Results on Competitive Economic Equilibrium by Using Variational Approach. (EMS)
3. Penelope Bidgood, Honorary Fellow, Kingston University, U.K. A Statistical Analysis of Preference of Wall Colour in Long-Term Healthcare Environments. (EMS)
4. Karin Binder, Ph.D. Student, University of Regensburg, Germany, Stefan Krauss, Professor, University of Regensburg, Germany & Georg Bruckmaier, Research Scientist, University of Regensburg, Germany. Visual Representation of Natural Frequencies Improves Bayesian Reasoning. (EMS)
5. Ali Fleming, Ph.D. Student, The Ohio State University, USA, Azita Manouchehri, Professor & Monelle Gomez, Ph.D. Student, The Ohio State University, USA. Children’s Mathematical Knowledge: What is being Assessed? (EMS)
12:30-13:30 Lunch

9th Annual International Conference on Mathematics & Statistics: Education & Applications, 1st Annual International Conference on Formal Sciences, 9th Annual International Conference on Statistics, 29-30 June &
1-2 July 2015, Athens, Greece: Abstract Book
15
13:30-15:00 Session VII (ROOM A): Formal Sciences
Chair: *Ampalavanar Nanthakumar, Professor, State University of New York at Oswego, USA
1. Ashwini Kumar Mishra, Associate Professor, B.N. Mandal University, India. Semi-Closed Fuzzy Sets and Semi-Continuous Functions in Fuzzy Topological Spaces. (EMS)
2. *Codruta Stoica, Associate Professor, Aurel Vlaicu University of Arad, Romania. Exponential Dichotomy versus Exponential Splitting for Skew-evolution Semiflows in Infinite Dimensional Spaces. (FOR)
3. Fatemeh Esmaeelzadeh, Assistant Professor, Assistant Professor, Department of mathematics, Bojnourd Branch, Islamic Azad University, Bojnourd, Iran. Wavelet Analysis on Homogenous Spaces. (EMS)
15:00-16:30 Session VII (ROOM A): Mathematics and Statistics: Education & Applications IV
Chair: Olga Gkounta, Researcher, ATINER.
1. Azita Manouchehri, Professor, The Ohio State University, USA, Monelle Gomez, Ph.D. Student, The Ohio State University, USA & Ali Fleming, Ph.D. Student, The Ohio State University, USA. Modelling with Mathematics and Structural Knowledge: Building Capacity among K-12 Teachers. (EMS)
2. Ruti Segal, Senior Lecturer, Oranim College, Shaanan College, Israel, Moshe Stupel, Professor, Shaanan College, Israel & Victor Oxman, Senior Lecturer, Western Galilee College, Shaanan College, Israel. Surprising Investigation of Loci Using Dynamic Software. (EMS)
3. Enzo Bonacci, Teacher, Scientific High School “G.B. Grassi” of Latina, Italy. Mathematical Education in the Italian Project FSTF. (EMS)
4. Layal Saikaly, MSc Student, Lebanese University, Lebanon & Nina Hayfa, Post Doctoral Fellow, Lebanese University, Lebanon. Dimensions of Knowledge and Ways of Thinking of Irrational Numbers. (EMS)
17:30-20:00 Urban Walk (Details during registration)
20:30- 22:00 Dinner (Details during registration)
Wednesday 1 July 2015 Cruise: (Details during registration)
Thursday 2 July 2015 Delphi Visit: (Details during registration)

9th Annual International Conference on Mathematics & Statistics: Education & Applications, 1st Annual International Conference on Formal Sciences, 9th Annual International Conference on Statistics, 29-30 June &
1-2 July 2015, Athens, Greece: Abstract Book
16
Mohammad Ahsanullah Professor, Rider University, USA
Characterizations of Distributions via Regression Properties of Order Statistics from Extended Sample
Suppose X1,X2,…Xn are n independent and identically distributed
random variables with a common continuous distribution function F(x), Let X1,n<X2,n < ….< Xn,n be the corresponding order statistics, Some time we may have m additional independent observations from the same distribution, F(x). Now we consider the order statistics of the n+m observations. Some characterizations of F(x) using the regression properties of E(Xi,h XjXj,n+m =x) , 1<i<n, i<j<n+m) will be presented.

9th Annual International Conference on Mathematics & Statistics: Education & Applications, 1st Annual International Conference on Formal Sciences, 9th Annual International Conference on Statistics, 29-30 June &
1-2 July 2015, Athens, Greece: Abstract Book
17
Basad Al-Sarray Ph.D. Student, University of Franche-Comté, France
Stephane Chretien Professor, University of Franche-Comté, France
Yacouba Boubacar Maĩnassara Assistant Professor, University of Franche-Comté, France
& Bruno Saussereau
Professor, University of Franche-Comté, France
Aggregation of AR Models for Prediction using Online Optimization
The goal of this paper is to study the Model Order estimation
problem for Auto-Regressive time series based on a well known online learning algorithm: the Exponential Weighting Algorithm.

9th Annual International Conference on Mathematics & Statistics: Education & Applications, 1st Annual International Conference on Formal Sciences, 9th Annual International Conference on Statistics, 29-30 June &
1-2 July 2015, Athens, Greece: Abstract Book
18
Hossein Behforooz Professor, Utica College, USA
Some Notes on the Calculations of the Continued Exponents
Continued radicals and continued fractions are very popular and
interesting subjects to study in Number Theory and Real Analysis. In this talk many interesting continued exponent problems (Towers of Powers) will be presented and discussed. Also I will mention a bad news that, almost all of our current graphing calculators, math software and many new born electronic devices such as smartphones or math programs or calculators in digital worlds are not well-defined and do not follow the mathematical conventional rules in calculating double or higher order of exponents. This part will be an educational note and comment in calculating higher order iterated exponentials.
9th Annual International Conference on Mathematics & Statistics: Education & Applications, 1st Annual International Conference on Formal Sciences, 9th Annual International Conference on Statistics, 29-30 June &
1-2 July 2015, Athens, Greece: Abstract Book
19
Penelope Bidgood Honorary Fellow, Kingston University, UK
A Statistical Analysis of Preference of Wall Colour in Long-Term Healthcare Environments
This research aimed to provide empirical evidence of preferences for
wall colour in rooms typical of those found in long-term healthcare environments. Generally, residents in such facilities live in very confined spaces; there is evidence that the design of these spaces can impact in important ways on users. Wall colour is a key aspect of this design, and one which can be manipulated at modest cost.
In this study, a sample of 112 subjects, stratified for age and gender, selected preferred colours for three room types (bedroom, dayroom and corridor) from a choice of 90 colours, defined in terms of different hues and levels of brightness and saturation. Logistic regression modelling was carried out to identify which factors could predict whether a colour would be chosen or not. The explanatory variables were the three colour constituents - hue, brightness, saturation. Statistical analysis yielded a number of significant effects, the most striking being for brightness and saturation. Through their choices, subjects expressed a very clear preference for pale colours with low levels of saturation, regardless of hue, although there were some differences depending on type of room.

9th Annual International Conference on Mathematics & Statistics: Education & Applications, 1st Annual International Conference on Formal Sciences, 9th Annual International Conference on Statistics, 29-30 June &
1-2 July 2015, Athens, Greece: Abstract Book
20
Karin Binder Ph.D. Student, University of Regensburg, Germany
Stefan Krauss Professor, University of Regensburg, Germany
& Georg Bruckmaier
Research Scientist, University of Regensburg, Germany
Visual Representation of Natural Frequencies Improves Bayesian Reasoning
In their research articles, scholars often use 2 x 2 tables or tree
diagrams including natural frequencies in order to illustrate Bayesian reasoning situations to their peers. Interestingly, these visualizations differ from the diagrams that are commonly applied in empirical studies to improve participants’ performance (e. g., Euler diagrams, icon arrays, roulette wheel diagrams). In the talk, we report on an empirical study (3 x 2 x 2 design) in which we systematically vary visualization (no visualization vs. 2 x 2 table vs. tree diagram) and information format (probabilities vs. natural frequencies) for two contexts (medical vs. economical context). Each of N = 259 participants (students of age 16-18) had to solve two typical Bayesian reasoning tasks (“mammography problem” and “economics problem”). The hypothesis is that 2 x 2 tables and tree diagrams – especially when natural frequencies are included – can foster insight into the notoriously difficult structure of Bayesian reasoning situations. In contrast to many other visualizations (e. g., icon arrays), 2 x 2 tables and tree diagrams have the advantage that they can be constructed easily. The implications of our findings for teaching Bayesian reasoning will be discussed.

9th Annual International Conference on Mathematics & Statistics: Education & Applications, 1st Annual International Conference on Formal Sciences, 9th Annual International Conference on Statistics, 29-30 June &
1-2 July 2015, Athens, Greece: Abstract Book
21
Enzo Bonacci Teacher, Scientific High School “G.B. Grassi” of Latina, Italy
Mathematical Education in the Italian Project FSTF
Two years ago, six brilliant and motivated students of the Scientific High School “G.B. Grassi” in Latina (Italy) joined the educational project “From Soccerene to Fullerene” (acronym FSTF) proposed by five teachers from the Departments of Physical Education and of Mathematics and Physics. The pupils investigated the fullerene buckyball (C60) also known as soccerene for its football-shaped structure (truncated icosahedron). After some calculations, they cut twelve black pentagons and twenty white hexagons and they sewed the plastic polygons together on a polystyrene sphere as faces of a soccer ball; the students repeated the same operation twice, making two almost identical soccer-like balls. The multidisciplinary experience (involving knowledge and skills of Mathematics, Physical Education, Physics and Science) started on March 2013 and ended on June 2013. It was satisfactorily discussed in the 2013 school-leaving examination and elicited a genuine interest during the 100th national conference of the Italian Physical Society in 2014. Now we briefly describe the educational, cognitive, epistemological and heuristic results of the FSTS project, focusing on its mathematical features such as the path of gradual awareness about the difficulty to build a convex solid approximating a sphere and the importance of the thirteen Archimedean solids, often less considered than the five Platonic solids in the pre-university curriculum.

9th Annual International Conference on Mathematics & Statistics: Education & Applications, 1st Annual International Conference on Formal Sciences, 9th Annual International Conference on Statistics, 29-30 June &
1-2 July 2015, Athens, Greece: Abstract Book
22
Marilena Aura Din Associate Professor, Romanian American University of Bucharest,
Romania
ARIMA Method for Estimation and Forecasting of Data from Higher Education
Knowing that the AutoRegressive Integrated Moving Average
(ARIMA) models for estimation and forecasting generally helps understanding the data, and predicts future points, this paper propose to analyze different data from higher education systems within the ARIMA framework given by BoxJenkins Methodology, through the steps of identification, estimation and verification. It is said that ARIMA requires more historical observations than other forecasting methods, so that one of the questions under research is how much of the past data should be used for constructing an appropriate model which is able to provide a better forecast for future student enrollments. The paper is also comparing the method of ARIMA with other methods for enrollment forecasting, and put the corresponding questions about the forecasts accuracy.

9th Annual International Conference on Mathematics & Statistics: Education & Applications, 1st Annual International Conference on Formal Sciences, 9th Annual International Conference on Statistics, 29-30 June &
1-2 July 2015, Athens, Greece: Abstract Book
23
Fatemeh Esmaeelzadeh Assistant Professor, Department of mathematics, Bojnourd Branch,
Islamic Azad University, Bojnourd, Iran
Wavelet Analysis on Homogenous Spaces
The wavelet transform has been an alternative to time frequency analysis. Like time frequency, wavelet transform analysis is a prominent tool in mathematics, physics, applied sciences, signal and
data processing. The continuous wavelet transform on d has been
studied, and generalized to locally compact groups and semidirect product groups.
Ali, Antoine and Gazeau have studied continuous wavelet transform
on a homogenous space HG / using Borel sections, where G is a locally compact group and H is a closed subgroup of G, assuming a G-
invariant measure on HG / . In this paper we study continuous wavelet
transform on a homogeneous space HG / , where G is a locally compact group and H is a compact subgroup of G. We do this task with a completely different approach considering a relatively invariant
measure on HG / . We define a square integrable representation of a
homogenous space HG / on a Hilbert space H. The reconstruction
formula for HG / is established. Also we introduce two-wavelet constants for square integrable representations of homogeneous spaces. We establish the orthogonality relations for square integrable representations of homogeneous spaces which give rise to the existence of a unique self adjoint positive operator on the set of admissible wavelets.

9th Annual International Conference on Mathematics & Statistics: Education & Applications, 1st Annual International Conference on Formal Sciences, 9th Annual International Conference on Statistics, 29-30 June &
1-2 July 2015, Athens, Greece: Abstract Book
24
Ali Fleming PhD Student, The Ohio State University, USA
Azita Manouchehri Professor, The Ohio State University, USA
& Monelle Gomez
Ph.D. Student, The Ohio State University, USA
Children’s Mathematical Knowledge: What is being Assessed?
In 2010, the United States introduced the Common Core State
Standards for Mathematics, which outline the content standards and mathematical dispositions to be achieved by school children nationwide. While a national curriculum is not new to educators across the globe, it is a significant shift in educational policy in the United States, and most notably, it brings changes in the assessment practices of school children. Since what is tested tends to be what is taught and enacted in classrooms, careful investigation of the content and knowledge these new assessments will measure is crucial, as to best prepare teachers and children for them. In a comparison of previous assessments of children’s mathematical knowledge to the upcoming assessments, we found notable differences in the skills and competencies these new assessments will require of children. We noted that previous assessments primarily tested children’s procedural and skill-based knowledge of mathematics, and often allowed children to arrive at a right answer in absence of understanding. In contrast, the new assessments will require that children have a conceptual understanding of mathematics, attend to precise mathematical language, communicate their ideas, and utilize abstract reasoning skills. In our presentation, we will offer illustrative examples of each of the ways the new assessments require that children have a deeper understanding of mathematics in order to demonstrate mathematical proficiency on these assessments. We will focus on items from fourth and fifth grades in order to emphasize the mathematical thinking skills required of children at these grades that have traditionally been expected at higher grade levels. We will conclude by offering suggestions for preparing teachers to facilitate children’s conceptual understanding of mathematics.

9th Annual International Conference on Mathematics & Statistics: Education & Applications, 1st Annual International Conference on Formal Sciences, 9th Annual International Conference on Statistics, 29-30 June &
1-2 July 2015, Athens, Greece: Abstract Book
25
Monelle Gomez Ph.D. Student, The Ohio State University, USA
Azita Manouchehri Professor, The Ohio State University, USA
& Ali Fleming
Ph.D. Student, The Ohio State University, USA
Increasing K-12 Mathematics Teachers’ Content Knowledge
There are many professional development opportunities in the United States that focus on the newest pedagogical techniques that can be used in mathematics classrooms. However, less frequently seen are those that focus on sustaining and enhancing teachers’ content knowledge which is essential for effective teaching. Acquiring robust mathematical content knowledge can be one of the more challenging aspects of teachers’ professional development (Wu, 2011). This study describes a year-long content-specific professional development effort aimed at increasing K-12 teachers’ mathematical content knowledge by engaging teachers in rich mathematical exploration and prolific problem-solving. We describe several vignettes that exemplify teachers interacting with deliberately selected mathematical tasks for guided discovery.
Teachers participated in 4-hour monthly professional development sessions for the entirety of the academic year. The goal of the professional development sessions was to provide teachers with a coherent collection of sophisticated mathematical knowledge in a manner that can be accessible to their students. In order to accomplish this, our sessions began with an opening task that elicited important prior knowledge for scaffolding followed by tasks that provided opportunities for establishing mathematical connection within, among, and across mathematics. The teachers were presented with a task and asked to examine it without imposing a particular structure on their activities. We captured teachers interacting with mathematical ideas that were far beyond the mathematics they teach with the goal to expand their knowledge of K-12 mathematics.
To gauge the degree of content knowledge growth over the course of 36 hours of professional development, the Mathematical Knowledge for Teaching (MKT) (Hill, Schilling, & Ball, 2004) assessment was administered at the beginning and end of the academic year to participating teachers. The data resulted in significant gains in content knowledge. Furthermore, teachers’ content knowledge growth was noticeable in their mathematical reasoning, justification, and ability to make generalizations. We found that allowing teachers to spend time exploring mathematics in the professional development sessions under

9th Annual International Conference on Mathematics & Statistics: Education & Applications, 1st Annual International Conference on Formal Sciences, 9th Annual International Conference on Statistics, 29-30 June &
1-2 July 2015, Athens, Greece: Abstract Book
26
the guidance of mathematics educators enables teachers to be better prepared to anticipate students’ responses, address misconceptions and potential challenges, and acquire the mathematical content knowledge needed for teaching that they might not have otherwise considered.

9th Annual International Conference on Mathematics & Statistics: Education & Applications, 1st Annual International Conference on Formal Sciences, 9th Annual International Conference on Statistics, 29-30 June &
1-2 July 2015, Athens, Greece: Abstract Book
27
Chun-Kai Huang Lecturer, University of Cape Town, South Africa
Delia North Associate Professor, University of KwaZulu-Natal, South Africa
& Temesgan Zewotir
Associate Professor, University of KwaZulu-Natal, South Africa
Exchangeability and Extreme Value Distributions: Applications to Financial Risk Modelling
The generalized extreme value distribution (GEVD) and the
generalized Pareto distribution (GPD) arise as limiting distributions of block maxima and threshold exceedances of a sequence of independent and identically distributed random variables, respectively. These extremal-type theorems are fundamental results in extreme value theory and are widely applied in various fields. Particularly, they can be utilized for risk assessments of extreme losses in financial returns. In this paper, we investigate generalizations of GEVD and GPD to exchangeable random sequences and apply the proposed methodologies to model extreme risks in FTSE/JSE ALSI and S&P500 indices. The parameter prior distributions are estimated through re-sampling using the moving window technique, bootstrapping and jackknifing. Furthermore, the performances of the resulting models are compared via the Kupiec likelihood ratio test for value-at-risk estimation.

9th Annual International Conference on Mathematics & Statistics: Education & Applications, 1st Annual International Conference on Formal Sciences, 9th Annual International Conference on Statistics, 29-30 June &
1-2 July 2015, Athens, Greece: Abstract Book
28
Chun-Sung Huang Senior Lecturer, University of Cape Town, South Africa
Natasha Collier University of Cape Town, South Africa
Jenna McWilliams University of Cape Town, South Africa
& Benjamin Rath
University of Cape Town, South Africa
An Empirical Analysis of the Permanent Income Hypothesis (PIH) in the Context of BRICS Countries
A topic of recent interest is the validity of the Permanent Income
Hypothesis (PIH) in developing countries. In particular, whether such hypothesis holds during periods of market crisis, which is considered an economic anomaly, is not immediately obvious. In this paper, we investigate the PIH in the context of the BRICS countries pre and post the 2008 financial crisis. Our empirical analysis is carried out by first implementing various well-known statistical de-trending filters for data decomposition into its permanent and transitory components. Finally, we conduct various regression analyses to test for the validity of the PIH. Our result provides empirical evidence to support the PIH prior the economic crisis. However, such result is contradicted when tested over post-crisis data. Our findings suggest that, even though PIH holds for the BRICS countries, caution needs to be taken when assessing the PIH over different economic conditions.

9th Annual International Conference on Mathematics & Statistics: Education & Applications, 1st Annual International Conference on Formal Sciences, 9th Annual International Conference on Statistics, 29-30 June &
1-2 July 2015, Athens, Greece: Abstract Book
29
Zafar Iqbal Ph.D. Student, Massey University, New Zealand
Nigel Grigg Massey University, New Zealand
& Nicky Campbell-Allen
Massey University, New Zealand
Measuring Impact of Correlations on Final-Weights of Technical Attributes in Quality Function Deployment
Quality Function Deployment (QFD) makes use of a set of matrices
jointly known as the House of Quality (HOQ). HOQ is a conceptual and strategic map resembling a house - to assemble and summarise the necessary information to develop a new product or service that maximize customer satisfaction by resolving the prioritised necessary technical requirements. There are various elements (rooms) in the HOQ, which can be categorised in to optional and compulsory rooms. It is observed that researchers and practitioners can undervalue the significance of the optional rooms of the HOQ, and do not always use these in the prioritisation of Technical Characteristics (TCs). Correlations between Voice of Customers (VOCs) and between TCs are one of the optional rooms. The first objective of this article is to describe the importance of correlations in QFD studies where ignoring these correlations can deprive to achieve target. The second objective of this article is to do a detailed literature review to explore various methods incorporating the correlations in the roof element of the HOQ. Then finding the potential benefits and shortcoming of these methods. At the end a QFD case study will be used to apply all various heuristics. After deriving results for each, a statistical comparison will be made to find out to what extent they different.

9th Annual International Conference on Mathematics & Statistics: Education & Applications, 1st Annual International Conference on Formal Sciences, 9th Annual International Conference on Statistics, 29-30 June &
1-2 July 2015, Athens, Greece: Abstract Book
30
Cyrille Joutard Associate Professor, Paul Valery University of Montpellier, France
Applications of Large Deviations to some Nonparametric Tests
We establish strong large deviation results for the statistics of two
nonparametric tests, namely the Mann-Whitney test and the Jonckheere-Terpstra test. In other words, we give asymptotic expansions for the tail probabilities of the same kind as those obtained by Bahadur and Rao (1960) for the sample mean. Our proofs make use of arguments of Chaganty and Sethuraman (1993) who also obtained strong large deviation results and local limit theorems for an arbitrary sequence of random variables. We then carry out some numerical comparisons with the exact upper tail probabilities for the Wilcoxon-Mann-Whitney and the Jonckheere-Terpstra tests, under the null hypothesis.

9th Annual International Conference on Mathematics & Statistics: Education & Applications, 1st Annual International Conference on Formal Sciences, 9th Annual International Conference on Statistics, 29-30 June &
1-2 July 2015, Athens, Greece: Abstract Book
31
Zeynep Kalaylioglu Associate Professor, Middle East Technical University, Turkey
& Haydar Demirhan
Hacettepe University, Turkey
Joint Variance Prior for the Analysis of Random Effects Models
In random effects models, total variation in the response variable is
composed of (1) error variance and (2) variance-covariance matrix of the random components. In the Bayesian analysis of such models, we propose modeling (1) and (2) a priori jointly in a multivariate fashion motivated by the fact that (1) and (2) are composite. Our intererst lies in the analysis of cross sectional response variable and longitudinal covariates using a joint modeling approach. Within this framework, we stack up all the variance and covariance components into an array and endorse the use of generalized multivariate log gamma distribution, in particular, to jointly model the variance and covariance components. The rationale for the choice of this particular multivariate variance prior distribution is its benefits as recently shown in Demirhan and Kalaylioglu (2015) such as the lack of sensitivity of the posterior inference to its parameters. We assess and compare through an extensive simulation study the resulting estimation qualities of joint variance prior approach versus the traditional approach in which (1) and (2) are a priori modeled independently. Our joint variance prior approach improves the relative bias and efficiency of the posterior estimators over the traditional approach. However, joint approach should be used with care for sizable random effects variance-covariance matrices. Eventually we apply the method in a study aiming at finding biomarkers for obstetric delivery complication among diabetics pregnant women.

9th Annual International Conference on Mathematics & Statistics: Education & Applications, 1st Annual International Conference on Formal Sciences, 9th Annual International Conference on Statistics, 29-30 June &
1-2 July 2015, Athens, Greece: Abstract Book
32
Dvir Kleper Research Scientist, National Institute for Testing and Evaluation, Israel
& Noa Saka
Senior Lecturer, Hebrew University of Jerusalem and National Institute for Testing and Evaluation, Israel
The New Psychometric Entrance Test – A Multi – Faceted Validity Analysis
This study presents the results of several analyses carried out to test
the construct validity of the new version of the Psychometric Entrance Test, which was first administered in September 2012. A confirmatory factor analysis was employed to test the hypothesis that the empirical construct would be consistent with a three-factor model, describing the three academic areas assessed by the test: Verbal Reasoning, Mathematical Reasoning and English language proficiency. A standard model consisting of these three factors was tested first. Based on the empirical data, the model was revised, and an alternative, non-standard model was proposed. This study also assesses the reliability of these three factors, as well as aspects of the convergent and divergent validity of the test. Results indicate a good fit with the theoretical three-factor model. The non-standard model suggests the existence of correlations between a few of the indicators and additional factors, and shows an even better fit.

9th Annual International Conference on Mathematics & Statistics: Education & Applications, 1st Annual International Conference on Formal Sciences, 9th Annual International Conference on Statistics, 29-30 June &
1-2 July 2015, Athens, Greece: Abstract Book
33
Azita Manouchehri Professor, The Ohio State University, USA
Monelle Gomez Ph.D. Student, The Ohio State University, USA
& Ali Fleming
Ph.D. Student, The Ohio State University, USA
Modelling with Mathematics and Structural Knowledge: Building Capacity among K-12 Teachers
In the US, for the first time in the country’s history, Common Core
Standards for Mathematics (CCSM) were adopted nationally, suggesting a plattform for the content school children are expected to acquire at different grade levels. These standards propose guides for both specific pieces of content that needs to be taught along with a set of 8 conceptual strands, referred to as Mathematical Practices, that curriculum and instruction must support in learners. These Mathematical Practices consist of: Making sense of problems and persevering in solving them, Reasoning abstractly and quantitatively, Constructing viable arguments and critiquing the reasoning of others, Modeling with mathematics, Using appropriate tools strategically, Attending to precision, Looking for and making use of structure, Looking for and expressing regularity in repeated reasoning. A major challenge concerning the implementation of these standards is teachers’ own knowledge about and familiarity with these thinking skills as learners and their inadequate pedagogical knowledge surrounding how to help children acquire them. Currently, one of the main goals of mathematics teacher educators across the county is conceptualizing ways that would enable teachers to both understand and enact these standards in the classroom. In our session we will report on a research-based, year long, professional development program designed for K-12 mathematics teachers aimed at building capacity of these standards. In our session we will report on the nature of activities used with the teachers along with our analysis of impact of our work on teachers’ mathematical knowledge. In reporting our findings we will focus on two of the 8 practices due to their universal significance and conceptual ambiguity. These include: Modeling with mathematics, looking for and making use of structure.
9th Annual International Conference on Mathematics & Statistics: Education & Applications, 1st Annual International Conference on Formal Sciences, 9th Annual International Conference on Statistics, 29-30 June &
1-2 July 2015, Athens, Greece: Abstract Book
34
Abhinav Mehta Associate Lecturer, The Australian National University, Australia
Uptake of Mammography Screening: Is Obesity an Impediment?
It has been observed that screening mammography improves early-
‐detection rates for breast cancer, and therefore reduces mortality from the disease. Many developed countries have mandatory screening programs for post-‐menopausal women (age range 0-‐79) that offer screening at regular intervals. I will briefly summarise the literature on the effectiveness of mammography screening. Obesity, on the other hand, has been a leading factor associated with increased breast cancer risk, morbidity and mortality, ostensibly because obesity makes detection more difficult, even within screening programs. There have been quite a few studies that have tried to analyse the relationship between obesity and the uptake of mammography screening with varied results. This study is a meta-‐analysis of an appropriate set of these published studies to seek to understand the relationship between obesity and the uptake of mammography. After an extensive and detailed search of published articles on various online databases, 29 studies were selected to be part of the review. All of these studies looked at the effect of BMI amongst other confounders on uptake of mammography screening. 22 of these studies used a multivariate logistic regression to study the effect of BMI categories on successful uptake of mammography. 18 of these reported the odds ratios (OR) of uptake of mammography and were used as part of the meta-‐analysis. Remaining 4 studies either reported the odds of not screening or used as reference, a BMI category other than normal BMI (18.5 to 25) and hence was not included in the final analysis. The regression models were in most instances adjusted for covariates like age, education, insurance, race/ethnicity, smoking status, etc. The studies which were excluded from the meta-‐analysis did not use multivariate logistic regression and/or reported the results using percentage of uptake of mammography or relative risk or risk differences. Post meta-‐analysis the results were comparedwith these studies to assess the findings qualitatively. 13 of the 18 studies used the WHO classification of BMI, which categorises people’s BMI into 5 categories of Normal (18.5 to 25), Overweight (25 to 30), Obese Class I (30 – 35), Obese Class II (35 – 40) and Obese Class III (40+). The normal BMI group is used as the reference group in the logistic regression. In 4 of the remaining studies, the BMI was categorized as a binary variable with categories like Non-‐Obese (<30) vs Obese (>30). A random effects model was fitted to the selected studies to account for heterogeneity amongst the selected

9th Annual International Conference on Mathematics & Statistics: Education & Applications, 1st Annual International Conference on Formal Sciences, 9th Annual International Conference on Statistics, 29-30 June &
1-2 July 2015, Athens, Greece: Abstract Book
35
studies. For the 11 studies in the first group above, Obese Class III showed a significant under utilization of a screening mammography (OR: 0.82 and 95% CI: 0.69 – 0.96). Studies which coded BMI as a binary variable also showed under utilization of the screening mammography for patients with BMI>30 (OR: 0.86 and 95% CI: 0.83 – 0.89).Different methods were used to assess the presence of publication bias. No substantial publication bias was observed using the funnel plot. Trim and Fill method was used to evaluate the adjusted effect size, after correcting for possible publication bias. The adjusted effect size was not significantly different from the ones reported above and did not modify the relationship observed. In conclusion, the studies analysed suggest that obese women are less likely to have mammograms, and thus point to a link between obesity and increased breast cancer morbidity and mortality. This study shows the promise of meta-‐analysis in quantitative literature review. This analysis also uses the various diagnostic tools available to assess the effectiveness of the meta-‐analysis.

9th Annual International Conference on Mathematics & Statistics: Education & Applications, 1st Annual International Conference on Formal Sciences, 9th Annual International Conference on Statistics, 29-30 June &
1-2 July 2015, Athens, Greece: Abstract Book
36
Martina Mincheva Assistant Professor, Temple University, USA
Two-Sample Hypothesis Testing on Evolutionary Trees
Thanks to next-generation sequencing technologies, researchers can gain access to millions of DNA sequences from a single experiment. A major area of interest has been the analysis of the human micro biome, which represents the total genome of the microorganisms living in the human body. The human body contains about 10^{13} human cells and 10^{14} bacterial cells, so the microbiome is frequently perceived as an extended human genome. Different parts of the body have distinct bacterial compositions, that have also been shown to be closely related to the presence of diseases, such as inflammatory bowel disease, peripheral vascular disease, asthma and hypertension (ischemic heart disease). That is why, developing statistical procedures for comparison and identification of microbial diversity can be essential in the early diagnosis or curing of these and many other diseases.
In this project, we develop a two-sample test statistic to test the hypothesis that the overall microbial compositions of two samples are different. We approach analyzing every sample of DNA sequences (called "reads"), by first placing them on a pre-existing evolutionary tree. The associated empirical distribution for each sample will be the distribution that places equal mass at each placement location. The estimator we propose utilizes the Kantorovich-Rubinstein metric, which is a standard approach for estimating the distances between two distributions.
We also establish its theoretical properties and prove its asymptotic convergence in distribution. Spoiler alert: our estimator has a nice precise F-distribution, with parameters (degrees of freedom) easily estimated from the data.

9th Annual International Conference on Mathematics & Statistics: Education & Applications, 1st Annual International Conference on Formal Sciences, 9th Annual International Conference on Statistics, 29-30 June &
1-2 July 2015, Athens, Greece: Abstract Book
37
Ashwini Kumar Mishra Associate Professor, B.N. Mandal University, India
Semi-Closed Fuzzy Sets and Semi-Continuous Functions in Fuzzy Topological Spaces
Fuzzy functions were introduced and studied as a generalization of
Zadeh’s functions. Recently, continuity of fuzzy functions in fuzzy topological spaces has also been introduced and studied. In the year 1981, K. K. Azad introduced and studied semi-open fuzzy sets, semi-closed fuzzy sets and semi-continuous functions in fuzzy topological spaces.
In this paper, semi-continuous fuzzy functions and related concepts have been introduced and studied. Several results and characterizations have been obtained.

9th Annual International Conference on Mathematics & Statistics: Education & Applications, 1st Annual International Conference on Formal Sciences, 9th Annual International Conference on Statistics, 29-30 June &
1-2 July 2015, Athens, Greece: Abstract Book
38
Ampalavanar Nanthakumar Professor, State University of New York at Oswego, USA
On Using Copulas to Test for a Two Component Bivariate Mixture Distribution
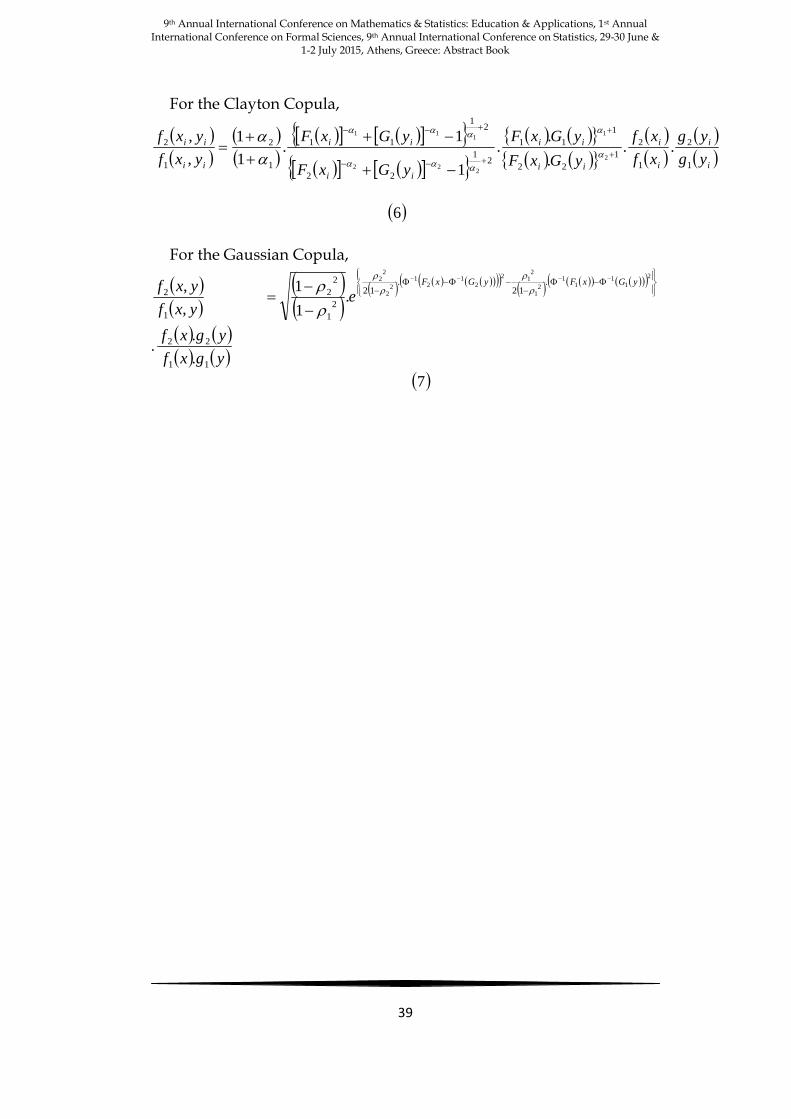
The paper presents a Copula based approach to test for a two
component bivariate mixture distribution. The regular joint density is modeled by using the Copula and then the Locally Most Powerful test (LMP) test is derived by using this Copula based regular density. This is a fairly simple test compared to the dip / depth test developed by Hartigan. Our simulation results based on the Clayton Copula and the Gaussian Copula show that this is a very powerful test.
Methodology: As we know, the two component situation arises in the context of many situations. In educational data, in econometrical data, in astrophysical data, the two component situation is very common.
Suppose that we have a bivariate two component mixture with the
component densities given by 1f and 2f respectively for the components
with p as the mixing proportion. Then, the mixture density function is
given by
iiiiii yxfpyxfpyxf ,.,.1, 21 1
and the likelihood function is
L
n
i
ii yxf1
, 2
By taking the natural logarithm, we have
n
i
ii yxfL1
,lnln 3
Next, taking the partial derivative with respect to p and then
evaluating the derivative at 0p yields,
At ,0p p
L
ln=
n
i ii
ii
yxf
yxf
1 1
2 1,
, 4
This means that in order to test the hypothesis,
0:0 pH versus 0:1 pH
The LMP test should be: Reject 0H when nW C , where C is a
constant and
n
yxf
yxf
W
n
i ii
ii
n
1 1
2
,
,
5
9th Annual International Conference on Mathematics & Statistics: Education & Applications, 1st Annual International Conference on Formal Sciences, 9th Annual International Conference on Statistics, 29-30 June &
1-2 July 2015, Athens, Greece: Abstract Book
39
For the Clayton Copula,
i
i
i
i
ii
ii
ii
ii
ii
ii
yg
yg
xf
xf
yGxF
yGxF
yGxF
yGxF
yxf
yxf
1
2
1
2
1
22
1
11
21
22
21
11
1
2
1
2 ...
..
1
1.
1
1
,
,
2
1
222
111
6
For the Gaussian Copula,
yxf
yxf
,
,
1
2
2
11
11
21
212
21
21
22
22 .
12.
12
2
1
2
2 .1
1 yGxFyGxF
e
. ygxf
ygxf
11
22
.
.
7

9th Annual International Conference on Mathematics & Statistics: Education & Applications, 1st Annual International Conference on Formal Sciences, 9th Annual International Conference on Statistics, 29-30 June &
1-2 July 2015, Athens, Greece: Abstract Book
40
Victor Oxman Senior Lecturer, Western Galilee College, Shaanan College, Israel
Moshe Stupel Professor, Shaanan College, Israel
& Ruti Segal
Senior Lecturer, Oranim College, Shaanan College, Israel
Making Use of Dynamic Software and Mathematical Tools in the Solution of Extremum Problems in Triangle
Geometry
We describe dynamic investigation of five interesting geometric problems aimed at finding extrema, which was held with students of mathematical education as part of a course for utilizing computerized technology. Applets were developed for carrying out the dynamic investigation, to which links are given at the end of the paper.

9th Annual International Conference on Mathematics & Statistics: Education & Applications, 1st Annual International Conference on Formal Sciences, 9th Annual International Conference on Statistics, 29-30 June &
1-2 July 2015, Athens, Greece: Abstract Book
41
Diarmuid O’Driscoll Head, Department of Mathematics, Mary Immaculate College, Ireland
& Donald Ramirez
Professor, University of Virginia, USA
Revising Some Design Criteria
We address the problem that the A (trace) design criterion is not scale invariant and often is in disagreement with the D (determinant) design criterion. We introduce the canonical moment matrix CM and use the trace of its inverse as the canonical trace CA design criterion and the determinant of its inverse as the canonical determinant CD design criterion. For designs which contain only the constant and main effects, CA and CD are scale invariant by construction, and are in agreement in many cases. For designs which contain higher order terms, we note that the determinant of the canonical moment matrix gives a measure of the collinearity between the lower order terms and the higher order terms.

9th Annual International Conference on Mathematics & Statistics: Education & Applications, 1st Annual International Conference on Formal Sciences, 9th Annual International Conference on Statistics, 29-30 June &
1-2 July 2015, Athens, Greece: Abstract Book
42
Santhanam Ramachandran Secretary, The Association of Mathematics Teachers of India, India
The Pedagogical Aspects of Non-Routine Problem Solving in Mathematics
Routine Problems on mathematical concepts and formulae are given
in the text books of mathematics. They are of simple applications of the concept and formulae. A non-routine thinking usually will not be found in the mathematics course. In this paper, the pedagogical aspects of non-routine problem solving skills are discussed. The following problem was given to a wide range of students of age 13 to 20 and teachers. Around 95% of these could not solve the problem and they do not know the method of attack also. Find a natural number ‘x’ such that
76543211234567898321 xxx It is surprising that a student of age 13 gave a solution. Let us
consider the following problem. Could we find natural numbers a, b such that
4422 11 bbaa This problem when given to a set of students of age group 13 to 20,
the observations of some students are remarkable. Some of them could
proceed algebraically to some extent. Some of them expanded 21a
and 41b . Some other transposed the term and got
2442 11 abba then factorized, but both category could not proceed further. Some of them when asked whether these is a solution for the problem or not, remarked that if there exists a solution, b must be less than a. This is because a smaller number raised to the power 4 may be equal to a. bigger number raised to the power.
The following problem is a typical example of a non-routine problem with elementary techniques used. Let a, b, c, d are numbers of which not all zero such that a+b+c+d=0. Let P= ab+bc+cd and Q= ac+ad+bd. Prove that atleast one of 20P+15Q and 20Q+15P must be negative. These kind of problems involve starting trouble. Many students use a+b+c+d=0 to eliminate one or more variables in P, Q but fail to proceed. The problem is framed to use the expansion of (a+b+c+d)2.
Solving equations is a part and parcel of any school curriculum. Students are taught that to solve an equation containing three variables, three equations must be given. The following problem involves two equations in three variables.
When x,y,z are real solve x+y=2 and xy-z2=1. Such type of problem are discussed in this paper.

9th Annual International Conference on Mathematics & Statistics: Education & Applications, 1st Annual International Conference on Formal Sciences, 9th Annual International Conference on Statistics, 29-30 June &
1-2 July 2015, Athens, Greece: Abstract Book
43
Francesco Rania Assistant Professor, University Magna Graecia of Catanzaro, Italy
& Giovanni Anello
Associate Professor, University of Messina, Italy
Some Existence Results on Competitive Economic Equilibrium by Using Variational Approach
We propose a review on existence of a economic competitive
equilibrium for the Walrasian economies. All results are established by using the variational approach. Indeed, the economic equilibrium problem will be compaired with the generalized quasi variational inequality problem defined on a suitable compact set. The utility functions will be considered quasi-concave and and upper semicontinuous.

9th Annual International Conference on Mathematics & Statistics: Education & Applications, 1st Annual International Conference on Formal Sciences, 9th Annual International Conference on Statistics, 29-30 June &
1-2 July 2015, Athens, Greece: Abstract Book
44
Layal Saikaly MSc Student, Lebanese University, Lebanon
& Nina Hayfa
Post Doctoral Fellow, Lebanese University, Lebanon
Dimensions of Knowledge and Ways of Thinking of Irrational Numbers
The paper focuses on different grade level students’ understanding
of irrational numbers and the various dimensions of knowledge they use when defining the irrational numbers, recognizing them and constructing them geometrically. It is designed to search for consistency between dimensions of knowledge and to determine the way the participants conceptualized the irrational numbers in addition to the effect of age on the performance of these participants. The results show that there is inconsistency in the participants’ knowledge about irrational numbers; they depend heavily on the infinite decimal representation of the irrational numbers and thus thinking procedurally about these numbers.
9th Annual International Conference on Mathematics & Statistics: Education & Applications, 1st Annual International Conference on Formal Sciences, 9th Annual International Conference on Statistics, 29-30 June &
1-2 July 2015, Athens, Greece: Abstract Book
45
Ruti Segal Senior Lecturer, Oranim College, Shaanan College, Israel
Moshe Stupel Professor, Shaanan College, Israel
& Victor Oxman
Senior Lecturer, Western Galilee College, Shaanan College, Israel
Surprising Investigation of Loci Using Dynamic Software
The geometrical locus is defined as a geometrical shape either in the plane or in space, where each of its points and only these points, shares a common property, or using the language of set theory: the locus is the collection of all points which they and only they satisfy a certain condition.
The locus is a very important concept in Euclidean geometry because the use of the locus property is a “tool” in the solution and proof of different problems and it allows making geometric constructions using a straightedge and a compass, as done since the early history of mathematics.
Usually the programs and the textbooks of high school education in mathematics do not devote a chapter to the concept of the locus, and this subject is integrated in the routine subjects of study, aside for the studies of analytic geometry, where loci such as the circle, the ellipse, the hyperbola and the parabola are defined by means of an equation that connects the X and Y coordinates of points that belong to the locus.
In addition, it can be clearly stated that the programs of study do not devote the proper attention to deep investigation of loci. This has many different reasons, including the fact that in many cases this is a difficult task because one does not know in advance what the expected geometric locus is. In addition, when investigating the task using an analytic method, a complex equation may be obtained which includes a high order polynomial etc., where high school students and even students in the high route of school teaching of mathematics do not have the skills and the tools to investigate it.
Following the development of computerized tools, the people occupied with this subject have been provided with powerful tools that permit visual and other ways of making the investigation of loci easier.
As early as at the initial stage, the use of dynamic geometric software (DGS) allows one to identify the locus on the intuitive level and subsequently, during the investigation stage, it demonstrates several properties of the locus such as: convexity, different points of intersection, extrema etc.
Using the classical approach we are trying to describe the locus as the set of all points (curve, planar shape, spatial body etc.) which

9th Annual International Conference on Mathematics & Statistics: Education & Applications, 1st Annual International Conference on Formal Sciences, 9th Annual International Conference on Statistics, 29-30 June &
1-2 July 2015, Athens, Greece: Abstract Book
46
satisfies certain property. However, when using dynamic software, one allows the points to move in the plane by dragging, where the given property is retained throughout the entire motion, producing the full path that provides an insight and understanding of the shape of the locus and simplifies subsequent mathematical treatment.
This can give rise to another aspect of the investigation of loci – there are cases that under certain conditions (for example a homothety), with a given locus in the background, a new locus is formed which resembles the original locus.
To demonstrate this we shall present several examples of investigations of loci of certain points in the triangle (intersection of medians, angle bisectors, altitudes), where two vertices of the triangle are fixed and the third vertex moves along the circumscribing circle of the triangle. It turns out that the loci of these points in the triangle are also circles. We shall also present other examples of surprising loci obtained using the dynamic software. Each example shall be accompanied by a proof, sometimes by using mathematical tools from different areas of mathematics.

9th Annual International Conference on Mathematics & Statistics: Education & Applications, 1st Annual International Conference on Formal Sciences, 9th Annual International Conference on Statistics, 29-30 June &
1-2 July 2015, Athens, Greece: Abstract Book
47
Praneetha Singh Assistant Head of Mathematics and Convener, The Hills Grammar
School, NSW and Australian Independent School Mathematics Professional Learning, Australia
Cross-curriculum Integration of Mathematics in Secondary Schools
It is a known fact that the quality of education that teachers provide
to students is highly dependent upon what teachers do in the classroom. Thus, in preparing the students of today to become successful, innovative, resilient individuals of tomorrow, it is imperative for mathematics teachers to ensure their teaching is effective and broad spectrum. Integration of mathematics across other curriculum is a vital ingredient to ensure a well-rounded young adult of the future. Through interdisciplinary approaches a student will experience a view of knowledge and curriculum approach that consciously applies methodology and language from more than one discipline to examine a central theme, issue, problem, topic, or experience.
In an era characterised by rapid accumulation of new information, dominated by science, technology and mathematics, cross-disciplinary theories can help teachers and students control, manage and understand large amount of information better and hence it is essential that mathematics be taught as a subject that lends itself to other subject areas and teachers need to be equipped with the necessary skills to ensure this. A useful way to apply connected curriculum is to use mathematics as the thread that links Science, Technology, and other curriculum together.
This paper will explore the possibilities of integrating mathematics within other disciplines and consider how another subject can support and enhance student’s learning in mathematics. Considerations and recommendations of the implementation of integration process will be considered.

9th Annual International Conference on Mathematics & Statistics: Education & Applications, 1st Annual International Conference on Formal Sciences, 9th Annual International Conference on Statistics, 29-30 June &
1-2 July 2015, Athens, Greece: Abstract Book
48
Yousri Slaoui Associate Professor, University of Poitiers, France
Large and Moderate Deviation Principles for Nonrecursive and Recursive Estimators of a Regression Function
In this paper we prove large deviations principles for the averaged
stochastic approximation method for the estimation of a regression function introduced by Mokkadem et al. (2009). We show that the averaged stochastic approximation algorithm constructed using the weight sequence which minimize the asymptotic variance gives the same pointwise LDP as the Nadaraya-Watson kernel estimator. Moreover, we give a moderate deviations principle for these estimators. It turns out that the rate function obtained in the moderate deviations principle for the averaged stochastic approximation algorithm constructed using the weight sequence which minimize the asymptotic variance is larger than the one obtained for the Nadaraya-Watson estimator and the one obtained for the semi-recursive estimator.

9th Annual International Conference on Mathematics & Statistics: Education & Applications, 1st Annual International Conference on Formal Sciences, 9th Annual International Conference on Statistics, 29-30 June &
1-2 July 2015, Athens, Greece: Abstract Book
49
Codruta Stoica Associate Professor, Aurel Vlaicu University of Arad, Romania
Exponential Dichotomy versus Exponential Splitting for Skew-evolution Semiflows in Infinite Dimensional Spaces
In this paper, we study the problem of how to generalize the notion
of exponential dichotomy to differential equations whose solutions are only assumed to exist in forward time. A straightforward generalization does not provide satisfactory results but, with additional assumptions, the goal can be reached. Hence, we define a general framework for the exponential splitting that includes, as a particular case, the exponential dichotomy. The exponential splitting is induced on a Banach space by a skew-evolution cocycle defined over a semiflow associated to a generalized dynamical system. We also consider some general dichotomic behaviors that consist in assuming the existence of a splitting into invariant subspaces where the norms of the evolution trajectories are bounded by some functions that depend on the initial and final times. The additional conditions concern the families of projectors and the exponential growth of the skew-evolution cocycle
Our main objective is to give characterizations for the notions of exponential dichotomy and exponential splitting and to establish connections between them. We prove that the concept of exponential splitting is stronger than the exponential dichotomy, but they are equivalent under suitable conditions. All results are underlined by examples and counterexamples.
9th Annual International Conference on Mathematics & Statistics: Education & Applications, 1st Annual International Conference on Formal Sciences, 9th Annual International Conference on Statistics, 29-30 June &
1-2 July 2015, Athens, Greece: Abstract Book
50
Jianjun Wang Professor, California State University, USA
& Xin Ma
University of Kentucky, USA
An Examination of Plausible Score Correlation from the Trend in Mathematics and Science Study
When National Assessment of Educational Progress (NAEP was
designed in the U.S., a matrix sampling technique was employed to randomly assign a test booklet to each student. The performance was represented by five plausible scores (PS) through statistical imputations to assess student achievements (i.e., plausible scores). Because NAEP data were collected from different student samples, no one used the NAEP data to compute correlation of student scores between mathematics and science subjects. To fill this void, Trend in Mathematics and Science Study (TIMSS) was funded by U.S. National Science Foundation to assess student performance in mathematics and science using PS approach from NAEP.
This presentation examines details of correlation computing, including an issue of accumulating Type I errors from 25 correlation coefficients between five PS from science test and five PS from mathematics test (i.e., 5x5=25). More importantly, there is no way to aggregate these results across Pearson correlation coefficients because of their non-additive feature (Statistics Canada, 2003). To solve this issue, we propose a study to use canonical correlation in statistical computing. As StatSoft (2015) elaborated,
Canonical Correlation is an additional procedure for assessing the relationship between variables. Specifically, this analysis allows us to investigate the relationship between two sets of variables. For example, an educational researcher may want to compute the (simultaneous) relationship between three measures of scholastic ability with five measures of success in school. (p. 1)
In this study, we have five PS in mathematics as one set of variables and five PS in science as another set of variables. Thus, canonical correlation coefficients can be computed to examine the relationship between two sets of variables. The holistic approach across the variable sets is not only more efficient, but also solves the non-additive issue of Pearson correlation for the result aggregation

9th Annual International Conference on Mathematics & Statistics: Education & Applications, 1st Annual International Conference on Formal Sciences, 9th Annual International Conference on Statistics, 29-30 June &
1-2 July 2015, Athens, Greece: Abstract Book
51
Olga Yanushkevichiene Professor, Vilnius University, Lithuania
& Romanas Yanushkevichius
Professor, Lithuanian University of Educational Sciences, Lithuania
Statistical Methods in the Educational Researches
Quite often in the study of various pedagogical phenomena mathematical statistic is used. But using of these methods is not always performed correctly. For example, often to test hypotheses Student's test is used. However, this criterion is applicable only in the case of normal distributions, which in educational research appear rarely.
The participants in the current study were undergraduate students enrolled in an introductory course in probability and statistics at Ohio University in Athens, OH. There were 27 total participants. X quizzes were assigned to students to assess their comprehension of course material. In each quiz, one problem was given whose content was discussed during group-work activities, in addition to one problem whose content was taught during a traditional lecture format. We would write the hypothesis H: there is no difference between the two comprehension of course material. Let level of significance be 0.05. By using the t-test statistic in SPSS, we have got, that the lowest level of significance for Student's t-test is 0.19 and we should accept the hypothesis H. By using the Wilcoxon signed rank test, we have got the results, that the lowest level of significance this test is 0.01 and we should reject the hypothesis H.
We can do the conclusion, that the result of Student's t-test is wrong, due to the fact, that the distribution of database is not normal.

9th Annual International Conference on Mathematics & Statistics: Education & Applications, 1st Annual International Conference on Formal Sciences, 9th Annual International Conference on Statistics, 29-30 June &
1-2 July 2015, Athens, Greece: Abstract Book
52
Salimeh Yasaei Sekeh Post Doctoral Fellow, Federal University of Sao Carlos, Brazil
& Adriano Polpo de Campos
Associate Professor, Federal University of Sao Carlos, Brazil
Selecting Models via Multivariate Weighted Information Measures
Belis and Guiasu (1968) introduced weighted uncertainty by
ascribing to each outcome a non-negative utility or weight which measures its importance. In various applications of the weighted information measures in Information Theory, selecting models by using the weighted kullback-Leibler information is taken into account. The purpose of this work is to introduce the weighted deviance information criterion (WDIC) with non-negative weight function (WF) _ as a statistical tool for selecting models. More- over, the kullback-Leibler information between conditional and marginal density function for the Gaussian random vectors with particular form of the WF in two cases (weighted and standard) has been analyzed.

9th Annual International Conference on Mathematics & Statistics: Education & Applications, 1st Annual International Conference on Formal Sciences, 9th Annual International Conference on Statistics, 29-30 June &
1-2 July 2015, Athens, Greece: Abstract Book
53
Takuma Yoshida Assistant Professor, Kagoshima University, Japan
Variable Selection and Flexible Smoothing in Semiparametric Regression
In this paper, we study estimation for partial linear models. We
assume radial basis functions for the nonparametric component of these models. To obtain the estimated curve with fitness and smoothness of the nonparametric component, we first apply the sufficient dimension reduction method to the radial basis functions. Then, the coefficients of the transformed radial basis functions are estimated. Finally, the coefficients in the parametric component can be estimated. Using L_1 type penalty such as lasso, bridge and SCAD, variable selection is proceeded when the dimension of coefficients of parametric component is large. Thus, we propose the new estimation method using two types of dimension reduction mehods; one is sufficient dimension reduction in nonparametric component and other is L_1 type penalty in parametric component. The above procedure is iterated and hence the proposed method is based on an alternating estimation. The proposed method is highly versatile and is applicable not only to mean regression but also to quantile regression and general robust regression. The asymptotic normality and oracle property of the estimator are derived. A simulation study is performed and an application to a real dataset is illustrated.

9th Annual International Conference on Mathematics & Statistics: Education & Applications, 1st Annual International Conference on Formal Sciences, 9th Annual International Conference on Statistics, 29-30 June &
1-2 July 2015, Athens, Greece: Abstract Book
54
Maroussa Zagoraiou Assistant Professor, University of Calabria, Italy
Choosing a Covariate-Adaptive Rule
Pocock and Simon’s minimization method is a very popular covariate-adaptive randomization procedure intended to balance the allocations of two treatments across a set of chosen covariates without compromising randomness. Additional covariate-adaptive schemes have been proposed in the literature, such as Atkinson’s DA-optimum Biased Coin Design and the Covariate-Adaptive Biased Coin Design (CA-BCD), and their properties were analyzed and compared in terms of imbalance and predictability. The aim of this paper is to push forward these comparisons by taking also into account a minimization method with a continuous allocation rule and a suitable generalization of the CA-BCD which can be implemented when the covariate distribution is unknown. Then we propose a flexible class of stratified randomization methods that we name the Covariate-Adaptive Dominant BCD, which forces the balance increasingly as the joint imbalance grows and improves the degree of randomness as the size of every stratum increases. As regards imbalance and predictability, our simulation study shows that the Covariate-Adaptive Dominant BCD performs better than i) Atkinson’s rule both in the presence and absence of interactions among covariates ii) Pocock and Simon’s method when the considered model is full. Furthermore, the simulations suggest that if in a given trial optimality is of primary importance, then the generalization of the CA-BCD is preferable, whereas if more emphasis is given on randomness then the minimization method with a continuous allocation rule could represent a suitable choice.

9th Annual International Conference on Mathematics & Statistics: Education & Applications, 1st Annual International Conference on Formal Sciences, 9th Annual International Conference on Statistics, 29-30 June &
1-2 July 2015, Athens, Greece: Abstract Book
55
Flavio Ziegelmann Associate Professor, Federal University of Rio Grande do Sul – UFRGS,
Brazil Paula Tofoli
Professor, Catholic University of Brasilia, Brazil Osvaldo Candido Silva-Filho
Professor, Catholic University of Brasilia, Brazil &
Pedro Valls Pereira Professor, Fundacao Getulio Vargas Sao Paulo, Brazil
Dynamic D-Vine Copula Model with Applications to Value-at-Risk (VaR)
Regular vine copulas are very flexible multivariate dependence
models constructed from pair-copulas (bivariate copulas). In this paper, we allow the dependence parameters of the pair-copulas in a D-vine decomposition to be potentially time-varying, following a nonlinear restricted ARMA(1,m) process. The proposed model is investigated in simulations and further evaluated with respect to the accuracy of Value-at-Risk (VaR) forecasts in crisis periods. The Monte Carlo experiments are quite favorable to the dynamic D-vine copula in comparison with a static D-vine copula. Moreover, the dynamic D-vine copula outperforms the static D-vine copula in terms of predictive accuracy for our real data sets.