~Mathematics Roundtable~ - Niagara Catholic Staff...
44
~Mathematics Roundtable~ Guides to Effective Instruction in Mathematics Strand Guides Overview and Task Cards Problem Solving ....................................................pgs.ss 2 - 12 Number Sense and Numeration .............................. pgs. 13 - 22 Measurement ........................................................ pgs. 23 - 29 Geometry and Spatial Sense .................................. pgs. 30 - 32 Patterning and Algebra .......................................... pgs. 33 - 37 Data Management and Probability .......................... pgs. 38 - 44 ~Junior Curriculum Council~ Anne Marie Holmes, Paul Sroka, Leanne Pemberton, Curtis Stoutenburg, Michelle Cain, Mike Teutenberg, Maria Solomon, Dan Trainor, Marg Marion, Sheri Bassett
Transcript of ~Mathematics Roundtable~ - Niagara Catholic Staff...
~Mathematics Roundtable~ Guides to Effective Instruction in
Mathematics Strand Guides Overview and Task Cards
Problem Solving ....................................................pgs.ss 2 - 12 Number Sense and Numeration.............................. pgs. 13 - 22 Measurement........................................................ pgs. 23 - 29 Geometry and Spatial Sense .................................. pgs. 30 - 32 Patterning and Algebra .......................................... pgs. 33 - 37 Data Management and Probability .......................... pgs. 38 - 44
~Junior Curriculum Council~ Anne Marie Holmes, Paul Sroka, Leanne
Pemberton, Curtis Stoutenburg, Michelle Cain, Mike Teutenberg, Maria Solomon, Dan Trainor,
Marg Marion, Sheri Bassett

2
A Guide to Effective Instruction in Math Volume 2 - Problem Solving and Communication
A. Problem Solving
Importance of Problem Solving • One Problem, Two Purposes (Chart, pg. 7)
Teaching Through Problem Solving
• Grade 1 and 4 Examples (pg. 10-17, pg. 18-25) Getting Started, Working On it, Reflecting and Connecting
• Teacher’s Role
Provide Challenges, Support and Extend Learning, Encourage and Accept Student’s Strategies
Questioning/ Prompting Students, Think Alouds Good Open-Ended Q. guidelines (pg. 27) Revising Problems (Chart, pg. 28 – good for students to do too) Teacher Support During Problem Solving (Charts, pg. 30)
• Teaching About Problem Solving
Class Structure (a few ideas) 4 Step Model (Chart pg. 37 – Similar to EQAO chart) Problem Solving Strategies (Good examples of EQAO list– Pg. 39/40 Act It Out, Guess&Check…) Teacher’s Role (Some good reminders/ new ideas to consider pg. 44/45) Observing Students (Cognition, Affect, Metacognition, Flexibility – “Look-Fors”
pg.48-50 with Chart)
• Problem Solving Tracker Appendix
3
A Guide to Effective Instruction in Math Volume 2 - Problem Solving and Communication
B. Communication
• Introduction Importance Of Communication Ways of Fostering Communication Two Approaches to Promoting Communication
• Communication in the Classroom
Opportunities Looks-Like? Example (Grade 4 – pg. 60-66)
• Oral Communication
Promoting Oral Communication GOOD Strategies Lists pg. 68-70 - (Pair/Share, Show/Tell, Math Readers
Theatre, Math Forum, Cooperative Prob. Solving, Catch the Mistake and Fix, Prove/Disprove)
• Written Communication
Promoting Written Communication Good Strategies Lists pg. 73-79 (Mind Map, Model Writing, Shared Student
Writing, Group Solution Writing, ThinkTalkWrite, Thinking Windows, Place Mat, Procedural, Graphic Orgs, Math Word Wall, Math Strategy Wall, Journals/ Logs, Math Picture Books, Math Poster Projects, Student Problem Posting, Math Creative Writing)
• Questions and Prompts to Promote Communication
Good Example Charts pg. 81-84 (Retell, Predict/Invent/Solve, Connections, Share Representation, Reflect, Share Feelings)

4
REVISING PROBLEMS ACTIVITY SHEET
INITIAL PROBLEM REVISED PROBLEM
Find the Area of a rectangle that is 3 units wide and 4 units long.
Find the Perimeter of a rectangle that is 3 units wide and 4 units long.
Add: $1.69 + 3.74
Find the Change: $5.00 - 4.76
Show $ 1.69 in using coins
9 X 8 = ___
9 X ___ = 90
9m = ___ cm 8m = ___ cm
How many faces does this cube have?
Draw a triangular pyramid.
Draw a 90 degree angle.
Which number appears most often in the list below? 75, 72, 67, 58, 72, 69, 75, 65, 81, 83, 63, 72, 63, 77, 75, 84, 72, 89, 84, 92, 57, 83, 96, 52, 67, 71
Which number is most likely to be rolled, odd or even?
Which colour leaf do you see the least of?
5
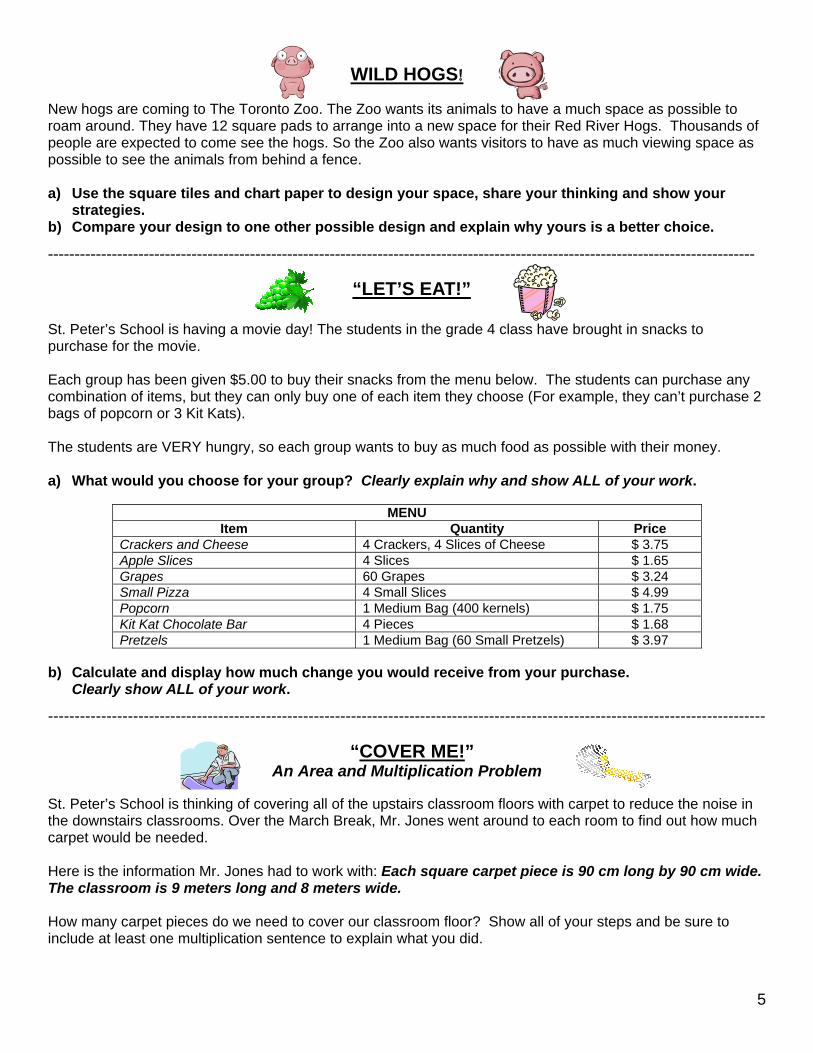
WILD HOGS!
New hogs are coming to The Toronto Zoo. The Zoo wants its animals to have a much space as possible to roam around. They have 12 square pads to arrange into a new space for their Red River Hogs. Thousands of people are expected to come see the hogs. So the Zoo also wants visitors to have as much viewing space as possible to see the animals from behind a fence. a) Use the square tiles and chart paper to design your space, share your thinking and show your strategies. b) Compare your design to one other possible design and explain why yours is a better choice.
-------------------------------------------------------------------------------------------------------------------------------------
“LET’S EAT!”
St. Peter’s School is having a movie day! The students in the grade 4 class have brought in snacks to purchase for the movie. Each group has been given $5.00 to buy their snacks from the menu below. The students can purchase any combination of items, but they can only buy one of each item they choose (For example, they can’t purchase 2 bags of popcorn or 3 Kit Kats). The students are VERY hungry, so each group wants to buy as much food as possible with their money. a) What would you choose for your group? Clearly explain why and show ALL of your work.
MENU Item Quantity Price
Crackers and Cheese 4 Crackers, 4 Slices of Cheese $ 3.75 Apple Slices 4 Slices $ 1.65 Grapes 60 Grapes $ 3.24 Small Pizza 4 Small Slices $ 4.99 Popcorn 1 Medium Bag (400 kernels) $ 1.75 Kit Kat Chocolate Bar 4 Pieces $ 1.68 Pretzels 1 Medium Bag (60 Small Pretzels) $ 3.97
b) Calculate and display how much change you would receive from your purchase. Clearly show ALL of your work.
---------------------------------------------------------------------------------------------------------------------------------------
“COVER ME!” An Area and Multiplication Problem
St. Peter’s School is thinking of covering all of the upstairs classroom floors with carpet to reduce the noise in the downstairs classrooms. Over the March Break, Mr. Jones went around to each room to find out how much carpet would be needed. Here is the information Mr. Jones had to work with: Each square carpet piece is 90 cm long by 90 cm wide. The classroom is 9 meters long and 8 meters wide. How many carpet pieces do we need to cover our classroom floor? Show all of your steps and be sure to include at least one multiplication sentence to explain what you did.

6
WILD HOGS! Problem Solving Marking Sheet
Expectation Level 1 Level 2 Level 3 Level 4
Measure and record the perimeter and area of shapes using a variety of strategies
Mostly Inaccurate Strategy Not Demonstrated
Some Inaccuracies 1 or Partial Strategy Attempted
Mostly accurate 1-2 Appropriate Strategies
No Errors 2 or more Appropriate Strategies
Solve meaningful problems that require the ability to distinguish perimeter and area showing all strategies and problem solving steps
Few steps shown, lacks clarity and detail
Some steps shown with acceptable clarity, little detail
Most steps shown with adequate clarity and detail
All steps shown in a sophisticated, clear and detailed manner
Compare shapes that have the same perimeter or the same area
Unclear / No Comparison with no support
Comparison is attempted without support and lacks clarity
Comparison clearly communicated with support
Comparison is accurate and clear with extension or demonstration
Select and accurately justify the most appropriate unit
No units are applied Attempt is made to apply units, Some inaccuracies
Non-standard units are applied accurately
Units accurately and realistically applied with rationale

7
MATH READER’S THEATRE RESOURCES
Article ARITHMETIC AND READERS THEATRE? An unlikely combination, but wait .... by Lucy Rioux In my previous article, I provided an example of how readers theatre scripting could be used in the social studies curriculum. This time we focus in the math area. Although the trend in today's educational philosophy is to understand the concepts of mathematics through process and problem solving, there are some times when memorization must also be utilized. The multiplication tables comes to mind as a prime example of this. Teachers are always looking for new techniques and "tricks" in order to facilitate their students' mastery of this very important basic mathematical knowledge.
Historically, students have usually demonstrated adequate comprehension and acquisition of the times table for the numbers 2, 3, 4, 5, and 9. This is usually related to the common rules or patterns associated with these numbers. The times tables for the numbers 6, 7, and 8 are much more challenging and more difficult to "memorize".
Using readers theatre scripting techniques as another learning strategy can help students overcome this challenge and facilitate their learning of the facts.
Students themselves can create scripts which address the multiplication tables. Below you will find an example of a script that I have used with third grade students, the grade level where multiplication is traditionally introduced in many school systems. The script can be adapted to suit as many children as are in the classroom or for small group presentations (one group doing the times table of 6, another group working on 7, and yet another group scripting for 8). Students from one third grade classroom can work on a script and practice for presentation to another third grade classroom. The very fact that students are "rehearsing" to put on a good "show", means that they are "studying" and "memorizing" the facts they need to know. It is a very effective learning tool and lots of fun as well!
YOU CAN EVEN CREATE SCRIPTS TOGETHER AS A CLASS!!
8
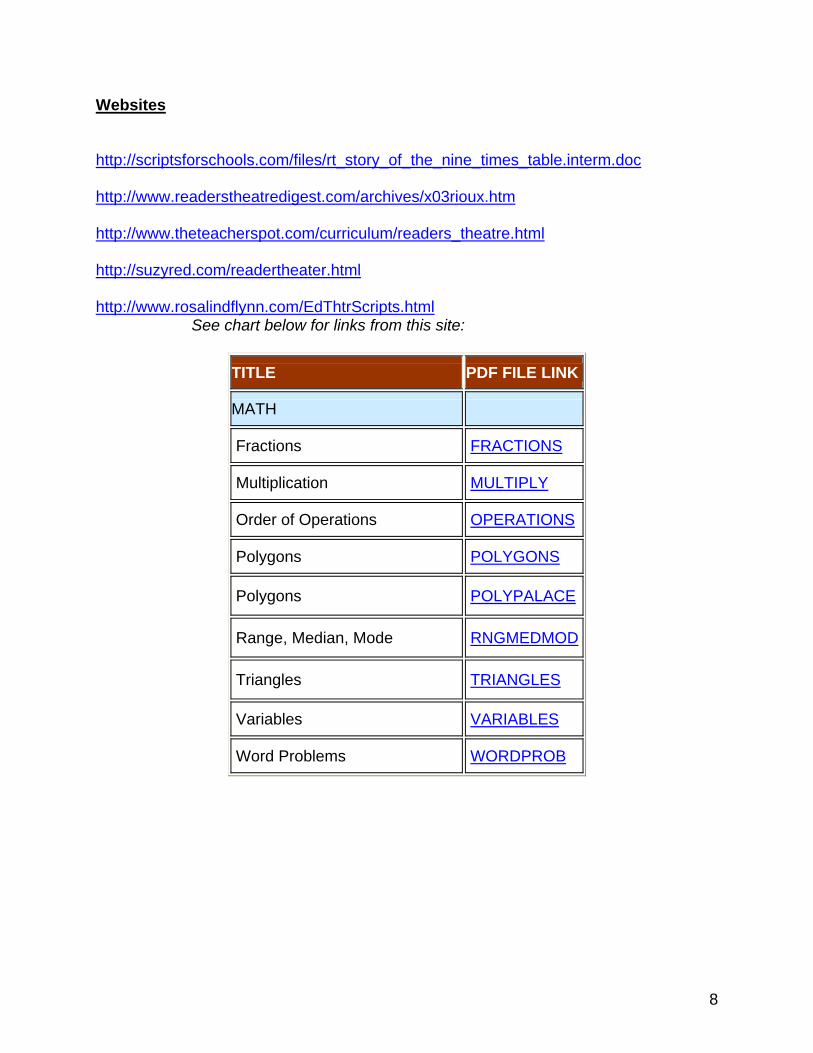
Websites
http://scriptsforschools.com/files/rt_story_of_the_nine_times_table.interm.doc http://www.readerstheatredigest.com/archives/x03rioux.htm http://www.theteacherspot.com/curriculum/readers_theatre.html http://suzyred.com/readertheater.html http://www.rosalindflynn.com/EdThtrScripts.html See chart below for links from this site:
TITLE PDF FILE LINK
MATH
Fractions FRACTIONS
Multiplication MULTIPLY
Order of Operations OPERATIONS
Polygons POLYGONS
Polygons POLYPALACE
Range, Median, Mode RNGMEDMOD
Triangles TRIANGLES
Variables VARIABLES
Word Problems WORDPROB
9
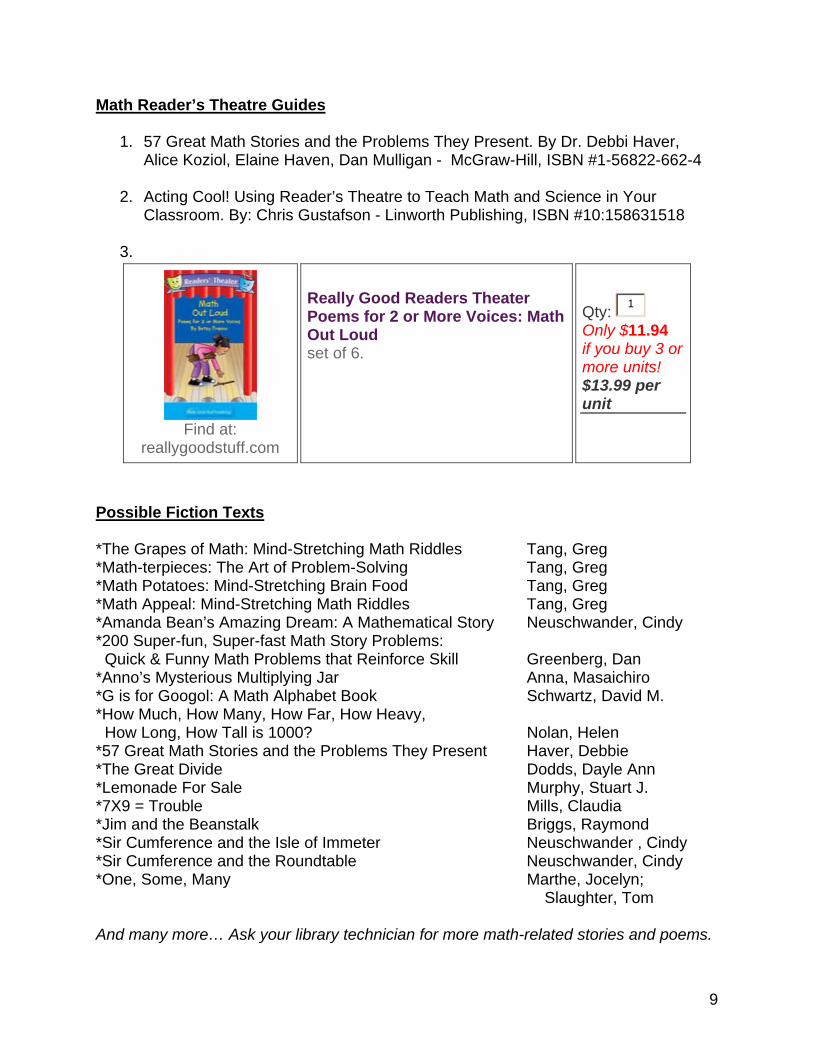
Math Reader’s Theatre Guides
1. 57 Great Math Stories and the Problems They Present. By Dr. Debbi Haver, Alice Koziol, Elaine Haven, Dan Mulligan - McGraw-Hill, ISBN #1-56822-662-4
2. Acting Cool! Using Reader’s Theatre to Teach Math and Science in Your
Classroom. By: Chris Gustafson - Linworth Publishing, ISBN #10:158631518 3.
Find at:
reallygoodstuff.com
Really Good Readers Theater Poems for 2 or More Voices: Math Out Loud set of 6.
Qty: 1 Only $11.94 if you buy 3 or more units! $13.99 per unit
Possible Fiction Texts *The Grapes of Math: Mind-Stretching Math Riddles Tang, Greg *Math-terpieces: The Art of Problem-Solving Tang, Greg *Math Potatoes: Mind-Stretching Brain Food Tang, Greg *Math Appeal: Mind-Stretching Math Riddles Tang, Greg *Amanda Bean’s Amazing Dream: A Mathematical Story Neuschwander, Cindy *200 Super-fun, Super-fast Math Story Problems: Quick & Funny Math Problems that Reinforce Skill Greenberg, Dan *Anno’s Mysterious Multiplying Jar Anna, Masaichiro *G is for Googol: A Math Alphabet Book Schwartz, David M. *How Much, How Many, How Far, How Heavy, How Long, How Tall is 1000? Nolan, Helen *57 Great Math Stories and the Problems They Present Haver, Debbie *The Great Divide Dodds, Dayle Ann *Lemonade For Sale Murphy, Stuart J. *7X9 = Trouble Mills, Claudia *Jim and the Beanstalk Briggs, Raymond *Sir Cumference and the Isle of Immeter Neuschwander , Cindy *Sir Cumference and the Roundtable Neuschwander, Cindy *One, Some, Many Marthe, Jocelyn;
Slaughter, Tom
And many more… Ask your library technician for more math-related stories and poems.
10
Sample Scripts
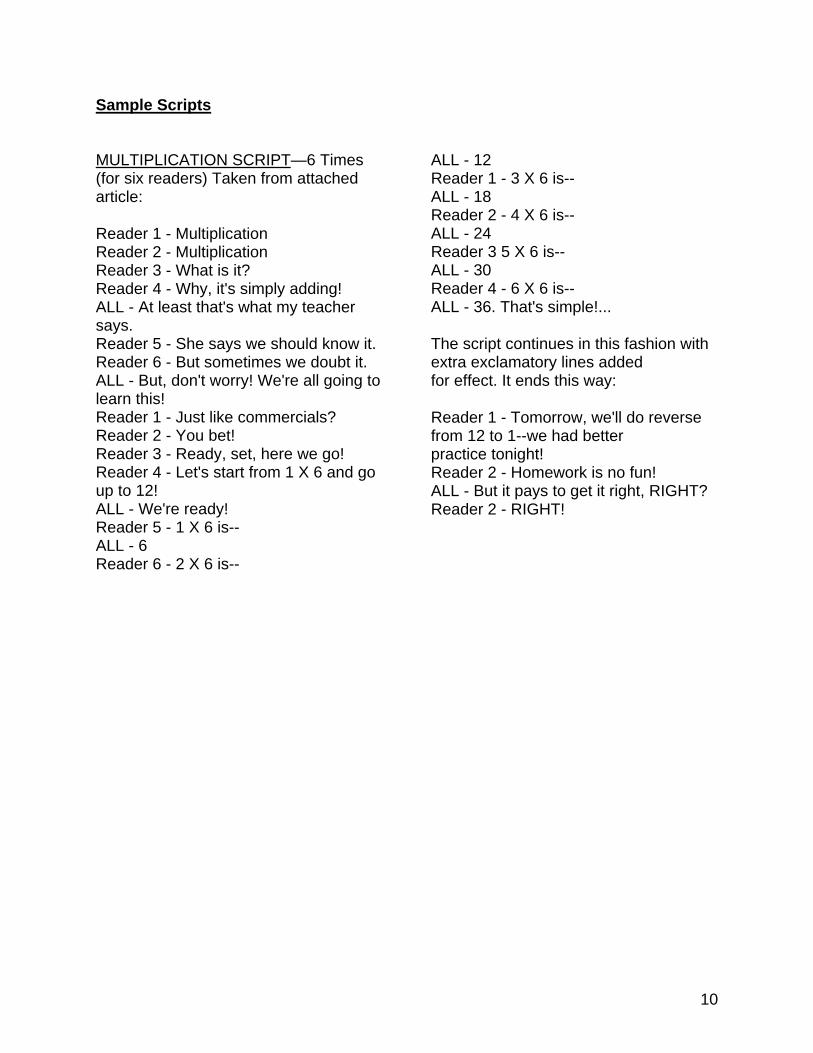
MULTIPLICATION SCRIPT—6 Times (for six readers) Taken from attached article:
Reader 1 - Multiplication Reader 2 - Multiplication Reader 3 - What is it? Reader 4 - Why, it's simply adding! ALL - At least that's what my teacher says. Reader 5 - She says we should know it. Reader 6 - But sometimes we doubt it. ALL - But, don't worry! We're all going to learn this! Reader 1 - Just like commercials? Reader 2 - You bet! Reader 3 - Ready, set, here we go! Reader 4 - Let's start from 1 X 6 and go up to 12! ALL - We're ready! Reader 5 - 1 X 6 is-- ALL - 6 Reader 6 - 2 X 6 is--
ALL - 12 Reader 1 - 3 X 6 is-- ALL - 18 Reader 2 - 4 X 6 is-- ALL - 24 Reader 3 5 X 6 is-- ALL - 30 Reader 4 - 6 X 6 is-- ALL - 36. That's simple!...
The script continues in this fashion with extra exclamatory lines added for effect. It ends this way:
Reader 1 - Tomorrow, we'll do reverse from 12 to 1--we had better practice tonight! Reader 2 - Homework is no fun! ALL - But it pays to get it right, RIGHT? Reader 2 - RIGHT!
11
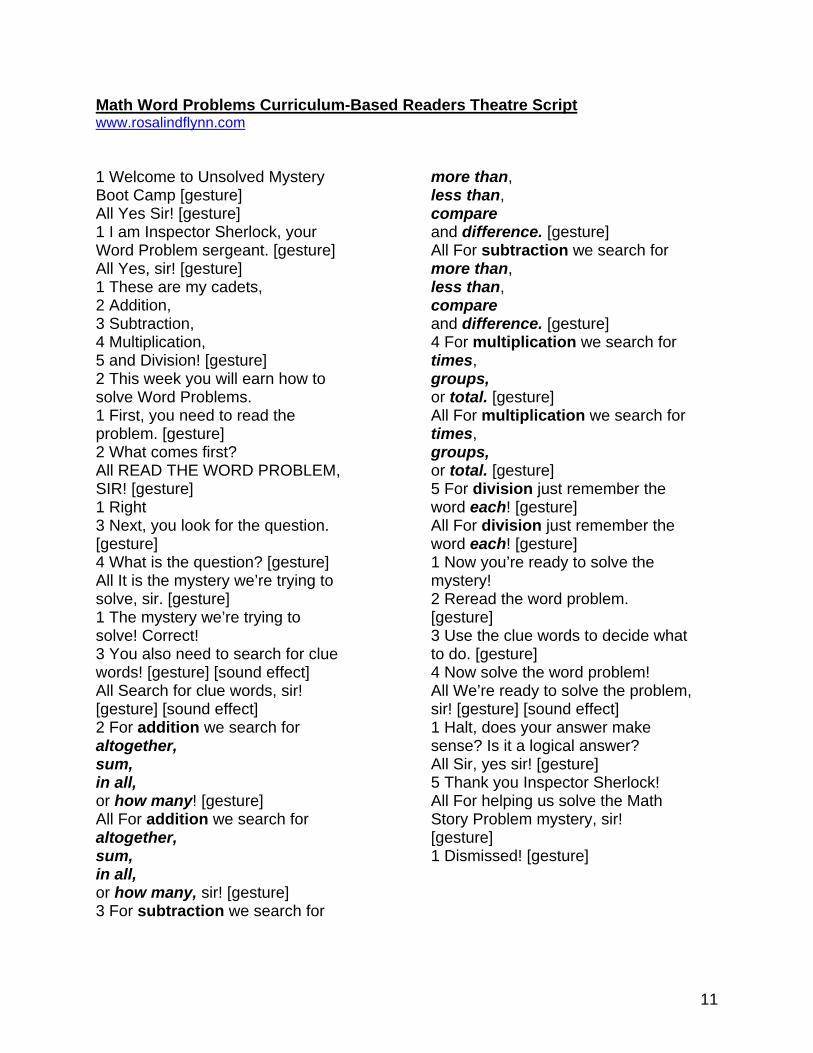
Math Word Problems Curriculum-Based Readers Theatre Script www.rosalindflynn.com 1 Welcome to Unsolved Mystery Boot Camp [gesture] All Yes Sir! [gesture] 1 I am Inspector Sherlock, your Word Problem sergeant. [gesture] All Yes, sir! [gesture] 1 These are my cadets, 2 Addition, 3 Subtraction, 4 Multiplication, 5 and Division! [gesture] 2 This week you will earn how to solve Word Problems. 1 First, you need to read the problem. [gesture] 2 What comes first? All READ THE WORD PROBLEM, SIR! [gesture] 1 Right 3 Next, you look for the question. [gesture] 4 What is the question? [gesture] All It is the mystery we’re trying to solve, sir. [gesture] 1 The mystery we’re trying to solve! Correct! 3 You also need to search for clue words! [gesture] [sound effect] All Search for clue words, sir! [gesture] [sound effect] 2 For addition we search for altogether, sum, in all, or how many! [gesture] All For addition we search for altogether, sum, in all, or how many, sir! [gesture] 3 For subtraction we search for
more than, less than, compare and difference. [gesture] All For subtraction we search for more than, less than, compare and difference. [gesture] 4 For multiplication we search for times, groups, or total. [gesture] All For multiplication we search for times, groups, or total. [gesture] 5 For division just remember the word each! [gesture] All For division just remember the word each! [gesture] 1 Now you’re ready to solve the mystery! 2 Reread the word problem. [gesture] 3 Use the clue words to decide what to do. [gesture] 4 Now solve the word problem! All We’re ready to solve the problem, sir! [gesture] [sound effect] 1 Halt, does your answer make sense? Is it a logical answer? All Sir, yes sir! [gesture] 5 Thank you Inspector Sherlock! All For helping us solve the Math Story Problem mystery, sir! [gesture] 1 Dismissed! [gesture]
12
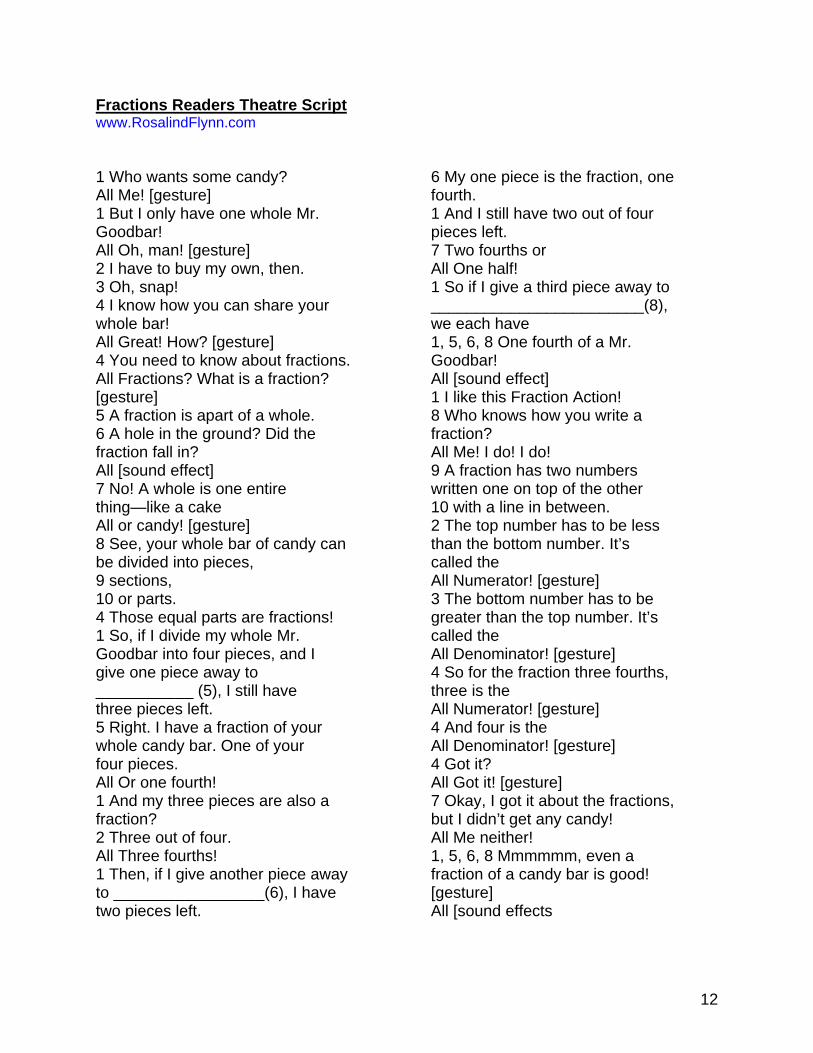
Fractions Readers Theatre Script www.RosalindFlynn.com 1 Who wants some candy? All Me! [gesture] 1 But I only have one whole Mr. Goodbar! All Oh, man! [gesture] 2 I have to buy my own, then. 3 Oh, snap! 4 I know how you can share your whole bar! All Great! How? [gesture] 4 You need to know about fractions. All Fractions? What is a fraction? [gesture] 5 A fraction is apart of a whole. 6 A hole in the ground? Did the fraction fall in? All [sound effect] 7 No! A whole is one entire thing—like a cake All or candy! [gesture] 8 See, your whole bar of candy can be divided into pieces, 9 sections, 10 or parts. 4 Those equal parts are fractions! 1 So, if I divide my whole Mr. Goodbar into four pieces, and I give one piece away to ___________ (5), I still have three pieces left. 5 Right. I have a fraction of your whole candy bar. One of your four pieces. All Or one fourth! 1 And my three pieces are also a fraction? 2 Three out of four. All Three fourths! 1 Then, if I give another piece away to _________________(6), I have two pieces left.
6 My one piece is the fraction, one fourth. 1 And I still have two out of four pieces left. 7 Two fourths or All One half! 1 So if I give a third piece away to ________________________(8), we each have 1, 5, 6, 8 One fourth of a Mr. Goodbar! All [sound effect] 1 I like this Fraction Action! 8 Who knows how you write a fraction? All Me! I do! I do! 9 A fraction has two numbers written one on top of the other 10 with a line in between. 2 The top number has to be less than the bottom number. It’s called the All Numerator! [gesture] 3 The bottom number has to be greater than the top number. It’s called the All Denominator! [gesture] 4 So for the fraction three fourths, three is the All Numerator! [gesture] 4 And four is the All Denominator! [gesture] 4 Got it? All Got it! [gesture] 7 Okay, I got it about the fractions, but I didn’t get any candy! All Me neither! 1, 5, 6, 8 Mmmmmm, even a fraction of a candy bar is good! [gesture] All [sound effects

13
Guide to Effective Instruction in Mathematics - Number Sense and Numeration - Multiplication
Summary The learning activities in this guide do not address all topics in the Number Sense and Numeration strand, nor do they deal with all concepts and skills outlined in the curriculum expectations for Grades 4 to 6. They do, however, provide models of learning activities that focus on important curriculum topics and that foster understanding of the big ideas in Number Sense and Numeration. Teachers can use these models in developing other learning activities. In the junior grades, instruction should focus on developing students’ understanding of multiplication concepts and meaningful computational strategies, rather than on having students memorize the steps in algorithms. Learning experiences need to contribute to students’ understanding of part-whole relationships – that is, groups of equal size (the parts) can be combined to create a new quantity (the whole). Instruction that is based on meaningful and relevant contexts helps students to achieve the curriculum expectations related to multiplication, listed in the following table.
Knowledge of basic multiplication facts supports students in understanding multiplication concepts, and in carrying out more complex computations with multi-digit multiplication. Students who do not have quick recall of facts often get bogged down and become frustrated when solving a problem. It is important to note that recall of multiplication facts does not necessarily indicate an understanding of multiplication concepts. For example, a student may have memorized the fact 5x6 = 30 but cannot create their own multiplication problem requiring the multiplication of five times six.
Grade 4 Grade 5 Grade 6 Overall Expectations • solve problems involving the addition,
subtraction, multiplication, and division of single and multi-digit whole numbers, and involving the addition and subtraction of decimal numbers to tenths and money amounts, using a variety of strategies;
• demonstrate an understanding of proportional reasoning by investigating whole-number unit rates.
Specific Expectations • multiply to 9 × 9 and divide to 81÷ 9, using a
variety of mental strategies; • solve problems involving the multiplication
of one-digit whole numbers, using a variety of mental strategies;
• multiply whole numbers by 10, 100, and 1000, and divide whole numbers by 10 and 100, using mental strategies;
• multiply two-digit whole numbers by one-digit whole numbers, using a variety of tools,
student-generated algorithms, and standard algorithms;
use estimation when solving problems involving the addition, subtraction, and multiplication of whole numbers, to help judge the reasonableness of a solution;
• describe relationships that involve simple whole-number multiplication;
• demonstrate an understanding of simple multiplicative relationships involving unit rates, through investigation using concrete materials and drawings.
Overall Expectations • solve problems involving the multiplication
and division of multi-digit whole numbers, and involving the addition and subtraction
of decimal numbers to hundredths, using a variety of strategies; • demonstrate an understanding of
proportional reasoning by investigating whole-number rates.
Specific Expectations • solve problems involving the addition,
subtraction, and multiplication of whole numbers, using a variety of mental
strategies; • multiply two-digit whole numbers by two-
digit whole numbers, using estimation, student-generated algorithms, and standard algorithms; • multiply decimal numbers by 10, 100, 1000,
and 10 000, and divide decimal numbers by 10 and 100, using mental strategies;
• use estimation when solving problems involving the addition, subtraction, multiplication, and division of whole numbers, to help judge the reasonableness
of a solution; • describe multiplicative relationships between quantities by using simple fractions and decimals; • demonstrate an understanding of simple
multiplicative relationships involving whole-number rates, through investigation using concrete materials and drawings.
Overall Expectations • solve problems involving the multiplication
and division of whole numbers, and the addition and subtraction of decimal numbers to thousandths, using a variety of strategies;
• demonstrate an understanding of relationships involving percent, ratio, and unit rate.
Specific Expectations • use a variety of mental strategies to solve
addition, subtraction, multiplication, and division problems involving whole numbers;
• solve problems involving the multiplication and division of whole numbers (four-digit by two-digit), using a variety of tools and strategies;
• multiply and divide decimal numbers to tenths by whole numbers, using concrete materials, estimation, algorithms, and calculators;
• multiply whole numbers by 0.1, 0.01, and 0.001 using mental strategies;
• multiply and divide decimal numbers by 10, 100, 1000, and 10 000 using mental strategies.
A Summary of General Instructional Strategies Students in the junior grades benefit from the following instructional strategies: • experiencing a variety of multiplication problems, including equal-group and multiplicative comparison problems; • using concrete and pictorial models to represent mathematical situations, to represent mathematical thinking, and to use as tools for new learning; • solving multiplication problems that serve different instructional purposes (e.g., to introduce new concepts, to learn a particular strategy, to consolidate ideas); • providing opportunities to develop and practice mental computation and estimation strategies; • providing opportunities to connect division to multiplication through problem solving.
14
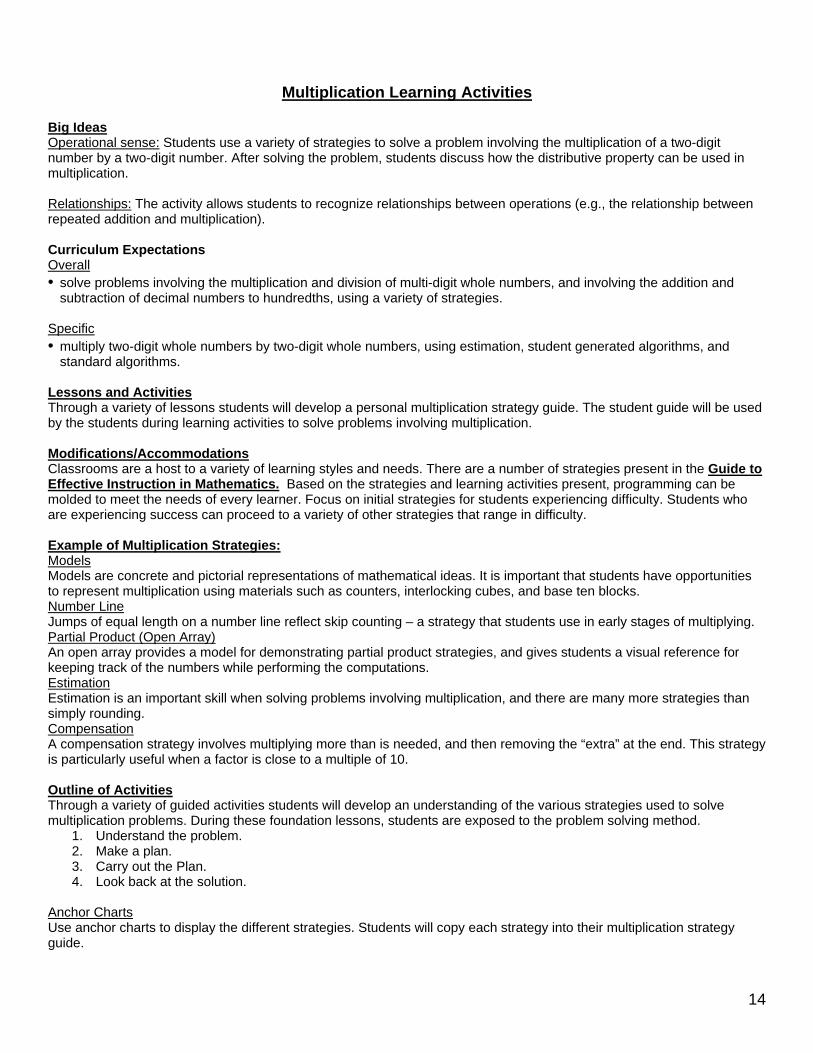
Multiplication Learning Activities Big Ideas Operational sense: Students use a variety of strategies to solve a problem involving the multiplication of a two-digit number by a two-digit number. After solving the problem, students discuss how the distributive property can be used in multiplication. Relationships: The activity allows students to recognize relationships between operations (e.g., the relationship between repeated addition and multiplication). Curriculum Expectations Overall • solve problems involving the multiplication and division of multi-digit whole numbers, and involving the addition and
subtraction of decimal numbers to hundredths, using a variety of strategies. Specific • multiply two-digit whole numbers by two-digit whole numbers, using estimation, student generated algorithms, and
standard algorithms. Lessons and Activities Through a variety of lessons students will develop a personal multiplication strategy guide. The student guide will be used by the students during learning activities to solve problems involving multiplication. Modifications/Accommodations Classrooms are a host to a variety of learning styles and needs. There are a number of strategies present in the Guide to Effective Instruction in Mathematics. Based on the strategies and learning activities present, programming can be molded to meet the needs of every learner. Focus on initial strategies for students experiencing difficulty. Students who are experiencing success can proceed to a variety of other strategies that range in difficulty. Example of Multiplication Strategies: Models Models are concrete and pictorial representations of mathematical ideas. It is important that students have opportunities to represent multiplication using materials such as counters, interlocking cubes, and base ten blocks. Number Line Jumps of equal length on a number line reflect skip counting – a strategy that students use in early stages of multiplying. Partial Product (Open Array) An open array provides a model for demonstrating partial product strategies, and gives students a visual reference for keeping track of the numbers while performing the computations. Estimation Estimation is an important skill when solving problems involving multiplication, and there are many more strategies than simply rounding. Compensation A compensation strategy involves multiplying more than is needed, and then removing the “extra” at the end. This strategy is particularly useful when a factor is close to a multiple of 10. Outline of Activities Through a variety of guided activities students will develop an understanding of the various strategies used to solve multiplication problems. During these foundation lessons, students are exposed to the problem solving method.
1. Understand the problem. 2. Make a plan. 3. Carry out the Plan. 4. Look back at the solution.
Anchor Charts Use anchor charts to display the different strategies. Students will copy each strategy into their multiplication strategy guide.

15
Assessment Various forms of assessment can be used to evaluate student learning. Discussions, anecdotes or paper and pencil tasks such as an exit card can be used to assess each student’s performance. Exit Card Problem Example The students at St. Multiplication School are raising funds for the people of Haiti. Fifty-seven students were asked to bake 6 pies each for the bake sale. 3 additional students surprised everyone, contributing each 1 additional pie. Using the Compensation Strategy, calculate how many pies were originally expected to be baked. In the end how many pies in total were baked?
16
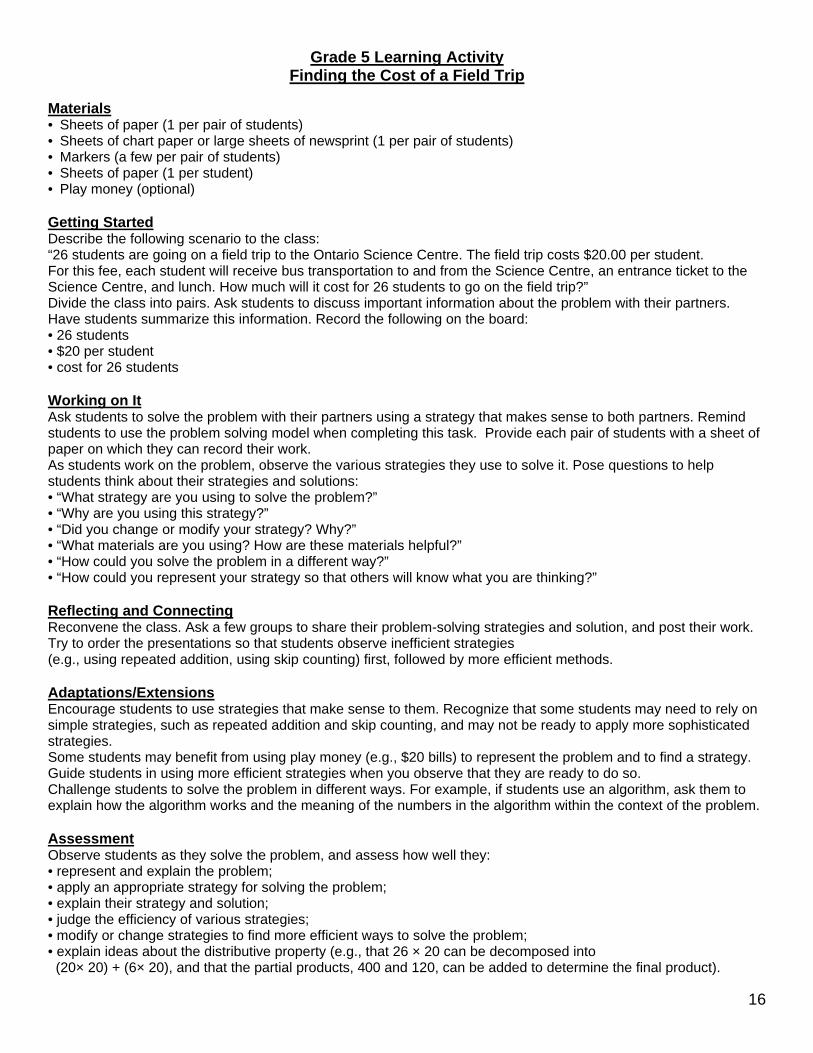
Grade 5 Learning Activity Finding the Cost of a Field Trip
Materials • Sheets of paper (1 per pair of students) • Sheets of chart paper or large sheets of newsprint (1 per pair of students) • Markers (a few per pair of students) • Sheets of paper (1 per student) • Play money (optional) Getting Started Describe the following scenario to the class: “26 students are going on a field trip to the Ontario Science Centre. The field trip costs $20.00 per student. For this fee, each student will receive bus transportation to and from the Science Centre, an entrance ticket to the Science Centre, and lunch. How much will it cost for 26 students to go on the field trip?” Divide the class into pairs. Ask students to discuss important information about the problem with their partners. Have students summarize this information. Record the following on the board: • 26 students • $20 per student • cost for 26 students Working on It Ask students to solve the problem with their partners using a strategy that makes sense to both partners. Remind students to use the problem solving model when completing this task. Provide each pair of students with a sheet of paper on which they can record their work. As students work on the problem, observe the various strategies they use to solve it. Pose questions to help students think about their strategies and solutions: • “What strategy are you using to solve the problem?” • “Why are you using this strategy?” • “Did you change or modify your strategy? Why?” • “What materials are you using? How are these materials helpful?” • “How could you solve the problem in a different way?” • “How could you represent your strategy so that others will know what you are thinking?” Reflecting and Connecting Reconvene the class. Ask a few groups to share their problem-solving strategies and solution, and post their work. Try to order the presentations so that students observe inefficient strategies (e.g., using repeated addition, using skip counting) first, followed by more efficient methods. Adaptations/Extensions Encourage students to use strategies that make sense to them. Recognize that some students may need to rely on simple strategies, such as repeated addition and skip counting, and may not be ready to apply more sophisticated strategies. Some students may benefit from using play money (e.g., $20 bills) to represent the problem and to find a strategy. Guide students in using more efficient strategies when you observe that they are ready to do so. Challenge students to solve the problem in different ways. For example, if students use an algorithm, ask them to explain how the algorithm works and the meaning of the numbers in the algorithm within the context of the problem. Assessment Observe students as they solve the problem, and assess how well they: • represent and explain the problem; • apply an appropriate strategy for solving the problem; • explain their strategy and solution; • judge the efficiency of various strategies; • modify or change strategies to find more efficient ways to solve the problem; • explain ideas about the distributive property (e.g., that 26 × 20 can be decomposed into (20× 20) + (6× 20), and that the partial products, 400 and 120, can be added to determine the final product).

17
Ontario Science Centre
Name: ____________
26 students are going on a field trip to the Ontario Science Centre. The field trip costs $20.00 per student. For this fee, each student will receive bus transportation to and from the Science Centre, an entrance ticket to the Science Centre, and lunch. How much will it cost for 26 students to go on the field trip?”
Use the following guideline to solve the problem.
1. Understand the problem. 2. Make a plan. 3. Carry out the Plan. 4. Look back at the solution.

18
Guide to Effective Instruction in Mathematics Number Sense and Numeration - Division
Overview of Student Activities Big Idea – Students will be able to solve problems involving multiplication and division of whole and decimal numbers using a variety of strategies. Some of the strategies include mental math, estimation, algorithms, and concrete materials. In this case, students will be completing a number sense and numeration unit where various division strategies are being taught. All these lessons will lead up to the culminating activity where students will solve a multi-step word problem that requires them to choose appropriate strategies learned in class to find an answer. The problem solving approach to learning will be used as a template for solving the word problem. Using the Guide to Effective Instruction in Mathematics we have adopted several math centres to reinforce all the various strategies students will be responsible for learning. Each centre will provide the students a chance to review and practice division techniques learned in class. The Guide to Effective Instruction in Mathematics manual is a wonderful companion tool for creating fun math centres that are directly linked to Nelson or Pearson text books used in class. Many of the activities from this manual are game based tasks that provide real hands on fun experiences. The centres are activities to REVIEW all we have already studied in the unit and the culminating activity will be the word problem. All ideas were derived from the Guide to Effective Instruction in Mathematics manual. In this case, the level of difficulty in each centre can be adjusted to meet the needs of a specific grade level. All concepts taught in this particular unit apply to learning expectations in all junior grades. This should make the following activities useful for all junior teachers. Outline of Lesson or Activities The students will rotate through a series of centres described below. In order to complete each centre and move on to the next station, each student must get 3 out of the 4 questions correct. These centres will be reward based. Students will be told they are working towards becoming DIVISION BLACKBELTS and will receive different coloured belts (imaginary) after completing each centre. When all centres are complete the students will get the opportunity to solve the word problem in order to receive their DIVISION BLACK BELT.
19
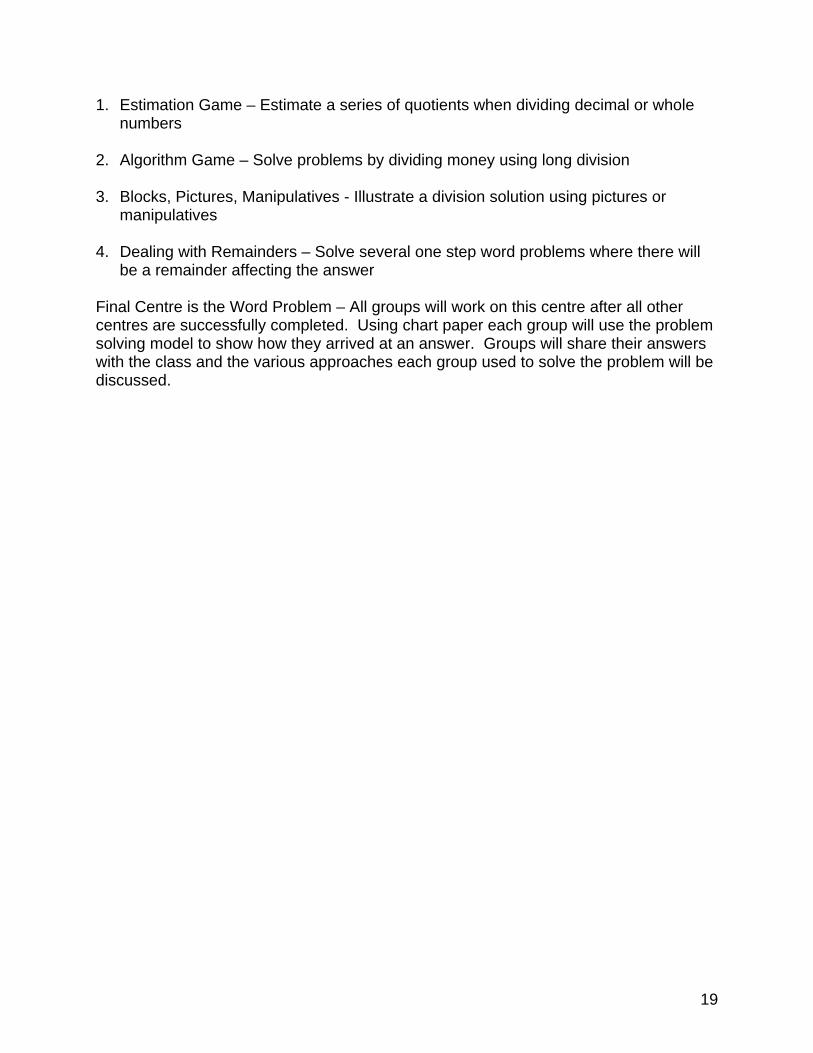
1. Estimation Game – Estimate a series of quotients when dividing decimal or whole numbers 2. Algorithm Game – Solve problems by dividing money using long division 3. Blocks, Pictures, Manipulatives - Illustrate a division solution using pictures or manipulatives 4. Dealing with Remainders – Solve several one step word problems where there will be a remainder affecting the answer Final Centre is the Word Problem – All groups will work on this centre after all other centres are successfully completed. Using chart paper each group will use the problem solving model to show how they arrived at an answer. Groups will share their answers with the class and the various approaches each group used to solve the problem will be discussed.

20
The Karate Kids – Instruction Sheet
Devious Dividend and Dangerous Decimal are back and they are terrorizing the students once again. They seem to be complicating math problems and have children all over the school hiding under their desks during math class. It is even rumoured that all the boys in class have been crying themselves to sleep at night. It is time to unite and fight back. We must show these evil math geniuses who is in charge. The only way to defeat these outlaws is to become DIVISION BLACK BELTS and outsmart them. Once they realize their powers have no effect on you they will be forced to move on and terrorize a new unsuspecting school. GOOD LUCK….I HOPE YOU ATE YOUR VITAMINS AND SAID YOUR PRAYERS! What You Need:
• A pencil • An eraser • Your math notebook • All the courage you can muster
Your Mission:
• You will be split up into groups. • Rotate and complete each centre. • Every centre will have 4 skill testing questions. • Everyone in the group must get at least 3 out of 4 questions right. • If a person fails to get at least 3 correct they must try again. • Once everyone has successfully completed their centre, they will receive a belt. • Only when you have completed all 4 centres and received your 4 belts can you
attempt the word problem that Devious Dividend and Dangerous Decimal have left you……if you successfully solve this problem you will receive your black belt and eliminate our villains.
THE BLACK BELT WORD PROBLEM What You Need:
• A set of coloured markers • A piece of chart paper • Team work • Good communication skills • Grit and bravery……or bravery and grit…..you decide!
Just remember, wax on, wax off
21
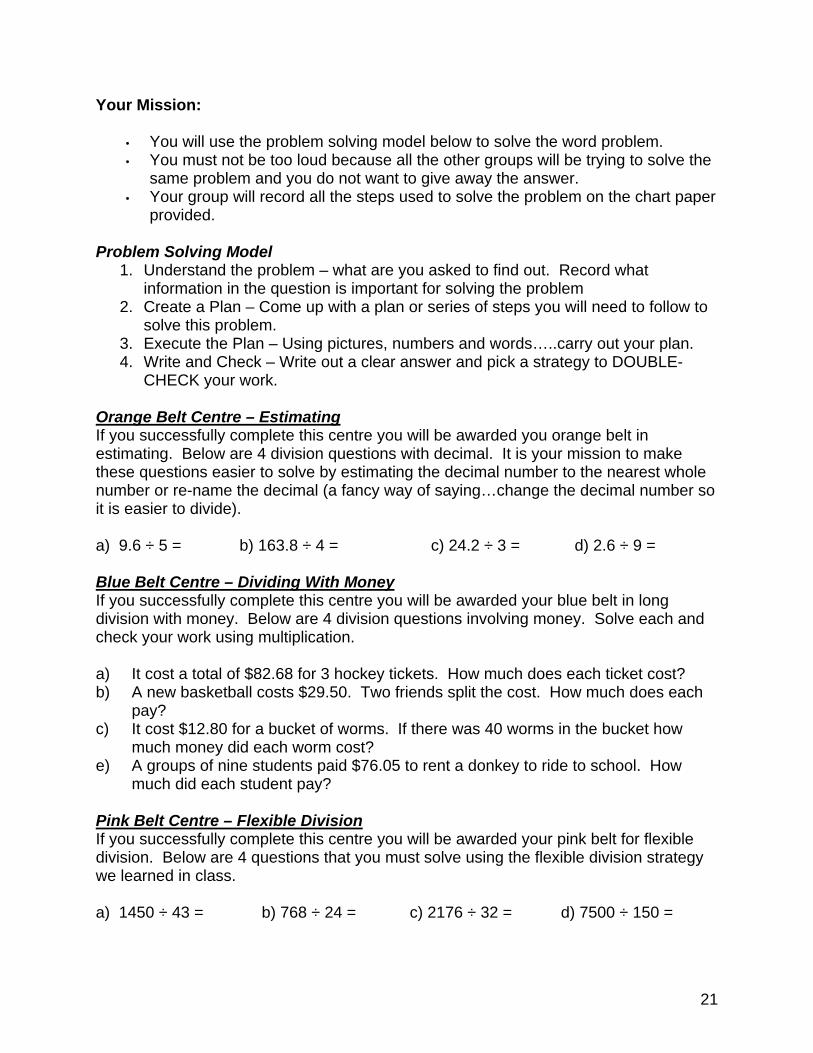
Your Mission:
• You will use the problem solving model below to solve the word problem. • You must not be too loud because all the other groups will be trying to solve the
same problem and you do not want to give away the answer. • Your group will record all the steps used to solve the problem on the chart paper
provided. Problem Solving Model
1. Understand the problem – what are you asked to find out. Record what information in the question is important for solving the problem
2. Create a Plan – Come up with a plan or series of steps you will need to follow to solve this problem.
3. Execute the Plan – Using pictures, numbers and words…..carry out your plan. 4. Write and Check – Write out a clear answer and pick a strategy to DOUBLE-
CHECK your work.
Orange Belt Centre – Estimating If you successfully complete this centre you will be awarded you orange belt in estimating. Below are 4 division questions with decimal. It is your mission to make these questions easier to solve by estimating the decimal number to the nearest whole number or re-name the decimal (a fancy way of saying…change the decimal number so it is easier to divide). a) 9.6 ÷ 5 = b) 163.8 ÷ 4 = c) 24.2 ÷ 3 = d) 2.6 ÷ 9 = Blue Belt Centre – Dividing With Money If you successfully complete this centre you will be awarded your blue belt in long division with money. Below are 4 division questions involving money. Solve each and check your work using multiplication. a) It cost a total of $82.68 for 3 hockey tickets. How much does each ticket cost? b) A new basketball costs $29.50. Two friends split the cost. How much does each
pay? c) It cost $12.80 for a bucket of worms. If there was 40 worms in the bucket how
much money did each worm cost? e) A groups of nine students paid $76.05 to rent a donkey to ride to school. How
much did each student pay? Pink Belt Centre – Flexible Division If you successfully complete this centre you will be awarded your pink belt for flexible division. Below are 4 questions that you must solve using the flexible division strategy we learned in class. a) 1450 ÷ 43 = b) 768 ÷ 24 = c) 2176 ÷ 32 = d) 7500 ÷ 150 =
22
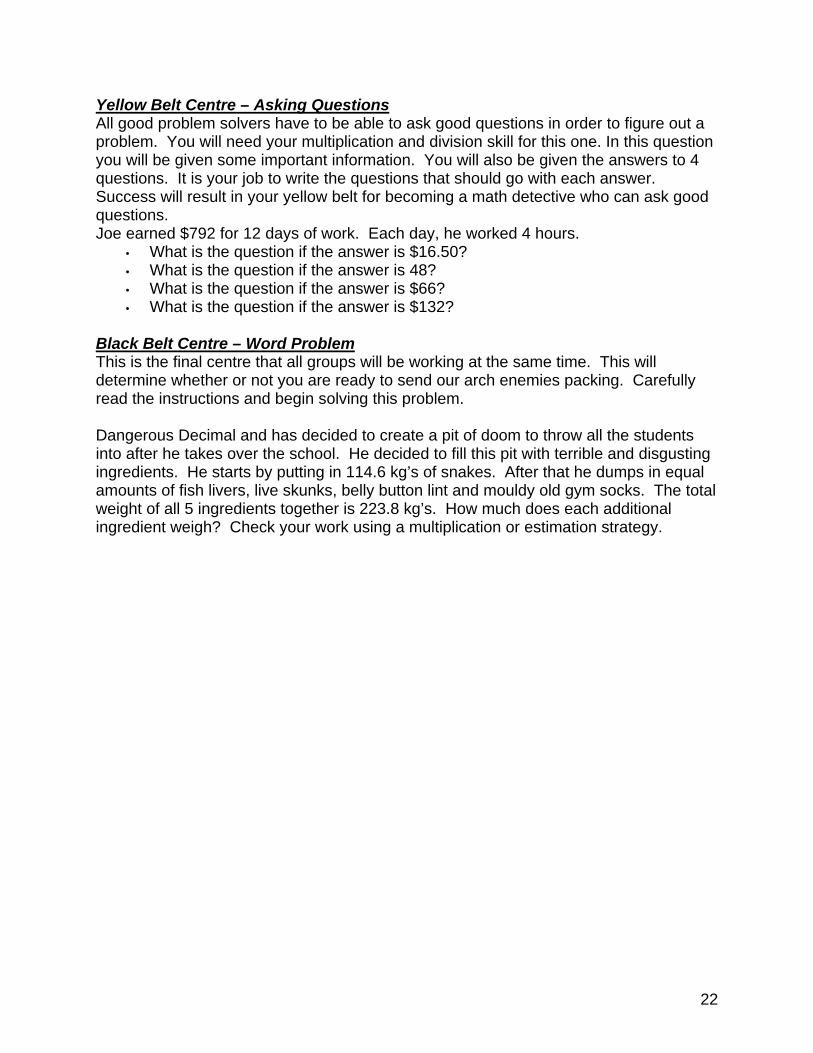
Yellow Belt Centre – Asking Questions All good problem solvers have to be able to ask good questions in order to figure out a problem. You will need your multiplication and division skill for this one. In this question you will be given some important information. You will also be given the answers to 4 questions. It is your job to write the questions that should go with each answer. Success will result in your yellow belt for becoming a math detective who can ask good questions. Joe earned $792 for 12 days of work. Each day, he worked 4 hours.
• What is the question if the answer is $16.50? • What is the question if the answer is 48? • What is the question if the answer is $66? • What is the question if the answer is $132?
Black Belt Centre – Word Problem This is the final centre that all groups will be working at the same time. This will determine whether or not you are ready to send our arch enemies packing. Carefully read the instructions and begin solving this problem. Dangerous Decimal and has decided to create a pit of doom to throw all the students into after he takes over the school. He decided to fill this pit with terrible and disgusting ingredients. He starts by putting in 114.6 kg’s of snakes. After that he dumps in equal amounts of fish livers, live skunks, belly button lint and mouldy old gym socks. The total weight of all 5 ingredients together is 223.8 kg’s. How much does each additional ingredient weigh? Check your work using a multiplication or estimation strategy.
23
The “Big Ideas” of Measurement Grades 4 to 6
The big ideas in measurement are: attributes, units and measurement sense measurement relationships
As students progress through the Junior grades they will use a variety of strategies and the metric system to estimate, measure and record:
length perimeter area mass capacity volume elapsed time temperature change quantities
Junior grade students will determine the relationships among units and measurable attributes including:
area and perimeter of rectangles volume of a rectangular prism area of a parallelogram area of a triangle volume of a triangular prism
Teachers will facilitate this understanding by helping students in Junior grades to:
investigate measurement problems in real life situations extend their knowledge of measurement units and their relationships investigate the relationship between, and develop formulas for, area and
perimeter and surface area and volume extend their knowledge of time and temperature measurement
Measurement, Grades 4 to 6
A Guide to Effective Instruction in Mathematics, Kindergarten to Grade 6

24
Big Ideas and Tiered Instruction The problem on p.17-18 in the document is about investigating relationships involving calculating the area of rectangles. There are three Tiers at which the problem can be approached or extended. This is a sample question from the Ontario Math Curriculum in the Measurement strand and is connected to Algebra, Data Management, Geometry and Spatial Sense. This problem is used at the Grade 10 level in the study of quadratic functions and at the Grade 12 level in the study of calculus concepts. Prior Knowledge
Students enter Junior grades with knowledge of and experience in estimating, measuring and recording:
length perimeter area mass capacity time temperature
using standard and non-standard units in various contexts. Looking at the “Big Ideas” In Attributes, Units and Measurement Sense (pp. 21-30) and Measurement Relationships (pp. 31-39) there are several examples that can be used as entry points or extensions which provide opportunities to engage the Junior learner. Measurement benchmarks can be found on p. 27 and throughout these sections Characteristics of Student Learning and Instructional Strategies are provided. This document also provides Learning Activities for Grade 4, 5 and 6. These include ideas for Tiered Instruction, a Home Connection and Assessment information, including rubrics.
Measurement, Grades 4 to 6 A Guide to Effective Instruction in Mathematics, Kindergarten to Grade 6

25
Grade 5 Learning Activity: W-------eather or Not…
Centre 1 – Measuring Temperature and Recording Temperature Change Overview Students will measure and record temperatures and temperature changes over a period of time. They will use this information to see possible patterns, draw conclusions and make predictions based on their data. This measurement task connects to the Understanding Matter and Energy strand in Science and the Data Management strand of the Math curriculum. Expected Prior Knowledge Students need to understand:
how to read a standard thermometer how to determine whether temperature is rising or falling how to determine benchmarks for freezing, cold, cool and warm temperatures how to construct a double line graph
Big Idea Attributes, units and measurement sense Curriculum Expectations The following specific expectations will be addressed in this activity: Students will:
• estimate and determine elapsed time, with and without using a time line, given the durations of events expressed in minutes, hours, days, weeks, month, or years • measure and record temperatures to determine and represent temperature changes over time
These expectations contribute to the development of the following overall expectation: Students will:
• estimate, measure, and record perimeter, area, temperature change, and elapsed time, using a variety of strategies
Measurement, Grades 4 to 6 A Guide to Effective Instruction in Mathematics, Kindergarten to Grade 6
26
Introduction (p.70-73) Minilesson:
• Review how to read a standard thermometer and conduct a discussion on possible ways to record temperature data. • Model the creation of a temperature graph, using a 24-hour data sample.
Students will work in groups to explore how weather data are presented on websites and/or newspapers. Create a Weather Data anchor chart displaying the measurements taken, the units used and the formats in which the information is displayed. Explore data representations (i.e. line graph) and using think-aloud strategy model how the data are read and used to make informed decisions. Students will collect hourly temperature data during the school day. They can also collect measurements at home in the late afternoon and early evening. This data will be used in the Working on It section to identify high and low temperatures, the range of temperatures on a given day, variations in temperatures throughout the day, and weekly temperature trends. Students will also collect data for an assigned climatic region in Canada. This data will be graphed and the mean temperatures will be compared with this area. Students will discuss and analyze this measurement information and make comparisons and predictions based about the temperatures in each region in a Math journal.
Measurement, Grades 4 to 6 A Guide to Effective Instruction in Mathematics, Kindergarten to Grade 6

27
Weather or Not… Task Card
Measuring Temperature and Recording Temperature Change Materials:
Thermometer Daily data charts to record temperatures at school and at home Graph paper Two different coloured pencil crayons Secondary source of information for climatic region data Math Journal
Your Job: Days One to Four
1. Measure and record temperatures every hour on the hour throughout the school day (and at home, when possible).
2. Graph the previous days’ temperatures for St. Catharines, using a line graph. (The first day you complete this activity you will need a secondary source, such as the Internet, to collect your data.)
3. Record the range of data, noting the times of both the high and the low in your Math journal.
4. Repeat steps 2 and 3 for the climatic region assigned to your group.
Day Five Complete steps 1-3 from above, and do the following tasks in your Math journal: 1. Calculate the mean daily high and low temperatures for the week for St. Catharines and for the climatic region assigned to your group. 2. Record your findings on a double line graph using a different colour to represent
each place. In your Math journal explain what you have learned about temperature data. You may wish to include information detailing what you learned about daily high and low temperatures, daily ranges of temperatures, daily mean temperatures, and weekly temperature trends. Make a prediction about the temperatures for the upcoming week.
28
Suggestions and Variations: 1. Graph:
daily high and/or daily low temperatures each day the mean temperature each day
2. Compare the forecast for the previous day with the actual temperature highs and lows measured by the class. Discuss reasons for discrepancies. 3. Complete the Measuring Precipitation and Hours of Sunlight tasks. Use the weather data and this information to analyze and compare weather trends in their own city and other regions of Canada. Students could collect and compare data from another climatic region of the world to this area. 4. Challenge students to predict the weather for the upcoming week. Use this information to decide whether outdoor activities should be rescheduled; or to recommend suitable attire for the week. 5. Supports and extensions are found on p. 78-79. 7. Rubric is found on p. 80.
29
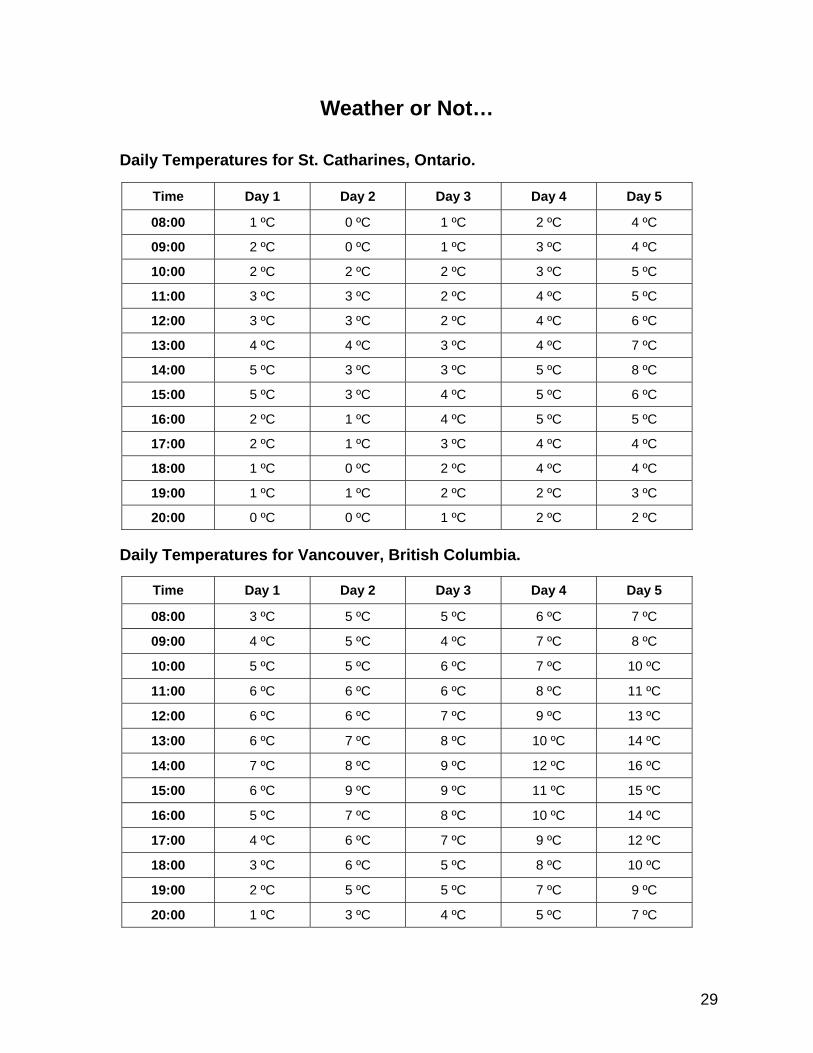
Weather or Not…
Daily Temperatures for St. Catharines, Ontario.
Daily Temperatures for Vancouver, British Columbia.
Time Day 1 Day 2 Day 3 Day 4 Day 5
08:00 3 ºC 5 ºC 5 ºC 6 ºC 7 ºC
09:00 4 ºC 5 ºC 4 ºC 7 ºC 8 ºC
10:00 5 ºC 5 ºC 6 ºC 7 ºC 10 ºC
11:00 6 ºC 6 ºC 6 ºC 8 ºC 11 ºC
12:00 6 ºC 6 ºC 7 ºC 9 ºC 13 ºC
13:00 6 ºC 7 ºC 8 ºC 10 ºC 14 ºC
14:00 7 ºC 8 ºC 9 ºC 12 ºC 16 ºC
15:00 6 ºC 9 ºC 9 ºC 11 ºC 15 ºC
16:00 5 ºC 7 ºC 8 ºC 10 ºC 14 ºC
17:00 4 ºC 6 ºC 7 ºC 9 ºC 12 ºC
18:00 3 ºC 6 ºC 5 ºC 8 ºC 10 ºC
19:00 2 ºC 5 ºC 5 ºC 7 ºC 9 ºC
20:00 1 ºC 3 ºC 4 ºC 5 ºC 7 ºC
Time Day 1 Day 2 Day 3 Day 4 Day 5
08:00 1 ºC 0 ºC 1 ºC 2 ºC 4 ºC
09:00 2 ºC 0 ºC 1 ºC 3 ºC 4 ºC
10:00 2 ºC 2 ºC 2 ºC 3 ºC 5 ºC
11:00 3 ºC 3 ºC 2 ºC 4 ºC 5 ºC
12:00 3 ºC 3 ºC 2 ºC 4 ºC 6 ºC
13:00 4 ºC 4 ºC 3 ºC 4 ºC 7 ºC
14:00 5 ºC 3 ºC 3 ºC 5 ºC 8 ºC
15:00 5 ºC 3 ºC 4 ºC 5 ºC 6 ºC
16:00 2 ºC 1 ºC 4 ºC 5 ºC 5 ºC
17:00 2 ºC 1 ºC 3 ºC 4 ºC 4 ºC
18:00 1 ºC 0 ºC 2 ºC 4 ºC 4 ºC
19:00 1 ºC 1 ºC 2 ºC 2 ºC 3 ºC
20:00 0 ºC 0 ºC 1 ºC 2 ºC 2 ºC
30
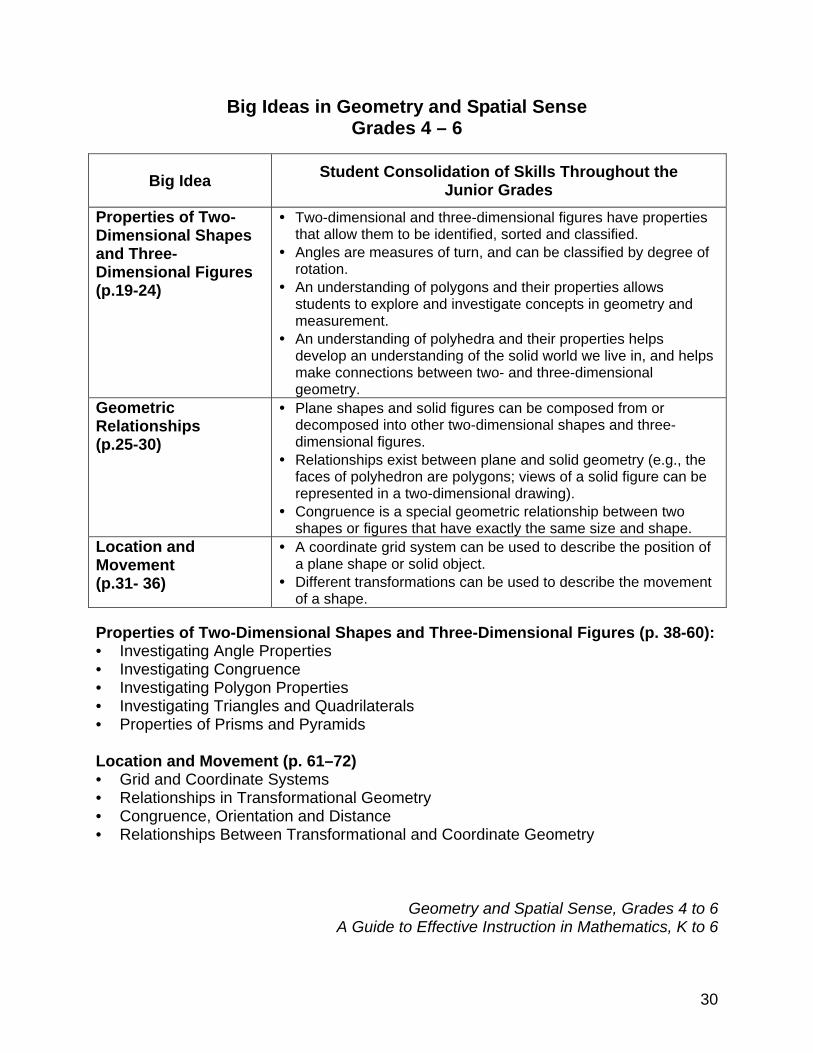
Big Ideas in Geometry and Spatial Sense Grades 4 – 6
Big Idea Student Consolidation of Skills Throughout the Junior Grades
Properties of Two-Dimensional Shapes and Three-Dimensional Figures (p.19-24)
• Two-dimensional and three-dimensional figures have properties that allow them to be identified, sorted and classified.
• Angles are measures of turn, and can be classified by degree of rotation.
• An understanding of polygons and their properties allows students to explore and investigate concepts in geometry and measurement.
• An understanding of polyhedra and their properties helps develop an understanding of the solid world we live in, and helps make connections between two- and three-dimensional geometry.
Geometric Relationships (p.25-30)
• Plane shapes and solid figures can be composed from or decomposed into other two-dimensional shapes and three-dimensional figures.
• Relationships exist between plane and solid geometry (e.g., the faces of polyhedron are polygons; views of a solid figure can be represented in a two-dimensional drawing).
• Congruence is a special geometric relationship between two shapes or figures that have exactly the same size and shape.
Location and Movement (p.31- 36)
• A coordinate grid system can be used to describe the position of a plane shape or solid object.
• Different transformations can be used to describe the movement of a shape.
Properties of Two-Dimensional Shapes and Three-Dimensional Figures (p. 38-60): • Investigating Angle Properties • Investigating Congruence • Investigating Polygon Properties • Investigating Triangles and Quadrilaterals • Properties of Prisms and Pyramids
Location and Movement (p. 61–72) • Grid and Coordinate Systems • Relationships in Transformational Geometry • Congruence, Orientation and Distance • Relationships Between Transformational and Coordinate Geometry
Geometry and Spatial Sense, Grades 4 to 6 A Guide to Effective Instruction in Mathematics, K to 6

31
School : St. Ann Catholic School Grade(s): 6 Lesson Title: Exploring Triangles and Parallelogram
Date: February 2010
Learning Goal (Curriculum Expectations) • Relate the area of a triangle to the area of a parallelogram Big Ideas:
• The area of a triangle is one half the area of a parallelogram with the same base and height • The formula for the area of a triangle is A = (bxh) /2
Three Part Lesson (Components) Before (Activation) • Draw a rectangle, parallelogram and triangle on the board each with base 10 units/ height 8 units • Ask how are these figures the same? What is the area of each figure? (see p.20 of manual) During (Working on It) Students: 1. Students are to complete Explore question on p. 358 in pairs. (each pair will need: scissors,
tape and 1cm grid paper) 2. When activity is completed, they will “show and share” (p. 358) their work with their other group
members Teacher: 1. Observes how pairs use appropriate formulas for figures given. Teachers will ask:
• How did you arrange two congruent triangles to make a parallelogram? • How many different parallelograms can you make with each pair of triangles? • How did you find the area of triangle A? • How is the area of a triangle related to the area of a parallelogram with the same base and
height? After (Consolidation) Bansho of students’ work (3 – 4 pieces) with student comments and teacher feedback. Aspects of the solutions are highlighted/annotated to explicitly show students’ thinking processes. Ask: • How are the areas of a rectangle, triangle, and parallelogram with the same base and height all
related? After (Highlights and Summary) After (Practice) Students are to complete the Practice section on p. 360 #1, 2a,b,c ,3, 4, 7a,b, 9, and Reflect
32
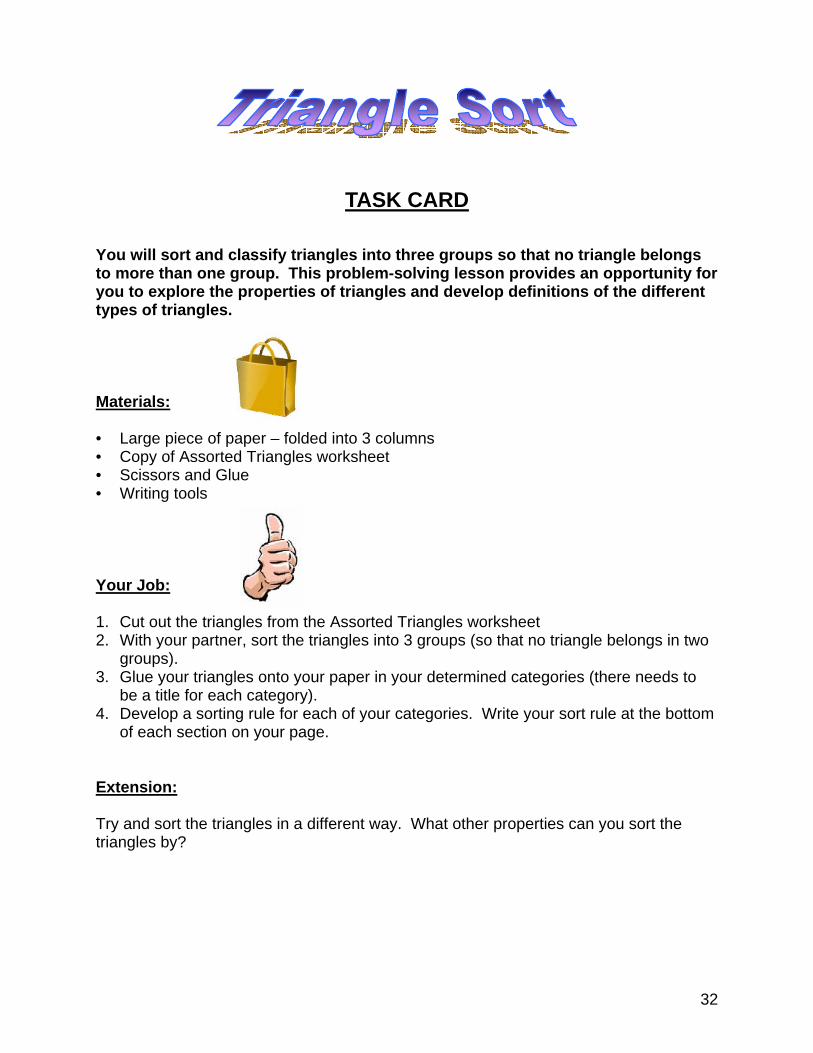
TASK CARD
You will sort and classify triangles into three groups so that no triangle belongs to more than one group. This problem-solving lesson provides an opportunity for you to explore the properties of triangles and develop definitions of the different types of triangles. Materials: • Large piece of paper – folded into 3 columns • Copy of Assorted Triangles worksheet • Scissors and Glue • Writing tools
Your Job: 1. Cut out the triangles from the Assorted Triangles worksheet 2. With your partner, sort the triangles into 3 groups (so that no triangle belongs in two
groups). 3. Glue your triangles onto your paper in your determined categories (there needs to
be a title for each category). 4. Develop a sorting rule for each of your categories. Write your sort rule at the bottom
of each section on your page. Extension: Try and sort the triangles in a different way. What other properties can you sort the triangles by?

33
Patterning & Algebra
Lesson Title: Picnic Partners
Learning Goals: Introduction to exploration of growing patterns (sequences)
Big Ideas: Patterning and relationships Before (Activation):
Teacher shows 30 cubes or coloured tiles, half in one colour and half in a second colour. Ask students to think, pair, share: What pattern can you create with coloured tiles? Ask students to analyze your pattern that you have created and for them to discover the rule for the pattern orally.
During:
The grade 1 teacher has asked our class to help her out with a problem. She is planning a picnic for her class and each student is going to bring one visitor. She started planning the seating by drawing a picture of the picnic tables. She thinks that 8 people can sit at one table, but that won’t be enough seating for every student and every guest. She wants everyone to sit at the same table. If she pushed two tables together, 10 people could sit down. ! ! ! ! ! ! ! ! ! ! ! ! ! ! ! ! ! ! Table1 Table 2 How many picnic tables will the Grade 1 class need to seat 30 people?
After (Consolidation):
• Teacher selects 3 or 4 samples to use for the consolidation of the lesson. Different representations of the problem and the solution should be chosen to provide opportunities for rich discussion and dialogue about the math. • Teacher decides on bansho, math congress or gallery walk
After (Highlights and Summary):
• Record the variety of strategies students used to solve the question
After (Practice): Extension Activity:
Space Station Challenge Task Card and or Growing Design Task Card
34
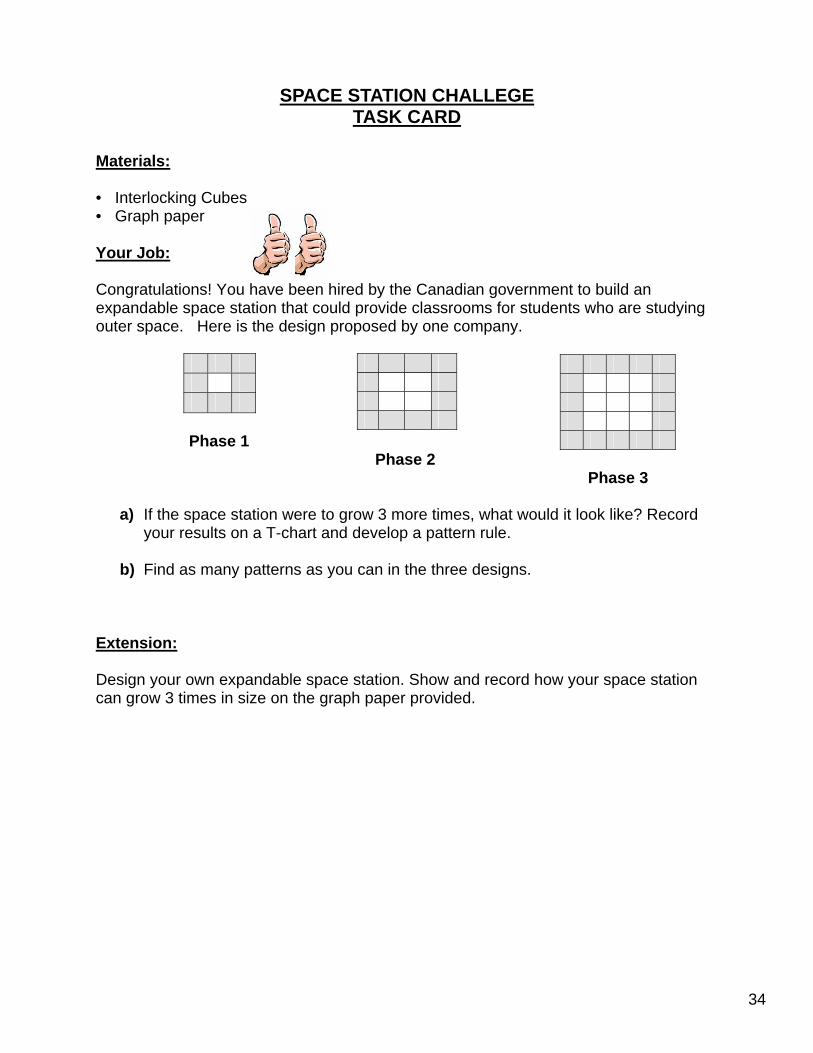
SPACE STATION CHALLEGE TASK CARD
Materials: • Interlocking Cubes • Graph paper Your Job: Congratulations! You have been hired by the Canadian government to build an expandable space station that could provide classrooms for students who are studying outer space. Here is the design proposed by one company.
Phase 1 Phase 2 Phase 3
a) If the space station were to grow 3 more times, what would it look like? Record your results on a T-chart and develop a pattern rule.
b) Find as many patterns as you can in the three designs.
Extension: Design your own expandable space station. Show and record how your space station can grow 3 times in size on the graph paper provided.

35
The Growing Design TASK CARD
Materials: • Graph paper • Interlocking Cubes or coloured tiles • Graphic Organizer of choice Stage 1
Stage 2 Stage 3
Your Job: With your elbow partner, build the first three stages of the design using the coloured tiles or interlocking cubes. Record your results using the chart below and finish the pattern.
Stage Number of Colour 1 Tiles Used
Number of Colour 2 Tiles Used
Total Number of Tiles Used
1 2 3 4 5 6 7
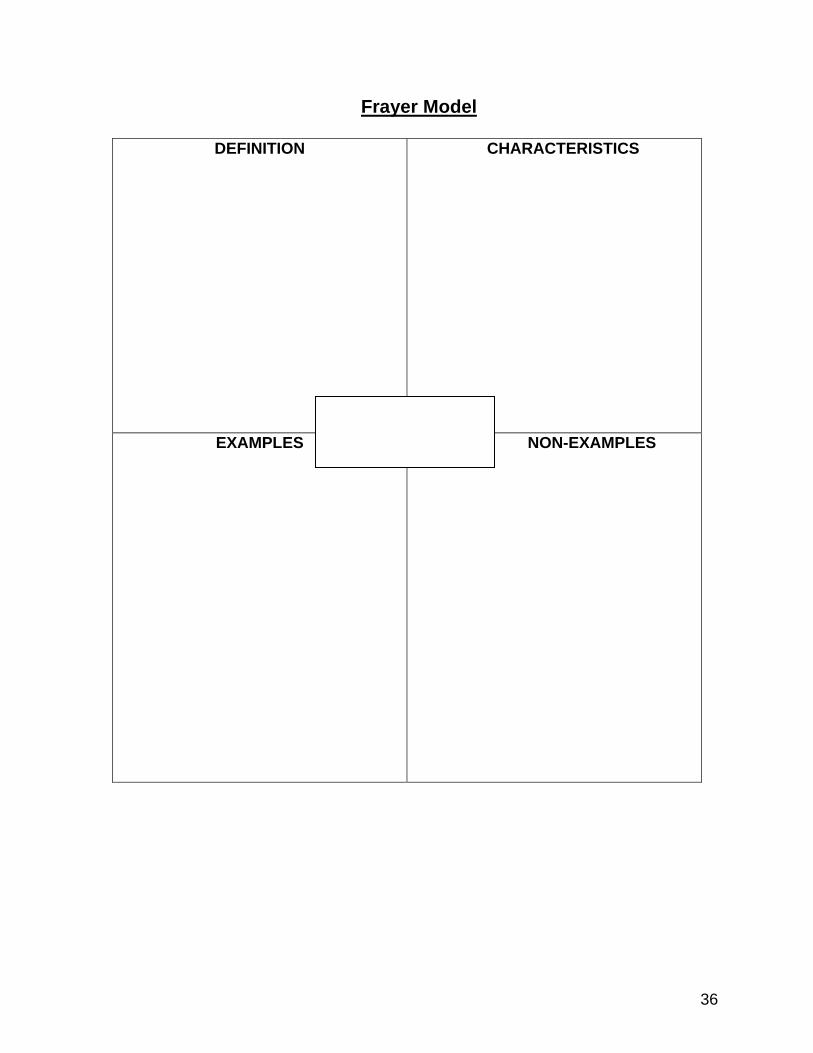
What different patterns can you see? How can you use those patterns to help you predict: • The number of Colour 1 tiles at stage 10? • The number of Colour 2 tiles at stage 10? • The total number of tiles at stage 10? Extension: Create your very own work of art using different coloured strips of paper. Create a growing pattern in your design and describe your pattern using the Frayer’s Model.
36
Frayer Model
DEFINITION
CHARACTERISTICS
EXAMPLES
NON-EXAMPLES
37
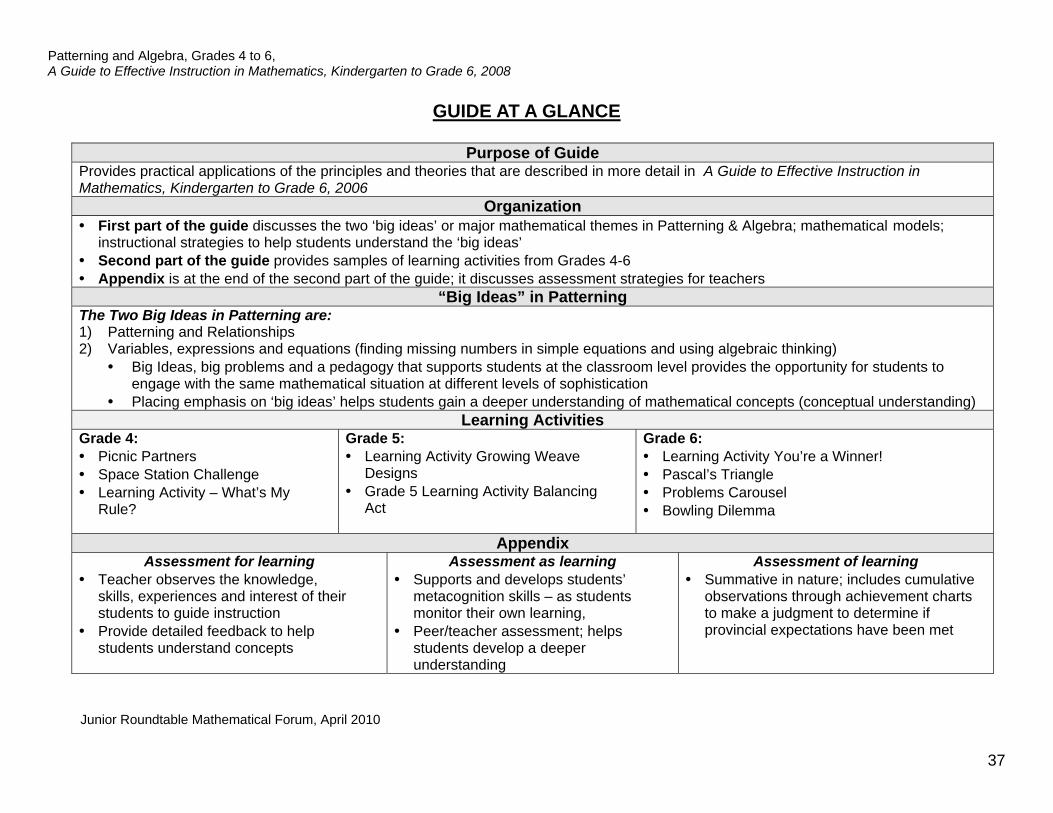
Patterning and Algebra, Grades 4 to 6, A Guide to Effective Instruction in Mathematics, Kindergarten to Grade 6, 2008
GUIDE AT A GLANCE
Purpose of Guide Provides practical applications of the principles and theories that are described in more detail in A Guide to Effective Instruction in Mathematics, Kindergarten to Grade 6, 2006
Organization • First part of the guide discusses the two ‘big ideas’ or major mathematical themes in Patterning & Algebra; mathematical models; instructional strategies to help students understand the ‘big ideas’ • Second part of the guide provides samples of learning activities from Grades 4-6 • Appendix is at the end of the second part of the guide; it discusses assessment strategies for teachers
“Big Ideas” in Patterning The Two Big Ideas in Patterning are: 1) Patterning and Relationships 2) Variables, expressions and equations (finding missing numbers in simple equations and using algebraic thinking)
• Big Ideas, big problems and a pedagogy that supports students at the classroom level provides the opportunity for students to engage with the same mathematical situation at different levels of sophistication
• Placing emphasis on ‘big ideas’ helps students gain a deeper understanding of mathematical concepts (conceptual understanding) Learning Activities
Grade 4: • Picnic Partners • Space Station Challenge • Learning Activity – What’s My Rule?
Grade 5: • Learning Activity Growing Weave Designs • Grade 5 Learning Activity Balancing Act
Grade 6: • Learning Activity You’re a Winner! • Pascal’s Triangle • Problems Carousel • Bowling Dilemma
Appendix Assessment for learning
• Teacher observes the knowledge, skills, experiences and interest of their students to guide instruction • Provide detailed feedback to help students understand concepts
Assessment as learning • Supports and develops students’ metacognition skills – as students monitor their own learning, • Peer/teacher assessment; helps students develop a deeper understanding
Assessment of learning • Summative in nature; includes cumulative observations through achievement charts to make a judgment to determine if provincial expectations have been met
Junior Roundtable Mathematical Forum, April 2010
38
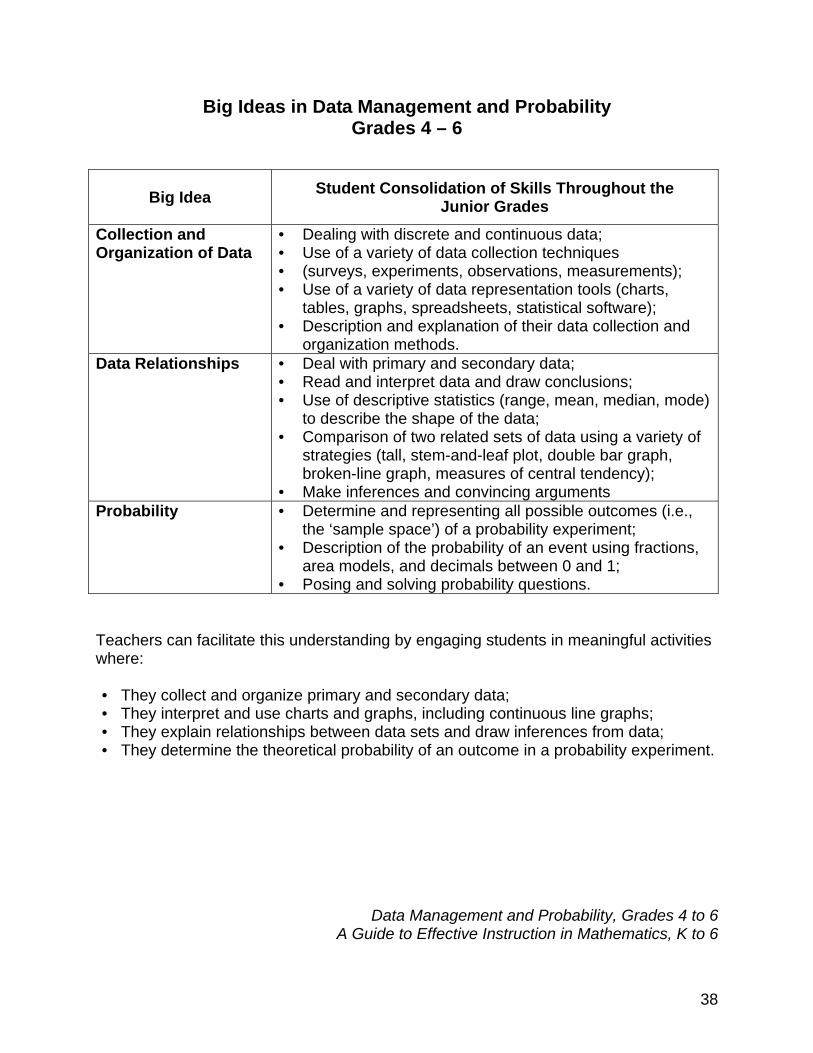
Big Ideas in Data Management and Probability Grades 4 – 6
Big Idea Student Consolidation of Skills Throughout the Junior Grades
Collection and Organization of Data
• Dealing with discrete and continuous data; • Use of a variety of data collection techniques • (surveys, experiments, observations, measurements); • Use of a variety of data representation tools (charts,
tables, graphs, spreadsheets, statistical software); • Description and explanation of their data collection and
organization methods. Data Relationships
• Deal with primary and secondary data; • Read and interpret data and draw conclusions; • Use of descriptive statistics (range, mean, median, mode)
to describe the shape of the data; • Comparison of two related sets of data using a variety of
strategies (tall, stem-and-leaf plot, double bar graph, broken-line graph, measures of central tendency);
• Make inferences and convincing arguments Probability • Determine and representing all possible outcomes (i.e.,
the ‘sample space’) of a probability experiment; • Description of the probability of an event using fractions,
area models, and decimals between 0 and 1; • Posing and solving probability questions.
Teachers can facilitate this understanding by engaging students in meaningful activities where: • They collect and organize primary and secondary data; • They interpret and use charts and graphs, including continuous line graphs; • They explain relationships between data sets and draw inferences from data; • They determine the theoretical probability of an outcome in a probability experiment.
Data Management and Probability, Grades 4 to 6 A Guide to Effective Instruction in Mathematics, K to 6
39
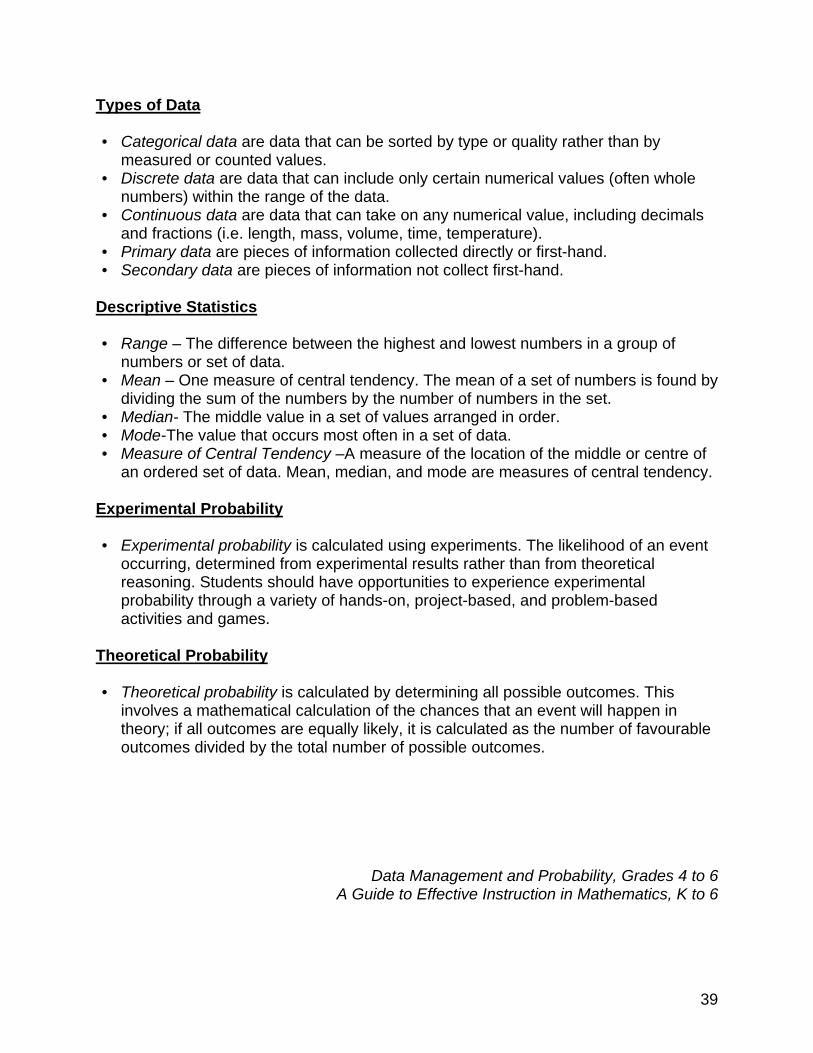
Types of Data • Categorical data are data that can be sorted by type or quality rather than by measured or counted values. • Discrete data are data that can include only certain numerical values (often whole numbers) within the range of the data. • Continuous data are data that can take on any numerical value, including decimals and fractions (i.e. length, mass, volume, time, temperature). • Primary data are pieces of information collected directly or first-hand. • Secondary data are pieces of information not collect first-hand.
Descriptive Statistics • Range – The difference between the highest and lowest numbers in a group of numbers or set of data. • Mean – One measure of central tendency. The mean of a set of numbers is found by dividing the sum of the numbers by the number of numbers in the set. • Median- The middle value in a set of values arranged in order. • Mode-The value that occurs most often in a set of data. • Measure of Central Tendency –A measure of the location of the middle or centre of an ordered set of data. Mean, median, and mode are measures of central tendency.
Experimental Probability • Experimental probability is calculated using experiments. The likelihood of an event occurring, determined from experimental results rather than from theoretical reasoning. Students should have opportunities to experience experimental probability through a variety of hands-on, project-based, and problem-based activities and games.
Theoretical Probability • Theoretical probability is calculated by determining all possible outcomes. This involves a mathematical calculation of the chances that an event will happen in theory; if all outcomes are equally likely, it is calculated as the number of favourable outcomes divided by the total number of possible outcomes.
Data Management and Probability, Grades 4 to 6
A Guide to Effective Instruction in Mathematics, K to 6
40
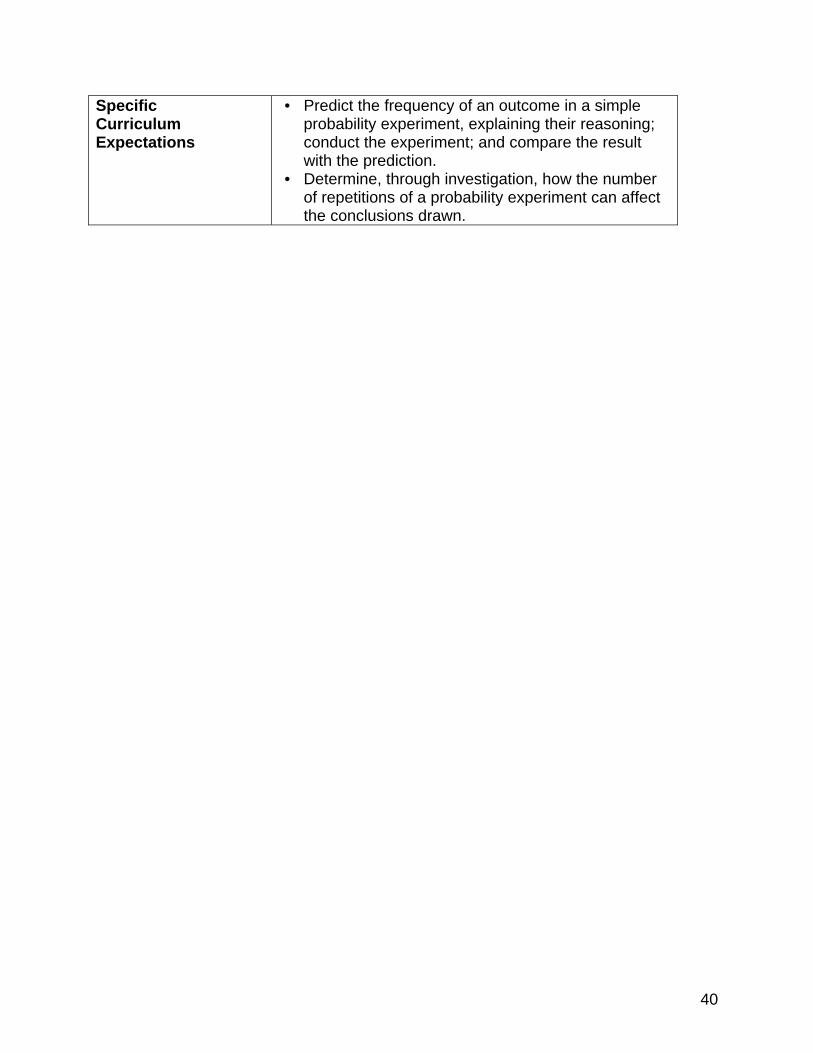
Specific Curriculum Expectations
• Predict the frequency of an outcome in a simple probability experiment, explaining their reasoning; conduct the experiment; and compare the result with the prediction. • Determine, through investigation, how the number of repetitions of a probability experiment can affect the conclusions drawn.
41
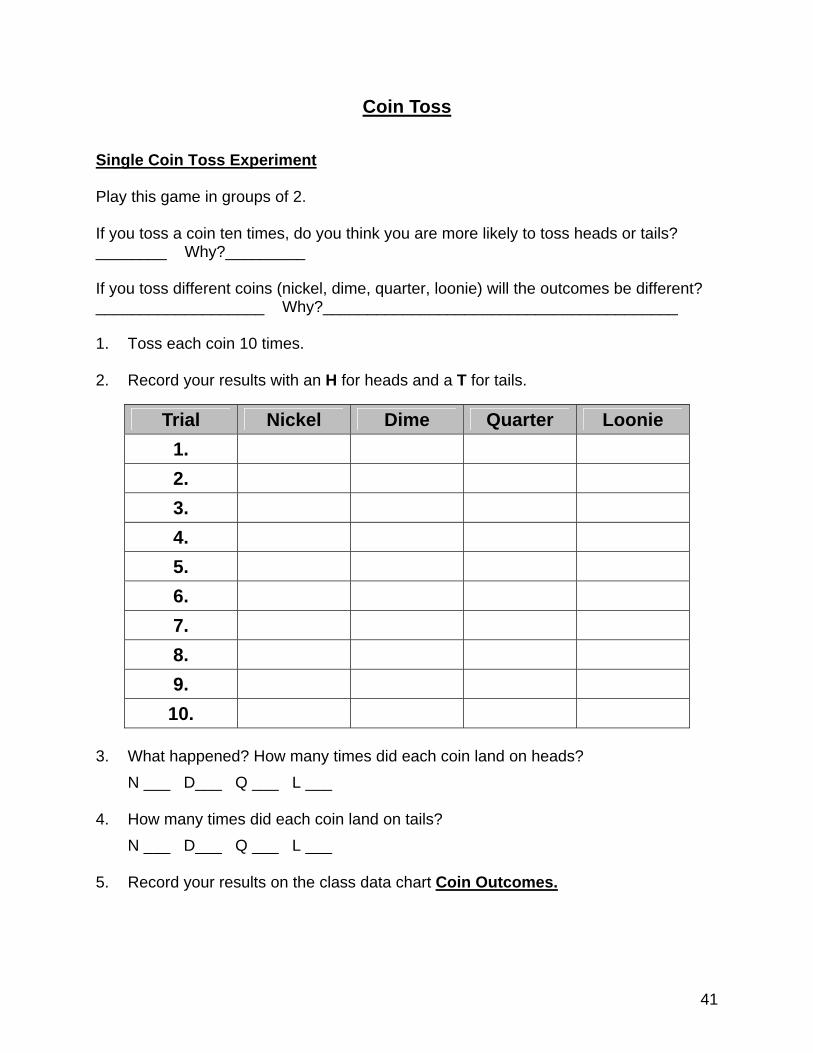
Coin Toss Single Coin Toss Experiment Play this game in groups of 2. If you toss a coin ten times, do you think you are more likely to toss heads or tails? ________ Why?_________ If you toss different coins (nickel, dime, quarter, loonie) will the outcomes be different? ___________________ Why?________________________________________ 1. Toss each coin 10 times. 2. Record your results with an H for heads and a T for tails.
Trial Nickel Dime Quarter Loonie 1. 2. 3. 4. 5. 6. 7. 8. 9.
10. 3. What happened? How many times did each coin land on heads? N ___ D___ Q ___ L ___ 4. How many times did each coin land on tails? N ___ D___ Q ___ L ___ 5. Record your results on the class data chart Coin Outcomes.

42
Two Coin Toss Race Play this game in groups of 2. If you toss two coins ten times, which bar will win the race?
2 heads ___ 1 head, 1 tail ___ or 2 tails___? Why?___________________________________________ 1. Toss two coins 10 times and record your results by shading in the appropriate box. 2. Complete five races!
2 heads 1 head, 1 tail
2 tails
2 heads 1 head, 1 tail
2 tails
2 heads 1 head, 1 tail
2 tails
2 heads 1 head, 1 tail
2 tails

43
2 heads 1 head, 1 tail
2 tails 3. What is the probability of tossing 2 heads?________________________ 4. What is the probability of tossing 2 tails? _________________________ 5. What is the probability of tossing 1 head, 1 tail? ___________________
44
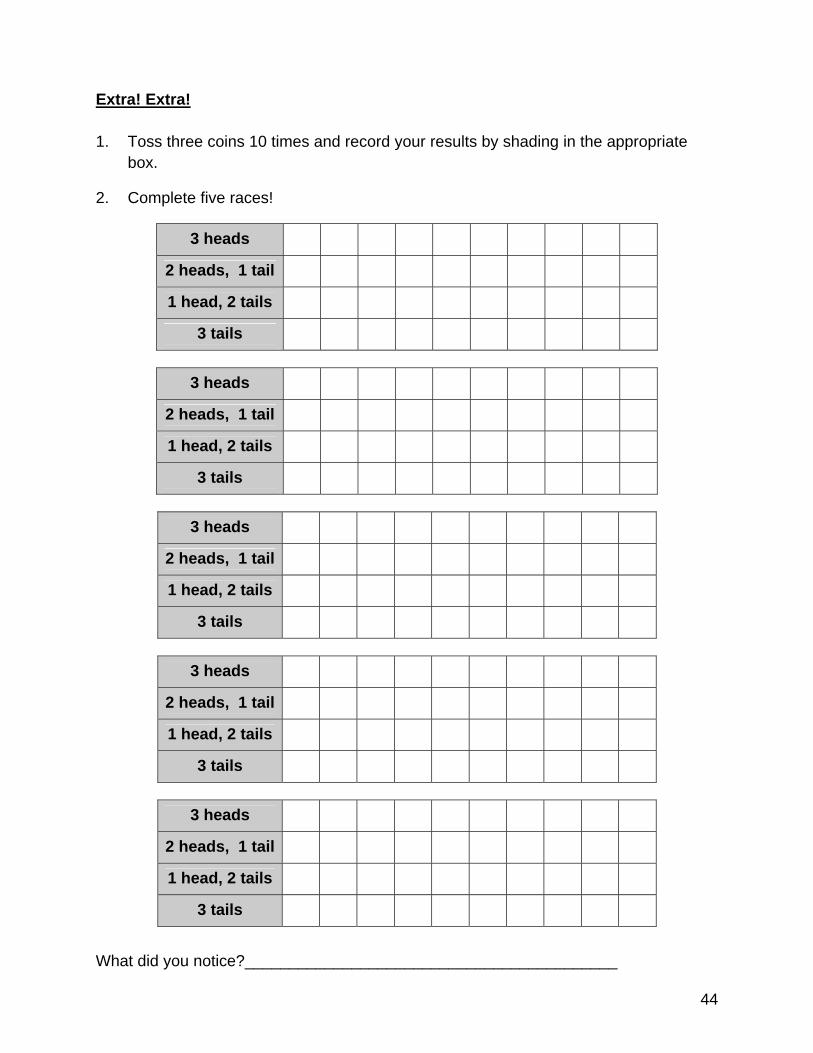
Extra! Extra! 1. Toss three coins 10 times and record your results by shading in the appropriate box.
2. Complete five races!
3 heads
2 heads, 1 tail
1 head, 2 tails
3 tails
3 heads
2 heads, 1 tail
1 head, 2 tails
3 tails
3 heads
2 heads, 1 tail
1 head, 2 tails
3 tails
3 heads
2 heads, 1 tail
1 head, 2 tails
3 tails
3 heads
2 heads, 1 tail
1 head, 2 tails
3 tails
What did you notice?__________________________________________