The Melbourne University Mathematics & Statsitics Society presents:
Indigenous Knowledge | Mathematics of bushfire Page 1 of 21
— Indigenous Knowledge Mathematics Year 9
Mathematics of bushfire Classroom activity handout
This work is licensed under a Creative Commons Attribution-NonCommercial-NoDerivatives 4.0 International License.
The development of these resources was funded through an Australian Government initiative delivered by the University of Melbourne's Indigenous Studies Unit. The resources include the views, opinions and representations of third parties, and do not represent the views of the Australian Government. They have been developed as a proof of concept to progress the inclusion of Aboriginal and Torres Strait Islander content in Australian classrooms. In drawing on the material, users should consider the relevance and suitability to their particular circumstances and purposes.
Indigenous Knowledge | Mathematics of bushfire Page 2 of 21
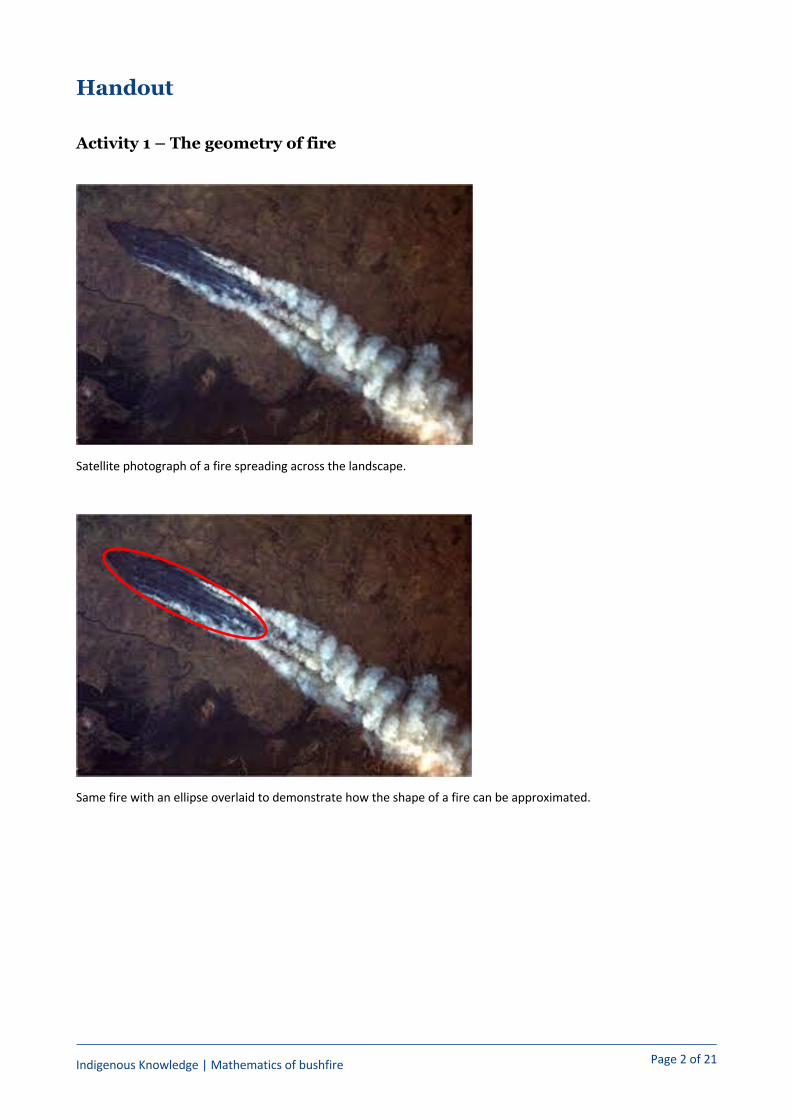
Handout Activity 1 – The geometry of fire
Satellite photograph of a fire spreading across the landscape.
Same fire with an ellipse overlaid to demonstrate how the shape of a fire can be approximated.

Indigenous Knowledge | Mathematics of bushfire Page 3 of 21
Basic parts of a wind-driven fire:
Properties of the ellipse:
Length-to-breadth ratio:
𝐿𝐵 =2𝑎2𝑏 =
𝑎𝑏
Area of an ellipse:
𝐴 = 𝜋𝑎𝑏
Indigenous Knowledge | Mathematics of bushfire Page 4 of 21
Problems
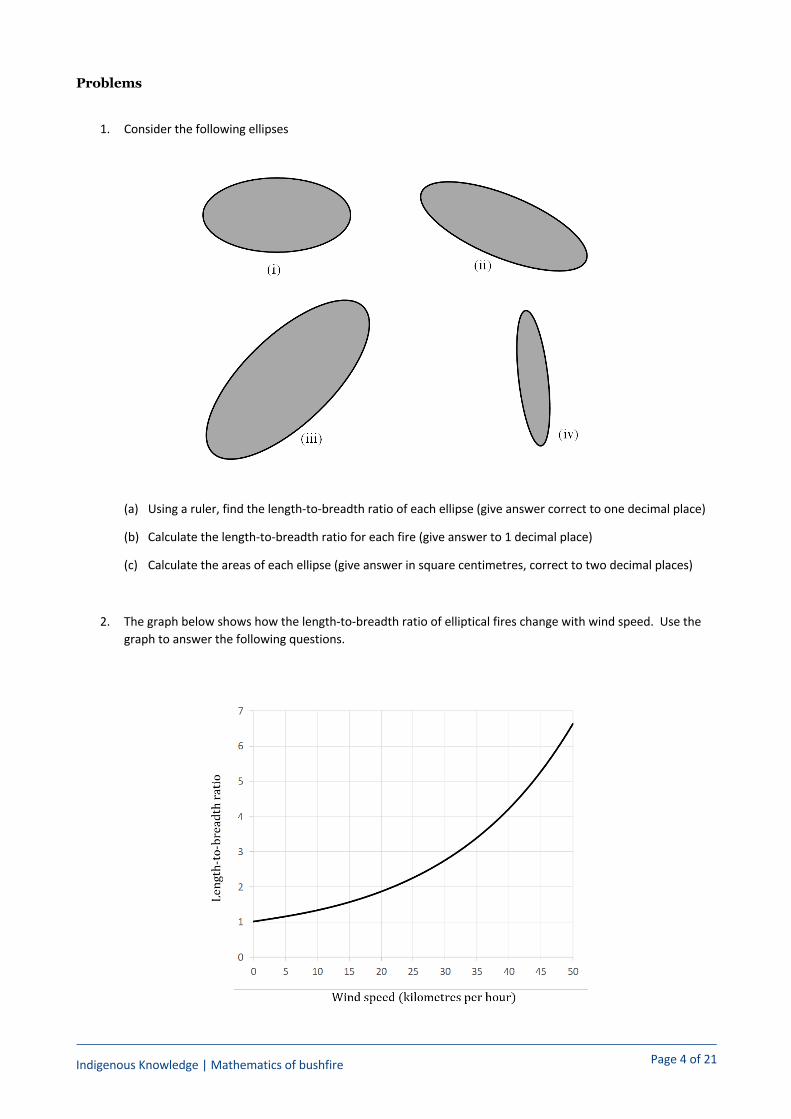
1. Consider the following ellipses
(a) Using a ruler, find the length-to-breadth ratio of each ellipse (give answer correct to one decimal place)
(b) Calculate the length-to-breadth ratio for each fire (give answer to 1 decimal place)
(c) Calculate the areas of each ellipse (give answer in square centimetres, correct to two decimal places)
2. The graph below shows how the length-to-breadth ratio of elliptical fires change with wind speed. Use the graph to answer the following questions.

Indigenous Knowledge | Mathematics of bushfire Page 5 of 21
(a) If the wind speed was 10 km/h what would the length-to-breadth ratio of a fire be?
(b) If the wind speed was 25 km/h what would the length-to-breadth ratio of a fire be?
(c) If the length-to-breadth ratio of a fire is 4.2, what was the wind speed?
(d) What was the wind speed for each of the fires in question 1?
(e) Draw a diagram showing a fire that is spreading under a wind that is blowing from the north-west with a speed of 45 km/h.
3. Use ellipses, rectangles and triangles to estimate the area of these fires in hectares. Express your answer using scientific notation.
(a)
(b)
(c)
Indigenous Knowledge | Mathematics of bushfire Page 6 of 21
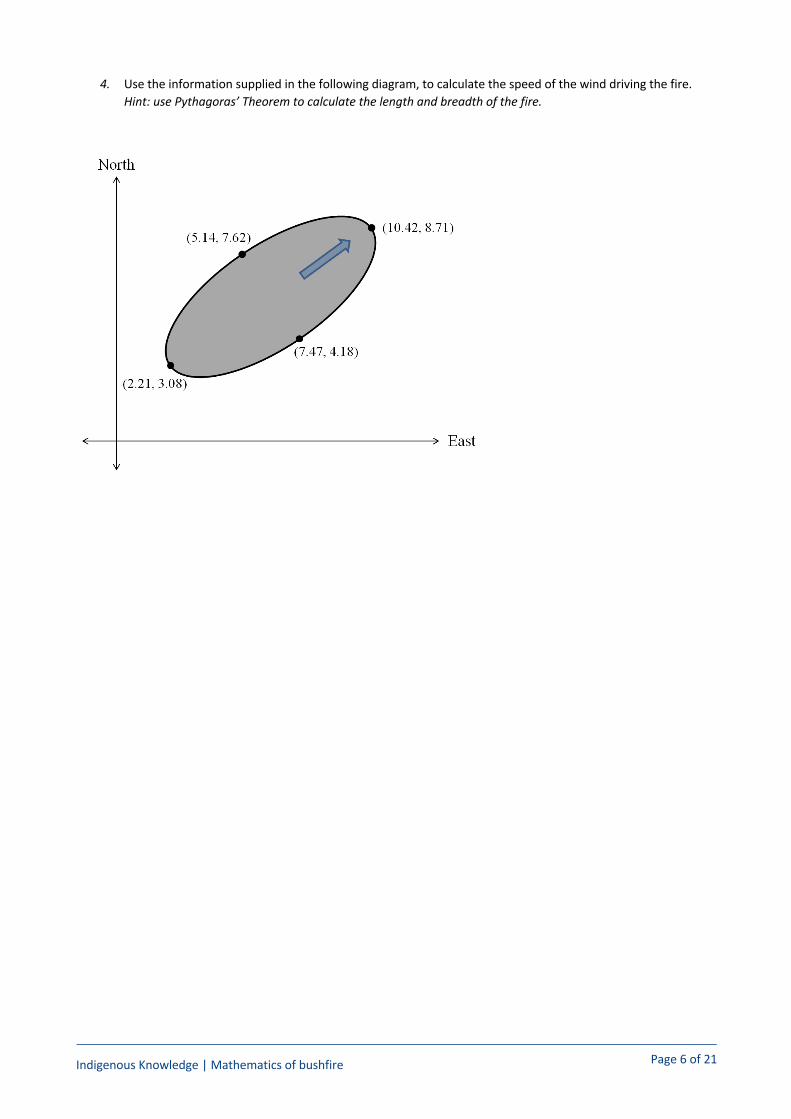
4. Use the information supplied in the following diagram, to calculate the speed of the wind driving the fire. Hint: use Pythagoras’ Theorem to calculate the length and breadth of the fire.

Indigenous Knowledge | Mathematics of bushfire Page 7 of 21
Activity 2 – Fire behaviour (Part one)
Fire rate of spread
The fastest moving and most intense part of a bushfire is the head fire. To help make decisions about where to send fire crews and declare evacuations, fire managers use mathematical equations to give estimates of the head fire rate of spread. The equations convert environmental variables such as temperature, wind speed, relative humidity and fuel conditions into a rate of spread.
➢ Temperature 𝑇is measured in degrees Celsius (°C)
➢ Wind speed 𝑈is measured in kilometres per hour (km/h)
➢ Relative humidity𝐻 is measured in percent (%)
Rate of fire spread (km/h) in forest:
𝑅 =2.518 × 𝑈60 − 𝑇 + 𝐻
Rate of fire spread (km/h) in grassland:
𝑅 =11.324 × 𝑈60 − 𝑇 + 𝐻
Note that these equations give the rate of spread of a fire travelling on flat ground. If the fire is travelling up or down a hill the rate of spread needs to be modified.
Question 1 If the temperature is 20°C, the relative humidity is 25% and the wind speed is 15 km/h, how fast would a forest fire spread on flat ground?
Effect of slope on fire rate of spread
The steepness of a hill is described by its slope angle. In the picture on the next page there is a fire burning on flat ground and on a hill with a slope angle of 10 degrees.
For a person, it is harder to walk up a steep hill – but for a fire, it is the opposite! Fires spread faster up steeper hills.
In fact, for every additional 10 degrees of steepness, a fire will double its rate of spread.
Indigenous Knowledge | Mathematics of bushfire Page 8 of 21
Example: If a fire spreads at 5.3 km/h on flat ground, then:
● it will spread at 10.6 km/h on a 10° slope
● it will spread at 21.2 km/h on a 20° slope
● it will spread at 42.4 km/h on a 30° slope
In general, if the rate of spread of the fire on flat ground is 𝑅9, then the rate of spread of the fire spreading up a hill with slope angle 𝜃 is given by the mathematical equation:
𝑅 = 𝑅9 × 2(9.<×=)
If the fire is spreading down the hill, then the rate of spread is less than the flat ground rate of spread and is given by the mathematical equation:
𝑅 =𝑅9 × 2(9.<×=)
29.<×(=?<9) − 1
Question 2 If a fire spreads at 2 km/h on flat ground, then how fast will it spread on a 15° slope? How fast will it spread down a 22° slope?
Question 3 If the temperature is 30°C, the relative humidity is 20% and the wind speed is 25 km/h, how fast would a grass fire spread up a hill with an 8° slope? How fast would it travel down a 12° slope?

Indigenous Knowledge | Mathematics of bushfire Page 9 of 21
Problem set 1
1. If the temperature is 20°C, the relative humidity is 10% and the wind speed is 40 km/h, how fast would a forest fire spread on flat ground?
2. If the temperature is 35°C, the relative humidity is 5% and the wind speed is 45 km/h, how fast would a fire spread in flat grasslands? Do you think you would be able to outrun this fire?
3. The temperature is 27°C and the relative humidity is 16%. If a grass fire is observed to be spreading at 10 km/h over flat ground, what must the wind speed be?
4. Go to the Bureau of Meteorology website1 and find the weather station nearest to you. Use the current temperature, relative humidity and wind speed to calculate the rate of spread of a forest fire and a grass fire. Which is faster? Why do you think fire would spread faster in this type of vegetation?
5. The weather forecast issued at 10 am indicates that the wind speed and relative humidity will remain constant at 25 km/h and 13%, respectively, for the rest of the day. The temperature, however, is forecast to rise at 2.5°C per hour, starting from 18°C at 10 am. Use this information to complete the following table:
Time of day
Temperature (°C)
Rate of fire spread in grassland (km/h)
10 am 18.0
11 am 5.2
1 pm 25.5
2 pm
3 pm
4 pm 6.8
6 pm
1 http://www.bom.gov.au/nsw/observations/map.shtml

Indigenous Knowledge | Mathematics of bushfire Page 10 of 21
Problem set 2
1. If a fire spreads at 2.6 km/h on flat ground, then how fast will it spread on a 15° slope?
2. If a fire spreads at 37 metres per minute on flat ground, then how fast will it spread on a 23° slope?
3. If a fire spreads at 24 km/h on a 26° slope, then how fast will it spread on flat ground?
4. If a fire spreads at 170 metres per hour on an 18° slope, then how fast will it spread on a 28° slope?
5. Suppose that you can run at a top speed of 15 km/h on flat ground. If a fire is spreading at 70 km/h on an 18° slope, will you be able to outrun it when it starts burning on flat ground?
6. If a fire spreads at 10 km/h on flat ground, how fast would it spread down a slope of 10°?
7. If a fire spreads at 24 km/h down a 15° slope, then how fast will it spread up a 15° slope?
8. If the temperature is 10°C, the relative humidity is 50% and the wind speed is 10 km/h, how fast would a forest fire spread up a 20° slope?
9. If the temperature is 40°C, the relative humidity is 10% and the wind speed is 27 km/h, how fast would a grass fire spread down a hill with a 5° slope?
10. A forest fire is spreading down a 10° slope at 2.4 km/h. If the relative humidity is 20% and the wind speed is 25 km/h, what must the temperature be?

Indigenous Knowledge | Mathematics of bushfire Page 11 of 21
Activity 3 – Fire behaviour (Part two)
Fire Intensity
The main factor that determines whether a fire will be ‘good’ or ‘bad’ is fire intensity. Fire intensity is the rate of heat release per unit length of the fire. Fires that burn with a higher rate of spread, and that burn in heavier fuel loads, are more intense. The fuel load 𝑤is the mass of fuel per unit area – it is measured in kilograms per square metre.
If the fuel load 𝑤 and the rate of spread of the fire 𝑅 (km/h) are known, then fire intensity 𝐼(measured in kilowatts per metre) is given by the mathematical equation:
𝐼 = 4.44 × 10B × 𝑤 × 𝑅
Intense fires burn hotter and can cause more damage to sensitive plants and animals. More intense fires also produce longer flames, which is why Aboriginal people used low intensity fire to preserve the forest canopy when they burn.
Flame length and flame angle
More intense fires produce longer flames, but the actual height that flames reach into the trees will depend on the angle that the flames make with the ground. For example, when the wind is strong it will cause the flames to lean over, so that they may not be able to reach into the trees. The figure below illustrates the concepts of flame height, flame length and flame angle.
Schematic diagram showing flame length Lf , flame height hf and flame angle θf
Flame length, measured in metres, and flame angle can be calculated using the following equations:
Flame length:
𝐿C = 0.0775 ×𝐼9.EF
Flame angle:
𝑡𝑎𝑛 𝑡𝑎𝑛I90° − 𝜃CL =0.124 × 𝑈M𝐿C
Indigenous Knowledge | Mathematics of bushfire Page 12 of 21
Question 1
A head fire is spreading through a forest at a rate of 0.8 km/h. If the fuel load is 1.5 kg per square metre, how long are the flames?
Question 2
For the fire in Question 1, if the wind speed was 12 km/h, would the flames reach into the forest canopy 3.0 metres above the ground?
Problem set 1. The temperature is 35°C, the relative humidity is 5% and the wind speed is 40 km/h. If the forest fuel load is
1.5 kg per square metre and the grassland fuel load is 0.45 kg per square metre, what would be the intensities of fires spreading in forest and grassland under the given weather conditions?
2. The temperature is 27°C, the relative humidity is 25% and the wind speed is 10 km/h. Calculate the intensity of a grass fire burning in a fuel load of 0.6 kg per square metre and up a slope of 20°.
3. Calculate the flame length and flame angle for the forest and grassland fires in question 1.
4. A fire is burning with an intensity of 8.1 × 10N kW/m and has a flame angle of 30°. What must the wind speed be?
5. If the forest canopy was 5 metres above the forest floor, would the flames from the forest fire in question 1 reach into the canopy?
Indigenous Knowledge | Mathematics of bushfire Page 13 of 21
Activity 4 – Fire and climate
Fire danger rating
Generally speaking fires will burn more rapidly and more intensely when weather conditions are hot, dry and windy. This has been used to define the concept of fire danger rating, which is used to assess how dangerous a particular day will be. This can then be used to help firefighters allocate resources and decide if they need to declare a total fire ban, which means people aren’t allowed to light fires due to the present danger.
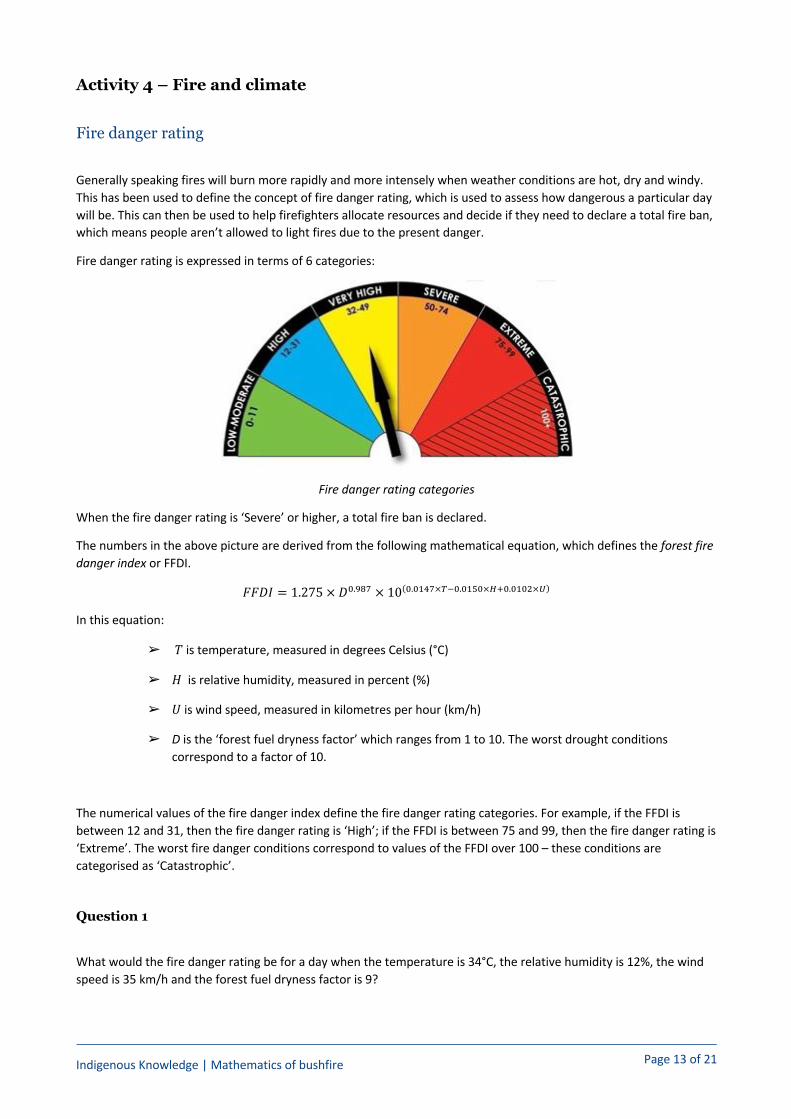
Fire danger rating is expressed in terms of 6 categories:
Fire danger rating categories
When the fire danger rating is ‘Severe’ or higher, a total fire ban is declared.
The numbers in the above picture are derived from the following mathematical equation, which defines the forest fire danger index or FFDI.
𝐹𝐹𝐷𝐼 = 1.275 × 𝐷9.QRS × 10(9.9<ES×TU9.9<V9×W?9.9<9N×X)
In this equation:
➢ 𝑇is temperature, measured in degrees Celsius (°C)
➢ 𝐻 is relative humidity, measured in percent (%)
➢ 𝑈is wind speed, measured in kilometres per hour (km/h)
➢ D is the ‘forest fuel dryness factor’ which ranges from 1 to 10. The worst drought conditions correspond to a factor of 10.
The numerical values of the fire danger index define the fire danger rating categories. For example, if the FFDI is between 12 and 31, then the fire danger rating is ‘High’; if the FFDI is between 75 and 99, then the fire danger rating is ‘Extreme’. The worst fire danger conditions correspond to values of the FFDI over 100 – these conditions are categorised as ‘Catastrophic’.
Question 1
What would the fire danger rating be for a day when the temperature is 34°C, the relative humidity is 12%, the wind speed is 35 km/h and the forest fuel dryness factor is 9?

Indigenous Knowledge | Mathematics of bushfire Page 14 of 21
Fire danger and climate change
FFDI is also used by scientists to help understand how changes in our climate might increase or decrease the likelihood of bad bushfires. To help understand longer term changes of years and different seasons, scientists use the following quantities:
Annual cumulative FFDI (ΣFFDI): This variable is calculated as the sum of all daily FFDI values over the entire year. It provides a useful way of comparing fire danger over long time periods and/or different areas.
Annual 90th percentile FFDI: The daily values during a fire year are sorted, and the 36th highest value is chosen2. This variable is indicative of the extreme end of the fire weather spectrum, times when the largest, most intense wildfires are more likely to occur and be more active.
Seasonal median and 90th percentile FFDI: The median and 90th percentile FFDI over the standard southern hemisphere meteorological seasons (i.e. December–January–February (DJF), March–April–May (MAM), etc.). Each season is approximately 90 d long. This variable provides information on any potential changes in the annual timing of the fire season.
These quantities have been examined by scientists trying to understand how fire weather conditions may have changed over time.
Problem set 1
1. Go to the Bureau of Meteorology website3 and find the weather station nearest to you. Write down the most recent temperature, relative humidity and wind speed recorded at the station. Next go to the Bureau’s ‘MetEye’ site4. Once on MetEye click on ‘Humidity Forecasts’ from the options on the left of the screen, and then select ‘Forest fuel dryness factor’. This will bring up a map of the dryness factor for all of Australia. Type your postcode in to the address bar at the top of the map to zoom in on your location, and obtain an estimate of the dryness factor.
2. Use the information you recorded in question 1 to determine the fire danger index at your location. Which fire danger rating category does this value correspond to?
3. Repeat questions 1 and 2 for all the capital cities in Australia (except Darwin). Which city has the highest fire danger? Which city is lowest fire danger?
4. Find the FFDI for the conditions experienced on Black Saturday – 7 February 2009, when the forest fuel dryness factor was 10, temperatures were around 45°C, relative humidity was about 5% and wind speeds were about 40 km/h. What category of fire danger rating does this value correspond to?
2 Note that because there are 365 days in a year, FFDI values above the 36th highest value are in the top 10% of all FFDI values for that year, or in other words 90% of the values are less than this value. 3 http://www.bom.gov.au/nsw/observations/map.shtml 4 http://www.bom.gov.au/australia/meteye/

Indigenous Knowledge | Mathematics of bushfire Page 15 of 21
Problem set 2
The following questions are based on findings from a scientific study of changes in Australian fire weather between 1973 and 20105.
1. The graph below plots annual cumulative FFDI (ΣFFDI) anomaly against year for multiple locations around Australia. Note that the anomaly is the difference between ΣFFDI for the particular year and the average value of ΣFFDI over all the years present. The plot also shows the average ΣFFDI over all the stations.
(a) What does the plot suggest is happening to fire danger in Australia? What does this say about the overall likelihood of ‘bad’ fires?
(b) Use the plot to identify years when ΣFFDI was particularly high in Australia? In what years was it particularly low?
(c) Interrogate the dashed linear trend line to estimate what the ΣFFDI anomaly was in 1975 and in 2005. Use this information to determine an equation for the linear trend line.
(d) Assuming that the trend in ΣFFDI anomaly continues into the future, use the equation you found in part (c) to estimate what the ΣFFDI anomaly will be in the years 2030 and 2050.
5 Clarke, H., Lucas, C. and Smith, P. (2013) Changes in Australian fire weather between 1973 and 2010. International Journal of Climatology, 33(4): 931-944.
Indigenous Knowledge | Mathematics of bushfire Page 16 of 21
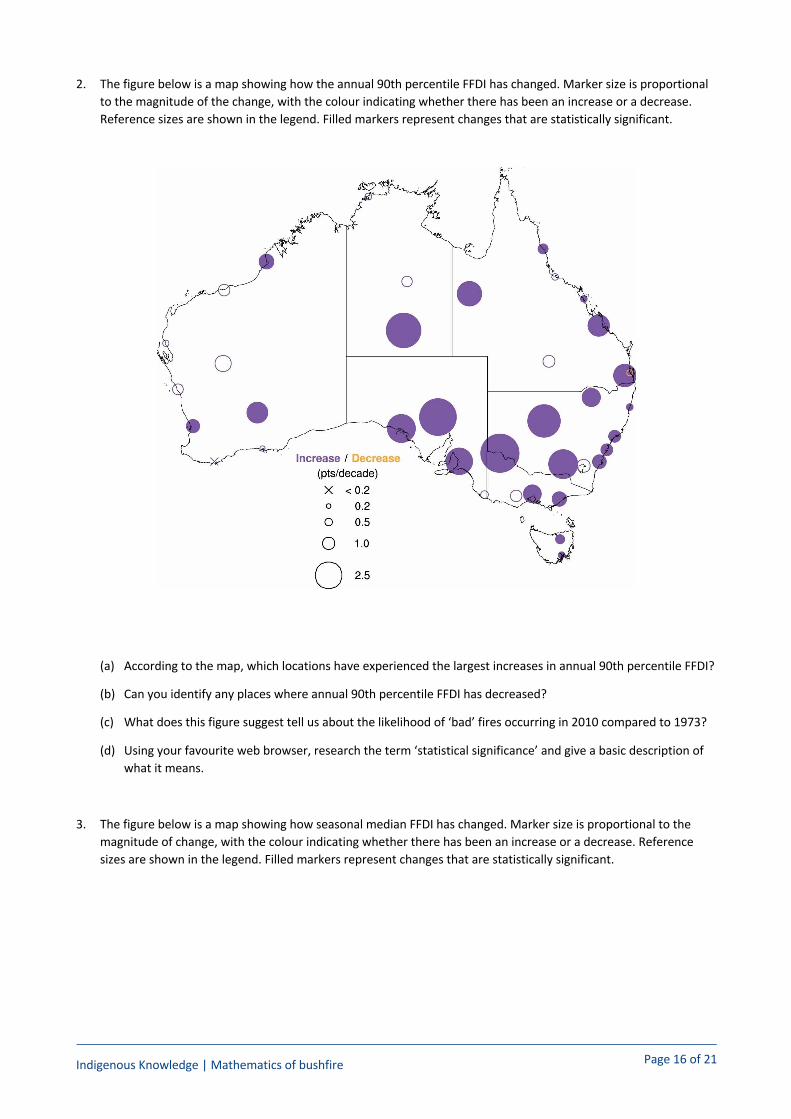
2. The figure below is a map showing how the annual 90th percentile FFDI has changed. Marker size is proportional to the magnitude of the change, with the colour indicating whether there has been an increase or a decrease. Reference sizes are shown in the legend. Filled markers represent changes that are statistically significant.
(a) According to the map, which locations have experienced the largest increases in annual 90th percentile FFDI?
(b) Can you identify any places where annual 90th percentile FFDI has decreased?
(c) What does this figure suggest tell us about the likelihood of ‘bad’ fires occurring in 2010 compared to 1973?
(d) Using your favourite web browser, research the term ‘statistical significance’ and give a basic description of what it means.
3. The figure below is a map showing how seasonal median FFDI has changed. Marker size is proportional to the magnitude of change, with the colour indicating whether there has been an increase or a decrease. Reference sizes are shown in the legend. Filled markers represent changes that are statistically significant.

Indigenous Knowledge | Mathematics of bushfire Page 17 of 21
(a) According to the figure, which season has experienced the largest increases in median seasonal FFDI? Which seasons have experienced the least amount of change?
(b) Given that a lot of Aboriginal burning (‘good’ fire) takes place in seasons corresponding to autumn, spring and even winter, what does the figure tell us about how the opportunity for doing ‘good’ burns has changed between 1973 and 2010?
(c) Are there any seasons where the median FFDI has decreased? In which parts of the country has this happened? Are these decreases statistically significant?
(d) Are there any seasons where the median FFDI has not decreased anywhere between 1973 and 2010?

Indigenous Knowledge | Mathematics of bushfire Page 18 of 21
Sample answers
Activity 1
Question 3 Requires reading the scale correctly and converting area to hectares.
(a)
(b)
(c)

Indigenous Knowledge | Mathematics of bushfire Page 19 of 21
Activity 2
Question 1
ANSWER: We use the equation for forest fire rate of spread:
𝑅 =2.518 × 𝑈60 − 𝑇 + 𝐻 =
2.518 × 1560 − 20 + 25 =
37.7765 = 0.6𝑘𝑚/ℎ
We could also express this rate of spread as 600 m/h or 10 metres per minute.
Question 2
ANSWER: Noting that 𝑅9 = 2 km/h and 𝜃 = 15°, the answer is:
𝑅 = 2 × 2(9.<×<V) = 2 × 2<.V = 5.7𝑘𝑚/ℎ.
Going down the 22° slope, the modified rate of spread is:
𝑅 =2 × 2(9.<×NN)
29.<×(NN?<9) − 1 =2 × 2(N.N)
2B.N − 1 =9.28.2 = 1.1𝑘𝑚/ℎ
Question 3
ANSWER: First work out the rate of spread of a grass fire on flat ground:
𝑅 =11.324 × 𝑈60 − 𝑇 + 𝐻 =
11.324 × 2560 − 30 + 20 =
283.150 = 5.6𝑘𝑚/ℎ
Next work out how much the flat ground rate of spread changes when the fire travels up the 8° slope:
𝑅 = 5.6 × 2(9.<×R) = 5.6 × 29.R = 9.8𝑘𝑚/ℎ
Going down the 12° slope, the modified rate of spread is:
𝑅 =5.6 × 2(9.<×<N)
29.<×(<N?<9) − 1 =5.6 × 2(<.N)
2N.N − 1 =12.93.6 = 3.6𝑘𝑚/ℎ

Indigenous Knowledge | Mathematics of bushfire Page 20 of 21
Activity 3
Question 1
ANSWER: Note that to be able to calculate the flame length, we need to know the intensity of the fire. So let’s figure this out first:
𝐼 = 4.44 × 10B × 𝑤 × 𝑅 = 4.44 × 10B × 1.5 × 0.8 = 5.33 × 10B
So the fire intensity is 5.33 × 10B kW/m. We can now use this to determine the flame length:
𝐿C = 0.0775 ×𝐼9.EF = 0.0775 ×(5.33 × 10B)9.EF = 4.0
And so the flames are 4 metres long.
In this example, we calculated a fire intensity of 5330 kW/m. This is quite an intense fire! By comparison, a candle produces about 80 W of power, and so each metre of the bushfire’s front is producing heat that is equivalent to about 60,000 candles! It would be almost impossible to extinguish such a fire!
Question 2
ANSWER: In Question 1 we worked out that the flame were 4 m long – but here we really need to know how high the flames reach. To know this we need to find out what the flame angle is and then use some trigonometry. To find the flame angle 𝜃C we have:
𝑡𝑎𝑛 𝑡𝑎𝑛I90° − 𝜃CL =0.124 × 𝑈M𝐿C
=0.124 × 12
√4=1.4482 = 0.744
So we know that 𝑡𝑎𝑛 𝑡𝑎𝑛I90° − 𝜃CL = 0.744, and so the flame angle is (make sure your calculator is set to degrees):
𝜃C = 90° − (0.744) = 90° − 36.7° = 53.3°
To work out how high the flames extend, consider the following diagram, which shows the flame length and flame angle together.
From this diagram we can see that:
𝑠𝑖𝑛 𝑠𝑖𝑛(53.3°) =ℎC4
and so rearranging we have:
ℎC = 4 ×𝑠𝑖𝑛 𝑠𝑖𝑛(53.3°) = 3.2
So yes, these flames would reach more than 3.0 m high, and burn into the canopy... this is bad fire!
Indigenous Knowledge | Mathematics of bushfire Page 21 of 21
Activity 4
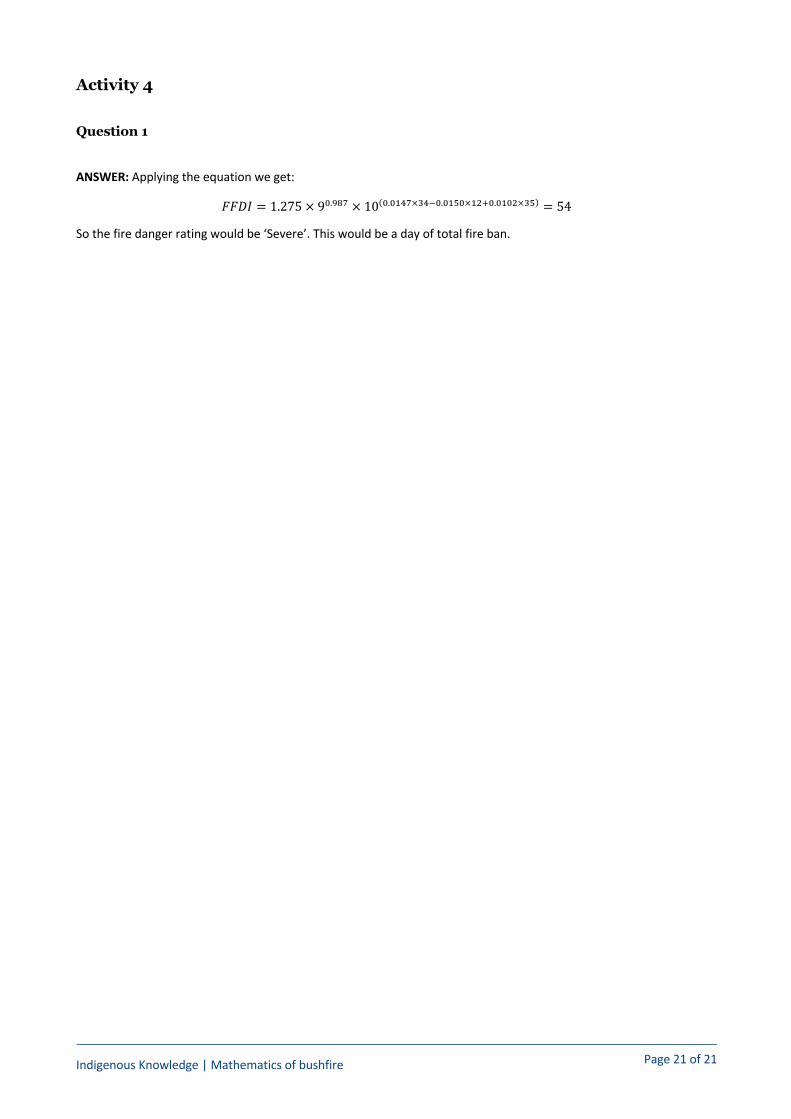
Question 1
ANSWER: Applying the equation we get:
𝐹𝐹𝐷𝐼 = 1.275 × 99.QRS × 10(9.9<ES×BEU9.9<V9×<N?9.9<9N×BV) = 54
So the fire danger rating would be ‘Severe’. This would be a day of total fire ban.