MATHEMATICS IN MALTA - Education Documents... · 5.2.3.4 Father’s Occupation 24 5.2.3.5...
89
Transcript of MATHEMATICS IN MALTA - Education Documents... · 5.2.3.4 Father’s Occupation 24 5.2.3.5...

MATHEMATICS IN MALTA THE NATIONAL MATHEMATICS
SURVEY OF YEAR 1 PUPILS
Education Division, Department of Planning and Development, Malta
Charles MifsudSharon Richard
Dougal HutchisonRowena Grech
Typeset at Media Centre PublicationsPrinted at Media Centre, Blata l-Bajda
Published in 2005
Copyright © Education Division, Maltaand where appropriate
the Literacy Unit and NFER, UK
Cover photos: Ms Sharon RichardPupils from Carmela Sammut Primary School A, Mosta.
CATALOGUING-IN-PUBLICATION DATA
Mathematics in Malta : the National Mathematics Survey of Year I pupils / authors, Charles Mifsud … [et al.]. – Floriana, Malta : Education Division, 2005
p. : ill., charts ; cm.
Includes bibliography
ISBN 99909-74-19-5
1. Mathematics – Study and teaching2. Education – Primary - Malta3. Education – Malta
I. Malta. Ministry of Education, Youth and Employment. Education Division II. University of Malta. Faculty of Education. Literacy UnitIII. National Foundation for Educational Research (United Kingdom) IV. Mifsud, Charles DDC: 510.0704585 LC: QA14.M3M3
Melitensia Classification: MZV5
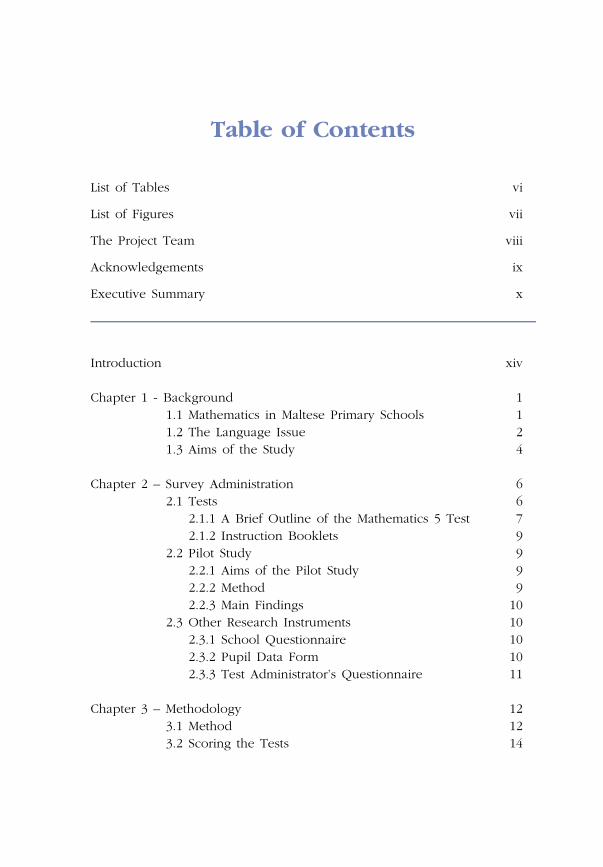
Table of Contents
List of Tables vi
List of Figures vii
The Project Team viii
Acknowledgements ix
Executive Summary x
Introduction xiv
Chapter 1 - Background 11.1 Mathematics in Maltese Primary Schools 11.2 The Language Issue 21.3 Aims of the Study 4
Chapter 2 – Survey Administration 62.1 Tests 6
2.1.1 A Brief Outline of the Mathematics 5 Test 72.1.2 Instruction Booklets 9
2.2 Pilot Study 92.2.1 Aims of the Pilot Study 92.2.2 Method 92.2.3 Main Findings 10
2.3 Other Research Instruments 102.3.1 School Questionnaire 102.3.2 Pupil Data Form 102.3.3 Test Administrator’s Questionnaire 11
Chapter 3 – Methodology 123.1 Method 123.2 Scoring the Tests 14
iv Mathematics in Malta
Chapter 4 – Findings 154.1 Test Administrator’s Questionnaire 154.2 Reliability 154.3 Raw Scores 16
Chapter 5 - Findings: Multilevel Modelling 185.1 Multilevel Modelling 185.2 Background Variables 18
5.2.1 Pupil Variables 225.2.1.1 Gender 22 5.2.1.2 Age 225.2.1.3 First Language 225.2.1.4 Special Educational Needs 235.2.1.5 Pre-school 23
5.2.2 School Variables 235.2.2.1 Type of School 23 5.2.2.2 Districts 235.2.2.3 Number of Classes 235.2.2.4 Class Size 24
5.2.3 Home Variables 245.2.3.1 Family Structure 245.2.3.2 Mother’s Education 245.2.3.3 Father’s Education 245.2.3.4 Father’s Occupation 245.2.3.5 Mother’s Occupation 25
5.3 Further Analyses 255.3.1 Overall Results by Process Category 255.3.2 Results for Each Process Category by Gender 265.3.3 Results for Each Process Category by Age 265.3.4 Results for Each Process Category by First Language 275.3.5 Results for Each Process Category by Special Educational Needs 285.5.6 Results for Each Process Category by Island 29
Chapter 6 - Discussion 30 6.1 Class size 316.2 Making International Comparisons 33
Table of Contents v
Chapter 7 – Implications 377.1 Implications for Schools 37
7.1.1 Understanding Number 387.1.2 Non-numerical Processes 387.1.3 Computation and Knowledge 387.1.4 Mathematical Application 38
Chapter 8 - Recommendations 39 Conclusion 40
References 41
Annexes 1a School Questionnaire 441b Classification of Geographical Regions 452a Pupil Data Form – Maltese Version 462b Pupil Data Form – English Version 483 Test Administrator’s Questionnaire 504 Item Characteristics 515 Differential Item Functioning (DIF) in the Malta Administration of the Mathematics 5 Test 526 Age-Standardisation 577 Glossary 59
Author Index 62
Subject Index 63

vi vii
List of Tables
Table 2.1: Process Categories and Test Items in Mathematics 5 8
Table 4.1: Test Administrator’s Questionnaire 15Table 4.2: Boys’ and Girls’ Raw Scores on the Mathematics Test 16
Table 5.1: Background Variables Used in Multilevel Modelling with Subcategories 18Table 5.2: Unadjusted and Adjusted Results 20
Table 6.1: Mean Test Scores for Malta 33Table 6.2: Malta National Mathematics Study DIF Analysis Malta versus UK 35
Table A4.1: Malta National Mathematics Study Tests Item Statistics 51
Table A5.1: Malta National Mathematics Study DIF Analysis by First Language 53Table A5.2: Effect of Dropping Four Medium Items from Test 55Table A5.3: Malta National Mathematics Study DIF Analysis by Gender 56
Table A6.1: Standardisation Table for Malta National Mathematics 5 for Malta 58
vi vii
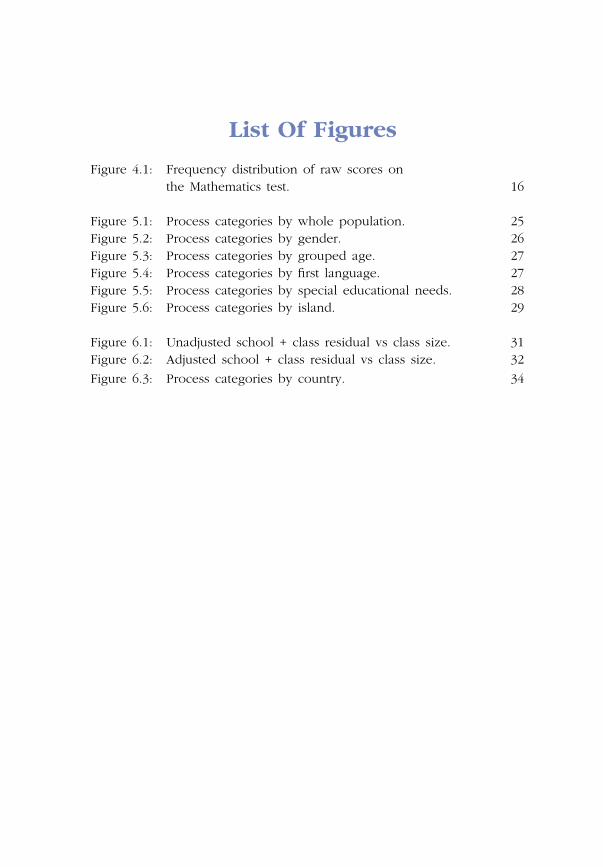
List Of Figures
Figure 4.1: Frequency distribution of raw scores on the Mathematics test. 16
Figure 5.1: Process categories by whole population. 25Figure 5.2: Process categories by gender. 26Figure 5.3: Process categories by grouped age. 27Figure 5.4: Process categories by first language. 27Figure 5.5: Process categories by special educational needs. 28Figure 5.6: Process categories by island. 29
Figure 6.1: Unadjusted school + class residual vs class size. 31Figure 6.2: Adjusted school + class residual vs class size. 32
Figure 6.3: Process categories by country. 34
viii ix
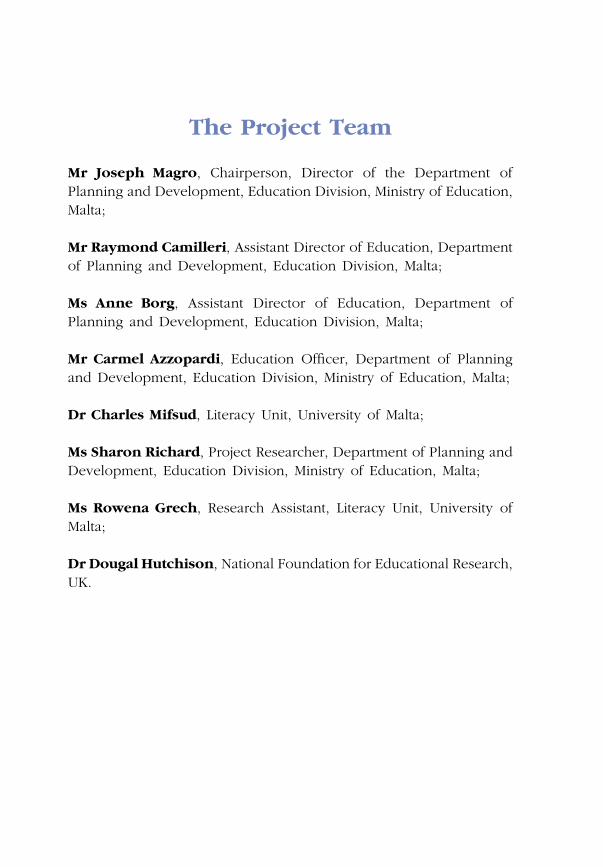
The Project Team
Mr Joseph Magro, Chairperson, Director of the Department of Planning and Development, Education Division, Ministry of Education, Malta;
Mr Raymond Camilleri, Assistant Director of Education, Department of Planning and Development, Education Division, Malta;
Ms Anne Borg, Assistant Director of Education, Department of Planning and Development, Education Division, Malta;
Mr Carmel Azzopardi, Education Officer, Department of Planning and Development, Education Division, Ministry of Education, Malta;
Dr Charles Mifsud, Literacy Unit, University of Malta;
Ms Sharon Richard, Project Researcher, Department of Planning and Development, Education Division, Ministry of Education, Malta;
Ms Rowena Grech, Research Assistant, Literacy Unit, University of Malta;
Dr Dougal Hutchison, National Foundation for Educational Research, UK.
viii ix
Acknowledgements
The Project Team of this study gratefully acknowledges the good work and involvement of:
• all the schools and pupils that took part in the study;
• all the test administrators and survey assistants including complementary teachers, literacy tutors and university students;
• Ms Michela Gnaldi, of the National Foundation for Educational Research, UK;
• Ms Emma Borg, Mr Laurence Azzopardi and Ms Sandra Gouder, Research Unit, Department of Planning and Development, Education Division;
• Ms Marjes Zammit, Ms Maria G. Sammut and Ms Elaine Mifsud Scicluna, Literacy Unit, University of Malta and Education Division, Malta;
• Ms Irene Vella for managing the survey in Gozo;
• Mr Robert Grixti and Ms Denise Hollier for data inputting;
• Ms Catherine Vella for compiling the index for this publication;
• Ms L. Deguara, Head of Carmela Sammut Primary School A, Mosta for allowing us to photograph the pupils and the school.
x
List of Tables
Executive Summary
Scope
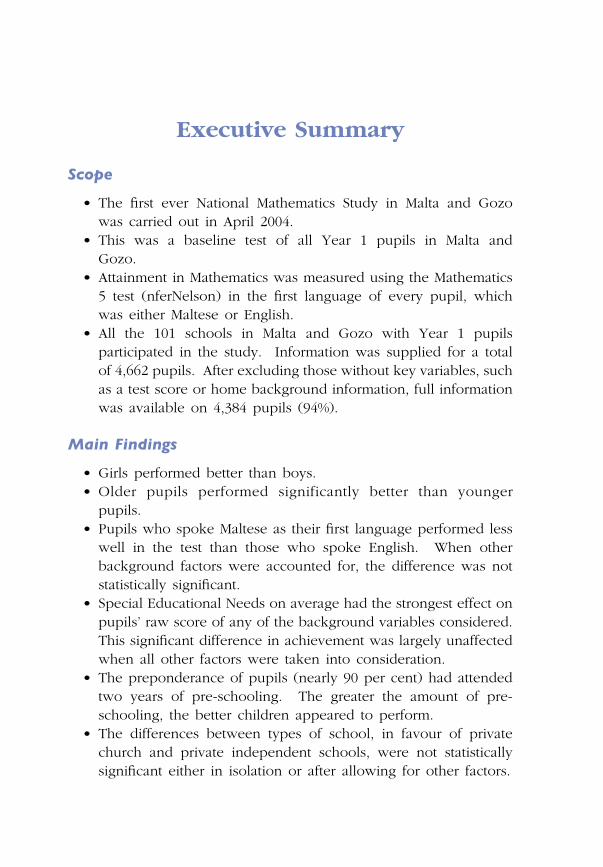
• The first ever National Mathematics Study in Malta and Gozo was carried out in April 2004.
• This was a baseline test of all Year 1 pupils in Malta and Gozo.
• Attainment in Mathematics was measured using the Mathematics 5 test (nferNelson) in the first language of every pupil, which was either Maltese or English.
• All the 101 schools in Malta and Gozo with Year 1 pupils participated in the study. Information was supplied for a total of 4,662 pupils. After excluding those without key variables, such as a test score or home background information, full information was available on 4,384 pupils (94%).
Main Findings
• Girls performed better than boys. • Older pupils performed significantly better than younger
pupils. • Pupils who spoke Maltese as their first language performed less
well in the test than those who spoke English. When other background factors were accounted for, the difference was not statistically significant.
• Special Educational Needs on average had the strongest effect on pupils’ raw score of any of the background variables considered. This significant difference in achievement was largely unaffected when all other factors were taken into consideration.
• The preponderance of pupils (nearly 90 per cent) had attended two years of pre-schooling. The greater the amount of pre-schooling, the better children appeared to perform.
• The differences between types of school, in favour of private church and private independent schools, were not statistically significant either in isolation or after allowing for other factors.

x Executive Summary xi
• The differences in performance between the districts were not statistically significant.
• Effects of class size were not statistically significant. • The stability of the home relationship seems to be an important
factor in school attainment. In this study, there was a highly significant relationship between this factor and attainment. However, when allowing for other background factors these effects were no longer statistically significant.
• Fathers’ current occupation had a statistically significant impact on their children’s raw score and followed the ordering of the classification itself. The higher the father’s occupation, the higher the score the child obtained in the test.
• There was a statistically significant difference in performance of pupils between categories of mother’s occupation. This difference showed a comparable pattern to that of father’s occupation. As with father’s occupation, the differences were reduced after allowing for other background factors. However, they remained statistically significant, albeit at a lower level. Children of mothers in skilled or white-collar jobs do better than those whose mother stays at home.
• The level of the fathers’ education had a statistically significant impact on their children’s performance. The higher the father’s educational level, the higher the score the child obtained in the test. This pattern was reduced and not statistically significant after adjusting for other factors.
• The level of the mothers’ education had a statistically significant impact on their children’s performance. The higher the mother’s educational level, the higher the score the child obtained in the test. This pattern was reduced but, in contrast with that for father’s education, was still statistically significant after adjusting for other factors.
• When making international comparisons it was found that Maltese pupils performed relatively better than their UK counterparts on some of the more practical items. They performed better in practical areas such as: reading the clock, a telephone number pad and shopping. However, UK children performed better in addition, subtraction, ordering a series of events, and comparing and counting shapes.

xii Mathematics in Malta
Implications
• The Malta National Mathematics Study provides the first ever baseline study of Mathematics attainment in Malta.
• Children who attended pre-school do better in Year 1 as they seem to be more ready for the demands of formal education.
• Generally Maltese pupils perform well. They perform better on more practical items and perform less well on more formal items when compared to their counterparts in the UK. This may be due to incompatibility between home and teaching language, and the amount of teaching pupils have received. However these are early stages, and one should not read too much into such comparisons. This does not mean that the formal teaching of Mathematics should start earlier.
• Maltese children do relatively better than their counterparts on more practical test items. These items are more related to ‘everyday’ situations.
Recommendations
• The results of the study and of the individual schools results are to be fed back to schools, as had been done in the case of the Literacy studies. This should help to raise awareness in schools and among parents about the importance of mathematical skills.
• It would be valuable to conduct such an assessment on a regular basis as happens in other countries like England, Australia and the U.S. Follow-up studies could be conducted with the same pupils in later years.
• Further measures are to be taken to ensure that language does not act as a barrier to the attainment of mathematical skills. In this regard the continued use of appropriate materials and resources, together with the use of Information and Communication Technologies (ICT) and multimedia may help to facilitate better acquisition of mathematical skills.
• This study has shown that pre-school attendance boosts attainment. The provision of quality programmes at this stage should be strengthened.
• The strength of Maltese children in practical aspects of Mathematics
Executive Summary xiii
is positive and should be promoted and extended further. This could also serve as a good basis for the introduction of more abstract notions at a later stage.
In 1999, the first ever Malta National Literacy Survey collected information from all schools in Malta. This survey was aimed at all Year 2 pupils, born in 1992 (Mifsud et al., 2000). A wealth of information was collected on pupils’ attainment in literacy and their home background, enabling insightful comparisons on both a national and an international basis. In 2002, a comparable study was also carried out on the same cohort of pupils, then in Year 5. The results are reported in Mifsud et al. (2004a). Practically the same cohort of pupils was involved in both surveys and thanks to the excellent record-keeping and co-operation of schools, it was possible to merge the data for the same pupils for the two year groups, and use the results as the basis for a Malta value added study. These value added findings are reported in Mifsud et al. (2004a). A team from the Education Division, the University of Malta and the National Foundation for Educational Research, UK was able to produce individual reports for each school, and to conduct a one-to-one discussion with the Head of that school. This afforded schools the opportunity to be able to engage in school development planning based on recent attainment data.
In view of the success of these studies, it was decided to embark on a comparable exercise focusing on Mathematics education at baseline level. A pilot study involving twelve schools was carried out by the Education Division and the Literacy in May 2003. The data were analysed and the results are reported in Mifsud et al. (2004b). This report showed that the administration of the test went smoothly and that the test was well received by schools and appropriate for the age group. In particular, no serious problems were reported by administrators concerning the language of test administration.
Introduction

Chapter 1
The Maltese Islands in the Mediterranean Sea have two official languages. Maltese, a Semitic language, is the native tongue. English is used widely and is taught early on at school. For Malta it is the Language of Wider Communication (LWC).
Recognising the importance of Mathematics, the Education Division decided in 2003 to carry out a national survey of mathematical attainment, to take place in 2004. It was decided that this, the first national survey of Mathematics undertaken in Malta, should focus on the attainment of Year 1 pupils.
1.1 Mathematics in Maltese Primary SchoolsIn Maltese Primary schools, basic skills are introduced in kindergarten and then reinforced and further developed as the pupils proceed through the primary and secondary school years.
Up to scholastic year 2002-2003, the formal teaching of Mathematics started in Year 1 when the pupils were five and going on to six years of age. As from scholastic year 2003-2004, the Abacus Scheme was introduced in Kindergarten. Currently, Abacus F1 is used with pupils who are in their second year of kindergarten, that is at the age of four. Pupils carry out tasks requiring the sorting of objects and the use of shapes, as well as activities involving recognition and value of number through an amalgamation of verbal and concrete activities.
The Abacus 'R' (Reception) Scheme has been used in Maltese Year 1 classes since 2002. This scheme is based on three principles as laid out in the ‘Teacher’s book’ (Merttens & Kirkby, 2001). It promotes:
a) Direct and interactive teaching of Mathematics;
b) Clear teaching and regular rehearsing of a range of mathematical skills and strategies, particularly those which help children become fluent in mental Mathematics;
Background
2 Mathematics in Malta
c) Use of mathematical resources to support teaching and to promote active and meaningful learning.
This scheme was introduced in state and non-state schools in the scholastic year 2002-2003 after being piloted with Year 2 classes during the previous year.
Following the introduction of the Abacus Scheme an updated Mathematics syllabus was published by the Curriculum Department, Education Division in 2005. The main topics covered in the syllabus at Year 1 level are:
a) Number and Algebra;
b) Measure, Shape and Space;
c) Data Handling;
d) Problem Solving.
1.2 The Language IssueThe bilingual situation in Malta, which in the National Minimum Curriculum is considered “as the basis of the educational system” (NMC, 1999:37) was the reason why language was one of the main issues considered while planning the National Mathematics Survey. It was necessary to make a decision on the language that was to be used during the test administration.
There is no doubt that unless the students taking the tests are proficient in the language of the test, their performance will only represent a modest sample of their true knowledge.
(del Rosario Basterra, 1998-9:2)
Lack of, or limited proficiency in the use of English has been and still is a very important issue when considering the assessment of pupils. In a study carried out by Caruana Anastasi (2003), statistical analysis showed that there was a high correlation between Year 6 pupils’ Mathematics and English Exams results, thus suggesting that ‘performance in Mathematics is dependent on language competence’ (p.54).

Background 3
Del Rosario Basterra (1998-9), while claiming that assessing non-English-language learners is quite challenging and complex, insists that schools should find ways to assess them. She argues that when using large scale standardised tests, ‘efforts should be made to assess students in their primary language; and to make appropriate accommodations in the administration of tests’ (1998-9:3).
Ascher (1990) claims that ‘the reliability and validity of tests may be undermined by language differences’ (p.1.). Various assessments carried out abroad tried to minimise this validity and equity problem through what Shephard et al. (1998) call ‘accommodation’, i.e.
…adaptations or changes in how an assessment is administered or in the mode of response. The intention of accommodations is to remove irrelevant sources of difficulty, to get a fairer or a more
accurate picture of what the test-taker actually knows. (p.3)
Del Rosario Basterra (1998-9) claims that ‘The current practices of making accommodations to include a large number of English-language learners does not necessarily solve the problem’ (p.2). Accommodation can be used in the preparation of the test itself as well as in the method of administration. The Mathematics Performance Assessment carried out on Rhode Island in 1997 made various assessment accommodations based on Butler and Steven’s (1997) model of accommodation. These included the preparation of glossaries and giving oral instructions in the native language of the pupils. One has to be cautious in the amount of accommodation made, and in the identification of the group targeted for accomodation. This in view of the fact that ‘improved performance might not be evidence of improved validity.’ (Shephard et al. 1998:11)
Ascher (1990) claims that apart from the fact that bilingual pupils process information more slowly in their less familiar language, ‘in any given moment or circumstance, any bilingual will have a temporarily stronger language’ (p.1). In order to find out about pupils’ stronger language, teachers of classes participating in the Malta National Mathematics Survey were asked to point out the language each child was most fluent in since, as Ascher (1990) argues, ‘a bilingual student may have relatively greater fluency with the formal or informal style in either language.’ (p.1).
4 Mathematics in Malta
In the case of the Malta National Mathematics Survey, one of the teachers, who acted as the project researcher in the Pilot testing, carried out observations in 5 schools in order to identify the language used:
a) by teachers and pupils throughout the day;
b) by the teacher to deliver lessons;
c) by the teacher to give instructions during the lessons;
d) by the pupils among themselves.
In the initial phase of the study, observation sessions were carried out in a number of Year 1 classes in 5 state schools (2 schools in Gozo; 3 schools in Malta). Classes were chosen randomly and the project researcher spent between two and three mornings in each class observing different lessons and taking notes about the language used during lessons including instructions given to the pupils.
These observations showed that while some teachers delivered lessons and gave instructions mainly in English or Maltese, others tended to code-switch. These sessions also helped to identify specific language related to the marking of answers during tasks, e.g. ‘Tick’; ’Draw a ring around…’; ‘Mark it’.
While ensuring that the highest level of consistency was maintained in the administration of the test, it was decided that the prevailing circumstances in each situation were to dictate the language/s to be set for its administration. Very clear and specific instructions were provided for those situations where the predominant language was either Maltese or English.
1.3 Aims of the StudyThe aims of this study were:
• to conduct a national survey of the Mathematics attainment of all Maltese Year 1 pupils in state, private church and private independent primary schools;
• to produce a national standardisation of the Mathematics 5 test (Hagues et al., 2001a), suitable for future use in Malta to assess

Background 5
attainment of Year 1 pupils. A rationale and indication of the procedure is given in Annex 3;
• to obtain raw and standardised scores on the test for Maltese Year 1 pupils;
• to provide feedback to all schools regarding the pupils’ levels of attainment in Mathematics;
• to investigate the relationship between the pupils’ attainment in Mathematics and background variables at pupil and school levels;
• to provide information on the levels of attainment in Mathematics of Maltese Year 1 pupils for the benefit of all stakeholders in Maltese education: the pupils themselves, their parents and teachers, administrators and policy makers;
• to encourage public debate on the implications of the test results for education and social policy in Malta;
• to make international comparisons, especially since the test used was a standardised UK test;
• to determine whether the language of test administration has differential effects on performance outcomes;
• to investigate the relationship between pupil attainment and home background. This has been thoroughly investigated in a UK context (Strand, 1997; Tymms et al., 1997; Strand, 1999; Thrupp, 2001; Strand, 2002; Hutchison, 2003). It was considered to be of interest to see whether these findings were replicated in the Malta situation.

2.1 TestsAs with the literacy studies carried out previously, there are no Mathematics tests that have been standardised for the Maltese context. The home language of the vast majority of pupils is Maltese (Mifsud et al., 2003), and much of the teaching of Mathematics at primary level in Maltese Primary schools is conducted in both languages. Caruana Anastasi (2003) claims that out of the twenty-eight Year 6 Maths lessons observed, none of these were delivered completely in one language (i.e. Maltese or English). There was frequent code-switching in all the lessons.
Particularly at this very early stage in education (Year 1), pupils could experience difficulties in understanding some of these tests as these could contain a high proportion of word problems and are heavily dependent on English literacy. Therefore an important feature of the pilot study was to check the suitability of the test in a Maltese context.
After inspection of and consultation on the range of available Mathematics tests set in English, a standardised British test was chosen for assessing the pupils’ level of attainment in Mathematics. The test selected was the Mathematics 5 test from the Mathematics 5-14 series (Hagues et al., 2001a). This test is the first of a series of ten standardised tests developed by the National Foundation for Educational Research for nferNelson. The series was designed to indicate the extent to which a pupil is making progress in Mathematics from one year to the next. The Mathematics 5-14 series as a whole assesses attainment in the three key content areas of Number: Shape, Space and Measures; and Handling Data. Each test item in the series has been designed and categorised to demonstrate the ability to use different mathematical concepts or processes, resulting in possible diagnostic information.
Chapter 2
Survey Administration

Survey Administration 7
The Mathematics 5-14 series draws from both the requirements of the National Curricula in England, Wales and Northern Ireland, and the National Guidelines 5-14 for Scotland, implying that it would not be too closely tied to a single curriculum. It was considered that the education system in Malta is sufficiently similar to that of the UK. Hence, there were no problems due to cultural transfer. Visual inspection by Maltese curriculum experts confirmed the face validity of the test in a Maltese situation. All items in the test are covered by the Year 1 syllabus of the Curriculum Department, (2005), Education Division of Malta.
The Instruction Booklet of the selected test comments that ‘The entire test is administered orally so that limitations in pupils’ reading ability do not mask the assessment of their mathematical attainment’ (Hagues et al., 2001b:1). This made it particularly suitable for a bilingual society such as Malta, where knowledge of English is likely to be an important factor in the apparent performance on a test administered in English. The findings of the pilot study (see Section 2.2) showed that the combination of the particular test and the careful instructions for testers meant that there were no apparent language problems.
2.1.1 A Brief Outline of the Mathematics 5 TestThe Mathematics 5 test is a recently published test (2001) designed to contribute a baseline score to the ‘progress scale scores’ which are available for the Mathematics 5-14 Series. The test was designed to cover both process and content. Table 2.1 presents the four process categories of Mathematics 5 and the relevant test items.
As for the series as a whole, the content has been drawn from the various curricula of England, Scotland and Northern Ireland. It is intended for use with groups of rising five-year-old pupils, but it is equally suitable for use as an on-entry test for rising six-year-olds. It is important to point out that the Mathematics 5 test has been designed to be administered orally. The test is part of a series which includes Mathematics 6, 7, 8 and 9 tests. This makes it possible to follow up the sample, using the series, in later years.
Furthermore, the Mathematics 5 test has recently been standardised on a UK national sample (2001), so that the results for Maltese children

8 Mathematics in Malta
could be used as the basis for wider comparison. The Mathematics 5 test contains 24 items in all, and is standardised for the age range 4 years 0 months to 6 years 3 months (4:00-6:03). Prima facie, the test seemed well suited to the age group to be tested.
Process Category Item Number Item Title
Understanding Number –These questions require pupils to demonstrate an understanding of basic numerical concepts and processes. The challenge inthese questions lies in theunderstanding of the process rather than in theperformance of a numericaloperation (if any).
1 Counting fingers and thumbs
4 Number pad
6 Matching dots
8 Domino
13 Money
16 Counting
18 Comparing numbers – buttons
23 Counting shapes 1
Non-numerical Process –These questions require anunderstanding of non-numerical mathematical concepts andprocess in order to be answered correctly. The questions donot have any significant numerical content that needs to be considered by the pupils.
7 Reasoning – T-shirts
12 Comparing shapes
19 Repeating patterns
20 Copying pattern
22 Describing shapes
Computation and Knowledge – Computationquestions are those in which the operation is stated or ir relativelyunambiguous. The otherquestions in this category can be answered directly upon recall of one or more mathematical facts or terms. All these questions largely involve either memory or well-rehearsed procedures.
2 Clocks
10 Triangles
17 Weighing
Mathematical Application –Pupils have to use mathematicsin a problem-solving situation. The first involves determiningfrom the context the requiredoperation before performing thecalculation (if any).
3 Addition – balloons5 Comparing heights9 Half full11 Ordering – mouse14 Shopping15 Subtraction – apples21 Sorting shapes24 Counting shapes 2
Table 2.1: Process Categories and Test Items in Mathematics 5 (nfer Nelson)
Survey Administration 9
2.1.2 Instruction BookletsFor the administration of the test in Malta the original ‘At a Glance Guide’ and ‘Teacher’s Guide’ (Hagues et al., 2001) were used. However, test administrators were asked to use Maltese when the situation warranted this and specific instructions were duly provided. A group of Maltese educators, who are specialists in the Maltese language and have extensive teaching experience, prepared a Maltese version of the Guidelines. Subsequently, the Guidelines in Maltese were also field-tested in a number of classes.
2.2 Pilot StudyThe pilot study of the National Mathematics Survey was carried out in May 2003.
2.2.1 Aims of the Pilot StudyThe aims of the pilot study were:
• to identify an appropriate Mathematics test for use in a Maltese context;
• to conduct a pilot survey of the Mathematics attainment of a sample of Maltese Year 1 pupils in State Primary Schools;
• to carry out practice statistical investigations of the relationships between the pupils’ levels of Mathematics and background variables at pupil and school levels;
• to draw lessons for the conduct of the main survey.
2.2.2 MethodThe pilot study was carried out in twelve Year 1 classes in twelve Primary State schools, two in each geographical region of the Maltese Islands. The number of pupils tested in both languages was 204. The participants who took the test were those born in 1997.
Background data on the pupils and schools involved was collected successfully with the help of the Heads of Schools. The tests were administered and scored by three teachers who were also working as researchers for the study. The ratings of the test administrators showed a high level of approval of the tests.

10 Mathematics in Malta
The technical reliability of the test was satisfactory, and the test level matched the ability of the pupils. Analysis of the items in the test showed that they all had good characteristics. The pilot study found no evidence of any differentiated item functioning between the performance of boys and girls. The benefits of using an intact test outweigh those of attempting to remove this item. Unfortunately there were very few pupils who spoke English as a first language in the pilot, so it was not possible to consider whether there was any differential item functioning based on the language spoken or the language of test administration.
2.2.3 Main FindingsThe main findings of the pilot study were as follows:
• Girls’ average score was higher than the boys’, and the difference in average scores was statistically significant.
• Both parents’ occupation and education did not have a statistically significant impact on the pupils’ scores.
• The number of pupils in each region was too small to allow statistical analyses to be conducted at this stage.
2.3 Other Research InstrumentsThe other research instruments used in this study were intended to gather information about the schools, the Year 1 classes and the pupils involved, and to obtain the test administrators’ opinion of the test after it was administered.
2.3.1 School QuestionnairesA School Questionnaire (see Annex 1a) was designed to request the following data at school level: the geographical region, type of school and the number of male and female pupils in Year 1. The Head or Assistant Head of school was requested to provide this information. A Geographical Classification of all Districts was also provided. (See Annex 1b).
2.3.2 Pupil Data FormA Pupil Data Form, one in Maltese (see Annex 2a) and one in English

Survey Administration 11
(see Annex 2b), was designed. This requested information about a variety of pupil- and home-level background variables: age, gender, first language, special educational needs, pre-school education, father’s occupation, mother’s occupation, father’s level of education and mother’s level of education. These were tested in the pilot study, and shown to function successfully. This information was obtained through the class teacher or the pupil’s parents or primary carer(s). The teachers were requested to identify the language of test administration for each pupil.
The School Questionnaire and Pupil Data Form were field-tested by six teachers, one in each of the schools. The School Questionnaire was considered to be straightforward and easy to complete. The Pupil Data Form, which had to be completed for all the pupils in the class, was considered time-consuming as the background details required were not always readily available. As expected, the items concerning mother’s occupation and father’s and mother’s level of education proved to be problematic since this information was not included in the Cumulative Record Card (CRC). On the other hand, the father’s occupation was usually listed in the CRC.
2.3.3 Test Administrator’s QuestionnaireA Questionnaire (see Annex 3) was designed for test administrators. They were asked whether they felt that the tests were suitable and matched the pupils’ levels of Mathematics, and whether the tests were easy or difficult to administer. The Questionnaire also asked the test administrators to provide other comments about the tests.
This instrument was reviewed by the project team. It was considered to be very clear and easy to complete.
Chapter 3
Methodology
A decision was taken to proceed with the main study, not only due to the success of the pilot study but also because of the worthwhile information that the study would provide. It would enable schools to check their knowledge of their pupils and their progress against an objective measure, and to set the attainment of their Year 1 pupils in the national context.
The National Mathematics Survey was carried out on the same lines as the pilot study, subject only to differences entailed by the difference in scale; such as the number of test administrators required and the involvement of all schools, that is, state schools, private church schools and private independent schools. The tests could be used as screening devices so that pupils having weak mathematical skills, and therefore being at risk of mathematical failure, could be given extra help in order to boost their educational prospects during the coming school years. All this was possible since items in the test are classified by process, therefore making it possible to use this information to locate areas of strength and weakness in pupils’ performance.
3.1 MethodIt was decided that every Year 1 pupil on the Maltese Islands was to take the test of Mathematics. All the schools in Malta with Year 1 pupils participated. The survey could not take place too early in the scholastic year since primary school teachers would not have covered most of the Mathematics Syllabus. At the same time, carrying out the survey towards the end of the scholastic year would have come at a time of year when children would be on a half-day timetable. Besides, the hot weather may have affected the pupils’ performance on the test. Therefore it was decided to carry out the survey at the end of April.
Pupils in Gozitan state schools and Maltese non-state schools sat for the test on the 27th April, 2004, while pupils in Maltese state schools took the test on the 28th April, 2004. Schools with a high pupil population
Methodology 13
carried out the test over the two days. Pupils who were absent on their scheduled day of testing were allowed to sit for the test the day after.
Information was supplied for a total of 4,662 pupils. After excluding those without key variables, such as a test score or home background information, full information was available on 4,384 pupils (94%).
A meeting for all Heads of Schools was held in February 2004. The main purpose of these meetings was to acquaint the Heads of Schools with the aims of the test, procedures etc. Apart from these, they were given:
a) Data forms to be completed by parents of all Year 1 students;
b) An information pack which included the date and time of testing; the number of rooms and furniture required; a plan of the actual setting of this furniture; a School Information Sheet and an Annex to the School Information sheet.
Arrangements were made to recruit the survey assistants and test administrators required for the survey to run smoothly. Pupils were to sit for the test in groups of 5 or less. The test took around 30-45 minutes to complete. Each test administrator had to carry out approximately 5 sessions in one day. While the test administrator was responsible for administering the tests, the survey assistant was responsible for organising the pupils to take the test and was required to complete a number of information sheets. If a test administrator did not manage to complete any of the scheduled sessions in one day, these were administered the following day. Meetings for survey assistants and test administrators were held separately. These brief meetings were held on the eve of the survey in order to minimize possibility of disclosure. Survey assistants were given packs with tests and other materials (coins, containers and shapes) necessary for the administration of the tests. These were sealed and were to be opened on the day of the test.
To ensure that the highest level of consistency was maintained, the specially trained test administrators conducted the test by following instructions in the original ‘Teacher’s Guide’ (Hagues et al., 2001b). As in the pilot study, very clear and specific instructions for the test
14 Mathematics in Malta
administration were provided. These included situations where the predominant language of testing was either Maltese or English. The test administrators were asked to feel free to explain in English / Maltese as well, if they felt that the pupils did not understand the instructions in the main language used for test administration.
3.2 Scoring the TestsThe project researcher trained four fully qualified teachers how to score the test according to the instructions in the original ‘Teacher’s Guide’ (Hagues et al., 2001). Each correct answer was to be awarded one mark. Prior to data entry, all test booklets were double-checked by the five markers on the team, to ensure that the scoring was accurate.
This chapter presents the results of the Test Administrator’s Questionnaire and the main raw score results of the Mathematics 5 test.
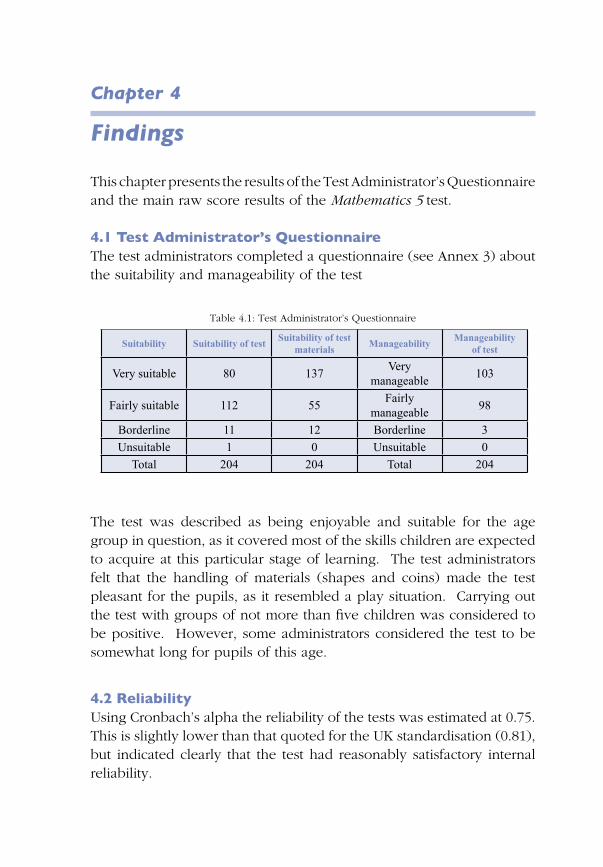
4.1 Test Administrator’s QuestionnaireThe test administrators completed a questionnaire (see Annex 3) about the suitability and manageability of the test
Chapter 4
Findings
Table 4.1: Test Administrator’s Questionnaire
Suitability Suitability of testSuitability of test
materialsManageability
Manageability of test
Very suitable 80 137Very
manageable103
Fairly suitable 112 55Fairly
manageable 98
Borderline 11 12 Borderline 3
Unsuitable 1 0 Unsuitable 0
Total 204 204 Total 204
The test was described as being enjoyable and suitable for the age group in question, as it covered most of the skills children are expected to acquire at this particular stage of learning. The test administrators felt that the handling of materials (shapes and coins) made the test pleasant for the pupils, as it resembled a play situation. Carrying out the test with groups of not more than five children was considered to be positive. However, some administrators considered the test to be somewhat long for pupils of this age.
4.2 ReliabilityUsing Cronbach’s alpha the reliability of the tests was estimated at 0.75. This is slightly lower than that quoted for the UK standardisation (0.81), but indicated clearly that the test had reasonably satisfactory internal reliability.
16 Mathematics in Malta
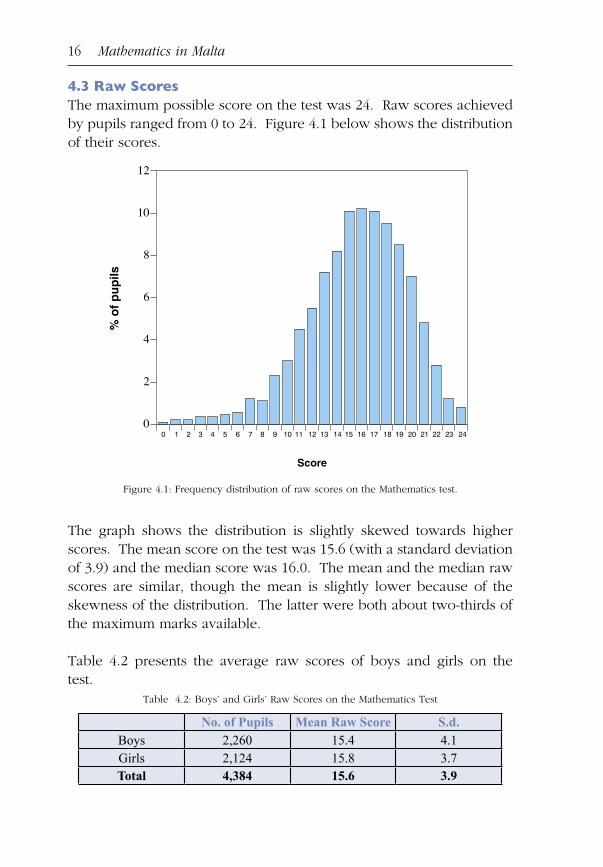
4.3 Raw ScoresThe maximum possible score on the test was 24. Raw scores achieved by pupils ranged from 0 to 24. Figure 4.1 below shows the distribution of their scores.
Figure 4.1: Frequency distribution of raw scores on the Mathematics test.
The graph shows the distribution is slightly skewed towards higher scores. The mean score on the test was 15.6 (with a standard deviation of 3.9) and the median score was 16.0. The mean and the median raw scores are similar, though the mean is slightly lower because of the skewness of the distribution. The latter were both about two-thirds of the maximum marks available.
Table 4.2 presents the average raw scores of boys and girls on the test.
Table 4.2: Boys’ and Girls’ Raw Scores on the Mathematics Test
No. of Pupils Mean Raw Score S.d.Boys 2,260 15.4 4.1Girls 2,124 15.8 3.7Total 4,384 15.6 3.9

Findings 17
On average the girls scored approximately 0.4 of a mark more than the boys on the test. This difference in performance in favour of girls is slightly smaller than that obtained in the literacy studies in Year 2 and Year 5 (Mifsud et al., 2000, 2004a). This would be expected, since boys typically do relatively better compared to girls in Mathematics and science subjects. Until relatively recently, boys could be expected to outperform girls in Mathematics, but some recent trends have shown girls being more successful (MacCann,1995 and Machin & McNally, 2005).
However, in order to investigate differences in performance thoroughly, it is important to consider simultaneously all other factors. This was addressed through multilevel modelling. In the pilot study, tables were presented comparing the performance of different groups of pupils. In this report, the corresponding results are shown in the ‘unadjusted’ part of the multilevel analyses (see Table 5.2).

In this section, the results of the multilevel analyses are described.
5.1 Multilevel ModellingIn education, as in many other areas of research, data occur in a structured arrangement. Schools are made up of classes, which in turn are made up of pupils. In general, it happens that there is a degree of similarity between the lower-level elements within a higher-level element. This hierarchical quality is not acknowledged in the standard ‘traditional’ statistical techniques used in ‘school effectiveness studies up to about the mid-1980s’. This resulted in ‘biases in the estimation, especially of statistical significance’ (Hutchison, 2003:32). The technique of multilevel modelling (Goldstein, 2003; Raudenbush and Bryk, 2002) has been developed precisely to take account of hierarchical structures. This technique has been used in this study. Two levels are considered: pupil and school. The programme used in this project was MlwiN (Rasbash et al., 2000).
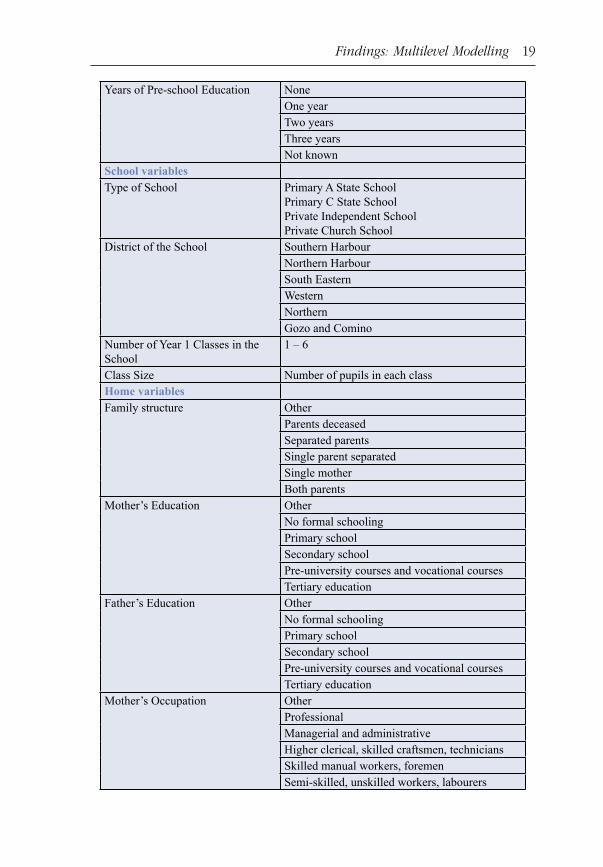
5.2 Background VariablesTable 5.1 shows the background variables used in the multilevel
modelling analyses, with their subcategories.
Chapter 5
Findings: Multilevel Modelling
Table 5.1: Background Variables Used in Multilevel Modelling, with Subcategories
Variables SubcategoriesPupil variablesGender Male
FemaleAge In completed months at date of testing*First Language**
Maltese English
Special Educational Needs No SENSEN
Findings: Multilevel Modelling 19
Years of Pre-school Education NoneOne yearTwo yearsThree yearsNot known
School variablesType of School Primary A State School
Primary C State School Private Independent SchoolPrivate Church School
District of the School Southern HarbourNorthern HarbourSouth EasternWesternNorthernGozo and Comino
Number of Year 1 Classes in the School
1 – 6
Class Size Number of pupils in each classHome variablesFamily structure Other
Parents deceasedSeparated parentsSingle parent separatedSingle motherBoth parents
Mother’s Education OtherNo formal schoolingPrimary schoolSecondary schoolPre-university courses and vocational coursesTertiary education
Father’s Education OtherNo formal schoolingPrimary schoolSecondary schoolPre-university courses and vocational coursesTertiary education
Mother’s Occupation OtherProfessionalManagerial and administrativeHigher clerical, skilled craftsmen, techniciansSkilled manual workers, foremenSemi-skilled, unskilled workers, labourers

20 Mathematics in Malta
Father’s Occupation OtherProfessionalManagerial and administrativeHigher clerical, skilled craftsmen, techniciansSkilled manual workers, foremenSemi-skilled, unskilled workers, labourers
* Date of testing: April 2004
** All but two pupils are described as having been tested in their home language. The variable ‘Language’ is taken as referring to both first language and language of testing.
These factors were considered individually as well as globally. The outcome variable for these analyses was the raw score. We decided to use raw scores rather than age-standardised scores, so that the effect of other variables could be compared to that of age. For example, the effect of gender in the adjusted analysis is 0.25, approximately equal to the coefficient for age in months (0.26). This could be interpreted to mean that the girls are ahead by an amount approximately equivalent to one month’s progress at this stage. Using raw scores also makes for comparability of approach with the earlier literacy study (Mifsud et al., 2000). Two different multilevel models were employed. First each of the variables was included in the model individually. This allows to determine the impact of each of the factors separately. This is known as the ‘unadjusted’ model. The second model included all the variables together so that each variable was considered simultaneously with all the other factors that might affect pupil performance. This is referred to as the ‘adjusted’ model. The multilevel modelling results are presented in Table 5.2.
Unless otherwise stated, only results considered statistically significant at least at the 5 percent level are reported.
Table 5.2: Unadjusted and Adjusted Results
Unadjusted modelAdjusted model
Adjusted model
N Coefficient s.e. Chi-square Coefficient s.e. Chi-square
Pupil variables
Gender Male 2,260 0 - 6.53* 0 - 4.79*
Female 2,124 0.32 0.13 0.26 0.12
Age In completed months 4,384 0.26 0.02 245.21*** 0.25 0.06 241.59***

Findings: Multilevel Modelling 21
FirstLanguage
Maltese 3,804 0 - 5.81* 0 - 1.07
English 580 0.67 0.28 0.28 0.27
SEN No SEN 4,290 0 - 44.79*** 0 - 40.27***
SEN 94 -2.67 0.40 -2.41 0.38
Pre-School None 49 0 - 23.16*** 0 - 21.14***
One Year 267 0 0.62 0.24 0.59
Two years 3,846 0.97 0.57 0.90 0.54
Three years 184 1.76 0.64 1.13 0.61
Not Known 38 0.17 0.85 1.20 0.81
School variables
Type of School
Primary A State School 1,255 0 - 2.22 0 - 3.03
Primary C State School 1,374 0.23 0.40 0.01 0.50
Private Independent School 688 0.57 0.50 -0.68 0.53
Private Church School 1,067 0.56 0.44 -0.26 0.51
District Southern Harbour 915 0 - 8.52 0 - 12.18*
Northern Harbour 1,335 -0.17 0.39 -0.36 0.36
South Eastern 496 0.16 0.50 -0.08 0.47
Western 609 0.15 0.49 -0.18 0.44
Northern 653 1.01 0.52 0.70 0.51
Gozo and Comino 376 -0.54 0.48 -1.21 0.45
Number of Year 1 Classes
1 674 0 - 1.86 0 - 15.70**
2 1,311 -0.34 0.35 -0.28 0.31
3 1,047 -0.28 0.41 -0.59 0.39
4 675 -0.46 0.52 -0.85 0.55
5 410 0.08 0.70 -0.17 0.72
6 267 0.32 0.94 -0.25 0.98
Class Size Size 221 0.053 0.15 0.15 0.081 0.149 0.89
Size squared 221 -0.00118 0.0038 -0.0024 0.00369
Home variables
Family Structure
Other 158 0 - 44.86*** 0 - 11.91*
Parent deceased 19 1.57 0.93 -0.05 0.94
Separated parents 232 1.15 0.40 -0.63 0.52
Single parent separated 39 -0.35 0.68 -1.82 0.72
Single Mother 105 0.62 0.49 -0.74 0.58
Both parents 3,831 2.10 0.32 -0.17 0.50
Mother’sEducation
Other 240 0 - 123.72*** 0 - 43.18***
No formal schooling 6 1.22 1.56 0.06 1.63
Primary School 91 0.12 0.47 0.19 0.57
Secondary School 2,733 1.53 0.26 0.92 0.40
Pre-university courses and vocational courses
880 2.35 0.28 1.37 0.42
Tertiary Education 434 2.86 0.31 1.47 0.46
Father’s Education
Other 386 0 - 143.22*** 0 - 11.64*
No formal schooling 10 1.69 1.21 0.89 1.27
Primary School 194 0.16 0.34 -0.71 0.41
Secondary School 2,443 1.33 0.21 0.03 0.32
Pre-university courses and vocational courses
741 2.22 0.24 0.38 0.35
Tertiary Education 610 2.52 0.26 0.20 0.38
22 Mathematics in Malta
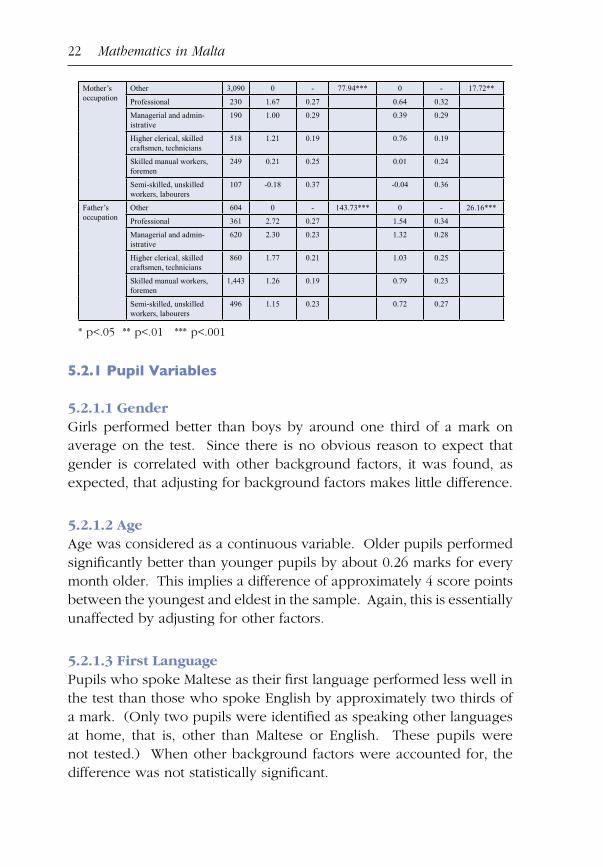
Mother’s occupation
Other 3,090 0 - 77.94*** 0 - 17.72**
Professional 230 1.67 0.27 0.64 0.32
Managerial and admin-istrative
190 1.00 0.29 0.39 0.29
Higher clerical, skilled craftsmen, technicians
518 1.21 0.19 0.76 0.19
Skilled manual workers, foremen
249 0.21 0.25 0.01 0.24
Semi-skilled, unskilled workers, labourers
107 -0.18 0.37 -0.04 0.36
Father’soccupation
Other 604 0 - 143.73*** 0 - 26.16***
Professional 361 2.72 0.27 1.54 0.34
Managerial and admin-istrative
620 2.30 0.23 1.32 0.28
Higher clerical, skilled craftsmen, technicians
860 1.77 0.21 1.03 0.25
Skilled manual workers, foremen
1,443 1.26 0.19 0.79 0.23
Semi-skilled, unskilled workers, labourers
496 1.15 0.23 0.72 0.27
* p<.05 ** p<.01 *** p<.001
5.2.1 Pupil Variables
5.2.1.1 GenderGirls performed better than boys by around one third of a mark on average on the test. Since there is no obvious reason to expect that gender is correlated with other background factors, it was found, as expected, that adjusting for background factors makes little difference.
5.2.1.2 AgeAge was considered as a continuous variable. Older pupils performed significantly better than younger pupils by about 0.26 marks for every month older. This implies a difference of approximately 4 score points between the youngest and eldest in the sample. Again, this is essentially unaffected by adjusting for other factors.
5.2.1.3 First LanguagePupils who spoke Maltese as their first language performed less well in the test than those who spoke English by approximately two thirds of a mark. (Only two pupils were identified as speaking other languages at home, that is, other than Maltese or English. These pupils were not tested.) When other background factors were accounted for, the difference was not statistically significant.
Findings: Multilevel Modelling 23
5.2.1.4 Special Educational NeedsSpecial Educational Needs on average had the most effect on pupils’ raw score of any of the background variables considered. Pupils assessed as having special educational needs scored on average between two and three points lower than pupils without any SEN. This significant difference in achievement was largely unaffected when all other factors were taken into consideration. Many, though not all, pupils who were classified as having Special Educational Needs had learning difficulties.
5.2.1.5 Pre-school The preponderance of pupils (nearly 90 percent) had attended two years of pre-schooling. It is almost as if there had been a voluntary lowering of the school entry age. The greater the amount of pre-schooling, the better children appeared to perform. It is likely that children were introduced to some elements of Mathematics during their preschool time.
5.2.2 School Variables
5.2.2.1 Type of SchoolThe differences between types of school, in favour of private church and private independent schools, were not statistically significant either in isolation or after allowing for other factors.
5.2.2.2 DistrictsThe differences in performance between the districts were not statistically significant in either the ‘unadjusted’ model or the ‘adjusted’ model.
5.2.2.3 Number of ClassesSome differences in raw scores were detected depending on the number of Year 1 classes in the school. However, these differences were not statistically significant, even when taking other factors into consideration.

24 Mathematics in Malta
5.2.2.4 Class SizeEffects of class size were not statistically significant. In extreme cases, where class size was over 28 the class performance was below the population average, whereas where class size was below 10, these classes performed above the population average.
5.2.3 Home Variables
5.2.3.1 Family StructureThe stability of the home relationship seems to be an important factor in school attainment. There was a highly significant relationship between the latter and attainment. Some of the groups were relatively small. Despite this, it appears that pupils from families with both parents did better than pupils without one or both biological parents present, or pupils whose parents were separated and one of the parents was absent. Such disadvantageous situations do not occur in isolation. Allowing for other background factors meant that these effects were no longer statistically significant.
5.2.3.2 Mother’s EducationThe level of mothers’ education had a statistically significant impact on their children’s performance. The higher the mother’s educational level, the higher the score obtained by the child. After adjusting for other factors this pattern was reduced but, in contrast with that for fathers’ education, was still statistically significant.
5.2.3.3 Father’s EducationThe level of fathers’ education had a statistically significant impact on their children’s performance. The higher the father’s educational level, the higher the score the child obtained in the test. After adjusting for other factors this pattern was reduced and not statistically significant.
5.2.3.4 Father’s OccupationThe fathers’ current occupation had a statistically significant impact on their children’s raw score and followed the ordering of the classification itself. This pattern was reduced, but it was still evident and statistically significant after adjusting for other factors. The higher the father’s

Findings: Multilevel Modelling 25
occupation, the higher the score the child obtained in the test.
5.2.3.5 Mother’s OccupationThe preponderance of mothers fell into the group labelled ‘Other’ (that is, homemakers), and this was used as a baseline. However, there was a statistically significant difference in performance between the various categories of mother’s occupation. This difference showed a comparable pattern to that of father’s occupation. As with the father’s occupation, the differences were reduced after allowing for other background factors. However, they remained statistically significant, albeit at a lower level.
5.3 Further AnalysesThis section presents, in graphs, some of the findings introduced in the previous section.
5.3.1 Overall Results by Process CategoryFigure 5.1 presents the percentage scores for each process category for the whole population.
Figure 5.1: Process categories for whole population
Maltese children do best on the Understanding Number (81%) and on the Computation and Knowledge (65%) process categories.

26 Mathematics in Malta
5.3.2 Results for Each Process Category by GenderFigure 5.2 presents the percentage scores for each process category according to gender.
Figure 5.2: Process categories by gender.
Girls performed better than boys even when adjusting for background factors.
5.3.3 Results for Each Process Category by AgeFigure 5.3 presents the percentage scores for each process category according to age group. The younger group included pupils up to 69 months (N=2256, 51.5%). The older group included pupils in the 70 months and over age range (N=2128, 48.5%).

Findings: Multilevel Modelling 27
Figure 5.3: Process categories by grouped age.
Older pupils performed significantly better than younger pupils. This difference is unaffected when adjusting for other factors.
5.3.4 Results for Each Process Category by First LanguageFigure 5.4 presents the percentage scores for each process category according to first language.
Figure 5.4: Process categories by first language.

28 Mathematics in Malta
Pupils who spoke Maltese as their first language performed less well than those who spoke English. However, when other background factors were accounted for the difference was not statistically significant.
5.3.5 Results for Each Process Category by Special Educational Needs (SEN)Figure 5.5 presents the percentage scores for each process category according to SEN.
Figure 5.5: Process categories by special educational needs.
Special Educational Needs on average had the strongest effect on pupils’ raw score of any of the background variables considered. The significant difference in achievement was largely unaffected when all other factors were taken into consideration.

Findings: Multilevel Modelling 29
Figure 5.6: Process categories by island.
The differences between Malta and Gozo were not statistically significant in either the ‘unadjusted’ model or the ‘adjusted’ model.
5.3.6 Results for Each Process Category by IslandFigure 5.6 compares the percentage scores for each process category for Malta and Gozo.

Chapter 6
Discussion
The analysis of the Malta National Mathematics Survey showed that, as in the literacy studies, girls performed better than boys. This follows the relatively recent trend observed in some other countries in which girls are catching up with and overtaking boys, even in traditionally male-oriented subjects such as Mathematics and Science. This may be of some concern if boys are not to be left behind in a future where educational attainment is of increasing importance in the job market.
It is not surprising to observe that children whose parents have had more education, both mothers and fathers, and children whose fathers are in higher status jobs do better. This was also observed in the 1999 Literacy Study (Mifsud et. al., 2000). It is perhaps slightly more surprising that children whose mothers work in skilled or white-collar jobs do better than those (the majority) whose mothers describe themselves as homemakers. This finding does not have a parallel in the 1999 Literacy Survey. The latter did not collect information on mother’s occupation, since only a small proportion was actually in employment.
Children who attended pre-school appeared to do better at this stage, than those who did not. The longer the time they had attended, the higher the score. The experience of attending pre-school goes some way towards socialising pupils who are then more ready to meet the demands of formal education. Another possibility is that in pre-school, children are given some tutoring in the rudiments of mathematical skills. However, from the evidence collated, it does seem that attending pre-school increases performance. This highlights the importance of strengthening further the quality of early childhood education programmes.
In contrast to the ‘unadjusted’ findings of the literacy studies, the better performance of pupils in private church and private independent schools was not statistically significant. Indeed, after allowing for background factors state schools seem to have fared better. Considering

Discussion 31
the very early stage (Year 1), this should not induce complacency in state schools, or indeed panic in the other schools.
6.1 Class SizeAn important question is that of class size. To what extent do pupils do better in smaller classes in the Maltese situation? While everyone ‘knows’ that small classes are better, the research is not completely unambiguous. A useful review of the evidence is presented in Wilson (2002).
A particular concern is that the classes being compared are not in fact comparable. For example, it sometimes happens that ‘low-achieving’ classes are smaller in order to enable teachers to give better attention to the pupils who need it most. However such an arrangement could give an apparent picture of pupils doing worse in small classes. For this reason it is important to take account of possible differences in the characteristics of the pupils involved. Therefore ‘unadjusted’ results are first described by simply looking at the raw scores of the pupils concerned. Then the results are examined after allowing as much as possible for differences in pupil characteristics using multilevel modelling.
Some findings have suggested that the effect of class size is either curvilinear, or a threshold effect. Figure 6.1, presents the difference between actual and predicted pupil attainment (referred to here as
Figure 6.1: Unadjusted school + class residual vs class size.
32 Mathematics in Malta
residual) plotted against class size.
Visual inspection does not reveal any apparent trend in achievement against class size. To check this, a multilevel model was run including size and size-squared, the latter to check for curvilinear effects. Introducing these two elements had no statistically significant effect.
It could be that the apparent absence of effects occurred because the different types of classes were not in fact comparable. For this reason, a multilevel model was also run allowing for the available background factors. However, this does not completely answer the question. The recommended method of investigating such questions is using a randomised trial, as even within the paradigm adopted there is no allowance for pre-existing differences in mathematical competence.
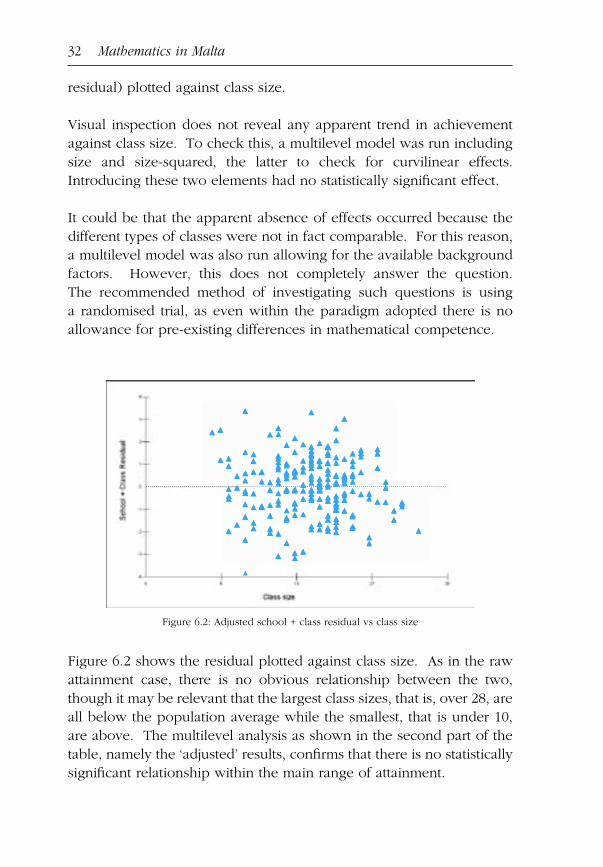
Figure 6.2: Adjusted school + class residual vs class size
Figure 6.2 shows the residual plotted against class size. As in the raw attainment case, there is no obvious relationship between the two, though it may be relevant that the largest class sizes, that is, over 28, are all below the population average while the smallest, that is under 10, are above. The multilevel analysis as shown in the second part of the table, namely the ‘adjusted’ results, confirms that there is no statistically significant relationship within the main range of attainment.

Discussion 33
6.2 Making International ComparisonsThe Malta National Mathematics Survey of Year 1 pupils used the Mathematics 5 test, which forms part of the Mathematics 5-14 series. The tests have been standardised in a UK context on a nationally representative sample. This gave the opportunity to compare the Maltese national performance on this test with the national UK average. The manual for this gives norms and age equivalents, thus offering the opportunity for comparison with the UK.
Mean score N Mean Age (months)15.6 4,384 69.4
Table 6.1: Mean Test Scores for Malta
The Mathematics 5 manual states that the test was standardised on a national sample of 2,722 children from 543 schools in England, Wales, Scotland and Northern Ireland, that were randomly selected from the national register of maintained and independent schools. Further details are given in Hagues et al.(2001b). The results quoted in the Mathematics 5 manual for age equivalents give an age equivalent of 59 months for a score of 16, compared with the figures from the Malta National Mathematics Survey of 69 months for the same score to the nearest whole number (see Table 6.1). There is a difference of just over ten months in achievement in favour of the UK pupils. Two possible explanations are suggested.
The first is that there are difficulties of incompatibility between home and teaching language, and possibly between either of these and the language of the textbooks. The teaching of Mathematics is heavily dependent upon language. It was reported in this study that the large majority of pupils are taught Mathematics in Maltese at this stage, however almost all Mathematical terminology is in English. Powney (1997) and Gillies (1989) have indicated some of the difficulties faced by bilingual children in this respect. This may become even more of a problem in later stages, when the language of instruction for Mathematics is English.
The second possible explanation is the amount of teaching the pupils have received. Some pupils in England start Reception when they are little over four years old. The largest part of the UK sample (85%)

34 Mathematics in Malta
came from England. This may mean that Maltese pupils may in general start formal schooling at a later age than their English contemporaries, though this may not explain all the difference.
These are early stages of schooling yet, and one should not read too much into such comparisons. The start of formal teaching of Mathematics at an earlier age may not necessarily translate into a particularly high performance at later stages and moves in this direction should probably be resisted. In addition, many voices have been raised in the UK against the particularly early age of starting school.
Figure 6.3 compares the percentage scores for each process category for Malta and the UK.
Figure 6.3: Process categories by country
A more detailed analysis by item is presented in Table 6.2. This compares the performance of Maltese and United Kingdom pupils item by item. This differs from the table in Annex 5, which relates to a within-Malta comparison between pupils whose home language is Maltese and those whose home language is English.
Difference in performance was not uniform over all the questions in the test. A DIF analysis, taking into account the overall difference in performance, identified items where Maltese children did relatively well, or relatively badly. On some items the UK-Malta difference was
Discussion 35
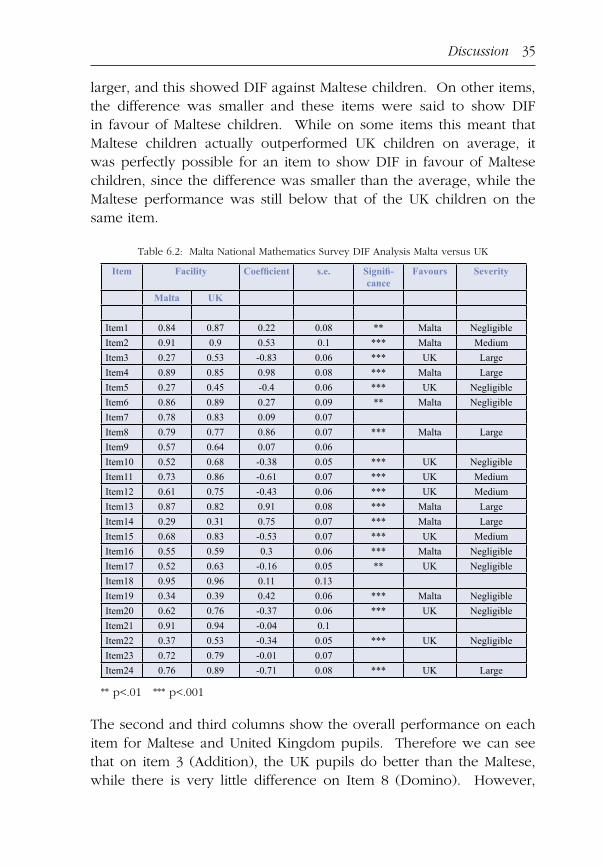
larger, and this showed DIF against Maltese children. On other items, the difference was smaller and these items were said to show DIF in favour of Maltese children. While on some items this meant that Maltese children actually outperformed UK children on average, it was perfectly possible for an item to show DIF in favour of Maltese children, since the difference was smaller than the average, while the Maltese performance was still below that of the UK children on the same item.
Table 6.2: Malta National Mathematics Survey DIF Analysis Malta versus UK
Item Facility Coefficient s.e. Signifi-cance
Favours Severity
Malta UK
Item1 0.84 0.87 0.22 0.08 ** Malta Negligible
Item2 0.91 0.9 0.53 0.1 *** Malta Medium
Item3 0.27 0.53 -0.83 0.06 *** UK Large
Item4 0.89 0.85 0.98 0.08 *** Malta Large
Item5 0.27 0.45 -0.4 0.06 *** UK Negligible
Item6 0.86 0.89 0.27 0.09 ** Malta Negligible
Item7 0.78 0.83 0.09 0.07
Item8 0.79 0.77 0.86 0.07 *** Malta Large
Item9 0.57 0.64 0.07 0.06
Item10 0.52 0.68 -0.38 0.05 *** UK Negligible
Item11 0.73 0.86 -0.61 0.07 *** UK Medium
Item12 0.61 0.75 -0.43 0.06 *** UK Medium
Item13 0.87 0.82 0.91 0.08 *** Malta Large
Item14 0.29 0.31 0.75 0.07 *** Malta Large
Item15 0.68 0.83 -0.53 0.07 *** UK Medium
Item16 0.55 0.59 0.3 0.06 *** Malta Negligible
Item17 0.52 0.63 -0.16 0.05 ** UK Negligible
Item18 0.95 0.96 0.11 0.13
Item19 0.34 0.39 0.42 0.06 *** Malta Negligible
Item20 0.62 0.76 -0.37 0.06 *** UK Negligible
Item21 0.91 0.94 -0.04 0.1
Item22 0.37 0.53 -0.34 0.05 *** UK Negligible
Item23 0.72 0.79 -0.01 0.07
Item24 0.76 0.89 -0.71 0.08 *** UK Large
** p<.01 *** p<.001
The second and third columns show the overall performance on each item for Maltese and United Kingdom pupils. Therefore we can see that on item 3 (Addition), the UK pupils do better than the Maltese, while there is very little difference on Item 8 (Domino). However,
36 Mathematics in Malta
such findings are in themselves not of primary concern, since the overall average for the UK population is above that for Malta. What is now of interest is those performances which are substantially above, or substantially below, on the same item, after allowing for the overall difference. This is equivalent to a Differential Item Functioning (DIF) analysis and the remaining columns deal with this question.
We see that the large majority of items appear to show a statistically significant DIF one way or the other. However, approximately half of these are classified as ‘negligible’ and can be ignored. Those described as ‘medium’ or ‘large’ can be expected to be of more interest.
Maltese children do relatively better on item 2 (clocks), item 4 (telephone number pad), item 13 (money) and item 14 (shopping). Two of these (items 4 and 13) form part of the Understanding Number Process Category. All of these items are more related to practical aspects of Mathematics encountered in ‘everyday’ situations. However, UK children do relatively better on item 3 (addition), item 11 (ordering a series of events), item 12 (comparing shapes), item 15 (subtraction) and item 24 (counting shapes). Most of these (items 3, 11, 15 and 24) form part of the Mathematical Application Process Category.
Apparent differences could arise because of what the children had actually been taught, the emphasis given to different items in the curriculum, and the order in which they were introduced. The UK children may be introduced earlier to more formal Mathematics, such as addition and subtraction.

The Malta National Mathematics Survey provides the first ever baseline study of Mathematics attainment in Malta and Gozo. During the analysis of the test scores, various variables were taken into consideration. Some of these variables had a statistically significant effect on the pupils’ performance in the test. For instance, children who attended pre-school do better in Year 1 as they seem to be more ready for the demands of formal education.
The results of the Maltese and Gozitan pupils were also compared to UK results. Generally Maltese pupils perform well. However, when compared to their counterparts in the UK, they performed relatively better in the more practical aspects of Mathematics while their performance was not as good in the more formal aspects. This may be the result of the amount of teaching pupils have received as well as the incompatibility between the language spoken at home and the teaching language. However, at this stage, one should neither read too much into such comparisons nor promote that the formal teaching of Mathematics should start earlier.
7.1 Implications for SchoolsThrough a process of self-improvement, schools may take measures to address weaknesses in the four process categories: Understanding Number, Non-Numerical Processes, Computation and Knowledge, and Mathematical Application. The Teacher’s Guide for the nferNelson Mathematics 5 test provides suggestions about how schools can address these issues. The following notes have been adapted from this Guide.
When surveying its results, it is important for a school to consider all incorrect answers and to diagnose whether the error is due to (a) carelessness, (b) lapse of memory, (c) lack of understanding, or (d) the fact, concept or process not having been met before. In the case of the first two reasons, extra practice or revision is necessary. Errors due to the other reasons indicate that further teaching is required.
Chapter 7
Implications
38 Mathematics in Malta
7.1.1 Understanding NumberWhen any new skill or concept in Number is introduced, the first stage of learning is to understand the process. The initial introduction will be through direct teaching using appropriate resources and language. Pupils will require as many different experiences as possible to achieve understanding. The test items under this category require an understanding of the numerical processes to be used when answering. If there is a weakness in this category, then reteaching may be necessary. This may mean either presenting the same process or technique in a slightly different way or providing similar experiences to develop the appropriate language and concepts.
7.1.2 Non-numerical ProcessesWhen any new skill or concept in Shape, Space and Measures is introduced, the first stage of learning is to understand the concept, skills and language involved. The initial introduction will be through direct teaching using appropriate resources and language. Pupils will require as many different experiences as possible in order to be able to apply non-numerical processes to solving problems that do not have a significant numerical content. If there is a weakness in this category, then reteaching may be necessary. This may mean presenting the same content in a slightly different way.
7.1.3 Computation and KnowledgeThis category presents us with two aspects: the ability to quickly recall number facts or well-rehearsed pencil and paper techniques, and the ability to recall mathematical facts and terminology. Both of them require use of memory. The test items are either mechanistic or rely on memorizing mathematical facts and language. A weakness in this category suggests a memory lapse, insufficient practice or unfamiliarity with the terminology used.
7.1.4 Mathematical ApplicationA major aim of mathematics teaching is the application of acquired skills and concepts. Once skills or concepts have been understood and abstracted, pupils need the opportunity to apply them in solving mathematical problems. A weakness in this category may indicate insufficient experience in the areas of understanding and computation.
It would be valuable to conduct this assessment regularly. Since the test has been standardised for Year 1, when the children are 5-6 years old, it would be convenient to use these same tests on the same age group annually. Regular assessment of Mathematics and numeracy skills has become a widespread trend. ‘In Australia, for example, all state education ministers have recently introduced annual statewide Year 7 literacy and numeracy tests’, while in the USA President Bush also recognized the importance of annual literacy and numeracy assessment (Kalantzis et al., 2003). In England, pupils are assessed in Mathematics and English at the age of 7, and in Mathematics, English and Science at the age of 11.
A comparable study of literacy attainment, in Year 2 in 1999, was used as a base to launch a value added study by following up the same pupils in Year 5. This provided much valuable information on the functioning of the system as a whole. The most important contribution to the success of this exercise was that of the schools. Their contribution was not overlooked and they were involved in a series of one-to-one seminars conducted by the Education Division and the University of Malta in conjunction with the National Foundation for Educational Research, UK. The aim was to discuss with schools what insight they could gain on the performance of their schools. It is recommended that the current study be used as the basis of a further national value added study, this time in Mathematics, collecting further results from pupils in Year 3. Such an interval would give time to identify the success or otherwise of programmes for boosting attainment of lower-attaining pupils, and also to take further action, if necessary.
It would also be useful to have a second follow-up study at either Year 5 or Year 6. Year 6 would be preferable as a corresponding Mathematics test could be used as part of the standard assessment at the end of primary education. Failing this, the corresponding element of the Mathematics 5-14 series could be administered in Year 5, as was
Chapter 8
Recommendations

40 Mathematics in Malta
the case for the literacy study. In either case, the repeat study could be analysed to determine whether there was any tendency for pupils who performed less well in this study to catch up. The tendency appeared to be limited in the Year 5 literacy study, despite the efforts that had been put into booster programmes between the Year 2 and Year 5 literacy studies.
The findings of this study have confirmed the findings of the literacy study that nursery attendance seems to boost attainment. This implies that it could be a very valuable investment to ensure that there are high quality programmes in early childhood education.
ConclusionThis study, together with the literacy studies carried out in these last few years by the Education Division and the Literacy Unit of the University of Malta, has helped to present the situation in Maltese primary schools. It is hoped that the awareness of schools in Malta and Gozo regarding Mathematics is raised through the National Mathematics Survey.
Good mathematical skills, even more than literacy skills, are associated with better-paid jobs (DfES Research Brief RB490, 2003). Increased opportunities to acquire skills for life should lead to better employment opportunities and fulfilment in life.

• ASCHER, C., (1990). Assessing Bilingual Students for Placement Instruction, ERIC Clearinghouse on Urban Education, New York, N.Y., 65, pp. 1-6. Retrieved February 27th, 2003 from http://www.eric-web.tc.columbia.edu/digest/dig65.asp
• BUTLER, F.A., & STEVENS, R. (1997). Accommodation strategies for English language learners on large-scale assessments: Student characteristics and other characteristics (CSE Tech. Rep. No. 488). Los Angeles: University of California, National Center for Research on Evaluation, Standards, and Student testing.
• CARUANA ANASTASI, C. (2003). Exposure to Language: Its Role in Examinations. Journal of Maltese Education Research, 1 (1), pp. 45-72.
• CURRICULUM DEPARTMENT, (2005). New Primary Syllabus, Ministry of Education, Malta.
• DEL ROSARIO BASTERRA, M. (1998). Using standardized tests to make high-stake decisions on English-language learners: dilemmas and critical issues, Equity Review, Winter 1998 – Spring 1999, pp.1-3. Retrieved February 24th, 2003 from http://www.maec.org/ereview1.html
• DEPARTMENT FOR EDUCATION AND SKILLS, (2003). The Skills for Life Survey - A national needs and impact survey of literacy, numeracy and ICT skills. Research Brief RB490.
• GILLIES, A. (1989). Achievement in SCE Exams by Pupils from an Asian Background in Five Glasgow schools. SCRE Spotlight no.20, Edinburgh.
• GOLDSTEIN, H. (2003). Multilevel Statistical Models: Third Edition (Kendall’s Library of Statistics 3). London: Arnold.
• HAGUES, N., CLAUSEN-MAY, T., VAPPULA, H. and MORRIS, J. (2001a). Mathematics 5-14: Mathematics 5. Windsor: nferNELSON.
References

42 Mathematics in Malta
• HAGUES, N., CLAUSEN-MAY, T., VAPPULA, H. and MORRIS, J. (2001b). Mathematics 5-14: Teacher’s Guide. Windsor: nferNELSON.
• HUTCHISON, D. (2003), The Effect of Group-level Influences on Pupils’ Progress in Reading, British Education Research Journal, Vol. 29, No. 1, pp.25-39.
• KALANTZIS, M., COPE, B. and HARVEY, A. (2003). Assessing Multiliteracies and the New Basics, Assessment in Education: Principles, Policy & Practice, Vol. 10, No. 1, pp.15-26.
• MACCANN, R. (1995) A longitudinal study of sex differences in HSC and SC. Australian College of Education New South Wales Chapter Newsletter (June 1995 supplement).
• MACHIN, S. and McNALLY, S. (forthcoming in 2005) Gender and Educational Attainment in the UK. Oxford Review of Economic Policy, OUP, UK.
• MERTTENS, R. & KIRKBY, D. (2001). Abacus. (Third impression) Ginn and Company, Oxford.
• MIFSUD, C.L., MILTON, J., BROOKS, G. and HUTCHISON, D. (2000). Literacy in Malta: The 1999 National Survey of Attainment of Year 2 Pupils. Slough: NFER and the University of Malta.
• MIFSUD, C.L., GRECH, R. and DIMECH LLANAJ, E. (2003). Provision for Literacy in Maltese Primary Schools. Literacy Unit Monograph Series No. 3, University of Malta.
• MIFSUD, C.L., GRECH, R., HUTCHISON, D., MORRISON, J., RUDD, P. and HANSON, J. (2004a). Literacy for School Improvement – The Malta Value Added Study. Malta: Agenda, NFER, University of Malta, Education Division Publication.
• MIFSUD, C.L., RICHARD, S. and HUTCHISON, D. (2004b) The Mathematics Attainment of Year 1 pupils in Malta – Interim Report and Consultation Document on the Pilot Study. Department of Planning and Development, Education Division, Malta.
• POWNEY, J. (1997) Trends in Gender Attainment in Scotland. SCRE Spotlights No.64, Edinburgh.
References 43
• RASBASH, J., GOLDSTEIN, H., BROWNE, W.J., YANG, M. and WOODHOUSE, G. (2000). The MlwiN command interface (Version 1.3).
• RAUDENBUSH, S.W. and BRYK, A.S. (2002). Hierarchical Linear Models: second edition. Newbury Park: Sage.
• SCHAGEN, I. (1990) A Method for the Age Standardisation of Test Scores. Applied Psychological Measurement, 14, 4 387-393.
• SHEPHARD, L., TAYLOR, G., BETEBENNER, D. (1998). Inclusion of Limited-English-Proficient Students in Rhode Island’s Grade 4 Mathematics Performance Assessment, CSE Technical Report 486, Center for the Study of Evaluation, University of California, Los Angeles. Retrieved February 24th, 2003 from http://cresst96.cse.ucla.edu/CRESST/Summary/486shephard.htm
• STRAND, S. (1997). Pupil Progress during Key Stage 1: a value added analysis of school effects, British Education Research Journal, Vol. 23, No. 4, pp. 471-487.
• STRAND, S. (1999). Ethnic Group, Sex and Economic Disadvantage: associations with pupils’ educational progress from Baseline to the end of Key Stage 1, British Education Research Journal, Vol. 25, No. 2, pp.179-202.
• STRAND, S. (2002). Pupil Mobility, Attainment and Progress During Key Stage 1: a study in cautious interpretation, British Education Research Journal, Vol. 28, No. 1, pp. 63-78.
• THRUPP, M. (2001). Recent School Effectiveness Counter-critiques: problems and possibilities, British Education Research Journal, Vol. 27, No. 4, pp.443-457.
• TYMMS, P., MERRELL, C. and HENDERSON, B. (1997). The First Year at School: A Quantitative Investigation of the Attainment and Progress of Pupils, Educational Research and Evaluation, Vol.3, No.2, pp.101-118.
• WILSON, V. (2002). Does Small Really Make a Difference? A review of the literature on the effects of class size on teaching practice and pupils’ behaviour and attainment. Edinburgh: Scottish Council for Research in Education.
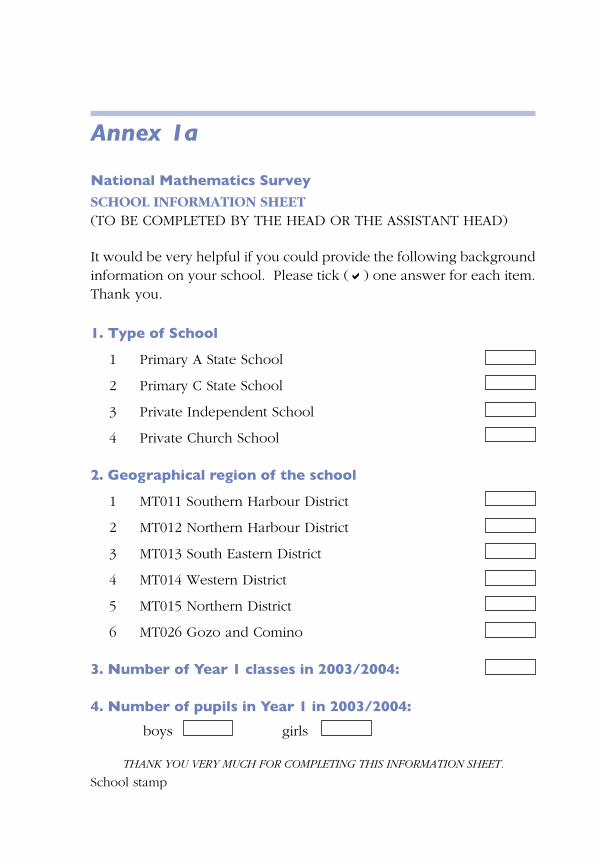
Annex 1a
National Mathematics Survey
SCHOOL INFORMATION SHEET(TO BE COMPLETED BY THE HEAD OR THE ASSISTANT HEAD)
It would be very helpful if you could provide the following background information on your school. Please tick (a) one answer for each item. Thank you.
1. Type of School
1 Primary A State School
2 Primary C State School
3 Private Independent School
4 Private Church School
2. Geographical region of the school
1 MT011 Southern Harbour District
2 MT012 Northern Harbour District
3 MT013 South Eastern District
4 MT014 Western District
5 MT015 Northern District
6 MT026 Gozo and Comino 3. Number of Year 1 classes in 2003/2004: 4. Number of pupils in Year 1 in 2003/2004:
boys girls
THANK YOU VERY MUCH FOR COMPLETING THIS INFORMATION SHEET.
School stamp
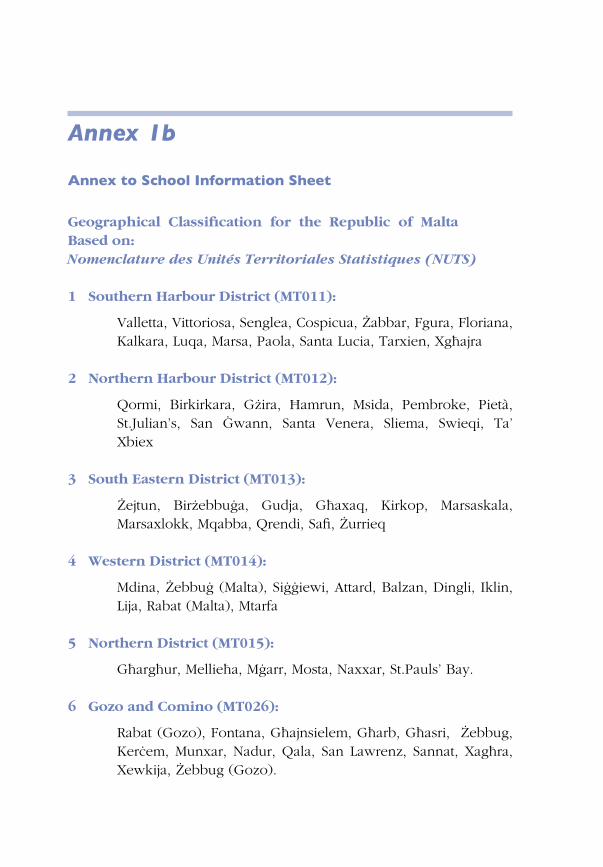
Geographical Classification for the Republic of MaltaBased on:Nomenclature des Unités Territoriales Statistiques (NUTS)
1 Southern Harbour District (MT011):
Valletta, Vittoriosa, Senglea, Cospicua, Ûabbar, Fgura, Floriana, Kalkara, Luqa, Marsa, Paola, Santa Lucia, Tarxien, Xg˙ajra
2 Northern Harbour District (MT012):
Qormi, Birkirkara, GΩira, Óamrun, Msida, Pembroke, Pietà, St.Julian’s, San Ìwann, Santa Venera, Sliema, Swieqi, Ta’ Xbiex
3 South Eastern District (MT013):
Ûejtun, BirΩebbu©a, Gudja, G˙axaq, Kirkop, Marsaskala, Marsaxlokk, Mqabba, Qrendi, Safi, Ûurrieq
4 Western District (MT014):
Mdina, Ûebbu© (Malta), Si©©iewi, Attard, Balzan, Dingli, Iklin, Lija, Rabat (Malta), Mtarfa
5 Northern District (MT015):
G˙arg˙ur, Mellie˙a, M©arr, Mosta, Naxxar, St.Pauls’ Bay.
6 Gozo and Comino (MT026):
Rabat (Gozo), Fontana, G˙ajnsielem, G˙arb, G˙asri, Ûebbug, Kerçem, Munxar, Nadur, Qala, San Lawrenz, Sannat, Xag˙ra, Xewkija, Ûebbug (Gozo).
Annex 1b
Annex to School Information Sheet

Annex 2a
SURVEY NAZZJONALI TAL-MATEMATIKA (Year 1) Id-DiviΩjoni ta’ l-Edukazzjoni flimkien ma’ l-Università ta’ Malta qed tag˙mel Survey Nazzjonali tal-Matematika ma’ l-istudenti kollha tal-Year 1. L-informazzjoni li se tin©abar se tintuΩa biex ikun hemm titjib fil-˙iliet tal-matematika fost l-istudenti. Nitolbukom tipparteçipaw f’dan il-pro©ett billi timlew din il-formola.(F’kaΩ ta’ diffikultà, çempel jew ikkuntattja l-iskola.)
Din l-informazzjoni qed tin©abar skond l-Att dwar il-Protezzjoni u l-Privatezza tad-Data 2001. L-informazzjoni se tintuΩa biss g˙al skopijiet ta’ riçerka marbuta ma’ dan il-pro©ett u se tkun trattata bl-akbar kunfidenzjalità. Isem u kunjom ibnek / bintek Jum Xahar Sena I.D. ta’ ibnek / bintek
Data tat-twelid
Jekk ma tafhomx, ittikkja l-kaxxa (a) biex din l-informazzjoni ting˙ata mill-iskola.
Il-livell ta’ edukazzjoni tal-©enituri (Ittikkja (a) skond il-˙tie©a.) Missier Omm
L-ebda skola
Skola primarja
Skola sekondarja
Sixth Form jew Korsijiet Vokazzjonali
Edukazzjoni terzjarja
Ma nafx
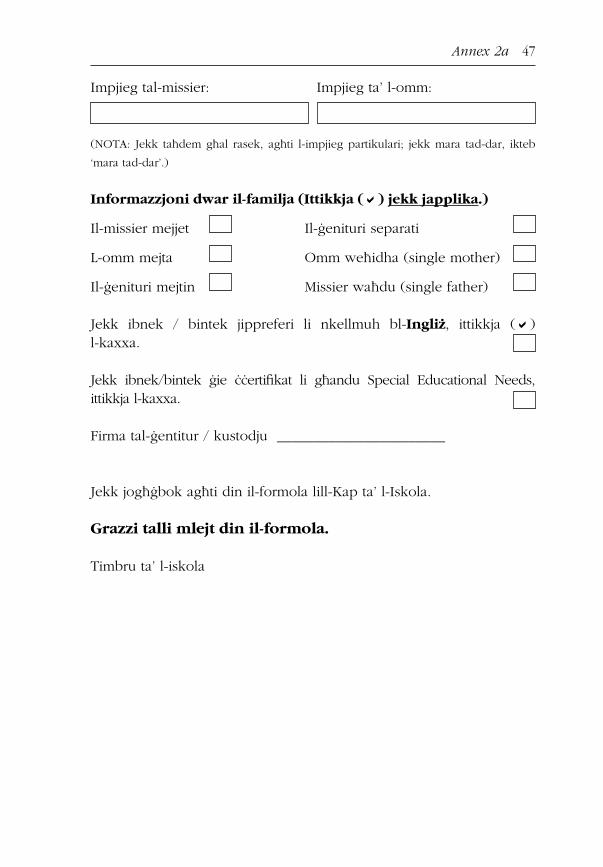
Annex 2a 47
Impjieg tal-missier: Impjieg ta’ l-omm: (NOTA: Jekk ta˙dem g˙al rasek, ag˙ti l-impjieg partikulari; jekk mara tad-dar, ikteb
‘mara tad-dar’.) Informazzjoni dwar il-familja (Ittikkja (a) jekk japplika.)
Il-missier mejjet Il-©enituri separati
L-omm mejta Omm we˙idha (single mother)
Il-©enituri mejtin Missier wa˙du (single father) Jekk ibnek / bintek jippreferi li nkellmuh bl-IngliΩ, ittikkja (a) l-kaxxa. Jekk ibnek/bintek ©ie ççertifikat li g˙andu Special Educational Needs, ittikkja l-kaxxa. Firma tal-©entitur / kustodju _______________________
Jekk jog˙©bok ag˙ti din il-formola lill-Kap ta’ l-Iskola.
Grazzi talli mlejt din il-formola.
Timbru ta’ l-iskola

Annex 2b
NATIONAL MATHEMATICS SURVEY (Year 1) The Education Division in conjunction with the University of Malta is conducting a National Mathematics Survey of all Year 1 pupils. The data which is being collected will serve to improve the pupils’ mathematical skills. We kindly ask you to participate in this project by filling in this form.(In case of difficulty, please phone or contact the school.)
This information is being collected in compliance with the Data Protection Act 2001. The information will be used solely for the purpose of research related to this survey and it will be treated with strict confidentiality. Name and surname of child Day Month Year Child's I.D. Number
Date of Birth
If unavailable, tick box (a) so that these will be provided by school.
Father and mother’s level of education (Please tick (a) as necessary.) Father Mother
No formal schooling
Primary school
Secondary school
Sixth Form or Vocational Courses
Tertiary Education
Not known

Annex 2b 49
Father's occupation: Mother's occupation: (NOTE: If self-employed, please name occupation; if housewife, write ‘housewife’.)
Family background (Please tick (a) if applicable.)
Father deceased Parents separated
Mother deceased Single mother
Parents deceased Single father
If your child’s preferred language of communication is English, please tick box. If your child has been certified as having Special Educational Needs, please tick box. Parent's / Guardian's signature _______________________
Kindly return this form to the Head of School. Thank you for completing this form.
School stamp
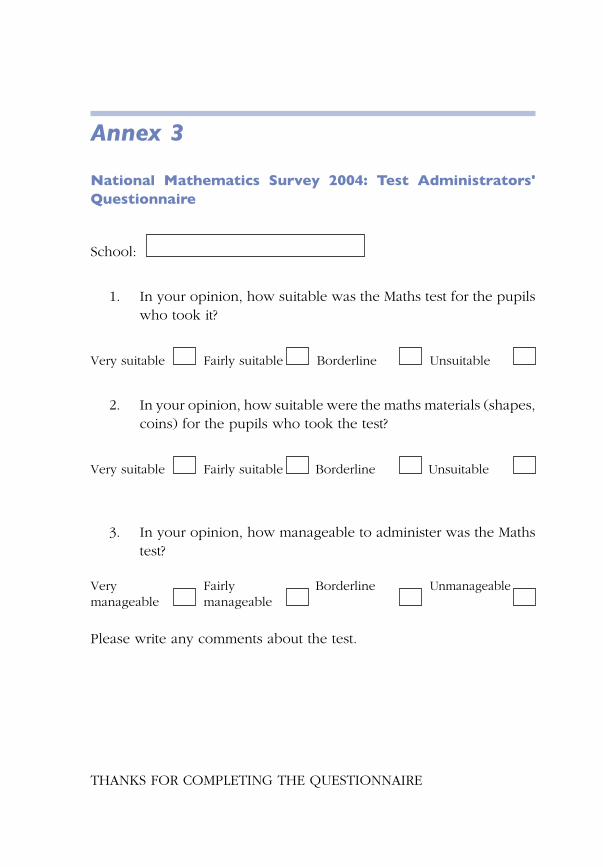
School:
1. In your opinion, how suitable was the Maths test for the pupils who took it?
Very suitable Fairly suitable Borderline Unsuitable
2. In your opinion, how suitable were the maths materials (shapes, coins) for the pupils who took the test?
Very suitable Fairly suitable Borderline Unsuitable
3. In your opinion, how manageable to administer was the Maths test?
Very Fairly Borderline Unmanageablemanageable manageable
Please write any comments about the test.
THANKS FOR COMPLETING THE QUESTIONNAIRE
Annex 3
National Mathematics Survey 2004: Test Administrators' Questionnaire
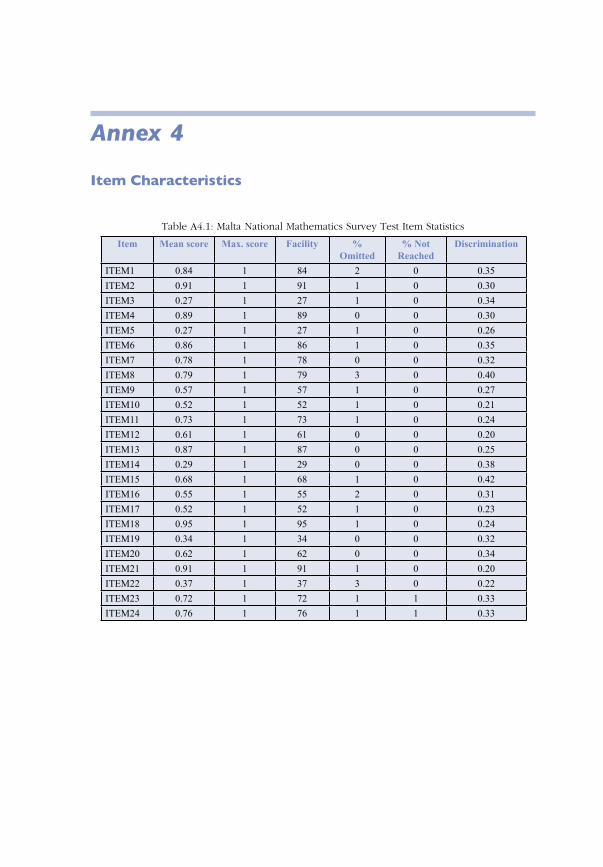
Annex 4
Table A4.1: Malta National Mathematics Survey Test Item Statistics
Item Mean score Max. score Facility % Omitted
% Not Reached
Discrimination
ITEM1 0.84 1 84 2 0 0.35
ITEM2 0.91 1 91 1 0 0.30
ITEM3 0.27 1 27 1 0 0.34
ITEM4 0.89 1 89 0 0 0.30
ITEM5 0.27 1 27 1 0 0.26
ITEM6 0.86 1 86 1 0 0.35
ITEM7 0.78 1 78 0 0 0.32
ITEM8 0.79 1 79 3 0 0.40
ITEM9 0.57 1 57 1 0 0.27
ITEM10 0.52 1 52 1 0 0.21
ITEM11 0.73 1 73 1 0 0.24
ITEM12 0.61 1 61 0 0 0.20
ITEM13 0.87 1 87 0 0 0.25
ITEM14 0.29 1 29 0 0 0.38
ITEM15 0.68 1 68 1 0 0.42
ITEM16 0.55 1 55 2 0 0.31
ITEM17 0.52 1 52 1 0 0.23
ITEM18 0.95 1 95 1 0 0.24
ITEM19 0.34 1 34 0 0 0.32
ITEM20 0.62 1 62 0 0 0.34
ITEM21 0.91 1 91 1 0 0.20
ITEM22 0.37 1 37 3 0 0.22
ITEM23 0.72 1 72 1 1 0.33
ITEM24 0.76 1 76 1 1 0.33
Item Characteristics

Annex 5
A test should measure what it aims to measure, and success or failure on it does not depend upon characteristics irrelevant to the characteristic to be measured. In particular it is important that tests should not discriminate against groups in the population because of details in the wording.
Test designers spend quite a lot of energy checking that the items in their tests are fair. An item in a test is defined as exhibiting positive (negative) Differential Item Functioning (DIF) for a group if pupils of the same measured ability in that group do better (or worse) on that item than other pupils.
Since the test was standardised in the UK, and not in Malta, there was obviously no account taken of the possible problems of administering it to Maltese-speaking children. The test was administered in the language in which instruction took place and there was no written element to the instructions given to the pupils, so, prima facie, there is no reason to assume that non-English-speaking pupils would find certain items relatively more difficult, but there is always the possibility that the way in which one of the languages expresses a particular concept is more straightforward than another.
Table A5.1 shows the results of DIF analysis where the two groups are Maltese-speaking and English-speaking pupils. Eleven of the 24 items apparently show DIF, but this is largely because of the relatively large numbers of pupils involved.
Table A5.1: Malta National Mathematics Survey DIF Analysis by Language
Differential Item Functioning (DIF) in the Malta Administration of the Mathematics 5 Test
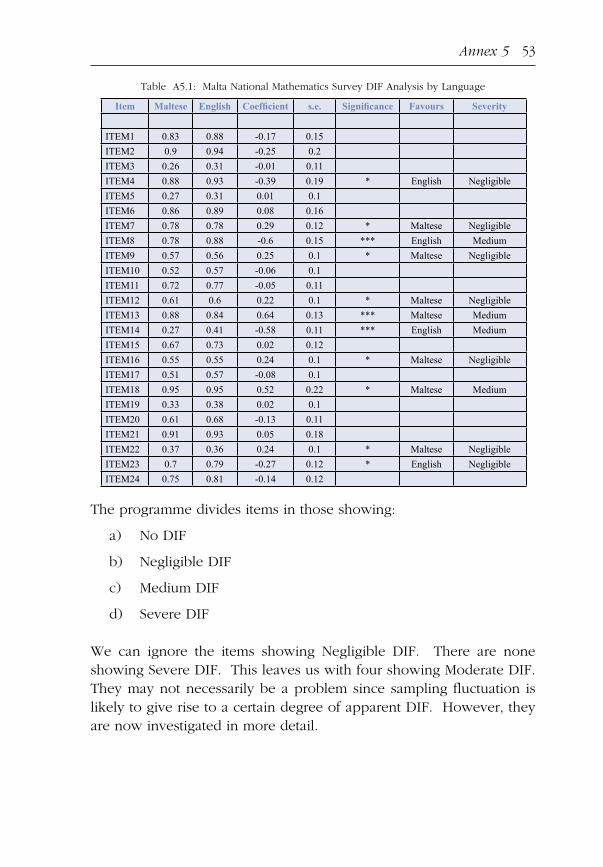
Annex 5 53
Item Maltese English Coefficient s.e. Significance Favours Severity
ITEM1 0.83 0.88 -0.17 0.15
ITEM2 0.9 0.94 -0.25 0.2
ITEM3 0.26 0.31 -0.01 0.11
ITEM4 0.88 0.93 -0.39 0.19 * English Negligible
ITEM5 0.27 0.31 0.01 0.1
ITEM6 0.86 0.89 0.08 0.16
ITEM7 0.78 0.78 0.29 0.12 * Maltese Negligible
ITEM8 0.78 0.88 -0.6 0.15 *** English Medium
ITEM9 0.57 0.56 0.25 0.1 * Maltese Negligible
ITEM10 0.52 0.57 -0.06 0.1
ITEM11 0.72 0.77 -0.05 0.11
ITEM12 0.61 0.6 0.22 0.1 * Maltese Negligible
ITEM13 0.88 0.84 0.64 0.13 *** Maltese Medium
ITEM14 0.27 0.41 -0.58 0.11 *** English Medium
ITEM15 0.67 0.73 0.02 0.12
ITEM16 0.55 0.55 0.24 0.1 * Maltese Negligible
ITEM17 0.51 0.57 -0.08 0.1
ITEM18 0.95 0.95 0.52 0.22 * Maltese Medium
ITEM19 0.33 0.38 0.02 0.1
ITEM20 0.61 0.68 -0.13 0.11
ITEM21 0.91 0.93 0.05 0.18
ITEM22 0.37 0.36 0.24 0.1 * Maltese Negligible
ITEM23 0.7 0.79 -0.27 0.12 * English Negligible
ITEM24 0.75 0.81 -0.14 0.12
Table A5.1: Malta National Mathematics Survey DIF Analysis by Language
The programme divides items in those showing:
a) No DIF
b) Negligible DIF
c) Medium DIF
d) Severe DIF
We can ignore the items showing Negligible DIF. There are none showing Severe DIF. This leaves us with four showing Moderate DIF. They may not necessarily be a problem since sampling fluctuation is likely to give rise to a certain degree of apparent DIF. However, they are now investigated in more detail.

54 Mathematics in Malta
These are:
a) Item 8 (English) – Dominos
b) Item 13 (Maltese) – Money
c) Item 14 (English) – Coins
d) Item 18 (Maltese) – Buttons
If there were something about the wording of the problem that made it more difficult in one language than another, then this would be DIF that needed to be considered.
The language differences were considered in detail. The language difference may be attributed to the fact that most English-speaking students attend private church and private independent schools, while Maltese-speaking pupils are more likely to attend state schools. So the language difference on these 4 items may be due to school rather than language.
However there were some differences in the two languages that may have influenced the pupils’ performance. These are discussed below:
Item 8: DominosThe Maltese equivalent for ‘dots’, which is ‘tikek’, may be much harder for 5-year- olds than the English word, and Maltese-speaking children may have actually been more familiar with the word ‘dots’ (i.e. the word in English). This is why this Item may have favoured English-speaking pupils.
Item 13: MoneyThe word ‘worth’ may have been too hard and English-speaking pupils may have not been familiar with this word. In Maltese the word used is ‘tiswa’ and this may be much easier for this age group. Maltese-speaking pupils may have been familiar with this concept while English-speaking pupils were not familiar with the term ‘worth’.
Item 14: ShoppingIn Maltese ‘coins’ is translated as ‘muniti’ but Maltese children may be

Annex 5 55
more familiar with the English word ‘coins’ so this is why this item may have favoured English- speaking pupils.
Item 18: Counting Buttons A possible explanation here is that although ‘most’ as a concept is featured in the Year 1 syllabus, the actual term itself is introduced later on. The Maltese version of ‘most’, that is ‘l-iktar’, is used more frequently in everyday situations. How Big are the Resulting Differences?To investigate how important such effects are likely to be, we used different techniques to compare the Maltese-speaking and English-speaking pupils. This was done in two ways, first using all 24 items, and then dropping the four items in question. It could be that while the items on their own showed at least medium DIF, when they are taken together, these effects cancel out. Table A5.2 shows the results of this analysis.
N All items SD Items less four SDMaltese 3,804 15.5 4 12.6 3.4English 580 16.4 3.8 13.3 3.2Difference 0.9 0.7
Table A5.2 Effect of Dropping Four Medium Items from Test
There is a small reduction in the difference between Maltese- and English-speakers as a result of removing the four medium DIF items, but that it is rather small, of the order of 0.2 score marks. Therefore, one concludes that, overall, DIF between Maltese- and English-speaking pupils is not a problem in this instance, and that the arrangements for administering the test in the two languages have worked well.
Gender DIF is also investigated, though this is less likely to be important since gender effects have already been investigated in a UK context. For completeness we also investigate gender DIF in Malta. The results are shown in Table A5.3.

56 Mathematics in Malta
Item Males Females Coefficient s.e. Significance Favours Severity
ITEM1 0.83 0.85 -0.05 0.09ITEM2 0.9 0.92 -0.07 0.12ITEM3 0.26 0.27 -0.04 0.08ITEM4 0.87 0.91 -0.28 0.11 ** Girls NegligibleITEM5 0.28 0.27 0.13 0.07ITEM6 0.86 0.87 0.05 0.1ITEM7 0.76 0.81 -0.24 0.08 ** Girls NegligibleITEM8 0.78 0.8 0.01 0.09ITEM9 0.55 0.58 -0.04 0.07ITEM10 0.49 0.56 -0.24 0.06 *** Girls NegligibleITEM11 0.72 0.74 0.03 0.07ITEM12 0.61 0.61 0.05 0.07ITEM13 0.86 0.89 -0.09 0.1ITEM14 0.3 0.27 0.33 0.08 *** Boys NegligibleITEM15 0.67 0.69 0.02 0.08ITEM16 0.53 0.57 -0.11 0.07ITEM17 0.58 0.47 0.57 0.07 *** Boys MediumITEM18 0.94 0.96 -0.22 0.16ITEM19 0.34 0.34 0.09 0.07ITEM20 0.6 0.63 -0.04 0.07ITEM21 0.89 0.94 -0.5 0.12 *** Girls MediumITEM22 0.38 0.37 0.11 0.07ITEM23 0.7 0.73 -0.1 0.07ITEM24 0.75 0.77 0.01 0.08
Table A5.3: Malta National Mathematics Survey DIF Analysis by Gender
Table A5.3 shows the results of DIF analysis where the two groups are boys and girls. Six of the 24 items apparently show DIF, but this is largely because of the relatively large numbers of pupils involved. Of the six items that are identified as statistically significant, five are of negligible impact. The sixth (sorting shapes) exhibits medium DIF towards girls. There seems to be no obvious reason for this, so one can conclude that it is simply a sampling effect.

The pupils in this study ranged from five years four months to six years three months. In this age-group performance is very much dependent on age. Within a certain age bracket, most published tests in the United Kingdom provide a conversion from raw-scores to age-standardised scores with the aim of enabling fair comparisons, at least, between pupils of different ages.
For these reasons, the results of this test were age-standardised on the population in the study. These results may be used in future administrations to groups or individual pupils in a Maltese context. The method used is described in Schagen (1990).
Annex 6
Age-Standardisation
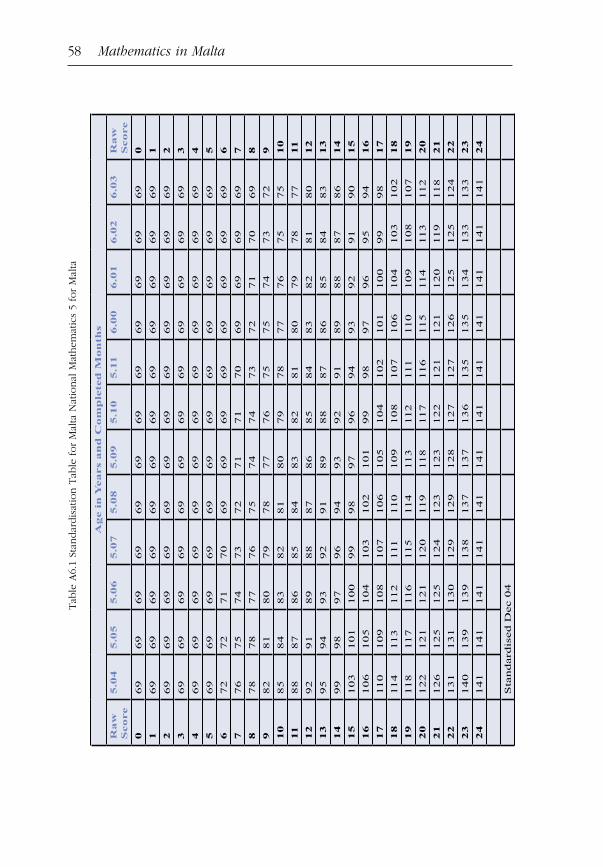
58 Mathematics in Malta
Age i
n Y
ears a
nd
Com
ple
ted
Mon
ths
Raw
S
core
5.0
45.0
55.0
65.0
75.0
85.0
95.1
05.1
16.0
06.0
16.0
26.0
3R
aw
S
core
069
69
69
69
69
69
69
69
69
69
69
69
0
169
69
69
69
69
69
69
69
69
69
69
69
1
269
69
69
69
69
69
69
69
69
69
69
69
2
369
69
69
69
69
69
69
69
69
69
69
69
3
469
69
69
69
69
69
69
69
69
69
69
69
4
569
69
69
69
69
69
69
69
69
69
69
69
5
672
72
71
70
69
69
69
69
69
69
69
69
6
776
75
74
73
72
71
71
70
69
69
69
69
7
878
78
77
76
75
74
74
73
72
71
70
69
8
982
81
80
79
78
77
76
75
75
74
73
72
9
10
85
84
83
82
81
80
79
78
77
76
75
75
10
11
88
87
86
85
84
83
82
81
80
79
78
77
11
12
92
91
89
88
87
86
85
84
83
82
81
80
12
13
95
94
93
92
91
89
88
87
86
85
84
83
13
14
99
98
97
96
94
93
92
91
89
88
87
86
14
15
103
101
100
99
98
97
96
94
93
92
91
90
15
16
106
105
104
103
102
101
99
98
97
96
95
94
16
17
110
109
108
107
106
105
104
102
101
100
99
98
17
18
114
113
112
111
110
109
108
107
106
104
103
102
18
19
118
117
116
115
114
113
112
111
110
109
108
107
19
20
122
121
121
120
119
118
117
116
115
114
113
112
20
21
126
125
125
124
123
123
122
121
121
120
119
118
21
22
131
131
130
129
129
128
127
127
126
125
125
124
22
23
140
139
139
138
137
137
136
135
135
134
133
133
23
24
141
141
141
141
141
141
141
141
141
141
141
141
24
Sta
ndard
ised D
ec 0
4
Tab
le A
6.1
Stan
dar
dis
atio
n T
able
for
Mal
ta N
atio
nal
Mat
hem
atic
s 5
for
Mal
ta

Annex 7
Technical Glossary of Some Statistical Terms
Adjusted Where given characteristics have been included in a statistical model, this means the results have been adjusted for these characteristics. In such a model, schools (and/or pupils) are compared on a like-with-like basis.
CorrelationA correlation is a measure of the strength of the relationship (which is not necessarily causal) between two quantities. Correlations have values in the range +1 to -1. A value of +1 indicates a direct positive relationship, whereas a value of –1 indicates a direct negative relationship, and 0 indicates no relationship all. Correlations based on fewer than 1000 cases should be treated with caution.
Differential Item Functioning (DIF)Differential Item Functioning (DIF) investigates the items in a test, one at a time, for signs of interactions with sample characteristics. It determines if test questions are fair and appropriate for assessing the knowledge of different groups. It is based on the assumption that test takers who have similar knowledge (based on total test scores) should perform in similar ways on individual test questions regardless of their characteristics.
Mean ScoreThis is another term for the average score
Median The median is the mid-point of an ordered set of data. The median divides the observations (in this case, pupils) into two equal parts.
60 Mathematics in Malta
Multilevel ModellingMultilevel modelling is a particular type of statistical model, which takes account of data which is grouped into similar clusters at different levels. In this report individual pupils are grouped within schools. There may be more in common between pupils within the same school than with other schools, and there may be elements of similarity between the school’s test results at different time points. Multilevel modelling allows us to take account of this hierarchical structure of the data and variables at the different levels so as to produce more accurate predictions.
‘Predicted’ or Expected ValueThe predicted value is the value given by a statistical model at any specified point. It represents the performance of a ‘typical’ school or pupil with a given set of characteristics.
Raw ScoreThis is the number of marks obtained by a pupil in a test. A raw score on one test is not comparable to a raw score on another test. This is because the tests may be of different length or difficulty. A raw score does not include any allowance for a pupil’s age.
ResidualA residual is the difference between one school’s (or pupil’s) actual value and the ‘predicted’ value.
ScatterplotWhen relationships between two measures on the same set of objects are to be investigated, it is often useful to plot them on a graph with one measure on the X-axis and the other on the Y-axis. Each object or individual then appears as a point on the graph, and relationships can be seen quite easily.
Standardised ScoreThis is the pupil’s raw score put onto a different scale. Using a common scale means that standardised scores from one test can be compared with standardised scores from another test. Also, an age-allowance is
Annex 7 61
included which means that pupils of different ages can be compared. Statistically, the ‘average’ standardised score is 100. A higher score is above ‘average’ and a score below 100 is below ‘average’. About two thirds of pupils will have standardised scores between 85 and 115. The minimum age-standardised score for the tests used for this evaluation is 69 and the maximum is 141.
Statistical SignificanceThere is a statistically significant difference between two groups in some quantity if the probability of that difference arising by chance, i.e. if there were no real difference, is less than a preset value (usually five percent).

Ascher, C., 3
Betebenner, D., 3Brooks, G., xiv, 17, 20, 30 Browne, W.J., 18 Bryk, A.S., 18Butler, F.A., 3
Caruana Anastasi, C., 2, 6 Clausen-May, T., 4, 6, 7, 9, 13, 14, 33Cope, B., 39Curriculum Department, 2, 7
Del Rosario Basterra, M., 2, 3Department for Education and Skills (DfES), 40Dimech Llanaj, E., 6
Gillies, A., 33Goldstein, H., 18Grech, R., viii, xiv, 6, 17
Hagues, N., 4, 6, 7, 9, 13, 14, 33 Hanson, J., xiv, 17Harvey, A., 39Henderson, B., 5Hutchison, D., viii, xiv, 5, 17, 18, 20, 30
Kalantzis, M., 39Kirkby, D., 1
MacCann, R., 17Machin, S., 17McNally, S., 17
Author Index
Merrell, C., 5 Merttens, R., 1Mifsud, C.L., viii, xiv, 6, 17, 20, 30Milton, J., xiv, 17, 20, 30Morris, J., 4, 6, 7, 9, 13, 14, 33Morrison, J., xiv, 17
Powney, J., 33
Rasbash, J., 18 Raudenbush, S.W., 18Richard, S., viii, xiv Rudd, P., xiv, 17
Schagen, I., 57Shepherd, L., 3Stevens, R., 3Strand, S., 5
Taylor, G., 3Thrupp, M., 5Tymms, P., 5
Vappula, H., 4, 6, 7, 9, 13, 14, 33
Wilson, V., 31 Woodhouse, G., 18
Yang, M., 18
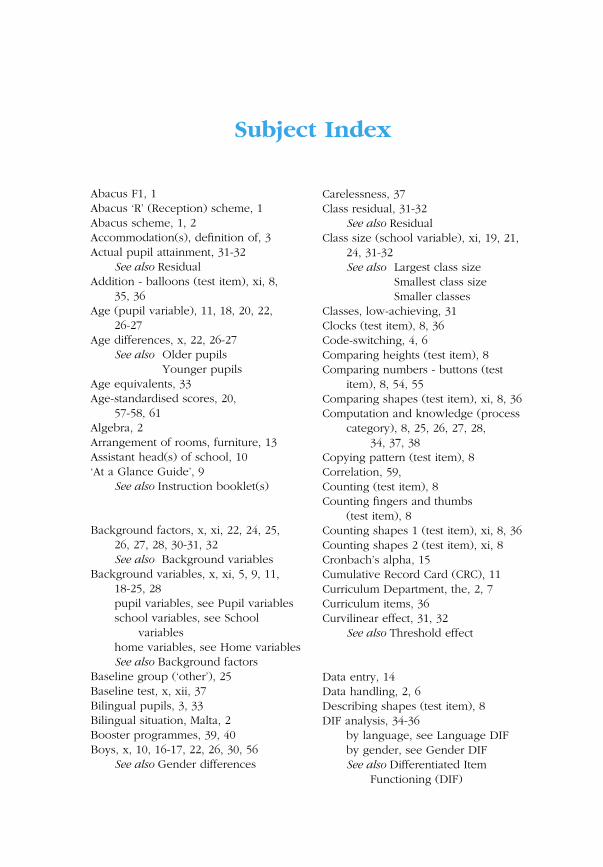
Subject Index
Abacus F1, 1 Abacus ‘R’ (Reception) scheme, 1Abacus scheme, 1, 2 Accommodation(s), definition of, 3Actual pupil attainment, 31-32 See also ResidualAddition - balloons (test item), xi, 8, 35, 36Age (pupil variable), 11, 18, 20, 22, 26-27Age differences, x, 22, 26-27 See also Older pupils Younger pupils Age equivalents, 33Age-standardised scores, 20, 57-58, 61Algebra, 2Arrangement of rooms, furniture, 13Assistant head(s) of school, 10‘At a Glance Guide’, 9 See also Instruction booklet(s)
Background factors, x, xi, 22, 24, 25, 26, 27, 28, 30-31, 32 See also Background variablesBackground variables, x, xi, 5, 9, 11, 18-25, 28 pupil variables, see Pupil variables school variables, see School variables home variables, see Home variables See also Background factorsBaseline group (‘other’), 25 Baseline test, x, xii, 37Bilingual pupils, 3, 33Bilingual situation, Malta, 2Booster programmes, 39, 40Boys, x, 10, 16-17, 22, 26, 30, 56 See also Gender differences
Carelessness, 37Class residual, 31-32 See also ResidualClass size (school variable), xi, 19, 21, 24, 31-32 See also Largest class size Smallest class size Smaller classesClasses, low-achieving, 31Clocks (test item), 8, 36Code-switching, 4, 6Comparing heights (test item), 8Comparing numbers - buttons (test item), 8, 54, 55Comparing shapes (test item), xi, 8, 36 Computation and knowledge (process category), 8, 25, 26, 27, 28, 34, 37, 38Copying pattern (test item), 8Correlation, 59,Counting (test item), 8Counting fingers and thumbs (test item), 8Counting shapes 1 (test item), xi, 8, 36Counting shapes 2 (test item), xi, 8Cronbach’s alpha, 15Cumulative Record Card (CRC), 11Curriculum Department, the, 2, 7Curriculum items, 36Curvilinear effect, 31, 32 See also Threshold effect
Data entry, 14Data handling, 2, 6Describing shapes (test item), 8DIF analysis, 34-36 by language, see Language DIF by gender, see Gender DIF See also Differentiated Item Functioning (DIF)

64 Mathematics in Malta
Differentiated Item Functioning (DIF), 10, 36, 52, 59Disclosure, 13District of school (school variable), 10, 19, 21, 23Domino (test item), 8, 35, 54
Early childhood education, quality programmes, 30, 40Education Division, the, xiv, 2, 7, 39, 40English as a first language, x, 10, 22, 28, 54-55English, official language, 1English, proficiency in, 2, 6English-language learners, 3Exam results, 2Extra practice, 37
Family structure (home variable), 19, 21, 24Father’s education (home variable), xi, 11, 19, 21, 24Father’s occupation (home variable), xi, 11, 20, 22, 24, 25, 30Feedback, 5First language (pupil variable), 3, 10, 11, 18, 20, 21, 22, 27-28 Maltese, see Maltese as a first language English, see English as a first language See also Home languageFive-year-old pupils, 7 See also Pupil age, age group Follow-up studies, xii, 39, 40Formal education, xii, 30, 34, 37Formal test items, xii, 37 See also Test itemsFurther teaching, 37
Gender (pupil variable), 11, 18, 20, 22, 26, 56Gender DIF, 55-56Gender differences, x, 10, 16-17, 20, 22, 30, 55-56
boys, see Boys girls, see Girls Geographical classification, 10, 13, 45Girls, x, 10, 16-17, 20, 22, 26, 30, 56 See also Gender differencesGlossaries, 3Guidelines in Maltese, 9 See also Instruction booklet(s)
Half full (test item), 8Head(s) of schools, xiv, 9, 10, 13Hierarchical structures, 18, 60 See also Multilevel modelling, techniqueHome background, x, xiv, 5, 13 See also Home variablesHome language, xii, 6, 33, 34, 37 See also First languageHome relationship, xi, 24Home variables, 11, 19-20, 21-22, 24-25 family structure, see Family structure (home variable) mother’s education, see Mother’s education (home variable) father’s education, see Father’s education (home variable) mother’s occupation, see Mother’s occupation (home variable) father’s occupation, see Father’s occupation (home variable) See also Home background Homemakers (category of mother’s occupation), xi, 25, 30
Information and Communication Technologies (ICT), xiiInstruction booklet(s), 7, 9 See also ‘At a Glance Guide’ ‘Teacher’s Guide’ Guidelines in Maltese Insufficient experience, 38International comparisons, xi, xiv, 5, 33-36 See also Maltese pupils, alternatively Maltese children UK pupils, alternatively UK children

Subject Index 65
UK counterparts UK-Malta difference
Job market, 30, 40
Key variables, x, 13Kindergarten, 1 See also Pre-school education (pupil variable) Nursery attendance
Lack of understanding, 37Language DIF, 52-55Language differences, 3, 54Language of instruction, 4, 33, 52 See also Teaching languageLanguage of test administration, xiv, 2, 3, 4, 5, 7, 9, 10, 11, 13. 20, 52, 55Language of the textbooks, 33Language of Wider Communication (LWC), 1Largest class size (over 28), 32Learning difficulties, 23Life fulfilment, 40Life skills, 40Literacy attainment, xiv, 39, 40Literacy studies, xii, 6, 30, 40Literacy Unit, the, xiv, 40
Malta and Gozo, x, 29, 37, 40Malta National Literacy Survey 1999, xiv, 17, 20, 30, 39Malta National Literacy Survey 2002, xiv, 17, 40Malta National Mathematics Study, the, x, xii, 2, 3, 4, 9, 12, 30, 33, 35, 37, 40, 52, 53, 56, 58Malta National Mathematics Study, the, aims of, 4Malta National Mathematics Study, the, implications of, xii, 5, 37Malta National Mathematics Study, the, recommendations of, 39Malta situation, 5, 6, 7, 9, 12, 31, 57
Malta value added study, xiv, 17, 39Malta, mean test scores, 33Maltese as a first language, x, 6, 22, 28, 52, 54-55Maltese curriculum, experts, 7Maltese educational system, 7Maltese educational system, stakeholders, 5Maltese language, specialists, 9Maltese national performance, 33, 34, 35, 36Maltese primary schools, 1, 6, 40Maltese pupils, alternatively Maltese children, xi, xii, 7-8, 34, 35, 36, 37Maltese, official language, 1Matching dots (test item), 8Mathematical application (process category), 8, 25, 26, 27, 28, 34, 36, 37, 38Mathematical skills, xii, 1, 12, 30, 38, 40Mathematical terminology, 33, 38Mathematical topics, number, see Number algebra, see Algebra measure, see Measure, Shape and Space shape, see Measure, Shape and Space space, see Measure, Shape and Space data handling, see Data handling problem solving, see Problem solving Mathematics (subject), 2, 17, 30, 39Mathematics 5 manual, 33Mathematics 5 test (nferNelson), x, 4-5, 6, 7-8, 12, 15, 16-17, 33, 37, 39, 52Mathematics 5-14 series, 6, 7, 33, 39-40Mathematics 6 test, 7Mathematics 7 test, 7Mathematics 8 test, 7Mathematics 9 test, 7Mathematics attainment, xii, 5, 6, 7, 9, 11, 12, 37Mathematics education at baseline level, xivMathematics Performance Assessment, Rhode Island, 3
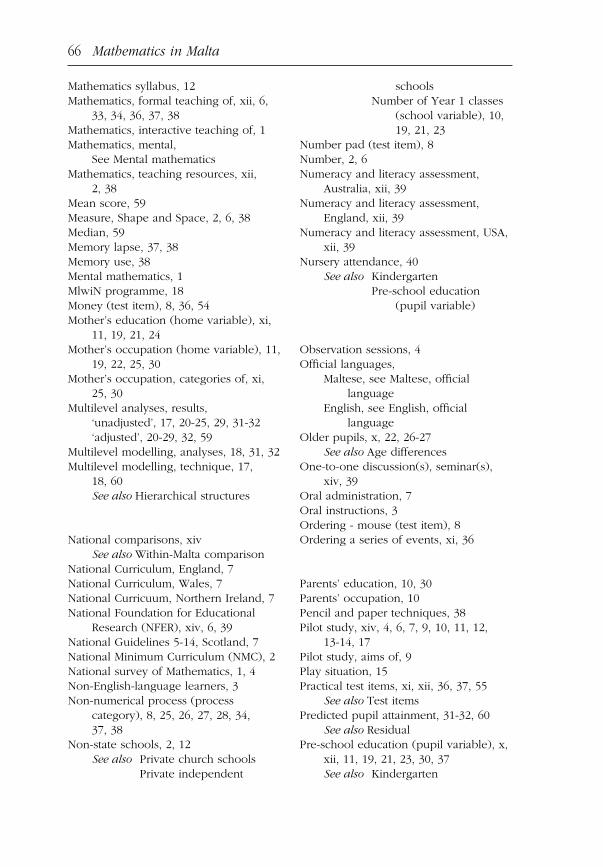
66 Mathematics in Malta
Mathematics syllabus, 12Mathematics, formal teaching of, xii, 6, 33, 34, 36, 37, 38Mathematics, interactive teaching of, 1Mathematics, mental, See Mental mathematicsMathematics, teaching resources, xii, 2, 38Mean score, 59Measure, Shape and Space, 2, 6, 38Median, 59Memory lapse, 37, 38Memory use, 38Mental mathematics, 1MlwiN programme, 18Money (test item), 8, 36, 54Mother’s education (home variable), xi, 11, 19, 21, 24Mother’s occupation (home variable), 11, 19, 22, 25, 30Mother’s occupation, categories of, xi, 25, 30Multilevel analyses, results, ‘unadjusted’, 17, 20-25, 29, 31-32 ‘adjusted’, 20-29, 32, 59Multilevel modelling, analyses, 18, 31, 32Multilevel modelling, technique, 17, 18, 60 See also Hierarchical structures
National comparisons, xiv See also Within-Malta comparison National Curriculum, England, 7National Curriculum, Wales, 7National Curricuum, Northern Ireland, 7National Foundation for Educational Research (NFER), xiv, 6, 39National Guidelines 5-14, Scotland, 7National Minimum Curriculum (NMC), 2National survey of Mathematics, 1, 4Non-English-language learners, 3Non-numerical process (process category), 8, 25, 26, 27, 28, 34, 37, 38Non-state schools, 2, 12 See also Private church schools Private independent
schools Number of Year 1 classes (school variable), 10, 19, 21, 23Number pad (test item), 8Number, 2, 6Numeracy and literacy assessment, Australia, xii, 39Numeracy and literacy assessment, England, xii, 39Numeracy and literacy assessment, USA, xii, 39Nursery attendance, 40 See also Kindergarten Pre-school education (pupil variable)
Observation sessions, 4Official languages, Maltese, see Maltese, official language English, see English, official languageOlder pupils, x, 22, 26-27 See also Age differencesOne-to-one discussion(s), seminar(s), xiv, 39Oral administration, 7 Oral instructions, 3Ordering - mouse (test item), 8Ordering a series of events, xi, 36
Parents’ education, 10, 30Parents’ occupation, 10Pencil and paper techniques, 38Pilot study, xiv, 4, 6, 7, 9, 10, 11, 12, 13-14, 17Pilot study, aims of, 9Play situation, 15Practical test items, xi, xii, 36, 37, 55 See also Test itemsPredicted pupil attainment, 31-32, 60 See also ResidualPre-school education (pupil variable), x, xii, 11, 19, 21, 23, 30, 37 See also Kindergarten
Subject Index 67
age, see Age (pupil variable) gender, see Gender (pupil variable) first language, see First language (pupil variable) special educational needs, see Special Educational Needs (SEN) (pupil variable) pre-school education, see Pre-school education (pupil variable)
Randomised trial, 32Raw score(s), xi, 5, 15, 16-17, 20, 23, 24, 28, 31, 57, 60Raw scores, distribution of, 16Reading the clock, xiReasoning - T-shirts (test item), 8Reception, 33Regional dimension (Maltese districts), xi, 9, 10, 29Repeating patterns (test item), 8Research instruments, other, 10-11 school information sheet, see School information sheet pupil data form(s), see Pupil data form(s) pupil data form, Maltese, see Pupil data form, Maltese pupil data form, English, see Pupil data form, English test administrator’s questionnaire, see Test administrator’s questionnaireResidual, 31-32, 60 See also Actual pupil attainment Predicted pupil attainment Class residual School residualReteaching, 38Revision, 37
Scatterplot, 60School attainment, 24, 30 School effectiveness studies, 18School entry age, 23School information sheet, 10, 11, 13, 44
Nursery attendancePrivate church schools, x, 4, 12, 30-31, 54 See also Non-state schoolsPrivate independent schools, x, 4, 12, 30-31, 54 See also Non-state schoolsProblem solving, 2Process categories by age, 26-27Process categories by country, 34Process categories by first language, 27-28Process categories by gender, 26Process categories by island, 29Process categories by special educational needs, 28Process categories for whole population, 25Process categories, 8, 25-29, 34, 36, 37, 38 understanding number, see Understanding number (process category) non-numerical process, see Non-numerical process (process category) computation and knowledge, see Computation and knowledge (process category) mathematical application, see Mathematical application (process category)Progress scale scores, 7Project team, the, viii, ixPupil age range (4:00-6:03), 8Pupil age, age group, 8, 15, 26, 39, 54, 57 See also Five-year-old pupils Six-year-old pupilsPupil attainment, xi, 5Pupil characteristics, 31Pupil data form(s), 10-11, 13Pupil data form, English, 10-11, 48-49Pupil data form, Maltese, 10-11, 46-47Pupil performance, xi, 12, 17, 20, 24, 30, 37, 54, 57Pupil variables, 5, 9, 11, 18-19, 20-21, 22-23

68 Mathematics in Malta
School residual, 31-32 See also ResidualSchool variables, 5, 9, 10, 18, 19, 21, 23- 24, 31-32 type of school, see Type of school (school variable) district of school, see District of school (school variable) number of Year 1 classes, see Number of Year 1 classes (school variable) class size, see Class size (school variable)Schools, diagnosis of incorrect answers, 37, 38Schools, performance of, 37, 39Schools, remedial measures, 37-38Schools, types of, x state schools, see State schools private church schools, see Private church schools private independent schools, see Private independent schoolsScience (subject), 17, 30, 39Scores, age-standardised score(s), see Age-standardised score(s) progress scale scores, see Progress scale scores raw scores, see Raw scores standardised score(s), see Standardised score(s) test score(s), see Test score(s) SEN, 23, 28 See also Special Educational Needs (pupil variable)Shopping (test item), xi, 8, 36, 54-55Six-year-old pupils, 7 See also Pupil age, age groupSmaller classes, 31Smallest class size (under 10), 32Sorting of objects, 1Sorting shapes (test item), 8, 56Special Educational Needs (pupil variable), x, 11, 18, 21, 23, 28 See also SENStandard deviation, 16Standardisation of test, Maltese, 4-5, 6, 9, 39, 58
Standardised UK test, 5, 6, 15, 33, 52Standardised score(s), 5, 60-61Standardised tests, 3, 6State schools, 2, 4, 9, 12, 30-31, 54Statistical significance, x, xi, 10, 18, 20, 22, 23, 24, 25, 26, 27, 28, 29, 30,32, 36, 37, 56, 61Statistical terms, techniques, correlation, see Correlation Cronbach’s alpha, see Cronbach’s alpha Differentiated Item Functioning (DIF), see Differentiated Item Functioning (DIF) mean score, see Mean score median, see Median multilevel modelling, technique, see Multilevel modelling, technique randomised trial, see Randomised trial residual, see Residual scatterplot, see Scatterplot standard deviation, see Standard deviation statistical significance, see Statistical significanceSubtraction - apples (test item), xi, 8, 36Survey assistant(s), 13
‘Teacher’s book’, 1‘Teacher’s Guide’, 7, 9, 13, 14, 37Teachers, primary school, 11, 12Teaching language, xii, 33, 37, 38 See also Language of instructionTelephone number pad, xi, 36Test administration, 3, 4, 9, 11, 13-14, 39-40, 57Test administrator’s questionnaire, 11, 15, 50Test administrators, 9, 12, 13, 14, 15Test administrators, ratings, 9, 10, 11, 15Test booklets, 14Test items, 7, 8, 9, 34-36, 38, 52, 53, 54, 55, 56 counting fingers and thumbs, see Counting fingers and thumbs (test item)

Subject Index 69
number pad, see Number pad (test item) matching dots, see Matching dots (test item) domino, see Domino (test item) money, see Money (test item) counting, see Counting (test item) comparing numbers - buttons, see Comparing numbers - buttons (test item) counting shapes 1, see Counting shapes 1 (test item) reasoning - T-shirts, see Reasoning - T-shirts (test item) comparing shapes, see Comparing shapes (test item) repeating patterns, see Repeating patterns (test item) copying pattern, see Copying pattern (test item) describing shapes, see Describing shapes (test item) clocks, see Clocks (test item) triangles, see Triangles (test item) weighing, see Weighing (test item) addition - balloons, see Addition - balloons (test item) comparing heights, see Comparing heights (test item) half full, see Half full (test item) ordering - mouse, see Ordering - mouse (test item) shopping, see Shopping (test item) subtraction - apples, see Subtraction - apples (test item) sorting shapes, see Sorting shapes (test item) counting shapes 2, see Counting shapes 2 (test item) See also Formal test items Practical test itemsTest items, statistics, 51Test materials, 13, 15Test preparation, 3Test score(s), x, xi, 13, 24, 33, 37Test scoring, 9, 14Test, internal reliability, 15Test, timespan, 13, 15Testing, date of, 12-13, 20
Threshold effect, See Curvilinear effectTriangles (test item), 8Type of school (school variable), 10, 19, 21, 23
UK context, 5, 33, 55UK counterparts, xi, xii, 34, 37UK educational system, 7UK national performance, 33, 34, 35UK national register of maintained and independent schools, 33UK national sample, 7-8, 33-34UK pupils, alternatively UK children, xi, 33, 35, 36, 37UK-Malta difference, 34-36Understanding number (process category), 8, 25, 26, 27, 28, 34, 36, 37, 38Unfamiliarity with fact, concept or process, 37University of Malta, the, xiv, 39, 40Use of shapes, 1
Value of number, 1
Weighing (test item), 8Within-Malta comparison, 34 See also National comparisons
Year 1 (stage), xii, 1, 31, 37, 39Year 1 classes, 1, 4, 9, 10Year 1 pupils, x, 1, 4, 5, 6, 9, 10, 12, 13, 33Year 1 syllabus, 7, 55Year 2 (stage), 39Year 2 pupils, classes, xiv, 2Year 3 pupils, 39Year 5 (stage), 39-40Year 5 pupils, xivYear 6 (stage), 39Year 6 Maths lessons, 6Year 6 pupils, 2Younger pupils, x, 22, 26-27 See also Age differences

Notes

Notes

Notes

Notes