Mathematical Models Uptake Carbon Monoxide on Hemoglobin ... fileEnvironmentalHealthPerspectives...
13
Environmental Health Perspectives Vol. 41, pp. 277-289, 1981 Mathematical Models of the Uptake of Carbon Monoxide on Hemoglobin at Low Carbon Monoxide Levels by Robert Joumard,* Mireille Chiron,* Robert Vidon,* Michel Maurin* and Jean-Marc Rouziouxt Coburn's differential equation for the uptake of carbon monoxide by hemoglobin and two particular types of solution of this equation were considered and the solutions verified for a group of healthy adults consisting of 73 nonsmoking pedestrians or car passengers exposed to low levels of carbon monoxide as experienced in the city of Lyon. The CO levels at the breathing level and the walking speed of the subjects was continually measured, and the carboxyhemoglobin levels determined at the beginning and the end of each test journey. The values of all the other relevant parameters were also determined. The half-life of carboxyhemoglobin was studied as a function of the degree of activity, the age, the sex and the height of the subjects. Finally a mathematical model was set up to represent a periodic uptake of CO which made it possible to estimate the variations in the carboxyhemoglobin level for any subject during a period of a day or a week without any need to know the initial level. There is normally a very small concentration of CO in the air as a result of natural phenomena, its level being between 0.01 and 1 ppm. Measurements carried out on the Isle of Sark (1), where motor vehicle traffic is prohibited, confirmed that the CO levels were always less than 1 ppm. Measurements made in urban areas in various places in the world over many years have resulted in a considerable quantity of information on CO levels. The exact location where the measurements are made is important, since the highest concentrations are found in the midst of a stream motor vehicles and also inside such vehicles, as confirmed by this investigation. Pedestrians walking along the side- walks are exposed to a lesser concentration of CO than are motorists. People who are obliged to remain at certain critical locations such as toll *Institut de Recherche des Transports, Centre d'Evaluation et de Recherche des Nuisances et de l'Energie, BP 75, 69672 Bron Cedex, France. tFaculte de MWdecine Alexis Carrel, Laboratoire de M&decine Legale et Toxicologie6 Rue Guillaume Poradin, 69008 Lyon, France. October 1981 booths, garages or in traffic jam in enclosed and poorly ventilated streets are exposed to high CO levels due to road traffic (2,3). In order to obtain some idea of the conditions, a person moving within a city will experience CO levels having an average level for the hour in excess of 30 ppm (4). American standards for permissible levels to which the public may be exposed are in fact sometimes exceeded (5,6). Dangerous HbCO Level and Particularly Vulnerable Subjects The effect of carbon monoxide is to reduce oxygenation of the tissues and this effect may be experienced immediately or after a longer period of time. Any increase above the endogenous level can in theory be harmful for a person having an extreme requirement for oxygen, and who cannot compensate a reduced supply of oxygen by physio- logical means. Such subjects consist mainly of people suffering from coronary atheromatic ischaemia or from cerebral vascular deficiencies. Also at risk 277
Transcript of Mathematical Models Uptake Carbon Monoxide on Hemoglobin ... fileEnvironmentalHealthPerspectives...
Environmental Health PerspectivesVol. 41, pp. 277-289, 1981
Mathematical Models of the Uptake ofCarbon Monoxide on Hemoglobin atLow Carbon Monoxide Levelsby Robert Joumard,* Mireille Chiron,* Robert Vidon,*Michel Maurin* and Jean-Marc Rouziouxt
Coburn's differential equation for the uptake of carbon monoxide by hemoglobin and twoparticular types of solution of this equation were considered and the solutions verified for a groupof healthy adults consisting of 73 nonsmoking pedestrians or car passengers exposed to low levelsof carbon monoxide as experienced in the city of Lyon. The CO levels at the breathing level andthe walking speed of the subjects was continually measured, and the carboxyhemoglobin levelsdetermined at the beginning and the end of each test journey. The values of all the other relevantparameters were also determined. The half-life of carboxyhemoglobin was studied as a functionof the degree of activity, the age, the sex and the height of the subjects. Finally a mathematicalmodel was set up to represent a periodic uptake of CO which made it possible to estimate thevariations in the carboxyhemoglobin level for any subject during a period of a day or a weekwithout any need to know the initial level.
There is normally a very small concentration ofCO in the air as a result of natural phenomena, itslevel being between 0.01 and 1 ppm. Measurementscarried out on the Isle of Sark (1), where motorvehicle traffic is prohibited, confirmed that the COlevels were always less than 1 ppm. Measurementsmade in urban areas in various places in the worldover many years have resulted in a considerablequantity of information on CO levels. The exactlocation where the measurements are made isimportant, since the highest concentrations arefound in the midst of a stream motor vehicles andalso inside such vehicles, as confirmed by thisinvestigation. Pedestrians walking along the side-walks are exposed to a lesser concentration of COthan are motorists. People who are obliged toremain at certain critical locations such as toll
*Institut de Recherche des Transports, Centre d'Evaluationet de Recherche des Nuisances et de l'Energie, BP 75, 69672Bron Cedex, France.
tFaculte de MWdecine Alexis Carrel, Laboratoire de M&decineLegale et Toxicologie6 Rue Guillaume Poradin, 69008 Lyon,France.
October 1981
booths, garages or in traffic jam in enclosed andpoorly ventilated streets are exposed to high COlevels due to road traffic (2,3). In order to obtainsome idea of the conditions, a person moving withina city will experience CO levels having an averagelevel for the hour in excess of 30 ppm (4). Americanstandards for permissible levels to which the publicmay be exposed are in fact sometimes exceeded(5,6).
Dangerous HbCO Level andParticularly Vulnerable SubjectsThe effect of carbon monoxide is to reduce
oxygenation of the tissues and this effect may beexperienced immediately or after a longer period oftime. Any increase above the endogenous level canin theory be harmful for a person having anextreme requirement for oxygen, and who cannotcompensate a reduced supply of oxygen by physio-logical means. Such subjects consist mainly ofpeople suffering from coronary atheromatic ischaemiaor from cerebral vascular deficiencies. Also at risk
277
here are people suffering from pernicious anaemiaor from respiratory deficiencies, patients recoveringfrom major surgery or premature babies. Aronowand Isbell (7) refers to a "critical" carboxyhemoglobinlevel of between 0.025 and 0.030 for angina pectorissufferers, such a level giving rise to an appreciablereduction in the time elapsing before the onsetof a painful attack following a given physical ef-fort. The World Health Organization (5) estimatesthat the level for the population exposed to atmo-spheric pollution should not exceed these limits. Inthe case of our sample, the 0.025 level was exceededfor 19 out of the 73 subjects (pedestrians or carpassengers) as a result of their displacement in thecity. However this level can in theory easily beexceeded for subjects remaining in heavily pollutedlocalities. The 0.025 carboxyhemoglobin level wouldresult from an exposure to a 13 ppm CO concentra-tion for more than 24 hr.
Kinetics of the Uptake andElimination of Carbon MonoxideSymbols and units used are summarized in Table
1. We used SI units, but for CO concentration usedppm because it is independent of the temperature.
Differential EquationCoburn et al. (8) have proposed the following
differential equation (1) for carboxyhemoglobin levelas a function of time:
Vb M[02]/PCO (l/DL + P- PH2 0/VA) d[CO]Idt +
[CO] = Pico M[02]/PcO2 + VCO M[02]IPcO2(1)(l/DL + -PH20/VA)
Numerical Values of theDifferent ParametersThe values given below are statistical averages
for subjects in good health and very differentvalues can apply in individual cases, particularly inthe case of subjects suffering from certain diseases.The value ofM can vary from 185 to more than 250,and we assumed a value ofM = 250. [02] was given avalue such that: [02] + [CO] + [X] = 8.92 mmole/liter of blood (200 ml/I.) PB was assumed to have avalue of 99.3 kPa (745 mm Hg) for the town ofLyon, which is at an altitude of 120 m above sealevel.
PcO2 and PH20 were assumed to have values of278
13.3 kPa (100 mm Hg) and 6.3 kPa (47.5 mm Hg),respectively.The value of Pico is directly related to that of C
by the equation: Pico = PB X 10'C. We alsoassumed that y = HbCO = 17 [CO]/[Hb], (or 1000[CO]/1.316 [Hb], if [CO] and [Hb] are in ml/100 mland g/100 ml of blood, respectively), and similarlythat HbX = 17 [X]/[Hb]. The value ofDL is relatedto the height and body surface of the subject andthe value decreases with age. A number of relation-ships have been proposed, and the resulting calcu-lated values may differ 20 to 30% for the samesubject. We used the following relationships (9):
For a man aged 18 or more:DL = 0.329H- 0.000135Y - 0.318For a woman aged 18 or more:
DL = 0.119H- 0.000087Y- 0.015For a child:
DL = 0.117A-0.022The value of Vb for adults depends on the sex of
the subject and we assumed values ofm/13 and m/15for male and female subjects, respectively. Forchildren we assumed values of 0.071m, 0.075m and0.080m for 15, 10 and 1-6 year old subjects respec-tively (10).The value of Vco for a standard male subject has
been given as 5.2 x 10⁷ mmole/sec (0.007 ml/min)(8). We assumed that the value varied with thetotal hemoglobin level Vb[Hb] (for a standard malesubject, Vb = 5 liters and [Hb] = 155 g/l. blood), giving.
Vco = 5.2 x 10- Vb[Hb]/5(155)
The degree of alveolar ventila.tion is proportional(11) to the oxygen consumption VA = 19.63VO2, andthis consumption depends in turn on the powerexpended by the subject (12). Thus we have:
VA = 4.33 x 1072P
Power ExpendedThe power expended is the sum of the basal
metabolism, the muscular power and the specificdynamic action ofthe foods: P = MB + PM + SDA.The basal metabolism is proportional to the surfacearea of the body: MB = Ax.
Pandolf et al. (13) have established an equationgiving the rate of energy expenditure for a subjectwhen standing or when walking at different speedsand when carrying or not carrying a load.
P (SDA = 0) = 1.5m + 2(m + m') (m'/m)2 +
e(m + m') (1.55V2 + 0.35aV)Environmental Health Perspectives
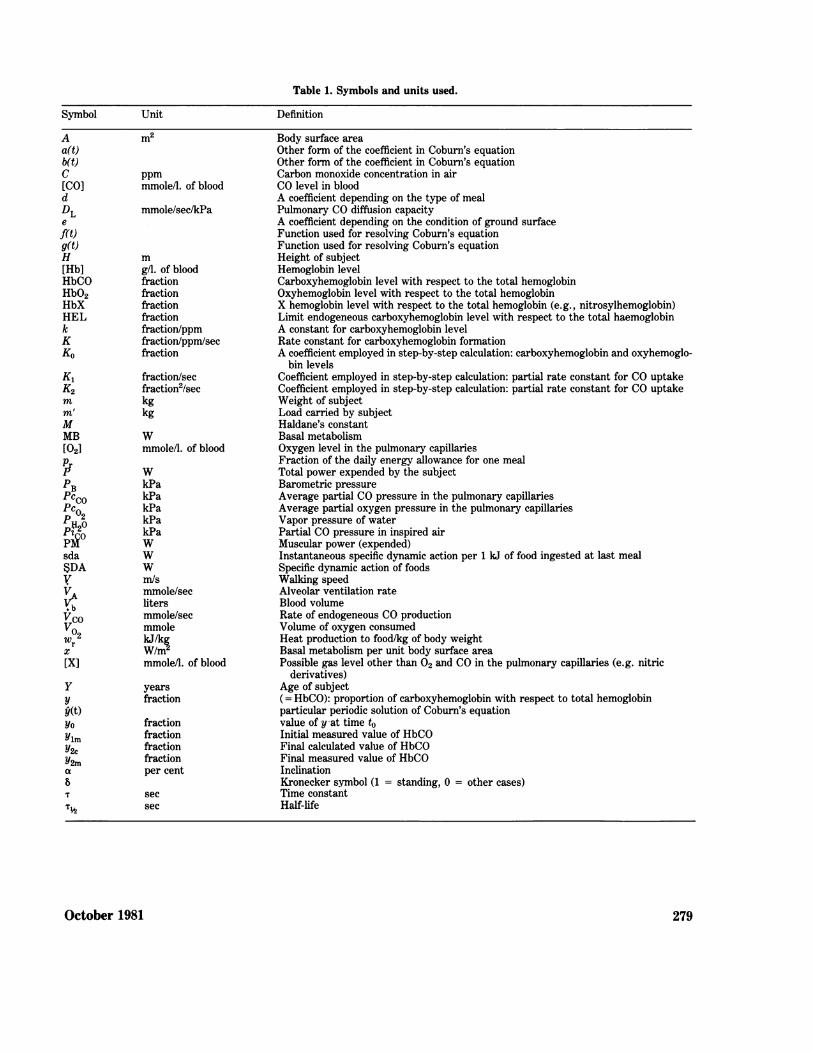
Table 1. Symbols and units used.
Unit
m2
ppm
mmole/l. of blood
mmole/sec/kPa
mgll. of bloodfractionfractionfractionfractionfraction/ppmfraction/ppm/secfraction
fraction/secfraction2/seckgkg
w
mmole/l. of blood
w
kPakPakPakPakPaw
w
w
m/smmole/seclitersmmole/secmmolekJlkkjWlm
mmole/l. of blood
yearsfraction
fractionfractionfractionfractionper cent
secsec
Definition
Body surface areaOther form of the coefficient in Coburn's equationOther form of the coefficient in Coburn's equationCarbon monoxide concentration in airCO level in bloodA coefficient depending on the type of mealPulmonary CO diffusion capacityA coefficient depending on the condition of ground surfaceFunction used for resolving Coburn's equationFunction used for resolving Coburn's equationHeight of subjectHemoglobin levelCarboxyhemoglobin level with respect to the total hemoglobinOxyhemoglobin level with respect to the total hemoglobinX hemoglobin level with respect to the total hemoglobin (e.g., nitrosylhemoglobin)Limit endogeneous carboxyhemoglobin level with respect to the total haemoglobinA constant for carboxyhemoglobin levelRate constant for carboxyhemoglobin formationA coefficient employed in step-by-step calculation: carboxyhemoglobin and oxyhemoglo-
bin levelsCoefficient employed in step-by-step calculation: partial rate constant for CO uptakeCoefficient employed in step-by-step calculation: partial rate constant for CO uptakeWeight of subjectLoad carried by subjectHaldane's constantBasal metabolismOxygen level in the pulmonary capillariesFraction of the daily energy allowance for one mealTotal power expended by the subjectBarometric pressureAverage partial CO pressure in the pulmonary capillariesAverage partial oxygen pressure in the pulmonary capillariesVapor pressure of waterPartial CO pressure in inspired airMuscular power (expended)Instantaneous specific dynamic action per 1 kJ of food ingested at last mealSpecific dynamic action of foodsWalking speedAlveolar ventilation rateBlood volumeRate of endogeneous CO productionVolume of oxygen consumedHeat production to food/kg of body weightBasal metabolism per unit body surface areaPossible gas level other than 02 and CO in the pulmonary capillaries (e.g. nitric
derivatives)Age of subject(= HbCO): proportion of carboxyhemoglobin with respect to total hemoglobinparticular periodic solution of Coburn's equationvalue of y at time toInitial measured value of HbCOFinal calculated value of HbCOFinal measured value of HbCOInclinationKronecker symbol (1 = standing, 0 = other cases)Time constantHalf-life
October 1981
Symbol
Aa(t)b(t)C[CO]dDLef(t)g(t)H[Hb]HbCOHbO2HbXHELkKKo
K1K2mm'MMB[02]pp
PCBcPccoPc0p 2O
sda$DAV.
vcoV0OWrx[XI
yyy(t)YoYimY2cY2ma8
T½
279
The validity of this equation has been verified foryoung male subjects of average height and weight(1.75 m, 78.2 kg). The equation gives the value ofthe total power expended, including the basalmetabolism, but for a zero SDA value.We also considered Scherrer's findings (12); he
stated that the power expenditure amounts to 1.2times the basal metabolism for a standing subjectand to 1.1 times the same basal metabolism whenthe subject is sitting and at rest (and 0.9 timeswhen the subject is asleep). We made use of acoefficient d to allow for these factors. Certainauthors have shown that a female or an overweightsubject expends less energy when at rest as a resultof a smaller proportion of muscular tissue whichaccounts for the difference in metabolism witheffort. The additional expenditure of energy as aresult of performing work PM is the same (14). Ifwe wish to apply the above equation for a subject ofeither sex then the first term (1.5m) in the expres-sion must be a function of the sex. We accordinglyreplaced the first term by Adx, where x is afunction of both age and sex (15) and the secondterm appears only for a stationary, standing sub-ject. We then have:
P(SDA = 0) = Adx + 28(m + m') (m'/m)2 +e (m + m') (1.5V2 + 0.35otV) (1)
The SDA or additional postprandial heat is de-fined as the increase in the rate of energy ex-penditure resulting from the ingestion of a meal,the other conditions being basal. This specificdynamic action varies with time and it rises to amaximum value some 2 hr after the ingestion of ameal (16). Furthermore it should be noted that theSDA value depends on the type of food consumedand it can be assumed, as a first approximation,that it is a function of the energy value of the meal,this latter being a function of the age and sex of thesubject. It is also proportional to the weight of theindividual and we can accordingly refer to Wr, theheat allowance per kilo of weight of the subject. Wetherefore have:
SDA = mwr (Y, sex)pr sda
where sda is the SDA for 1 k.J of food and Pr is thefraction of the daily energy allowance for eachmeal.What is the relative importance of MB, PM and
SDA? With our mixed group of subjects made uphalf of pedestrians and half of car passengers wehad values ofMB = 91, PM = 80 and SDA = 23. Onconsidering a theoretical subject over a period ofone week we obtained average values of MB, PM280
and SDA of 78, 13 and 17, respectively. Thus theSDA is approximately 20. It represents nearly aquarter of the basal metabolism to which we needto add the muscular work rate which can be greaterthan the basal metabolism. Thus the SDA is notnegligible.
Solving the Differential EquationThree methods of solving Coburn's equation are
considered.First Method: Step-by-Step Solution. Let Yi
and Y2 be the carboxyhemoglobin levels at times t1and t2, respectively; if C remains unchanged fromtime t, to time t2 we can write:
Y2 = Yl + (t2- tl){K -[K2/(Ko -y)] }
where
17(8.92 - [X])[Hb]
17
Vb[Hb]
(1)
x
E PcO + MPB X 10-6C + VC]
M { (1/DL) + [(PB - PH20)/A] }
(2)
K2 = ([Hb])= x
[r (8.92 - [X])Pc0MVb I (l/DL) + [(PB PH20)/'A] (3)
The advantage of this method of solving theequation in comparison with the other two methodsconsidered below is that no assumptions need to bemade. The disadvantage is that an error is intro-duced, since no distinction is made between thetangent to the curve and the curve itself at eachpoint.Second Method: Analytical Solution. If we
ignore [CO] (and [X] but it is not strictly necessary)with regard to [02], then the basic equation can beput into the form of a linear first order differentialequation:
(klK)dyldt + y = kC + HEL (4)
This is also the form of equation proposed byChovin and Richalet (17) except for the inclusion of
Environmental Health Perspectives
the HEL term, which was based on the results ofthe experimental investigation by Hanks andFarquhar (18). Peterson and Steward (19) haveverified it for constant concentrations (50 to 200ppm) in industrial conditions on the whole.
If, in addition, C can be regarded as a linearfunction of time (C = at + C1) then the analyticalsolution to the equation becomes:
y = HEL + K{a [t- (klK) +C1} + {Yi - k [a (k/K) - C1] - HEL} erKtk
where
17 x 8.92MPB x 10-6
PC02[Hb]
17PB X 10J-
Vb[Hb] [(1/DL) + [(Pb-PH20)/VA]
HEL =17 x 8.92MVco
Pc0 [Hb] [(lIDL) + [(sb PH2O)/VA]
The time constant k/K is then given by:
8.92MT =
Pco2
Vb ( +
2
DL VA/
The constant k is such that the HbCO level follow-ing an infinite time of exposure to a concentration Cwill be kC + HEL. In particular, the value of k is afunction of the hemoglobin level and is independentof the level of activity. The value of the factor K,which defines the rate of uptake of CO by thehemoglobin, increases with the degree of alveolarventilation and hence with physical activity. Stan-dard values of k and K are listed in Table 3 below.The limit endogeneous carboxyhemoglobin level HELalso increases with the amount of physical activity,but the level remains very low (< 0.002).
This analytical method of solving the equationenables us to determine any HbCO level, if theinitial level is known, provided the variation of C islinear and K remains constant during the intervalconcerned, which are not unreasonable assumptions.Third Method: Periodic Solution. The two
methods of solving the differential equation describedabove depend on a knowledge of the initial HbCO
October 1981
level. This well-established disadvantage can dis-appear if we ignore [CO] with regard to [02] and ifthe parameters K, C and HEL are periodic func-tions of time (k being constant for a given subject).It is possible to find a periodic solution by usingsome analytical properties. For convenience, weuse a more mathematical language in this section. Ifwe rewrite the equation
dyldt + a(t)y = b(t)
with
a(t) = K(t)lk
b(t) = K(t) C(t) + K(t) HEL(t)/k
this is a linear differential equation of the firstorder, whose general solution is
y(t) = yOf(t) + g(T)
with the new functions (20),*t
J(t) = exp { a(u)du) ft0) = 10
andt
g(t) = flt)f b(u)/flu) du g(0) = 00
If a(t) and b(t) are periodic functions of period Tand if a(t) - 0, it may be easily shown that
y(t) = g(t)J(t)/[1 -fit)] + g(t)
is a particular solution which is periodic (of periodT), and every general solution yo f(t) + g(t) con-verges towards y(t) as t is increasing (t - 3 or 4T)(21). Then the y(t) function is a convenient analyti-cal tool to describe the actual variations of thecarboxyhemoglobin level y(t) if the data usedK,C,HEL are periodic functions of time. So wemake the realistic assumption that these data rep-resentative of the activity and CO exposure of aperson are periodic over a period of 24 hr, or,better, over 7 days; moreover, since these varia-tions are known, it is no longer necessary to mea-sure or to choose arbitrarily the initial HbCO levelto describe the variations of the HbCO level in anytime interval. In practice, we obtain the values ofK, HEL and C every 15 min (during 24 hr or 7 days)and calculate the basal integrals f(t), g(t) at thesame moments by numerical methods on a comput-er.
281
For the second and third methods, we ignore[CO] with regard to [02]: the greater the value forHbCO, the more k and HEL are overestimated.We can give [02] its initial value [8.92 - (Hb/17) Yi]or its mean value. Besides, if we do not ignore [X]when we can estimate it, we must replace 8.92 by8.92 - [X].
Experimental VerificationIn order to validate the theoretical analysis, we
carried out tests with a total of 73 subjects whoseages varied from 18 to 60 years and who all statedthat they were nonsmokers. This sample wasdivided into two groups of subjects: one groupconsisting of car passengers who remained seatedin each case for the duration of a test journey withinand around the town, and a second group consistingof pedestrians who walked at a nearly constantspeed in each case in the actual polluted atmos-phere existing in certain streets of the city of Lyon.The pedestrians were accompanied by a technicianwho ensured that the walking speed was main-tained throughout each test journey on makingmeasurements at intervals of 3 to 4 min (the meanspeed is 1.09 m/sec).Samples of blood were taken at the beginning and
end of each journey and these samples analyzed inorder to obtain values of [Hb], Ylm and Y2mn Theanalysis of the blood samples was based on themethod developed by Boudene, Godin and Roussel(22), where the proportions of hemoglobin and COin the blood were determined by means of infrared
20
10.
a
282
spectroscopy. The carbon monoxide levels in theatmosphere were measured on a continuous basisby means of a polarography technique by using aportable Ecolyser and a paper recorder.For each of the subjects we had in addition to our
knowledge of the values of [Hb], Ylm, Y2mn and C,information concerning the sex, weight, height andage of the subject, the load carried by the subject,the time of day when the subject undertook the testjourney and continuous information on the walking
Table 2. Average values of the different parameters for thesample subjects.
Parameter Men Women
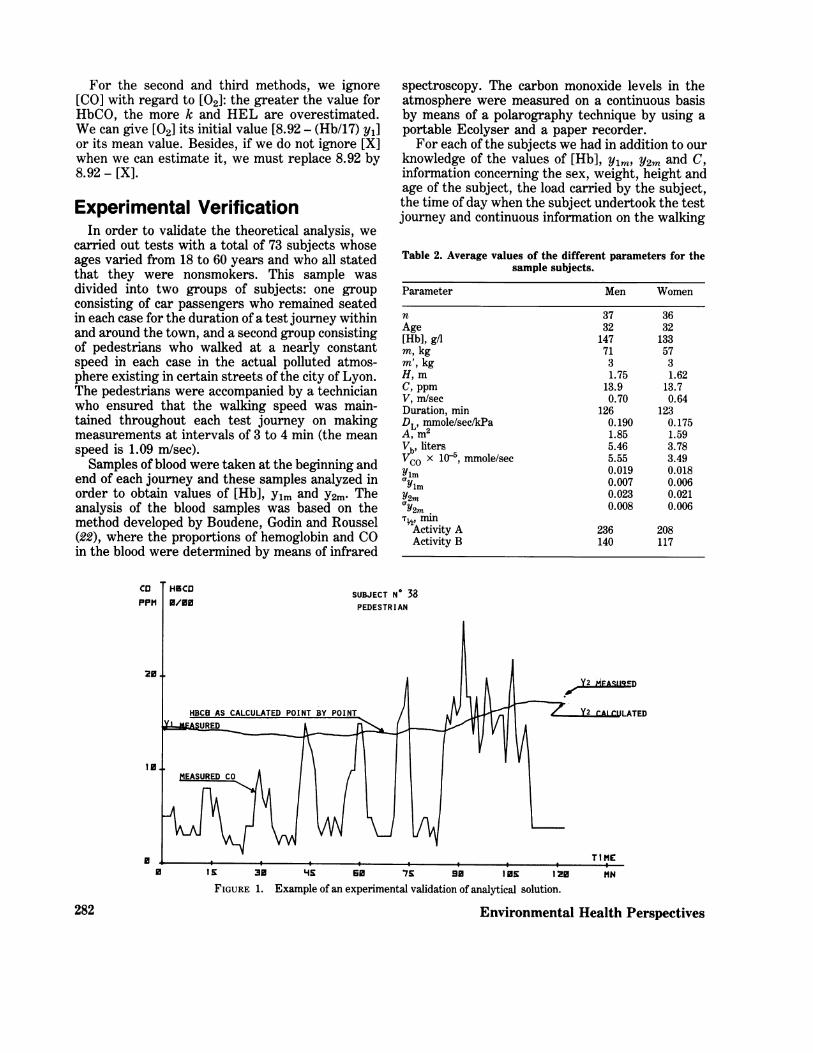
n 37 36Age 32 32[Hb], g/l 147 133m, kg 71 57m', kg 3 3H, m 1.75 1.62C, ppm 13.9 13.7V, m/sec 0.70 0.64Duration, min 126 123DL mmole/sec/kPa 0.190 0.175A, m2 1.85 1.59Vb' liters 5.46 3.78VCO x 10(, mmole/sec 5.55 3.49Yim 0.019 0.018Yim 0.007 0.006Y2m 0.023 0.021cY2m .0.008 0.006
T½,, mmActivity A 236 208Activity B 140 117
SUBJECT N 38PEDESTRIAN
T1MC0 is 30 HEIS s 7S so 105 120 MN
FIGURE 1. Example of an experimental validation of analytical solution.
Environmental Health Perspectives
0--...Dup.
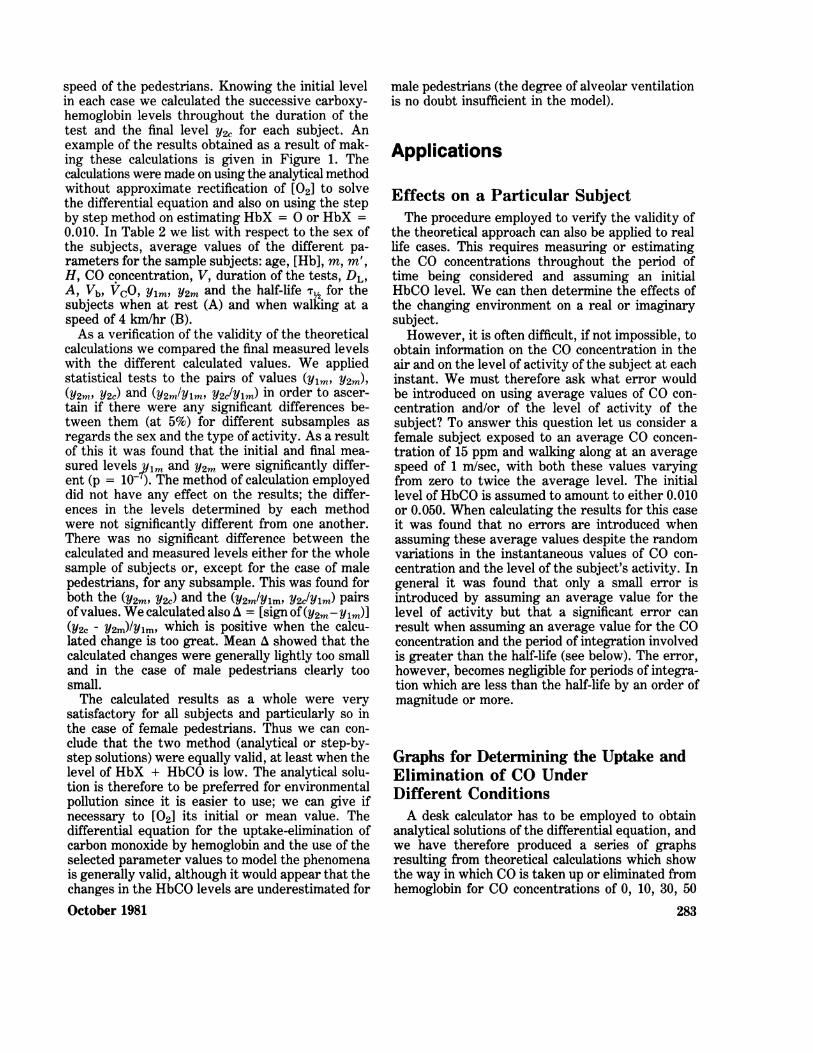
speed of the pedestrians. Knowing the initial levelin each case we calculated the successive carboxy-hemoglobin levels throughout the duration of thetest and the final level Y2c for each subject. Anexample of the results obtained as a result of mak-ing these calculations is given in Figure 1. Thecalculations were made on using the analytical methodwithout approximate rectification of [02] to solvethe differential equation and also on using the stepby step method on estimating HbX = 0 or HbX =0.010. In Table 2 we list with respect to the sex ofthe subjects, average values of the different pa-rameters for the sample subjects: age, [Hb], m, m',H, CO concentration, V, duration of the tests, DL,A, Vb, VcO, Ylm, Y2m and the half-life T½2 for thesubjects when at rest (A) and when walking at aspeed of 4 km/hr (B).As a verification of the validity of the theoretical
calculations we compared the final measured levelswith the different calculated values. We appliedstatistical tests to the pairs of values (Ylm Y2m),(Y2m, Y2c) and (Y2m/Ylm, Y2c/Ylm) in order to ascer-tain if there were any significant differences be-tween them (at 5%) for different subsamples asregards the sex and the type of activity. As a resultof this it was found that the initial and final mea-sured levels7ylm and Y2m were significantly differ-ent (p = 10- ). The method of calculation employeddid not have any effect on the results; the differ-ences in the levels determined by each methodwere not significantly different from one another.There was no significant difference between thecalculated and measured levels either for the wholesample of subjects or, except for the case of malepedestrians, for any subsample. This was found forboth the (Y2m, Y2c) and the (Y2m/Y1rn, Y2c/Ylm) pairsofvalues. We calculated also A = [sign Of(y2m-y1m)](Y2c - Y2m)/Y1mr which is positive when the calcu-lated change is too great. Mean A showed that thecalculated changes were generally lightly too smalland in the case of male pedestrians clearly toosmall.The calculated results as a whole were very
satisfactory for all subjects and particularly so inthe case of female pedestrians. Thus we can con-clude that the two method (analytical or step-by-step solutions) were equally valid, at least when thelevel of HbX + HbCO is low. The analytical solu-tion is therefore to be preferred for environmentalpollution since it is easier to use; we can give ifnecessary to [02] its initial or mean value. Thedifferential equation for the uptake-elimination ofcarbon monoxide by hemoglobin and the use of theselected parameter values to model the phenomenais generally valid, although it would appear that thechanges in the HbCO levels are underestimated forOctober 1981
male pedestrians (the degree of alveolar ventilationis no doubt insufficient in the model).
Applications
Effects on a Particular SubjectThe procedure employed to verify the validity of
the theoretical approach can also be applied to reallife cases. This requires measuring or estimatingthe CO concentrations throughout the period oftime being considered and assuming an initialHbCO level. We can then determine the effects ofthe changing environment on a real or imaginarysubject.
However, it is often difficult, if not impossible, toobtain information on the CO concentration in theair and on the level of activity of the subject at eachinstant. We must therefore ask what error wouldbe introduced on using average values of CO con-centration and/or of the level of activity of thesubject? To answer this question let us consider afemale subject exposed to an average CO concen-tration of 15 ppm and walking along at an averagespeed of 1 m/sec, with both these values varyingfrom zero to twice the average level. The initiallevel of HbCO is assumed to amount to either 0.010or 0.050. When calculating the results for this caseit was found that no errors are introduced whenassuming these average values despite the randomvariations in the instantaneous values of CO con-centration and the level of the subject's activity. Ingeneral it was found that only a small error isintroduced by assuming an average value for thelevel of activity but that a significant error canresult when assuming an average value for the COconcentration and the period of integration involvedis greater than the half-life (see below). The error,however, becomes negligible for periods of integra-tion which are less than the half-life by an order ofmagnitude or more.
Graphs for Determining the Uptake andElimination of CO UnderDifferent ConditionsA desk calculator has to be employed to obtain
analytical solutions of the differential equation, andwe have therefore produced a series of graphsresulting from theoretical calculations which showthe way in which CO is taken up or eliminated fromhemoglobin for CO concentrations of 0, 10, 30, 50
283
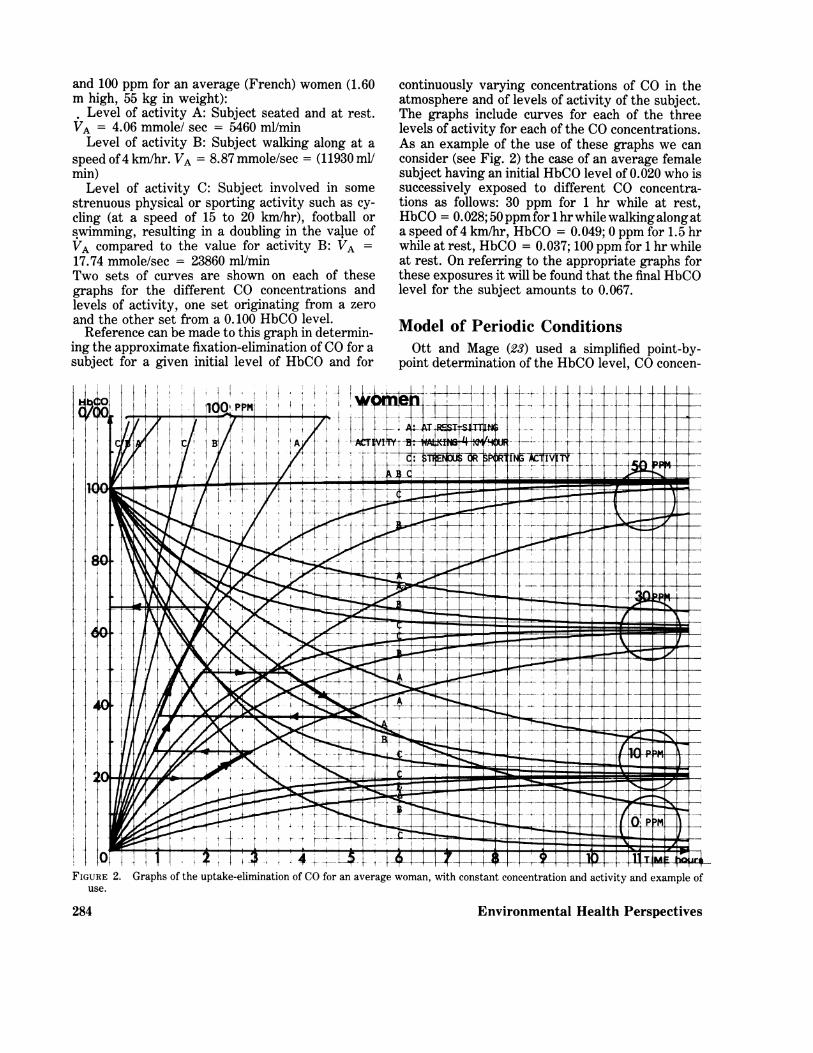
and 100 ppm for an average (French) women (1.60m high, 55 kg in weight):. Level of activity A: Subject seated and at rest.VA = 4.06 mmole/ sec = 5460 ml/minLevel of activity B: Subject walking along at a
speed of 4 km/hr. VA = 8.87 mmole/sec = (11930 ml/min)
Level of activity C: Subject involved in somestrenuous physical or sporting activity such as cy-cling (at a speed of 15 to 20 km/hr), football orswimming, resulting in a doubling in the value ofVA compared to the value for activity B: VA =17.74 mmole/sec = 23860 ml/minTwo sets of curves are shown on each of thesegraphs for the different CO concentrations andlevels of activity, one set originating from a zeroand the other set from a 0.100 HbCO level.Reference can be made to this graph in determin-
ing the approximate fixation-elimination of CO for asubject for a given initial level of HbCO and for
I
RII
IOQT
C/
.,I. T i /_I s, -
1-
I V /Ii
Qy!L
4
ik
VtK ;- --
I~
continuously varying concentrations of CO in theatmosphere and of levels of activity of the subject.The graphs include curves for each of the threelevels of activity for each of the CO concentrations.As an example of the use of these graphs we canconsider (see Fig. 2) the case of an average femalesubject having an initial HbCO level of 0.020 who issuccessively exposed to different CO concentra-tions as follows: 30 ppm for 1 hr while at rest,HbCO = 0.028; 50ppm for 1 hr while walkingalong ata speed of 4 km/hr, HbCO = 0.049; 0 ppm for 1.5 hrwhile at rest, HbCO = 0.037; 100 ppm for 1 hr whileat rest. On referring to the appropriate graphs forthese exposures it will be found that the final HbCOlevel for the subject amounts to 0.067.
Model of Periodic ConditionsOtt and Mage (23) used a simplified point-by-
point determination of the HbCO level, CO concen-
q:IE Ii t
[-- -21-'V
;:IjI
7
/ r4It
It-ILL+-- -- e -
Il-
L 7 1 I 9 11I IIilT
I
Environmental Health Perspectives
FIGURE 2. Graphs of the uptake-elimination of CO for an average woman, with constant concentration and activity and example ofuse.
-I-A&VlVi 0: +-J--+-! 'I
'F 'I 4-. --.
A i I
0
.ri . -T,-" -14--i-+--
I- -
.F-
r
..-
- , - ,-i I-
STII
I11 Iol
-Oklr- I
.t
.41-ft-. -1
t-
I- t--II I-
II .
_.I-I--
ol
--T-e Z-
I
-. I ;-
284
_1
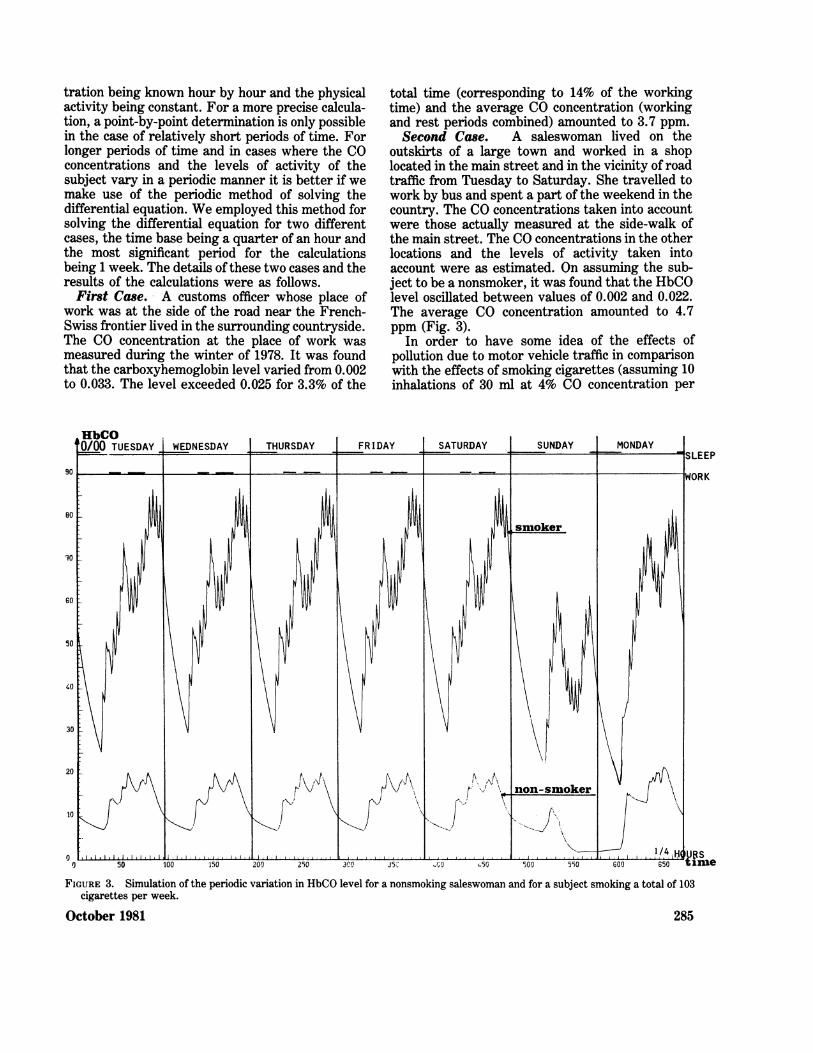
tration being known hour by hour and the physicalactivity being constant. For a more precise calcula-tion, a point-by-point determination is only possiblein the case of relatively short periods of time. Forlonger periods of time and in cases where the COconcentrations and the levels of activity of thesubject vary in a periodic manner it is better if wemake use of the periodic method of solving thedifferential equation. We employed this method forsolving the differential equation for two differentcases, the time base being a quarter of an hour andthe most significant period for the calculationsbeing 1 week. The details ofthese two cases and theresults of the calculations were as follows.First Case. A customs officer whose place of
work was at the side of the road near the French-Swiss frontier lived in the surrounding countryside.The CO concentration at the place of work wasmeasured during the winter of 1978. It was foundthat the carboxyhemoglobin level varied from 0.002to 0.033. The level exceeded 0.025 for 3.3% of the
total time (corresponding to 14% of the workingtime) and the average CO concentration (workingand rest periods combined) amounted to 3.7 ppm.Second Case. A saleswoman lived on the
outskirts of a large town and worked in a shoplocated in the main street and in the vicinity of roadtraffic from Tuesday to Saturday. She travelled towork by bus and spent a part of the weekend in thecountry. The CO concentrations taken into accountwere those actually measured at the side-walk ofthe main street. The CO concentrations in the otherlocations and the levels of activity taken intoaccount were as estimated. On assuming the sub-ject to be a nonsmoker, it was found that the HbCOlevel oscillated between values of 0.002 and 0.022.The average CO concentration amounted to 4.7ppm (Fig. 3).
In order to have some idea of the effects ofpollution due to motor vehicle traffic in comparisonwith the effects of smoking cigarettes (assuming 10inhalations of 30 ml at 4% CO concentration per
FIGURE 3. Simulation of the periodic variation in HbCO level for a nonsmoking saleswoman and for a subject smoking a total of 103cigarettes per week.
October 1981 285
cigarette) we also considered the case of the samesaleswoman smoking at the rate of one cigaretteper hour (103 cigarettes per week). The results ofthe calculations for this case are also shown onFigure 3. The HbCO level oscillated betweenvalues of 0.017 and 0.087, while the average COconcentration due to both the motor vehicle trafficand the smoking amounted to 18.3 ppm. The HbCOlevel exceeded 0.025 for 97% and 0.040 for 79% ofthe time. The levels were in general some fourtimes greater for the cigarette smoking than for thenonsmoking subject.The simulation of periodic variations in carboxy-
hemoglobin levels would appear to be a very usefultechnique in assessing the effects of carbon monox-ide pollution of the atmosphere and of the varia-tions in the actual CO concentration. The calculatedHbCO levels given in the examples above are quiteconsistent with the HbCO levels quoted in theliterature (24-28). It is necessary, however, to haveinformation on the behavior of the subject on aquarter of an hour to quarter of an hour basis, butthere are no problems in making assumptionsconcerning the behavior of a subject over certainvery long periods of time (nighttime and restperiods). It is accordingly possible to determine theeffects of any particular variations in CO concentra-tions during specific periods of time (e.g., duringworking hours or when travelling). Thus this tech-nique has many potential applications.
Half-life of the CarboxyhemoglobinGiven a constant CO concentration in the air, the
time involved for the HbCO level to change fromlevel y1 to level y2 is given by:
At = Tlog y1- HEL - kC
Y2 - HEL - kC
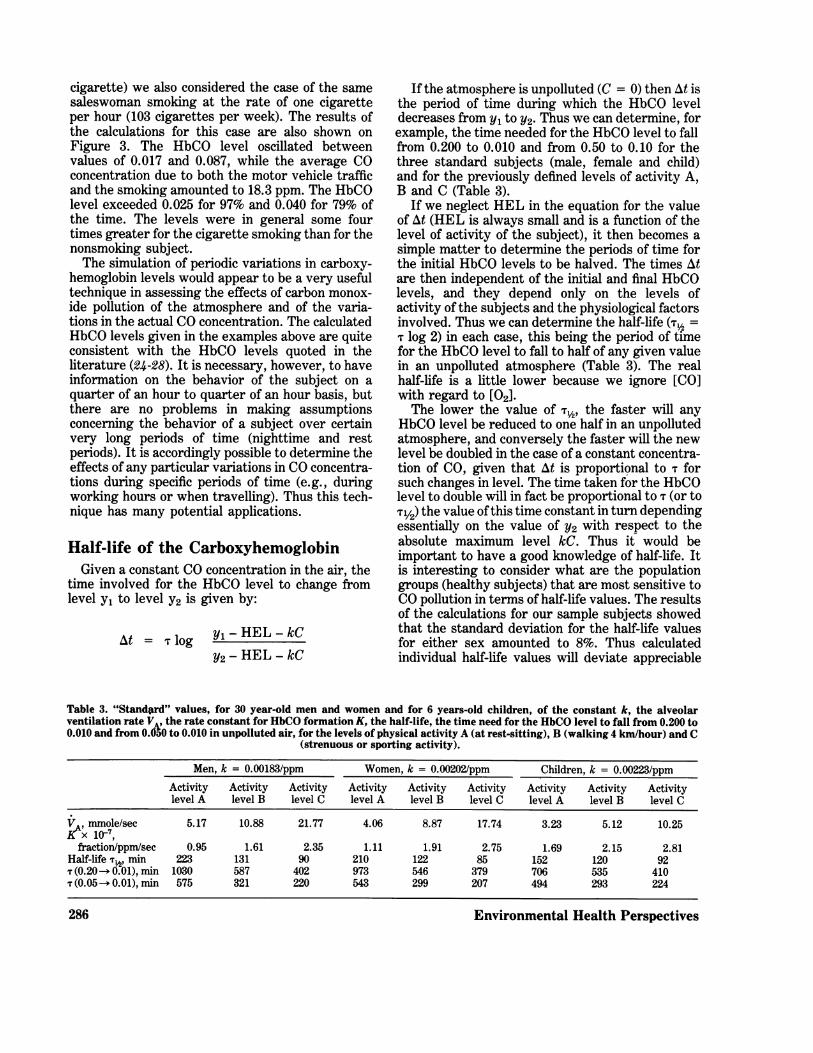
If the atmosphere is unpolluted (C = 0) then At isthe period of time during which the HbCO leveldecreases from Yi to Y2. Thus we can determine, forexample, the time needed for the HbCO level to fallfrom 0.200 to 0.010 and from 0.50 to 0.10 for thethree standard subjects (male, female and child)and for the previously defined levels of activity A,B and C (Table 3).
If we neglect HEL in the equation for the valueof At (HEL is always small and is a function of thelevel of activity of the subject), it then becomes asimple matter to determine the periods of time forthe initial HbCO levels to be halved. The times Atare then independent of the initial and final HbCOlevels, and they depend only on the levels ofactivity of the subjects and the physiological factorsinvolved. Thus we can determine the half-life (T½ =T log 2) in each case, this being the period of timefor the HbCO level to fall to half of any given valuein an unpolluted atmosphere (Table 3). The realhalf-life is a little lower because we ignore [CO]with regard to [02].
The lower the value of T.2, the faster will anyHbCO level be reduced to one half in an unpollutedatmosphere, and conversely the faster will the newlevel be doubled in the case of a constant concentra-tion of CO, given that At is proportional to T forsuch changes in level. The time taken for the HbCOlevel to double will in fact be proportional to T (or toT1/2) the value ofthis time constant in turn dependingessentially on the value of Y2 with respect to theabsolute maximum level kC. Thus it would beimportant to have a good knowledge of half-life. Itis interesting to consider what are the populationgroups (healthy subjects) that are most sensitive toCO pollution in terms of half-life values. The resultsof the calculations for our sample subjects showedthat the standard deviation for the half-life valuesfor either sex amounted to 8%. Thus calculatedindividual half-life values will deviate appreciable
Table 3. "Standprd" values, for 30 year-old men and women and for 6 years-old children, of the constant k, the alveolarventilation rate V the rate constant for HbCO formation K, the half-life, the time need for the HbCO level to fall from 0.200 to0.010 and from 0.o0 to 0.010 in unpolluted air, for the levels of physical activity A (at rest-sitting), B (walking 4 km/hour) and C
(strenuous or sporting activity).
Men, k = 0.00183/ppm Women, k = 0.00202/ppm Children, k = 0.00223/ppmActivity Activity Activity Activity Activity Activity Activity Activity Activitylevel A level B level C level A level B level C level A level B level C
V, mmole/sec 5.17 10.88 21.77 4.06 8.87 17.74 3.23 5.12 10.25K-&x 10-7,
fraction/ppm/sec 0.95 1.61 2.35 1.11 1.91 2.75 1.69 2.15 2.81Half-life Tm,n 223 131 90 210 122 85 152 120 92T(0.20- 0.01), min 1030 587 402 973 546 379 706 535 410T(0.05- 0.01), min 575 321 220 543 299 207 494 293 224
286 Environmental Health Perspectives
10 20 30 40 50 60 70 (YEARS)
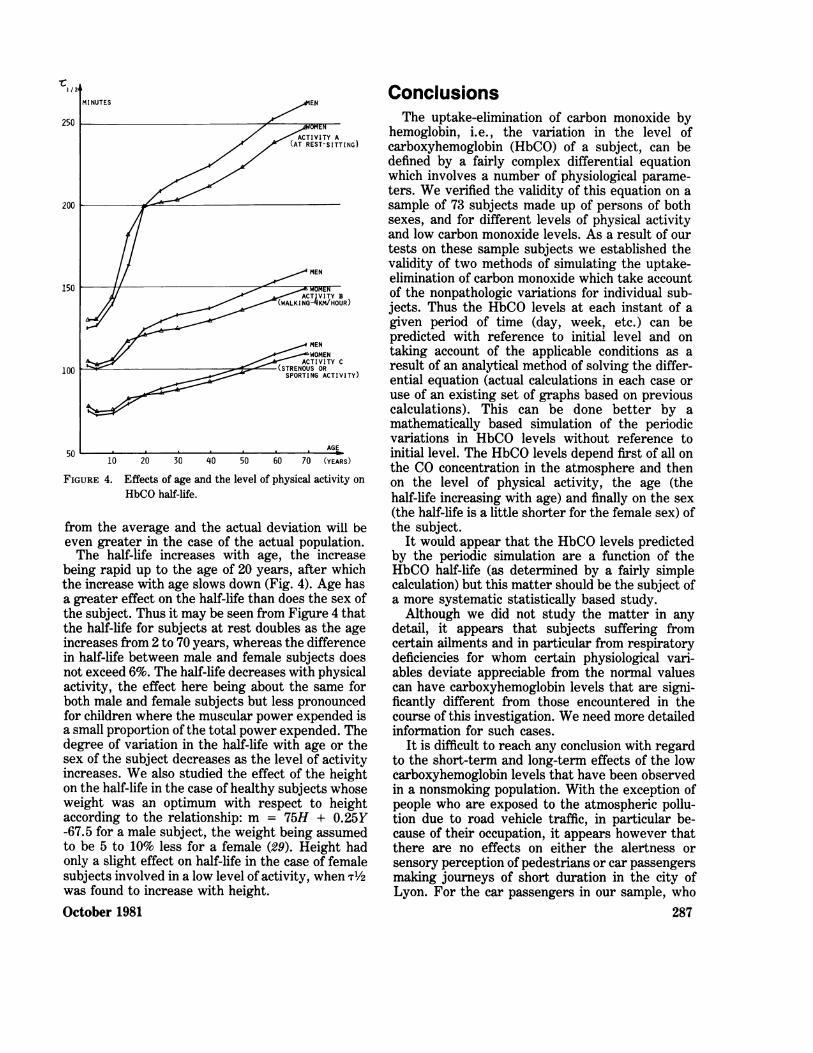
FIGURE 4. Effects of age and the level of physical activity on
HbCO half-life.
from the average and the actual deviation will beeven greater in the case of the actual population.The half-life increases with age, the increase
being rapid up to the age of 20 years, after whichthe increase with age slows down (Fig. 4). Age hasa greater effect on the half-life than does the sex ofthe subject. Thus it may be seen from Figure 4 thatthe half-life for subjects at rest doubles as the ageincreases from 2 to 70 years, whereas the differencein half-life between male and female subjects doesnot exceed 6%. The half-life decreases with physicalactivity, the effect here being about the same forboth male and female subjects but less pronouncedfor children where the muscular power expended isa small proportion of the total power expended. Thedegree of variation in the half-life with age or thesex of the subject decreases as the level of activityincreases. We also studied the effect of the heighton the half-life in the case of healthy subjects whoseweight was an optimum with respect to heightaccording to the relationship: m = 75H + 0.25Y-67.5 for a male subject, the weight being assumedto be 5 to 10% less for a female (29). Height hadonly a slight effect on half-life in the case of femalesubjects involved in a low level of activity, when T/2was found to increase with height.October 1981
ConclusionsThe uptake-elimination of carbon monoxide by
hemoglobin, i.e., the variation in the level ofcarboxyhemoglobin (HbCO) of a subject, can bedefined by a fairly complex differential equationwhich involves a number of physiological parame-ters. We verified the validity of this equation on asample of 73 subjects made up of persons of bothsexes, and for different levels of physical activityand low carbon monoxide levels. As a result of ourtests on these sample subjects we established thevalidity of two methods of simulating the uptake-elimination of carbon monoxide which take accountof the nonpathologic variations for individual sub-jects. Thus the HbCO levels at each instant of agiven period of time (day, week, etc.) can bepredicted with reference to initial level and ontaking account of the applicable conditions as aresult of an analytical method of solving the differ-ential equation (actual calculations in each case oruse of an existing set of graphs based on previouscalculations). This can be done better by amathematically based simulation of the periodicvariations in HbCO levels without reference toinitial level. The HbCO levels depend first of all onthe CO concentration in the atmosphere and thenon the level of physical activity, the age (thehalf-life increasing with age) and finally on the sex(the half-life is a little shorter for the female sex) ofthe subject.
It would appear that the HbCO levels predictedby the periodic simulation are a function of theHbCO half-life (as determined by a fairly simplecalculation) but this matter should be the subject ofa more systematic statistically based study.Although we did not study the matter in any
detail, it appears that subjects suffering fromcertain ailments and in particular from respiratorydeficiencies for whom certain physiological vari-ables deviate appreciable from the normal valuescan have carboxyhemoglobin levels that are signi-ficantly different from those encountered in thecourse of this investigation. We need more detailedinformation for such cases.
It is difficult to reach any conclusion with regardto the short-term and long-term effects of the lowcarboxyhemoglobin levels that have been observedin a nonsmoking population. With the exception ofpeople who are exposed to the atmospheric pollu-tion due to road vehicle traffic, in particular be-cause of their occupation, it appears however thatthere are no effects on either the alertness orsensory perception of pedestrians or car passengersmaking journeys of short duration in the city ofLyon. For the car passengers in our sample, who
287
were the subjects exposed to the highest level ofatmospheric pollution, the HbCO level amounted to0.027, on the average, at the end of their testjourney. The levels of atmospheric pollution nor-mally encountered can however have effects onadvent of arteriosclerotic lesions. Thus such levelsare sufficient to result in the occurrence or anincrease in the seriousness of acute ischaemicincidents in subjects who already suffer from arterydeficiencies.Apart from being useful in establishing carbon
monoxide atmospheric pollution indices, the resultsof this study may also contribute to the establish-ment of the standards for acceptable carbon monox-ide concentrations on the basis of the followingapproach: establish the carboxyhemoglobin levelsthat must not be exceeded for both healthy andpathological subjects; determine the CO concentra-tions that are in agreement with these carboxy-hemoglobin levels by simulating the cyclic varia-tions as well as employing other techniques.
In making this approach, it must be understoodthat there is no such thing as a population ofaverage subjects, but the physiological characteris-tics and hence the sensitivity to the effects ofcarbon monoxide vary in accordance with a Gaussiandistribution about the mean values that we haveconsidered here for healthy subjects. There is alsothe fact that there are pathological variations ofphysiological data for a significant proportion of thepopulation.More generally, the results of the study can be of
use whenever it appears to be necessary to giveproper attention to certain periods of time that arebeing studied out of their normal context (e.g., inthe case of industrial medicine studies periods oftime, other than the concerned with work highcarbon monoxide concentration considered periods,could affect carboxyhemoglobin levels), first for lowpollution, because the precision of certain methodsis a good as low is HbCO level.
This study has been the subject of an internalreport (30).
REFERENCES1. Cole, P. V. Comparative effects of atmospheric pollution
and cigarette smoking on carboxyhaemoglobin levels inman. Nature 255: 699-701 (1975).
2. Burgess, W. M. A., Diberardinis, L., and Speizer F. E.Health effects of exposure to automobile exhaust. 5. Expo-sure of toll booth operators to automobile exhaust. Am. Ind.Hyg. Assoc. J. 38: 184-191 (1977).
3. Kohl, U., and Lob, M. Risques d'oxycarbonisme chroniquedans les garages. Schweiz Med. Wochenschr. 105: 50-56(1975).
4. Delsey, J., Joumard, R., and Vidon R. Pollution par lemonoxyde de carbone a l'interieur d'une voiture en circula-
tion. Poll. Atm. 72: 313-319 (1976).5. World Health Organization. Environmental Health Criteria.
13. Carbon monoxide, WHO, Geneva, 1979.6. Joumard R., and Vidon R. Disperson dans une rue en U. 3:
resultats statistiques des teneurs et trafics. IRT-CERNEreport, Bron, France, 1980.
7. Aronow, W. S., and Isbell, M. W. Carbon monoxide effecton exercise induced angina pectoris. Ann. Int. Med., 79:392-395 (1973).
8. Coburn, R. F., Forster, R. E. and Kane P. B. Considera-tions of the physiological variables that determine the bloodcarboxyhemoglobin concentration in man. J. Clin. Invest.44: 1899-1910 (1965).
9. Giammona, S. T. J., and Daly, W. J. Pulmonary diffusingcapacity in normal children ages 4 to 13. Am. J. Dis. Child.110: 144-151 (1965).
10. Osgood E. E. Pediatrics 15: 000 (1955).11. Galetti, P. M. Les echanges respiratoires pendant
l'exercice musculaire. (Respiratory exchanges duringmuscular effort). Helv. Physiol. Acta 17: 34-61 (1959).
12. Scherrer, J. Physiologie du Travail (Physiology of work),Vol. 1. Masson, Paris, 1967.
13. Pandolf, K. B., Givoni, B., and Goldman, R. F. Predictingenergy expenditure with loads while standing or walkingvery slowly. J. Appl. Physiol., 43: 577-581 (1977).
14. Gehlsen, G. M., and Dill D. B. Comparative performance ofmen and women in grade walking. Human Biol. 49: 381-388(1977).
15. Keele and Neil. Sampson Wright's Applied Physiology, 12thEd., Oxford University Press, 1971.
16. Apfelbaum, M., Bostsarron, J., and Duret F. Physiologie,Vol. 2, Vigot Freres, Paris, 1972.
17. Chovin, P., and Richalet, J. Etude theorique de lacinetique de la fixation du monoxyde de carbone surl'hemoglobine du sang. (Theoretical study of the kinet-ics of the fixation of carbon monoxide on the haemoglobinof the blood.) Ann. Fals. Exp. Chim., 710: 177-194(1973).
18. Hanks, T. G., and Farquhar, R. D. Final report PH22-68-31, National Air Control Administration, Durham,N.C., 1969.
19. Peterson, J. E., and Steward, R. D. Predicting thecarboxyhemoglobin levels resulting from carbon monox-ide exposures. Report CRC APRAC CAPM-3-68MCOW-ENVM-CO-73-1, 1973.
20. Goursat, E. Cours d'Analyse, Vol. 2. Gauthiers, Villars,Paris, 1925.
21. Maurin M. Impact du monoxyde de carbone sur lesindividus. IRT-CERNE report, Bron, France, 1978.
22. Boudene C., Godin, J., and Roussel, A. Methode de dosagede l'oxyde de carbone dans le sang sans extraction separ6eprealable par absorption selective dans l'intrarouge. Arch.Malad. Prof. MMd. Trav. Sec. Soc. (Paris) 34: 449-456 (1973).
23. Ott, W. R., and Mage D. T. Interpreting urban carbonmonoxide concentrations by means of a computerized bloodCOHb model. J. Air Poll. Control Assoc. 28: 11-916 (1978).
24. Grisler, R., Gobbi, A., Giavardi, C., Gaimmi, G., Soverini,R., and Botta, A. Valori di HbCO rilevati in 1000 abitanti diMilano non esposti all'assorbimento professionale di CO.Med. Lav. 66: 34-47 (1975).
25. Kahn, A., Rutledge, R. B., Davis, G. L., Altes, J. A.,Ganter, G. E., Thornton, C. A., and Wallace, N. D.Carboxyhemoglobin sources in the metropolitan St. LouisPopulation. Arch. Environ. Health, 29: 127-135 (1974).
26. Seppanen, A., Kakkinen, V., and Tenkku, M. Effect ofgradually increasing carboxyhaemoglobin saturation on vi-sual perception and psychomotor performance of smokingand non-smoking subjects. Ann. Clin. Res. 9: 314-319 (1977).
288 Environmental Health Perspectives
27. Torbati, I. D., Har-Kedar, I., and Ben-David, A. Car-boxyhaemoglobin levels in blood donors in relation tocigarette smoking and to occupational exposure to carbonmonoxide. Israel J. Med. Sci., 10: 241-244 (1974).
28. Billet, L., Baisier, N., and Naedts, J. P. Effet de la taille,du sexe et de l'Age sur la capacite de diffusion pulmonairede l'adulte normal. (Effects of the height, sex and age on thepulmonary diffusion capacity of a normal adult.) J. Physiol.(Paris), 55: 199 (1963).
29. Lecoq R. Manuel d'Analyses Medicales et de BiologieClinique. (Manual of Medical and Clinical Biology Analyses.)Besancon, France, 1967.
30. Joumard, R., Chiron, M., and Vidon, R. La fixation dumonoxyde de carbone sur l'hemoglobine et ses effets surl'homme. (Uptake of carbon monoxide on haemoglobin andthe effects on man.) IRT-CERNE report, Bron, France,1979.
October 1981 289


![Detecting Carbon Monoxide Poisoning Detecting Carbon ...2].pdf · Detecting Carbon Monoxide Poisoning Detecting Carbon Monoxide Poisoning. ... the patient’s SpO2 when he noticed](https://static.fdocuments.in/doc/165x107/5a78e09b7f8b9a21538eab58/detecting-carbon-monoxide-poisoning-detecting-carbon-2pdfdetecting-carbon.jpg)


![Detecting Carbon Monoxide Poisoning Detecting Carbon ...2].pdf · Detecting Carbon Monoxide Poisoning Detecting Carbon Monoxide Poisoning. Detecting Carbon Monoxide Poisoning C arbon](https://static.fdocuments.in/doc/165x107/5f551747b859172cd56bb119/detecting-carbon-monoxide-poisoning-detecting-carbon-2pdf-detecting-carbon.jpg)