Mathematical Modeling of the Formation of Calcareous Deposits on Cathodically Protected Steel in
11
University of South Carolina Scholar Commons Faculty Publications Chemical Engineering, Department of 1-1-1993 Mathematical Modeling of the Formation of Calcareous Deposits on Cathodically Protected Steel in Seawater J. F. Yan University of South Carolina - Columbia T. V. Nguyen University of South Carolina - Columbia Ralph E. White University of South Carolina - Columbia, [email protected] R. B. Griffin Texas A & M University - College Station Follow this and additional works at: hp://scholarcommons.sc.edu/eche_facpub Part of the Chemical Engineering Commons is Article is brought to you for free and open access by the Chemical Engineering, Department of at Scholar Commons. It has been accepted for inclusion in Faculty Publications by an authorized administrator of Scholar Commons. For more information, please contact [email protected]. Publication Info Journal of the Electrochemical Society, 1993, pages 733-744. © e Electrochemical Society, Inc. 1993. All rights reserved. Except as provided under U.S. copyright law, this work may not be reproduced, resold, distributed, or modified without the express permission of e Electrochemical Society (ECS). e archival version of this work was published in the Journal of the Electrochemical Society. hp://www.electrochem.org/ Publisher's link: hp://dx.doi.org/10.1149/1.2056150 DOI: 10.1149/1.2056150
Transcript of Mathematical Modeling of the Formation of Calcareous Deposits on Cathodically Protected Steel in
University of South CarolinaScholar Commons
Faculty Publications Chemical Engineering, Department of
1-1-1993
Mathematical Modeling of the Formation ofCalcareous Deposits on Cathodically ProtectedSteel in SeawaterJ. F. YanUniversity of South Carolina - Columbia
T. V. NguyenUniversity of South Carolina - Columbia
Ralph E. WhiteUniversity of South Carolina - Columbia, [email protected]
R. B. GriffinTexas A & M University - College Station
Follow this and additional works at: http://scholarcommons.sc.edu/eche_facpubPart of the Chemical Engineering Commons
This Article is brought to you for free and open access by the Chemical Engineering, Department of at Scholar Commons. It has been accepted forinclusion in Faculty Publications by an authorized administrator of Scholar Commons. For more information, please [email protected].
Publication InfoJournal of the Electrochemical Society, 1993, pages 733-744.© The Electrochemical Society, Inc. 1993. All rights reserved. Except as provided under U.S. copyright law, this work may not bereproduced, resold, distributed, or modified without the express permission of The Electrochemical Society (ECS). The archivalversion of this work was published in the Journal of the Electrochemical Society.http://www.electrochem.org/Publisher's link:http://dx.doi.org/10.1149/1.2056150DOI: 10.1149/1.2056150
Mathematical Modeling of the Formation of Calcareous Deposits on Cathodically Protected Steel in Seawater
J.-F. Yan,*" T. V. Nguyen, **'2 and R. E. White** Department of Chemical Engineering, University of South Carolina, Columbia, South Carolina 29208
R. B. Griffin Department of Mechanical Engineering, Texas A&M University, College Station, Texas 77843-1292
ABSTRACT
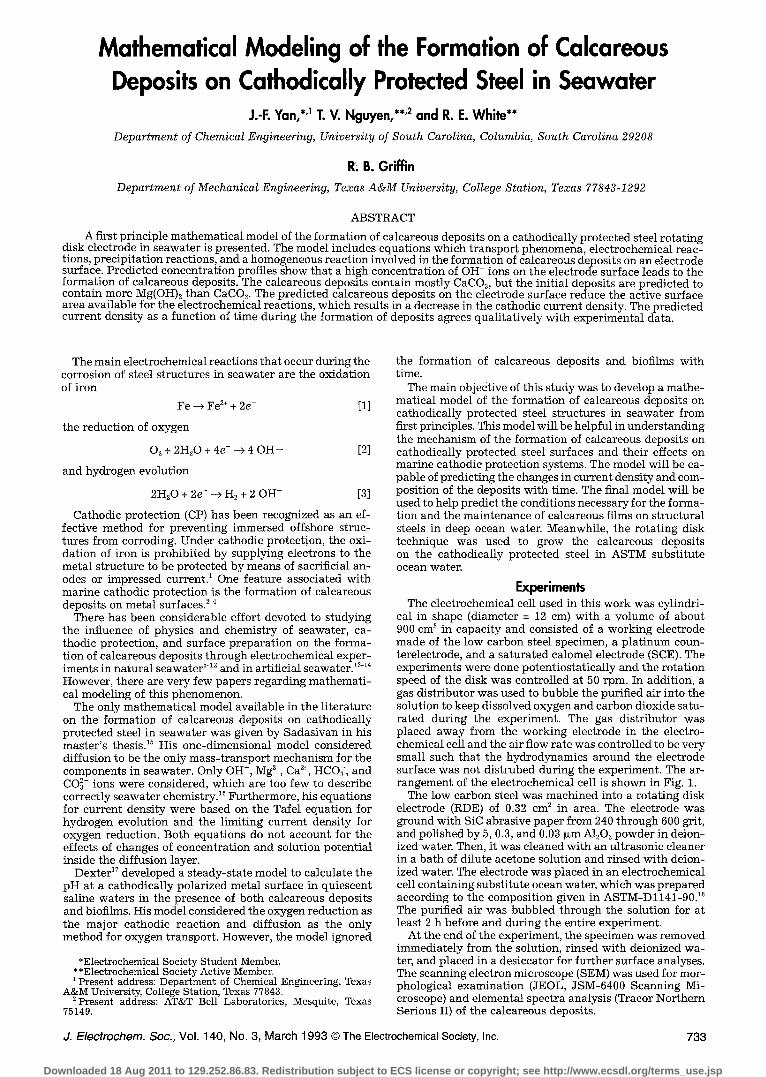
A first principle mathematical model of the formation of calcareous deposits on a cathodically protected steel rotating disk electrode in seawater is presented. The model includes equations which transport phenomena, electrochemical reac- tions, precipitation reactions, and a homogeneous reaction involved in the formation of calcareous deposits on an electrode surface. Predicted concentration profiles show that a high concentration of OH- ions on the electrode surface leads to the formation of calcareous deposits. The calcareous deposits contain mostly CaCO3, but the initial deposits are predicted to contain more Mg(OH)2 than CaCO3. The predicted calcareous deposits on the electrode surface reduce the active surface area available for the electrochemical reactions, which results in a decrease in the cathodic current density. The predicted current density as a function of time during the formation of deposits agrees qualitatively with experimental data.
The main electrochemical reactions that occur during the corrosion of steel structures in seawater are the oxidation of iron
Fe ---> Fe =+ + 2e- [1]
the reduction of oxygen
02 + 2H20 + 4e- --> 4 O H - [2]
and hydrogen evolution
2H20 + 2e- ---> H2 + 2 OH- [3]
Cathodic protection (CP) has been recognized as an ef- fective method for preventing immersed offshore struc- tures from corroding. Under cathodic protection, the oxi- dation of iron is prohibited by supplying electrons to the metal structure to be protected by means of sacrificial an- odes or impressed current. 1 One feature associated with marine cathodic protection is the formation of calcareous deposits on metal surfaces. 2-4
There has been considerable effort devoted to studying the influence of physics and chemistry of seawater, ca- thodic protection, and surface preparation on the forma- tion of calcareous deposits through electrochemical exper- iments in natural seawater 512 and in artificial seawater. 13-~4 However, there are very few papers regarding mathemati- cal modeling of this phenomenon.
The only mathematical model avaflable in the literature on the formation of calcareous deposits on cathodically protected steel in seawater was given by Sadasivan in his master 's thesis. 1~ His one-dimensional model considered diffusion to be the only mass-transport mechanism for the components in seawater. Only OH-, Mg 2+, Ca 2+, HCO~, and CO~- ions were considered, which are too few to describe correctly seawater chemistry? 6 Furthermore, his equations for current density were based on the Tafel equation for hydrogen evolution and the limiting current density for oxygen reduction. Both equations do not account for the effects of changes of concentration and solution potential inside the diffusion layer.
Dexter 17 developed a steady-state model to calculate the pH at a cathodically polarized metal surface in quiescent saline waters in the presence of both calcareous deposits and biofilms. His model considered the oxygen reduction as the major cathodic reaction and diffusion as the only method for oxygen transport. However, the model ignored
*Electrochemical Society Student Member. **Electrochemical Society Active Member. 1 Present address: Department of Chemical Engineering, Texas
A&M University, College Station, Texas 77843. 2 Present address: AT&T Bell Laboratories, Mesquite, Texas
75149.
the formation of calcareous deposits and biofilms with time.
The main objective of this study was to develop a mathe- matical model of the formation of calcareous deposits on cathodically protected steel structures in seawater from first principles. This model will be helpful in understanding the mechanism of the formation of calcareous deposits on cathodically protected steel surfaces and their effects on marine cathodic protection systems. The model will be ca- pable of predicting the changes in current density and com- position of the deposits with time. The final model will be used to help predict the conditions necessary for the forma- tion and the maintenance of calcareous films on structural steels in deep ocean water. Meanwhile, the rotating disk technique was used to grow the calcareous deposits on the cathodically protected steel in ASTM substitute ocean water.
Experiments The electrochemical cell used in this work was cylindri-
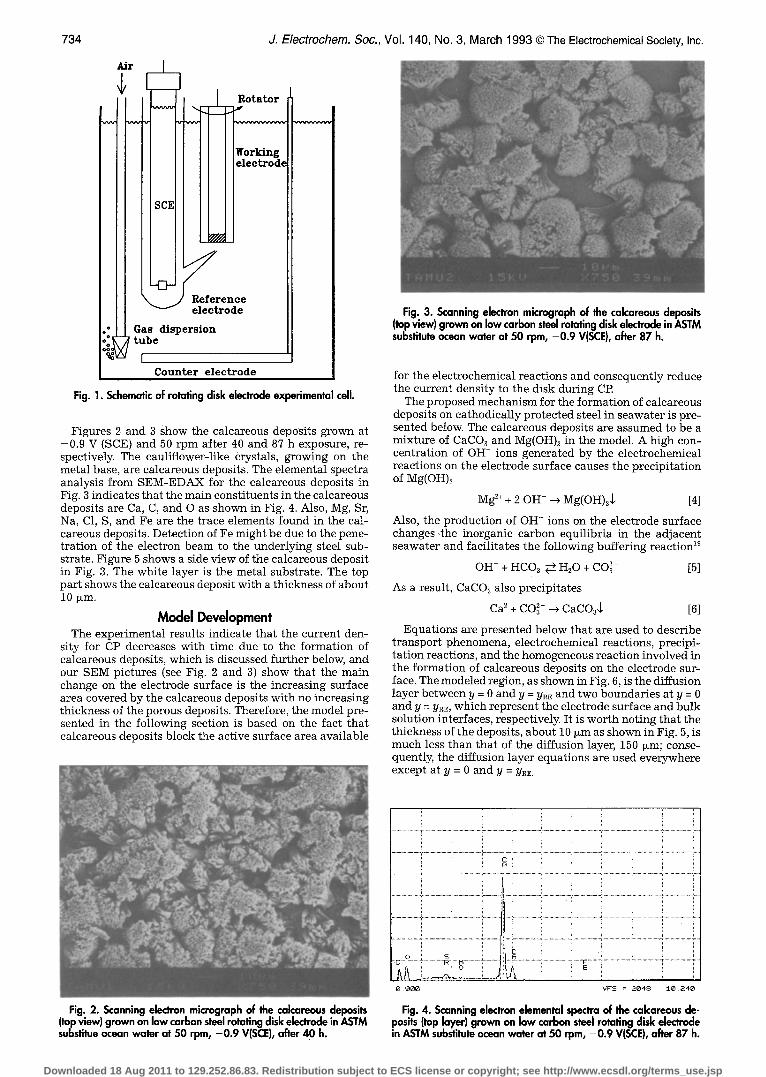
cal in shape (diameter = 12 cm) with a volume of about 900 cm 3 in capacity and consisted of a working electrode made of the low carbon steel specimen, a platinum coun- terelectrode, and a saturated calomel electrode (SCE). The experiments were done potentiostatically and the rotation speed of the disk was controlled at 50 rpm. In addition, a gas distributor was used to bubble the purified air into the solution to keep dissolved oxygen and carbon dioxide satu- rated during the experiment. The gas distributor was placed away from the working electrode in the electro- chemical cell and the air flow rate was controlled to be very small such that the hydrodynamics around the electrode surface was not distrubed during the experiment. The ar- rangement of the electrochemical cell is shown in Fig. 1.
The low carbon steel was machined into a rotating disk electrode (RDE) of 0.32 cm 2 in area. The electrode was ground with SiC abrasive paper from 240 through 600 grit, and polished by 5, 0.3, and 0.03 i~m A1203 powder in deion- ized water. Then, it was cleaned with an ultrasonic cleaner in a bath of dilute acetone solution and rinsed with deion- ized water. The electrode was placed in an electrochemical cell containing substitute ocean water, which was prepared according to the composition given in ASTM-D1141-90.18 The purified air was bubbled through the solution for at least 2 h before and during the entire experiment.
At the end of the experiment, the specimen was removed immediately from the solution, rinsed with deionized wa- ter, and placed in a desiccator for further surface analyses. The scanning electron microscope (SEM) was used for mor- phological examination (JEOL, JSM-6400 Scanning Mi- croscope) and elemental spectra analysis (Tracor Northern Serious II) of the calcareous deposits.
J. Electrochem. Soc., Vol. 140, No. 3, March 1993 �9 The Electrochemical Society, Inc. 733
Downloaded 18 Aug 2011 to 129.252.86.83. Redistribution subject to ECS license or copyright; see http://www.ecsdl.org/terms_use.jsp
734
Air
SCE
< -tD-
Reference v e lectrode
Gas d ispers ion tube
[ Counter electrode
Rotator
Fig. 1. Schematic of rotating disk electrode experimental cell.
J. Electrochem. Soc., Vol. 140, No. 3, March 1993 �9 The Electrochemical Society, Inc.
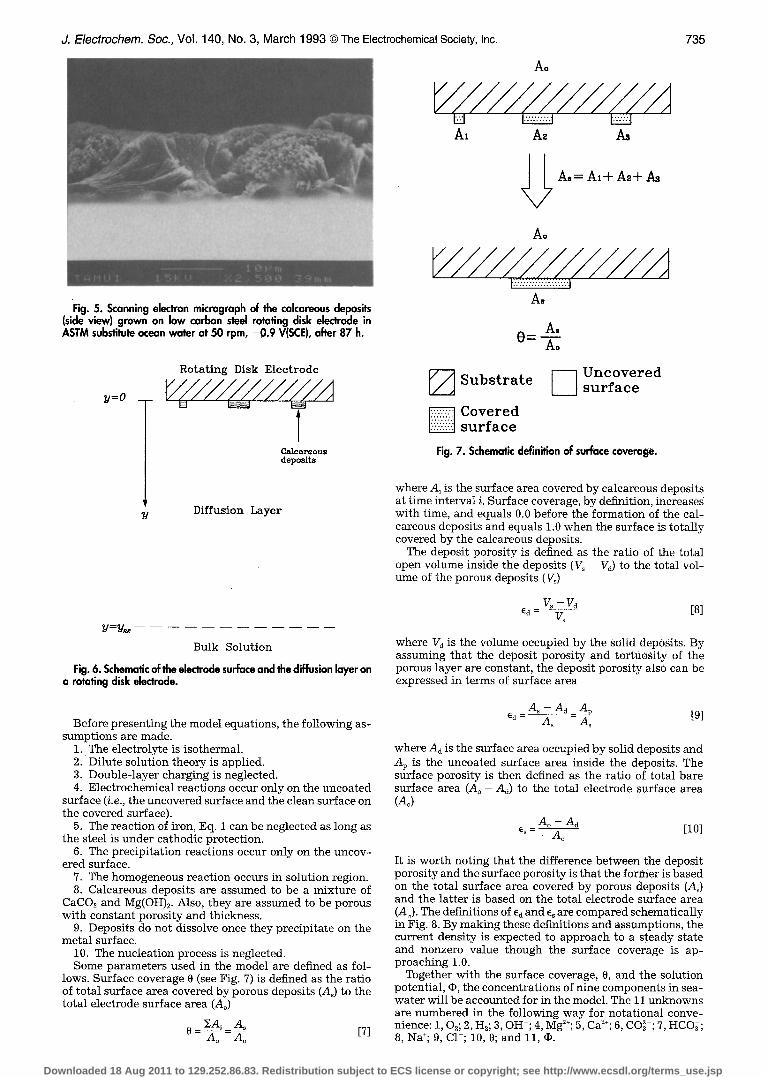
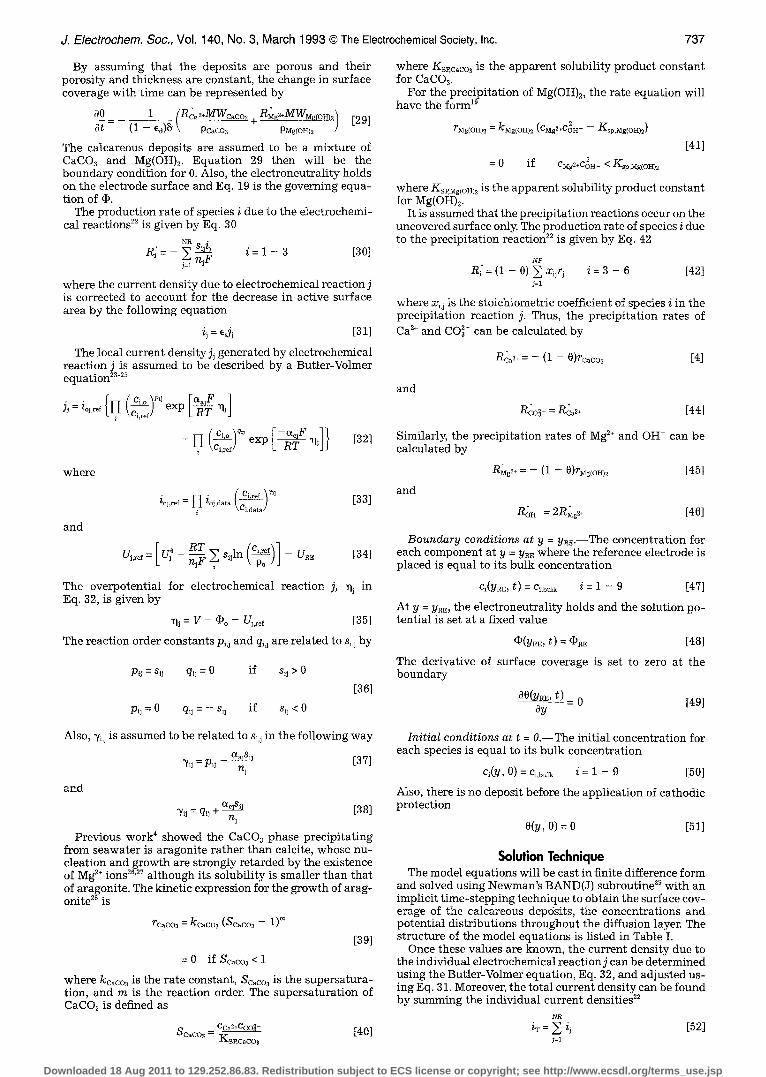
Figures 2 and 3 show the calcareous deposits grown at -0 .9 V (SCE) and 50 rpm after 40 and 87 h exposure, re- spectively. The cauliflower-like Crystals, growing on the metal base, are calcareous deposits. The elemental spectra analysis from SEM-EDAX for the calcareous deposits in Fig: 3 indicates that the main constituents in the calcareous deposits are Ca, C, and O as shown in Fig. 4. Also, Mg, Sr, Na, C1, S, and Fe are the trace elements found in the cal- careous deposits. Detection of Fe might be due to the pene- tration of the electron beam to the underlying steel sub- strate. Figure 5 shows a side view of the calcareous deposit in Fig. 3. The white layer is the metal substrate. The top part shows the calcareous deposit with a thickness of about 10 ~m.
Model Development The experimental results indicate that the current den-
sity for CP decreases with time due to the formation of calcareous deposits, which is discussed further below, and our SEM pictures (see Fig. 2 and 3) show that the main change on the electrode surface is the increasing surface area covered by the calcareous deposits with no increasing thickness of the porous deposits. Therefore, the model pre- sented in the following section is based on the fact that calcareous deposits block the active surface area available
Fig. 3. Scanning electron micrograph of the calcareous deposits (top view) grown on low carbon steel rotating disk electrode in ASTM substitute ocean water at 50 rpm, -0 .9 V(SCE), after 87 h.
for the electrochemical reactions and consequently reduce the current density to the disk during CP.
The proposed mechanism for the formation of calcareous deposits on cathodically protected steel in seawater is pre- sented below. The calcareous deposits are assumed to be a mixture of CaCO3 and Mg(OH)2 in the model. A high con- centration of OH- ions generated by the electrochemical reactions on the electrode surface causes the precipitation of Mg(OH)2
Mg 2+ + 2 OH- ---> Mg(OH)2$ [4]
Also, the production of OH- ions on the electrode surface changes-the inorganic carbon equilibria in the adjacent seawater and facilitates the following buffering reaction ~9
OH- + HC03 ~- H20 + CO~- [5]
As a result, CaCO3 also precipitates
Ca 2 + CO~- --> CaCO~$ [6]
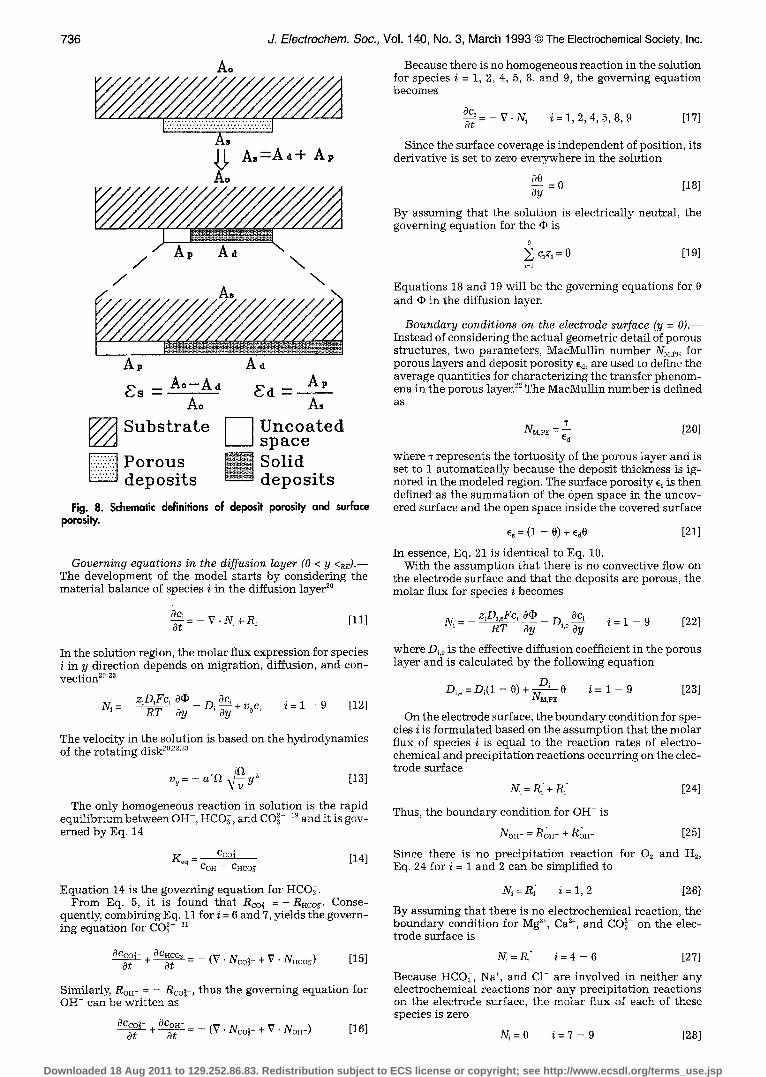
Equations are presented below that are used to describe transport phenomena, electrochemical reactions, precipi- tation reactions, and the homogeneous reaction involved in the formation of calcareous deposits on the electrode sur- face. The modeled region, as shown in Fig. 6, is the diffusion layer between y = 0 and y = YRE and two boundaries at y = 0 and y = YR~, which represent the electrode surface and bulk solution interfaces, respectively. It is worth noting that the thickness of the deposits, about 10 #m as shown in Fig. 5, is much less than that of the diffusion layer, 150 ~m; conse- quently, the diffusion layer equations are used everywhere except at y = 0 and y = YR~
Fig. 2. Scanning electron micrograph of the calcareous deposits (top view) grown on low carbon steel rotating disk eleclrode in ASTM substtue ocean water at 50 rpm, -0 .9 V(SCE), after 40 h.
. . . . . . . . . . . . . . . . . . . . . . . . . . . . . . . . . . . . . . . . . . . . . . . . . . . . . . . . . . . . . . . . . . : . . . . . . . . . . . . . . . . . . . . . . . . . . . . . . . . . . . . . . . . . . . . . . . . . . . . . . . . . . . . . . . . . i . . . . . . . . . . . . . . . . . . . . . . . . : . . . . . . . . . . . . . . . . . . . . . . . . . . . . . . . . . . . . . . . . . . . . . . . . . . . . . . . . . . . . . . . . . . . . . . . . : . . . . .
":C ............... } ................. "F -F'-M ............. ! . . . . . . . . . . . . . . . . . . . . . . . . . . . . . . . . . . . i ....................... ~y-"F "-"''~ ......................... ....................... i ............................
O.GIDO VFS = 2048 10 . : : : ' 4~
Fig. 4. Scanning electron elemental spectra of the calcareous de- posits [top layer) grown on low carbon steel rotating disk electrode in ASTM substitute ocean water at 50 rpm, -0 .9 VISCE), after 87 h.
Downloaded 18 Aug 2011 to 129.252.86.83. Redistribution subject to ECS license or copyright; see http://www.ecsdl.org/terms_use.jsp
J. Electrochem. Soc., Vol. 140, No. 3, March 1993 �9 The Electrochemical Society, Inc.
Ao
H I.--:-...'.'.1 I..-.:.1 AI Az A3
~ A,= At+ A~+ As
735
Fig. 5. Scanning electron micrograph of the calcareous deposits (side view) grown on low carbon steel rotating disk electrode in ASTM substitute ocean water at 50 rpm, -0 .9 V(SCE), after 87 h.
y=O
Rotating Disk Electrode
T Calcareous deposits
Y Diffusion Layer
y=~,~
Bulk Solution
Fig. 6. Schematic of the electrode surface and the diffusion layer on a rotating disk electrode.
Ao
[X.X.X.X.X.X.X.X.X.]
A.
A8 0 - - m Ao
D Substrate [ ~ Uncovered surface
D overed surface
Fig. 7. Schematic definition of surface coverage.
w h e r e A i is the surface area covered by calcareous deposits at time interval i. Surface coverage, by definition, increases with time, and equals 0.0 before the formation of the cal- careous deposits and equals 1.0 when the surface is totally covered by the calcareous deposits.
The deposit porosity is defined as the ratio of the total open volume inside the deposits (V~ - Vd) to the total vol- ume of the porous deposits (V~)
vs - v d [8] rcd - Vs
where Vd is the volume occupied by the solid depOSits. By assuming that the deposit porosity and tortuosity of the porous layer are constant, the deposit porosity also can be expressed in terms of surface area
Before presenting the model equations, the following as- sumptions are made.
1. The electrolyte is isothermal. 2 . Dilute solution theory is applied. 3. Double-layer charging is neglected. 4. Electrochemical reactions occur only on the uncoated
surface (i.e., the uncovered surface and the clean surface on the covered surface).
5. The reaction of iron, Eq. 1 can be neglected as long as the steel is under cathodic protection.
6. The precipitation reactions occur only on the uncov- ered surface.
7. The homogeneous reaction occurs in solution region. 8. Calcareous deposits are assumed to be a mixture of
CaCO3 and Mg(OH)2. Also, they are assumed to be porous with constant porosity and thickness.
9. Deposits do not dissolve once they precipitate on the metal surface.
10. The nucleation process is neglected. Some parameters used in the model are defined as fol-
lows. Surface coverage 0 (see Fig. 7) is defined as the ratio of total surface area covered by porous deposits (As) to the total electrode surface area (Ao)
0 - ~ A i As Ao - Ao [7]
ed A s - A d A~ = ~ - ~ [9]
where Ad is the surface area occupied by solid deposits and Ap is the uncoated surface area inside the deposits. The surface porosity is then defined as the ratio of total bare surface area (,40- Ad) to the total electrode surface area (Ao)
es Ao -- A d = A-o [10]
It is worth noting that the difference between the deposit porosity and the surface porosity is that the former is based on the total surface area covered by porous deposits (As) and the latter is based on the total electrode surface area (A o). The definitions of ed and e~ are compared schematically in Fig. 8. By making these definitions and assumptions, the current density is expected to approach to a steady state and nonzero value though the surface coverage is ap- proaching 1.0.
Together with the surface coverage, 0, and the solution potential, q~, the concentrations of nine components in sea- water will be accounted for in the model. The 11 unknowns are numbered in the following way for notational conve- nience: 1, 02; 2, H2; 3, OH-; 4, Mg2~; 5, Ca2§ 6, CO~-; 7, HCO~; 8, Na§ 9, C1 ; 10, 0; and 11, r
Downloaded 18 Aug 2011 to 129.252.86.83. Redistribution subject to ECS license or copyright; see http://www.ecsdl.org/terms_use.jsp
736 J. Electrochem. Soc., Vol. 140, No. 3, March 1993 �9 The Electrochemical Society, Inc.
A O
I:::::::::"::':::::::::'::::::::::':l
A, A~ A,=Ad+ A~
Y//f . . . . . . . .
A~ Aa \ / \ / \
A~ A. ~s - Ao-A________d ~d - A I,
Ao A,
Substrate I U n c o a t e d space
~ Porous N Sol id depos i t s depos i t s
Fig. 8. Schematic definitions of deposit porosity and surface porosity.
Governing equations in the diffusion layer (0 < y <RE)'-- The development of the model starts by consider ing the mater ia l ba lance of species i in the diffusion layer 2~
0ci_ V . N i + R i [11] Ot
In the solut ion region, the molar flux expression for species i in y di rect ion depends on migrat ion, diffusion, and con- vect ion 20-2~
ziDiFcl OCP - Oci N~ - R T Oy 19~ ~ + vyc~ i = 1 - 9 [12]
The veloci ty in the solut ion is based on the hydrodynamics of the ro ta t ing disk 2~
vy = - a'f~ ~ y 2 [13]
The only homogeneous react ion in solut ion is the rap id equ i l ib r ium be tween OH-, HCO~, and CO~- ~ a n d i t is gov- erned by Eq. 14
Cco~- [14] geq = COH -- CHCO~
Equation 14 is the governing equation for HCOj. From Eq. 5, it is found that Rco~-=- Rgco~. Conse-
quently, combining Eq. 11 for i = 6 and 7, yields the govern- ing equation for CO~- 21
OCco~- + OCHco~ = _ (V "Nco~- + V-NHco~) [15] Ot Ot
Similarly, Roll- = - Rco~ , thus the governing equa t ion for OH- can be wr i t t en as
0Cco~- + 0CoH- -- (V' Nco~- + V. NOH-) [16] Ot 0t
Because there is no homogeneous react ion in the solut ion for species i = 1, 2, 4, 5, 8, and 9, the governing equa t ion becomes
0ci_ V.N~ i = 1 , 2 , 4 , 5 , 8 , 9 [17] Ot
Since the surface coverage is independen t of position, its der ivat ive is set to zero everywhere in the solut ion
00 = 0 [18] 0y
By assuming tha t the solut ion is e lectr ical ly neutral , the governing equa t ion for the ~P is
f clzi = 0 [19] f=l
Equat ions 18 and 19 wil l be the governing equat ions for 0 and �9 in the diffusion layer.
Boundary conditions on the electrode surface (y = O).-- Ins tead of consider ing the actual geometr ic deta i l of porous structures, two parameters , MacMull in number NM.p~ for porous layers and deposi t porosi ty ed, are used to define the average quant i t ies for charac ter iz ing the t ransfer phenom- ena in the porous layer. 22 The MacMull in number is defined a s
'1" N~.pE = -- [20]
E d
where v represents the tor tuos i ty of the porous layer and is set to 1 au tomat ica l ly because the deposi t thickness is ig- nored in the modeled region. The surface porosi ty es is then defined as the summat ion of the Open space in the uncov- ered surface and the open space inside the covered surface
e~ = (1 - 0) + Ca0 [21]
In essence, Eq. 21 is ident ica l to Eq. 10. With the assumpt ion tha t there is no convect ive flow on
the electrode surface and that the deposi ts are porous, the molar flux for species i becomes
Ni = - ziDi'eFC~ aO D- 0c~ i = 1 - 9 [22] RT 0y 1,e 0y
where Di,e is the effective diffusion coefficient in the porous layer and is ca lcula ted by the fo l lowing equa t ion
D i e = D i ( 1 - O ) + Di 0 ' NM,pE i = 1 -- 9 [23]
On the electrode surface, the boundary condi t ion for spe- cies i is fo rmula ted based on the assumpt ion tha t the mola r f lux of species i is equal to the react ion rates of e lectro- chemical and prec ip i ta t ion react ions occurr ing on the elec- t rode surface
Ni = Ri'+ R~' [24]
Thus, the boundary condi t ion for OH- is
NOH- = Roll- + Roll- [25]
Since there is no prec ip i ta t ion react ion for O2 and H2, Eq. 24 for i = 1 and 2 can be simplified to
Ni = R~' i = 1, 2 [26]
By assuming that there is no e lec t rochemica l reaction, the boundary condi t ion for Mg 2+, Ca 2+, and CO~- on the elec- t rode surface is
N~ = R[ i = 4 - 6 [27]
Because HCO3, Na +, and C1- are involved in ne i ther any e lec t rochemical react ions nor any prec ip i ta t ion react ions on the e lect rode surface, the mola r f lux of each of these species is zero
N~= 0 i = 7 - 9 [28]
Downloaded 18 Aug 2011 to 129.252.86.83. Redistribution subject to ECS license or copyright; see http://www.ecsdl.org/terms_use.jsp
d. Electrochem. Soc., Vol. 140, No. 3, March 1993 �9 The Electrochemical Society, Inc. 737
By assuming tha t the deposi ts are porous and the i r porosi ty and thickness are constant , the change in surface coverage wi th t ime can be represented by
00 1 ( Rca2+MWcac~ + RMg~+MWM~(~ [29] ~t - (I --- ed)5 \ PCaCO3 PMg(OH)2 /
The calcareous deposits are assumed to be a mixture of CaCO~ and Mg(OH)~. Equation 29 then will be the boundary condition for 0. Also, the electroneutrality holds on the electrode surface and Eq. 19 is the governing equa- tion of qb.
The production rate of species i due to the electrochemi- cal reactions 2~ is given by Eq. 30
R~'= - ~ ~ i = 1 - 3 [30] niF
where the current densi ty due to e lec t rochemical react ion j is cor rec ted to account for the decrease in act ive surface area by the fo l lowing equa t ion
i i = eji [31]
The local current densi ty Ji genera ted by e lec t rochemical react ion j is assumed to be descr ibed by a But le r -u equa t ion 2~-~
- ( c~--~-~ ) q'~ exp [ ~ T F -qi] } [32] 1~ \ Ci,ref/
where
and
~oj,ref ---- 11 oj,data ~ ] i \~i,data/
[33]
, - n ~ ~ s~,ln (~o~)] - URE [34]
The overpotent ia l for e lec t rochemical react ion j, ~i in Eq. 32, is given by
nj = V - epo - U~,r~ [35]
The react ion order constants Pij and qu are re la ted to s u by
p~j = s~ i q~j = 0 if sij > 0
P~i = 0 q~i = - s~j if s~ i < 0
[36]
where KsP, c~co~ is the apparen t solubi l i ty product constant for CaCO3.
For the prec ip i ta t ion of Mg(OH)2, the ra te equa t ion wil l have the form ~9
2 rMg(OH)2 = ]gMg(OH)2 (CMg2+CoH- -- gsp,Mg(OH)2)
[41]
= 0 if CMg~§ < K~p,Mg(oH)2
where KS~,M~(OH)2 iS the apparen t solubi l i ty p roduc t constant for Mg(OH)2.
It is assumed tha t the prec ip i ta t ion react ions occur on the uncovered surface only. The produc t ion ra te of species i due to the prec ip i ta t ion react ion 22 is given by Eq . 42
N P
Ri"= (1 - 0) ~ x~ir i i = 3 - 6 [42] j=l
where x,,~ is the s to ichiometr ic coefficient of species i in the prec ip i ta t ion react ion j. Thus, the prec ip i ta t ion rates of
Ca 2+ and CO~- can be ca lcula ted by
Rc~2+ = - (1 - 0)rc~co3 [4]
and
Rco~ = Rca2+ [44]
Similarly, the prec ip i ta t ion rates of Mg 2§ and OH- can be calcula ted by
RMg2+ = -- (1 - 0)rMg(OH) 2 [45]
and
n o . = 2R~g2+ [46]
Boundary conditions at y = yRs.--The concen t ra t ion for each component at y = Y~E where the reference electrode is p laced is equal to its bu lk concent ra t ion
ci(YRE , t ) = Ci,bulk i = 1 -- 9 [47]
At y = YRE, the e lec t roneut ra l i ty holds and the solut ion po- ten t ia l is set at a f ixed va lue
qS(yRE, t) = qb~E [48]
The der iva t ive of surface coverage is set to zero at the boundary
O0(y~, t) _ 0 [49] Oy
Also, 7u is assumed to be re la ted to s u in the fo l lowing way
~a]Sij "~ij ---- Pi~ - [37]
nj
and
7ij = qij + ~cisli [38] nj
Previous work 4 showed the CaCO3 phase prec ip i ta t ing f rom seawate r is a ragoni te ra ther than calcite, whose nu- c leat ion and growth are s t rongly re ta rded by the exis tence of Mg 2§ ions 26'27 a l though its solubi l i ty is smal ler than tha t of aragonite . The kinet ic expression for the g rowth of a rag- onite 28 is
rcaco3 = kcaco3 (Scaco~ - 1) ~
[39]
= 0 if Scaco3 < 1
where kc,co3 is the ra te constant, Scaco3 is the supersa tura - tion, and m is the react ion order�9 The supersa tura t ion of CaCO3 is defined as
Sc~co3 = Cc,2+CcoF [40] KsRcaco3
Initial condit ions at t = & - - T h e ini t ia l concent ra t ion for each species is equal to its bulk concent ra t ion
ci(y, 0) = Ci,bulk i = 1 -- 9 [50]
Also, there is no deposi t before the appl ica t ion of ca thodic protec t ion
0(y, 0) = 0 [51]
Solution Technique The model equat ions wil l be cast in finite difference form
and solved using Newman ' s BAND(J) subrout ine 29 wi th an impl ic i t t ime-s tepping techn ique to ob ta in the surface cov- erage of the calcareous deposits, the concent ra t ions and po ten t ia l d is t r ibut ions th roughout the diffusion layer. The s t ructure of the model equat ions is l is ted in Table I.
Once these values are known, the current densi ty due to the ind iv idual e lec t rochemica l react ion j can be de te rmined using the But ler-Volmer equat ion, Eq. 32, and adjus ted us- ing Eq. 31. Moreover, the to ta l current densi ty can be found by summing the ind iv idua l current densit ies 22
/x = ~ i~ [52] j=l
Downloaded 18 Aug 2011 to 129.252.86.83. Redistribution subject to ECS license or copyright; see http://www.ecsdl.org/terms_use.jsp
738 J. Electrochem. Soc., Vol. 140, No. 3, March 1993 �9 The Electrochemical Society, Inc.
Unknown
Table I. Struclure of equations in the model.
Governing Boundary conditions Initial equation at y = 0 at y = y ~ condition
c% Eq. 17 Eq. 26 Eq. 47 Eq. 50 c~ Eq. 17 Eq. 28 Eq. 47 Eq. 50
Co~ Eq. 16 Eq. 25 Eq. 47 Eq. 50 c~:~ Eq. 17 Eq. 27 Eq. 47 Eq. 50 Cc~§ Eq. 17 Eq. 27 Eq. 47 Eq. 50 Cco~- Eq. 15 Eq. 27 Eq. 47 Eq. 50 C~co~ Eq. 14 Eq. 28 Eq. 47 Eq. 50 cN~+ Eq. 17 Eq. 28 Eq. 47 Eq. 50 Cc~- Eq. 17 Eq. 28 Eq. 47 Eq. 50 0 Eq. 18 Eq. 29 Eq. 49 Eq. 51 r Eq. 19 Eq. 19 Eq. 48 --
Also, t he m o l a r r a t io of t he CaCO~ to Mg(OH)~ in t he de- p o s i t s a t t ime t c a n b e c o m p u t e d in a s t r a i g h t f o r w a r d w a y
E Rca2+,t XCa2+/Mg2+t - t [53]
E RMg2+,t
a n d s i m i l a r l y t he Mg(OH)2 to CaCO~
E RMg2§ t
x~§ t - - - [54]
E Rca2+t t
Parameters T h e p a r a m e t e r s u s e d in t h e m o d e l a re l i s t ed in Tab les I I -
VI. All of t he p a r a m e t e r s a re r e p o r t e d a t 25~ a n d 35 p p t s a l i n i t y o r h a v e b e e n a d j u s t e d to 25~ a n d 35 p p t sal ini ty. A n e x a m p l e u s i n g the p a r a m e t e r s in Tab les I I - V I w a s s t u d - ied a n d is d i s c u s s e d in t h e n e x t sec t ion .
Results and Discussion Concentration profiles.--The c o n c e n t r a t i o n prof i les of
s o m e c o m p o n e n t s in s e a w a t e r a re r evea l ed in Fig. 9-12. The
Table II. Fixed physical parameters in the model.
Parameter Value
T 298.15 K 12 50 rpm Po 1.0234 • 10 -3 a Kg/cm ~
9.33 • 10 -3 ~ cm2/s 1.0
e~ 0.25 ~ y ~ 1.5 • 10 -3 c cm $ 1,0 X 10 -3 d cm
V 0.0 e V r 0.9 ~ V [IRE 0.242 ~ V
Table IV. Parameters of reaction constants and apparent solubility product constants of the precipitation reactions in the model.
b The residual current density is about 25 % of the current density at 0.5 h.
Calculated from the equation in Ref. 33 and multiplied by 1.5. d Observed from the deposit morphology in Fig. 5.
Chosen arbitrarily to set V - r = --0.9 V(SCE). Taken from Ref. 20.
Table III. Kinetic and thermodynamicporameters for the electrochemical reactions in the model.
Reaction r ~j n~ io3,d~ (A/cm 2) Uj ~ (V)
O 2 + 2 H 2 0 + 4 e - ~ 4 O H - 1 1 2 1.24 • 10 -24 ~ 2H20 + 2e- ~ 2OH- + H2 3 1 4 2.0 • 10 -n c -0.828 b
For oxygen reduction co~,d,t, = 1.0 • 10 -7 ~ mol/cm 3, COH ,d~ = 1.0 • 10- 0, mol/cm ~.
For hydrogen evolution, cs~,a~t, = 6.7 • 10 -~~ ~ mol/cm ~, Co~ ,~t~ = 1.6 • 10 -~ ~ mol/cm ~.
Taken from Ref. 22. Taken from Ref. 20. Chosen arbitrarily.
Reaction K,p k m
1 6.96 • 10 -~3 a mol2/cm 6 1.13 • 10 - n b mol/cm 2 . s 1.7 b 2 4.50 • 10 -~~ ~ mol3/cm ~ 3.7 • ]07 d cmT/mol 2 . s - -
Reaction 1: Ca 2§ + CO~- --> CaCO3. Reaction 2: Mg 2+ + 2OH- ---> Mg(OH)2.
Taken from Ref. 34. b Taken from Ref. 16. ~ Taken from Ref. 4. d Taken from Ref. 19 and adjusted to 25~
Table V. Parameters of the homogeneous reaction in the model.
Reaction Keq
HCO~ + OH- ~_ CO~- + H20 8.40 x l0 T ~ cm3/mol
Predicted from the equations in Ref. 35.
Table VI. Diffusion coefficients and concentrations of the components in seawater in the model.
Species Di (cm2/s) • 105 Ci,~f (mol/cm 3)
02 2.90 a 2.11 X i0 -8 b H 2 6.28 ~ 6.7 X 10 -11 b
OH- 5.27 d 1.6 X 10 -9 e Mg 2+ 0.705 d 5.45 • 10 -3 f Ca 2+ 0.793 d 1.05 x 10 -3 CO~- 0.955 d 2.07 • 10 -v "
HCO~ 1.19 d 1.54 x 10 -6 e Na + 1.34 d 4.30 • 10 -4 g C1- 2.03 d 5.58 • 10 - ~
a Chosen arbitrarily. b Predicted from the equations in Ref. 32. c Taken from Ref. 19 and ajdusted to 25~ d Taken from Ref. 36. ~ Predicted from the equations in Ref. 35. Taken from Ref. 35.
g Taken from Ref. 35 and adjusted to meet the electroneutrality.
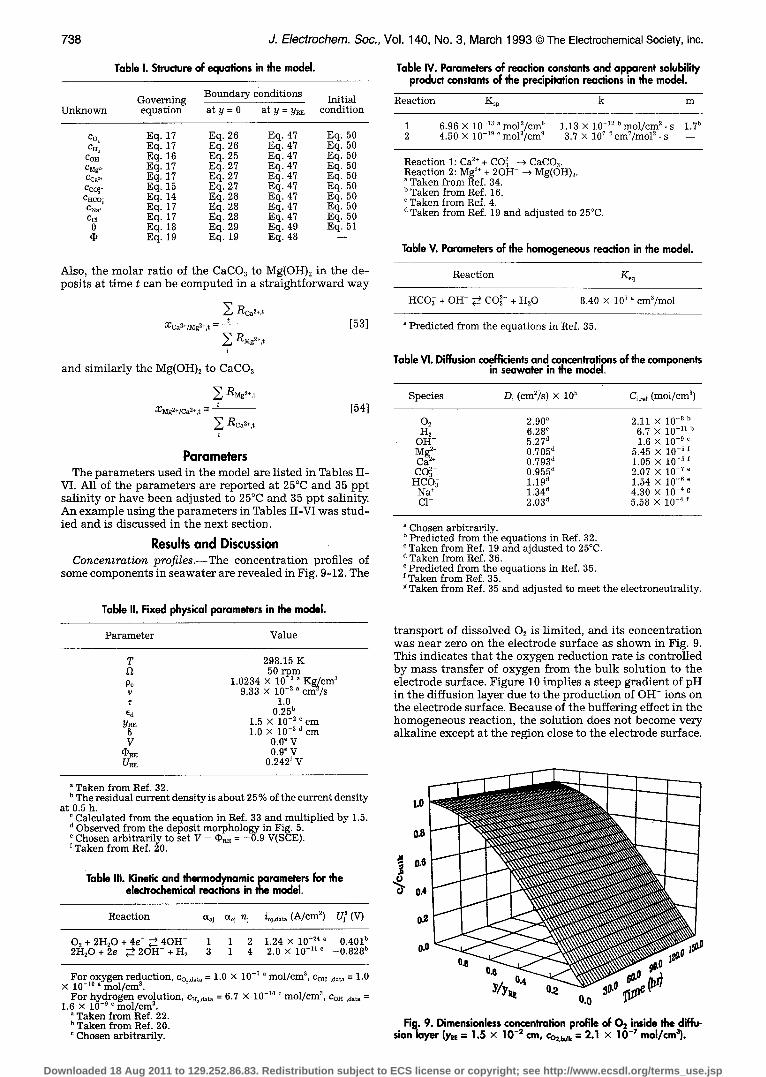
t r a n s p o r t of d i s so lved 02 is l imi ted , a n d i ts c o n c e n t r a t i o n w a s n e a r ze ro on the e l ec t rode s u r f a c e as s h o w n in Fig. 9. Th i s i n d i c a t e s t h a t t he o x y g e n r e d u c t i o n r a t e is c o n t r o l l e d b y m a s s t r a n s f e r of o x y g e n f r o m t h e b u l k s o l u t i o n to t he e l ec t rode sur face . F i g u r e 10 imp l i e s a s t eep g r a d i e n t of p H in the d i f fu s ion l a y e r due to t he p r o d u c t i o n of O H - ions on the e l ec t rode su r face . B e c a u s e of t he b u f f e r i n g effect in t he h o m o g e n e o u s r eac t ion , t h e s o l u t i o n does n o t b e c o m e v e r y a lka l i ne e x c e p t a t t h e r e g i o n close to t h e e l ec t rode su r face .
a Taken from Ref. 32. [
1.0
0.4
0
so. ,ri~e ~"
Fig. 9. Dimensionless concentration profile of 02 inside the diffu- 2 7 3 sion layer (Y~E = 1.5 X 10- cm, Co2,~,1k = 2.1 • 10- mol/cm ).
Downloaded 18 Aug 2011 to 129.252.86.83. Redistribution subject to ECS license or copyright; see http://www.ecsdl.org/terms_use.jsp

J. Electrochem. Soc., Vol. 140, No. 3, March 1993 �9 The Electrochemical Society, Inc. 739
70.0 1.0
60.0 ""-'--
~0.0 o.8
,o.0 ~ ~.._._ ~ 0.6
~ ~ o . O - ~ ~ "~ o.4
,o.o o.e
' , , 0 , o.o
~ / y ~ "~ t o ~" ~I c.o "
Fig. 10. Dimensionless concentration profile of OH- ions inside the diffusion layer (Y~E = 1.5 • 10 -~ cm, Co.-,~.~ = 1.6 • 10 -e mol/cm3).
LO05 " ~
1.000
0.995
o.9~
u~ 0.0 ~" TIIP
Fig. 11. Dimensionless concentration profile of Ca 2§ ions inside the diffusion layer (YRE = 1.5 • 10 -2 cm, CCa2§ = 1.1 • 10 -s moI/cm3).
Figure 11 shows that the concentration of Ca 2§ ions does not change much inside the diffusion layer. While, Fig. 12
Fig. 13. Dimensionless concentration profile of 02 inside the diffu- sion layer during the initial stage (YRE = 1.5 • 10 -2 cm, Co2,bulk = 2.1 • 10 -7 mol/cm~).
120.0
100.0
80.0
0.0 O
l.O
Fig. 14. Dimensionless concentration profile of OH ions inside the diffusion laye_r during the initial stage (YRE = 1.5 • 10 -2 cm, Cos-,b.lk = 1.6 • 10 -9 mol/cm3).
shows that the concentration of CO~- ions increases about ~ ~ ~ _ _ _ _ _ eight times on the electrode surface due to the homoge- neous reaction. Thus, the supersaturation of CaCO3 is con- 1.003 trolled by the concentration of CO~- ions, and the higher / - - - - - - - - ~ concentration of CO~- ions on the electrode surface is the driving force for the formation of CaC03. 1.002
Yl " 08 "41 08 ,'~e - ~ 4,0 IYRZ " 1.0 L
~.0 Fig. 15. Dimensionless concentration profile of Mg 2+ ions inside the diffusion layer during the initial stage (YRE = 1.5 • 10 -2 cm, c~2~ b,lk
O. 0 } f O0 O = 5.5 • 10 -s mol/cm3). - - '
y/y~ Figures 13-15 show the concentration profiles of some 1.0
Fig. 12. Dimensionless concentration profile of CO~- ions inside the diffusion layer (YRE ---- 1.5 • 10 -2 cm, Cco~-,~lk = 1.8 • 10 -7 mol/cm3).
components in seawater in the diffusion layer within I s. The rapid drop in oxygen concentration, as shown in Fig. 13, indicates that oxygen is depleted after 1 s. As a result, the concentration of OH- ions also drops very
Downloaded 18 Aug 2011 to 129.252.86.83. Redistribution subject to ECS license or copyright; see http://www.ecsdl.org/terms_use.jsp
740
~ O 0 . O �9 , , . . , , . , ,
1 6 0 . 0 o
~ laO.0
o "~ ao.o
L~ 40.0
0.0 O.O
J. Electrochem. Soc., Vol. 140, No. 3, March 1993 �9 The Electrochemical Society, Inc.
�9 ~ �9 , 3 . 0
V-r V(SCE)
,,,, <_ 2.0 r 2 •
L)
, 1.0 ~
30.0 60.0 90.0 120.0 150.0
T i m e ( h r )
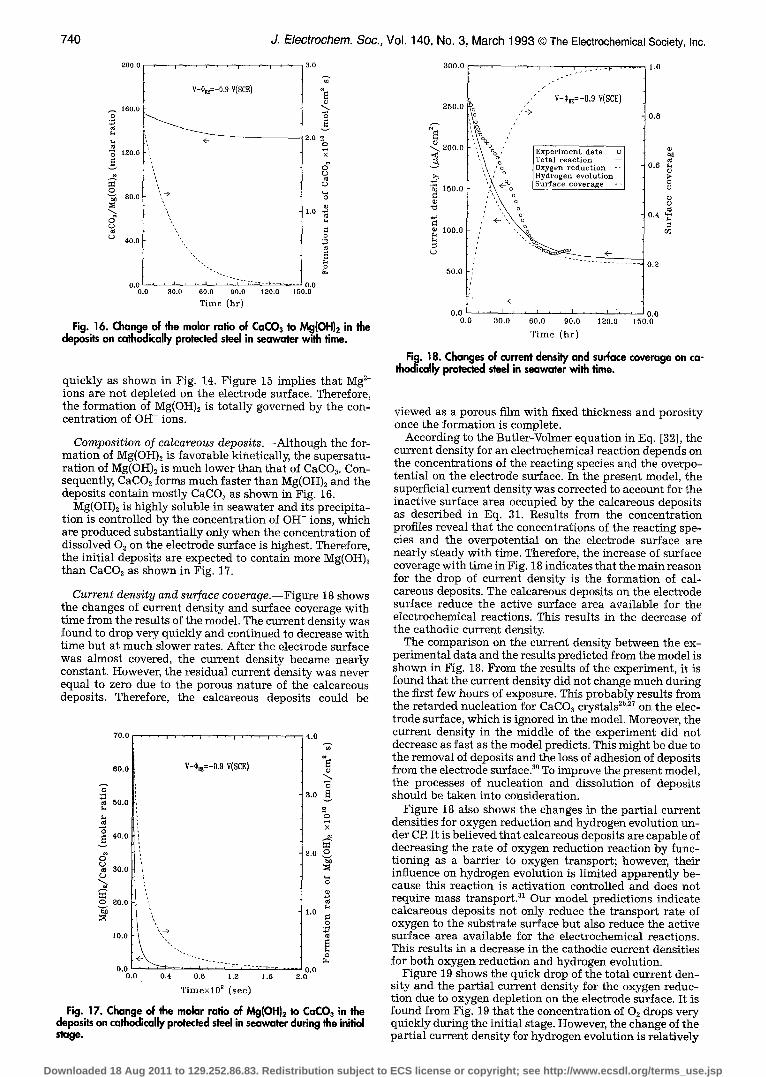
Fig. 16. Change of the molar ratio of CaCO~ to Mg(OH)~ in the deposits on cathodically protected steel in seawater with time.
quickly as shown in Fig. 14. Figure 15 implies that Mg 2§ ions are not depleted on the electrode surface. Therefore, the formation of Mg(OH)~ is totally governed by the con- centration of OH- ions.
Composition of calcareous deposits.--Although the for- mation of Mg(OH)2 is favorable kinetically, the supersatu- ration of Mg(OH)2 is much lower than that of CaCO~. Con- sequently, CaCO3 forms much faster than Mg(OH)2 and the deposits contain mostly CaCO3 as shown in Fig. 16.
Mg(OH)2 is highly soluble in seawater and its precipita- tion is controlled by the concentration of OH- ions, which are produced substantially only when the concentration of dissolved O2 on the electrode surface is highest. Therefore, the initial deposits are expected to contain more Mg(OH)2 than CaCO~ as shown in Fig. 17.
Current density and surface coverage.--Figure 18 shows the changes of current density and surface coverage with time from the results of the model. The current density was found to drop very quickly and continued to decrease with time but at much slower rates. After the electrode surface was almost covered, the current density became nearly constant. However, the residual current density was never equal to zero due to the porous nature of the calcareous deposits. Therefore, the calcareous deposits could be
70.0 , . . . , . . . j . . . , . .
60 .0
50.0
40.0
30.0
2O.O
V-~,~=-0.9 V(SCE)
i ,
o,o I, 0.O 0.4 0.6 1.2 1.6
T i m e x l 0 2 ( s e e )
4.0
3.0
o
X
2.0 0
1.6 0
0.0 2.0
v
,S L~
L~
0 v
3 0 0 . 0
250 .0
g-.
" ~ 200 .0
3
�9 ~ 150.o
~) 100.0
L)
50 .0
5
Fig. 17. Change of the molar ratio of Mg(OH)2 to CaC03 in the deposits on cathodically protected steel in seawater during the initial stage.
, , I
/
/ s
,' E x p e r i m e n t d a t a o ] T o t a l r e a c t i o n - - ] Oxygen r e d u c t i o n - - [
% Hydrogen e v o l u t i o n [ <--%0 S u r f a c e c o v e r a g e .4 ]
', o ', o
" , ~o
, , ~ . : . - v . . . . . 1 . O
v-r V(SCE)
0.8
0.6 ~)
o
0 .4 ~
0.2
< -
0 . 0 ' " 0 . 0
0.O 30 .0 60 .0 90 .0 120.0 150.0
T i m e ( h r )
Fig. i 8. Changes of current density and surface coverage on ca- th~ical~ protected steel in seawater with time.
viewed as a porous film with fixed thickness and porosity once the formation is complete.
According to the Butler-Volmer equation in Eq. [32], the current density for an electrochemical reaction depends on the concentrations of the reacting species and the overpo- tential on the electrode surface. In the present model, the superficial current density was corrected to account for the inactive surface area occupied by the calcareous deposits as described in Eq. 31. Results from the concentration profiles reveal that the concentrations of the reacting spe- cies and the overpotential on the electrode surface are nearly steady with time. Therefore, the increase of surface coverage with time in Fig. 18 indicates that the main reason for the drop of current density is the formation of cal- careous deposits. The calcareous deposits on the electrode surface reduce the active surface area available for the electrochemical reactions. This results in the decrease of the cathodic current density.
The comparison on the current density between the ex- perimental data and the results predicted from the model is shown in Fig. 18. From the results of the experiment, it is found that the current density did not change much during the first few hours of exposure. This probably results from the retarded nucleation for CaCO~ crystals 2~ on the elec- trode surface, which is ignored in the model. Moreover, the current density in the middle of the experiment did not decrease as fast as the model predicts. This might be due to the removal of deposits and the loss of adhesion of deposits from the electrode surface2 ~ To improve the present model, the processes of nucleation and dissolution of deposits should be taken into consideration.
Figure 18 also shows the changes in the partial current densities for oxygen reduction and hydrogen evolution un- der CP. It is believed that calcareous deposits are capable of decreasing the rate of oxygen reduction reaction by func- tioning as a barrier to oxygen transport; however, their influence on hydrogen evolution is limited apparently be- cause this reaction is activation controlled and does not require mass transport21 Our model predictions indicate calcareous deposits not only reduce the transport rate of oxygen to the substrate surface but also reduce the active surface area available for the electrochemical reactions. This results in a decrease in the cathodic current densities for both oxygen reduction and hydrogen evolution.
Figure 19 shows the quick drop of the total current den- sity and the partial current density for the oxygen reduc- tion due to oxygen depletion on the electrode surface. It is found from Fig. 19 that the concentration of 02 drops very quickly during the initial stage. However, the change of the partial current density for hydrogen evolution is relatively
Downloaded 18 Aug 2011 to 129.252.86.83. Redistribution subject to ECS license or copyright; see http://www.ecsdl.org/terms_use.jsp

J. Electrochem. Soc., Vol. 140, No. 3, March 1993 �9 The Electrochemical Society, Inc. 741
4 0 0 0 . 0 . . . , . . . , . . . , . . . , . . . 5 . 0
3000.0
"N ~:000.0
~ 1000.0
0.0
V-r V(SCE)
4.O
Total reaction -- 3.0 ~ Oxygen reduction -- • Hydrogen evolution Oxygen concentration-- 0
1.0 ~
, . I , , , 1 , , , I , , , 9.0 0.0 0.2 0.4 0.6 0.8 1.0
T ime ( sec)
Fig. 19. Current density decay and surface oxygen depletion on cathodically protected steel in seawater during the initial stage.
unchanged. Apparently, the main drop in the total current density results from the decreasing rate of the oxygen re- duction. Therefore, it is reasonable to point out that the sharp drop of current density during the initial stage is attributed to the oxygen depletion on the electrode surface.
Conclusions From the results and discussion, the following conclu-
sions are presented: 1. The increase in the concentration of OH- ions on the
electrode surface is the main driving force for the forma- tion of calcareous deposits.
2. The calcareous deposits contain mostly CaCO3 while the initial deposits are expected to contain more Mg(OH)2 than CaCO3.
3. There are two stages that occur during the drop of current density under CP. The first almost instantaneous drop (within a second) in the current density is at tr ibuted to the oxygen depletion on the electrode surface, and the second decrease of the current density is associated with the formation of the calcareous deposits on the electrode surface.
4. The calcareous deposits on the electrode surface re- duce the active surface area available for the electrochemi- cial reactions. This results in a decrease in the cathodic current density.
Acknowledgments The authors are grateful for the financial support of this
work by Offshore Technology Research Center (OTRC) at Texas A&M University.
Manuscript submitted April 27, 1992; revised manuscript Nov. 12, 1992.
Texas A & M University assisted in meeting the publica- tion costs of this article.
LIST OF SYMBOLS a" disk hydrodynamic constant,0.51023 Ao total electrode surface area, cm ~ Ad surface area occupied by solid deposits inside
the deposits, cm 2 A~ surface area occupied by porous deposits at
time interval z, cm- Ap uncoated surface area inside the deposits, cm 2 A, surface area occupied by porous deposits on
the electrode surface, cm 2 c~ concentration of species i, mol/cm 3 C~.b~lk bulk solution concentration of species i,
m o l / c m 3 c~.d~t, data solution concentration of species /,
mol/cm 3
Cl,o
Ci,ref D i Di,e
F ij
iT Jj
kCaC03
kMg(Oh02
Koq
gsp,caco3
Ksp,Mg(OH)2
m MWcaco3 MWMg(oH)2 nj
Ni
NR Pij
Ri
Ri'
R; S~j
ScacO3 t T Vj,ref
Vj0 V~
Y~ V~ XCa2+/Mg2+ t
XMg2+/Ca2+,t
Xij
Y YRE Zi
Greek {Xaj
(Xc i
Ed Es ~j V 12 (b
~o dPRE OCaCO3 PMg(OH)2
concentration of species i on the electrode sur- face, mol/cm 3 reference concentration of species i, mol/cm ~ diffusion coefficient of species i, cm2/s effective diffusion coefficient of species i in the porous layer, cm2/s Faraday's constant, 96487 C/mol superficial current density for electrochemical reaction j, A/cm 2 total current density, A/cm 2 local current density for electrochemical reac- tion j, A/cm 2 reaction rate constant for the precipitation re- action of CaCO3, mol/cm 2 �9 s reaction rate constant for the precipitation re- action of Mg(OH)2, cmT/mol 2 - s equilibrium constant for the homogeneous re- action, cm3/mol apparent solubility product constant of CaCO3, mol2/cm 6 apparent solubility product constant of Mg(OH)2, mol3/cm 9 reaction order for the precipitation of CaCO3 molecular weight of CaCO3, g/tool molecular weight of Mg(OH)2, g/mol number of electrons transferred in electro- chemical reaction j molar flux of species i, mol/cm 2 �9 s MacMullin number for porous layer number of precipitation reaction number of electrochemical reaction anodic reaction order of species i in electro- chemical reaction j cathodic reaction order of species i in electro- chemical reaction j precipitation rate of j deposit, mol/cm 2 �9 s universal gas constant, 8.314 J/mol �9 K homogeneous reaction rate of species i, mol/cm 2 �9 s electrochemical reaction rate of species i, mol/cm 2 �9 s precipitation rate of species i, mol/cm 2 �9 s stoichiometric coefficient of species i in the electrochemical reaction j supersaturation for CaCO3 time, s temperature, K equilibrium potential for electrochemical re- action j at reference concentration of species i, V standard electrode potential for electrochemi- cal reaction j, V reference electrode potential at reference con- centrations, V velocity of solution in y direction, cm/s electrode potential, V volume occupied by solid deposits on Vs, cm 3 volume occupied by porous deposits on Vo, cm 3 molar ration of CaCO3 to Mg(OH)2 in the de- posits at time t molar ration of Mg(OH)2 to CaCO3 in the de- posits at time t stoichiometric coefficient of species i in the precipitation reaction j normal coordinate in modeled region, cm position of reference electrode, cm charge number of species i
anodic transfer coefficient for reaction j cathodic transfer coefficient for reaction j exponent in the composition dependent of the exchange current density for species i in elec- trochemical reaction j thickness of calcareous deposits, cm deposit porosity surface porosity overpotential, V kinematic viscosity, cm~/s disk rotation velocity, s -i solution potential, V solution potential on the electrode surface, V solution potential in bulk solution, V density of CaCO3, g/cm 3 density of Mg(OH)2, g/cm 3
Downloaded 18 Aug 2011 to 129.252.86.83. Redistribution subject to ECS license or copyright; see http://www.ecsdl.org/terms_use.jsp
742 J. Electrochem. Soc., Vol. 140, No. 3, March 1993 �9 The Electrochemical Society, Inc.
tortuosity of porous layer 0 surface coverage of calcareous deposits
REFERENCES 1. M. G. Fontana, Corrosion Engineering, 3rd ed., Mc-
Graw-Hill , Inc., New York (1986). 2. W. H. Hartt , W. Wang, and T. Y. Chen, Paper No. 576,
presented at "CORROSION/89," National Associa- tion of Corrosion Engineers, Houston, TX (1989).
3. K. P. Fischer and W. H. Thomason, Paper No. 577, pre- sented at "CORROSION/89," National Association of Corrosion Engineers, Houston, TX (1989).
4. W. H. Hartt , C. H. Culberson, and S. W. Smith, Corro- sion, 40, 11, 609 (1984).
5. H. A. Humble, ibid., 4, 7,358 (1948). 6. H. R. England and R. H. Heidersbach, CH1685-7, IEEE
(1981). 7. S. L. Wolfson and W. H. Hartt , Corrosion, 37, 2, 70
(1981). 8. M. M. Kunjapur, W. H. Hartt , and S. W. Smith, ibid., 43,
11, 674 (1987). 9. J. E. Finnegan and K. P. Fischer, Paper No. 581, pre-
sented at "CORROSION/89," National Association of Corrosion Engineers, Houston, TX (1989).
10. K. E. Mantel, W. H. Hartt , and T. Y. Chen, Paper No. 374, presented at "CORROSION/90," National Asso- ciation of Corrosion Engineers, Houston, TX (1990).
11. J-S. Luo and W. H. Hartt , Paper No. 236, presented at "CORROSION/91," National Association of Corro- sion Engineers ,Houston, TX (1991).
12. J. S. Luo, R. U. Lee, T. Y. Chen, W. H. Hartt , and S. W. Smith, Corrosion, 47, 3,189 (1991).
13. S. Elbeik, A. C. C. Tseung, and A. L. Mackay, Corros. Sci., 26, 669 (1986).
14. S-H. Lin and S. C. Dexter, Corrosion, 44, 9,615 (1988). 15. G. K. Sadasivan, M. S. Thesis, Flor ida Atlantic Univer-
sity, Boca Raton, FL (1989). 16. J. Burton, Chem. Ind., 16, 550 (1977).
17. S. C. Dexter and S-H. Lin, Paper No. 499, presented at "CORROSION/91," National Association of Corro- sion Engineers, Houston, TX (1991).
18. American Society of Testing and Materials, Designa- tion D 1141-90, Philadelphia, PA (1990).
19. A. Turnbull and D. H. Ferriss, Corros. Sci., 26, 601 (1986).
20. J. S. Newman, Electrochemical Systems, Prentice- Hall, Inc., Englewood Cliffs, NJ (1973).
21. P. Russell and J. Newman, This Journal, 133, 59 (1986). 22. W. E. Ryan, R. E. White, and S. L. Kelly, ibid., 134, 2154
(1987). 23. K-M Yin and R. E. White, AIChE J., 36, 187 (1990). 24. H. Gu,-T. V. Nguyen, and R. E. White, This Journal, 134,
2953 (1987). 25. T. Yeu, T. V. Nguyen, and R. E. White, ibid., 135, 1971
(1988). 26. R. M. Pytkowicz, Am. J. Sci., 273, 515 (1973). 27. R. A. Berner, Geochim. Cosmochim. Acta, 39, 489
(1975). 28. E. A. Burton and L. M. Walter, Geology, 15, 111 (1987). 29. J. S. Newman, Ind. Eng. Chem. Fundam., 7, 514(1968). 30. K. P. Fischer and J. E. Finnegan, Paper No. 582, pre-
sented at "CORROSION/89," National Association of Corrosion Engineers, Houston, TX (1989).
31. R. U. Lee and J. R. Ambrose, Corrosion, 44, 12, 887 (1988).
32. M. Whitfield and D. Janger, Marine Electrochemistry, John Wiley & Sons, Inc., New York (1981).
33. A. J. Bard and L. R. Faulkner, Electrochemical Meth- ods, John Wiley & Sons, Inc., New York (1980).
34. A. Mucci, Am. J. Sci., 283, 780 (1983). 35. G. Skirrow, in Chemical Oceanography, Vol. 2, 2nd ed.,
J. P. Riley and G. Skirrow, Editors, Academic Press, Inc., New York (1975).
36. Y.-H. Li and S. Gregary, Geochim. et Cosmochim. Acta, 38, 703 (1974).
Electrochemical Oxidation of Graphite in Organic Electrolytes Containing or CIO
Zhengwei Zhang* and Michael M. Lerner** Department of Chemistry and Center for Advanced Materials Research, Oregon State University, Corvallis,
Oregon 97331-4003
ABSTRACT
A systematic evaluation of the electrochemical oxidation of porous graphite powder electrodes in CH3NO2, CH3CN, and propylene carbonate (PC) electrolytes containing PF~ or C10~ is described. The graphi te compounds obtained are charac- terized by x- ray powder diffraction while in the electrolyte solution and following evacuation. The potent ial-charge curves reveal a number of common features which are used to estimate the efficiency of the galvanostatic charge process in the different electrolytes. The stabili t ies of the intercalation compounds are also examined by a recharge method. The CH3NO2- based electrolytes with either anion yield charge efficiencies of greater than 90% to a charge input of 4 C/mmole carbon (C~4), and the oxidized products are stable in the electrolyte solution. The CH~CN-based electrolytes are far less efficient and the oxidized compounds produced decompose rapidly. Low-stage products can be isolated following oxidation in PC saturated with NaPFs, but not when the 0.5M LiC104, PC electrolyte is employed.
Graphite can be chemically or electrochemically oxi- dized to form intercalat ion compounds. The preparat ion of graphite salts via the chemical route allows for the rapid production of relat ively large and homogeneous samples; however, electrochemical syntheses offer other advantages. The oxidation can be controlled and intermediate phases not readily obtained by chemical methods can therefore be isolated. The progress of the electrochemical oxidation may be continuously monitored by potent ial-charge plots, and, if side reactions are not significant, coulommetry unam- biguously provides the charge borne by carbon. The la t ter point is especially important as the nature of the charge
* Electrochemical Society Student Member. ** Electrochemical Society Active Member.
distr ibution in chemically prepared intercalat ion com- pounds has been a source of controversy for some time. 14
The oxidative electrochemistry of graphite is also of pract ical interest. The charge/discharge cycle associated with graphite intercalation has been suggested as a positive electrode for reversible, high energy density cel]sJ '~ The stabil i ty of the oxidized products formed is therefore a technologically important issue.
Sui table electrolytes must be stable to the high potentials required to remove electrons from the carbon ~r-bands. The required electromotive force is a function of the charge on carbon (related to the work function of graphite), which, for highly charged compounds, can exceed +1.5 V vs. SHE. Nevertheless, a number of electrolytes have been investi- gated, including the concentrated aqueous acids H2SO4, 6-10
Downloaded 18 Aug 2011 to 129.252.86.83. Redistribution subject to ECS license or copyright; see http://www.ecsdl.org/terms_use.jsp