Mathematical Modeling of a Solid Oxide Fuel Cell with ... · Mathematical Modeling of a Solid Oxide...
12
Journal of Sustainable Energy & Environment 1 (2010) 185-196 Copyright @ 2010 By Journal of Sustainable Energy and Environment 185 Mathematical Modeling of a Solid Oxide Fuel Cell with Nearly Spherical-Shaped Electrode Particles P. Chinda 1 , S. Chanchaona 1 , P. Brault 2 and W. Wechsatol 1,* 1 Department of Mechanical Engineering, King Mongkut’s University of Technology Thonburi, 126 Pracha-autid Road, Bangmod, Thrungkru, Bangkok, 10140, Thailand 2 Groupe de Recherche sur l’énergétique des Milieux Ionisés (GREMI), UMR 6606 CNRS-Université d’Orléans, BP6744, 45067, Orléans Cedex 2, France *Corresponding author: [email protected] Abstract: A micro-scale model of a Solid Oxide Fuel Cell (SOFC) involving electrochemical reactions and mass transport behaviors throughout electrodes packed with nearly spherical-shaped particles was mathematically developed. The model was validated by comparing the predicted results with already available experimental results. By minimizing the cell overpotential, the model provides the optimal size of electrode particles corresponding to the specified porosities. The optimal volumetric ratio between ionic and electronic conducting particles is also proposed. The study results substantiate the fact that SOFC overpotential could be effectively decreased by increasing the operating temperature as well as operating pressure. The present study reveals the working mechanisms of SOFC at the micro-scale level, while demonstrating the use of microstructure relations to enhance the SOFC performance. Keywords: micro-scale model SOFC, microstructure; optimal size, overpotential, spherical-shaped particle. 1. Introduction The solid oxide fuel cell (SOFC) is a highly efficient energy conversion system that transforms chemical energy to electrical energy and heat directly from gasified fuels by electrochemical reactions of fuels and oxidants. It can be powered with hydrocarbons such as CH 4 , C 2 H 6 and C 3 H 8 , and also with CO besides H 2 as a fuel sources. The SOFC can be applied to versatile power generation systems, such as stationary power supplies and auxiliary power sources for automotive and residential applications [1-2]. Researchers have been mainly focused on the SOFC fabrication with various forms, and developing new materials for commercial applications. Ramakrishna et al. [3] performed numerical analyses on a CFD-ACE package and proposed an innovative thin-walled geometry to improve the power density of SOFC. More recently, a novel 3-D SOFC was developed by Koh et al. [4] to increase the volumetric power density by increasing the volumetric surface areas of the electrodes to express its method of fabrication. Moreover, Yang et al. [5] and Hwang et al [6-7] developed a numerical model to investigate the characteristics of a mono-block-layer built (MOLB) SOFC and they found that the MOLB-SOFC had a higher fuel/oxidant utilization than the planar type SOFC. The high utilization of the fuel/oxidant reflects the high current through the SOFC. However, the current density distributions are less uniform in MOLB-type SOFC, which is a disadvantage in this type of SOFC. The major limitation of using SOFCs is their high operating temperature. As a solution to this, and to achieve stability and economy, intermediate temperature SOFCs (IT–SOFCs) and low temperature SOFCs are subject to a growing interest. The techniques of thin electrolyte and electrode coating involving new materials have been chosen for intermediate and low temperature SOFCs. Furthermore, Yttria Stabilized Zirconia or YSZ is normally used as the electrolyte for cell operation at high temperatures, however, by reducing the electrolyte thickness it is possible to use YSZ for SOFCs at intermediate and low temperatures. New materials used in SOFCs for intermediate temperature SOFCs such as ceria based electrolyte have been proposed [8–11], but for overcoming the major limitations of SOFCs, a new technique of SOFC design has been investigated by many researchers: thin film deposition. This technique has been studied for a few decades with Proton Exchange Membrane Fuel Cells (PEMFC) [12] and now shows immense possibility to be applied to SOFC applications [13-15]. One of the main advantages of such a thin film fuel cell is that its ohmic resistance is low enough to maintain a high performance cell at low operation temperatures. In a SOFC system, computer simulation based on theoretical modeling is known to be a very efficient method for predicting materials properties, reaction kinetics and unit cell performance. Different levels of model, depending on the objective, have been developed, each with different degrees of sophistication and detail. Theoretical modeling of SOFC can be divided into two levels: macro- and micro-scale modeling. Detailed understanding of fluid and mass transport shows whether heat transfer can be obtained from macro-scale modeling. The effects of porosity change on reactant concentration and ohmic overpotentials could also be considered in the macro-scale modeling, but the activation overpotential must be treated as a property independent of the porosity, while the electrochemical reactions must occur only at the interface between electrode and electrolyte layers. The macro-scale modeling is not a good predictor of the effect of electrode structure on the chemical reaction within SOFCs. Influence of the electrode structure on the reaction of kinetics at the three phase boundary (TPB) has recently been included in micro-scale modeling of SOFCs [16-20]. In literature for micro– scale modeling, the properties of porous electrodes and their effects on SOFC performance have been investigated from different aspects. Costamagna et al. [16] developed a theoretical microscopic model for the evaluation of the performance of an electrode formed by a mixture of electronic and ionic conductors with nearly spherical particle shape. The results of the mode1 show that the effects of morphology, i.e. the volumetric composition of the electrode and the dimensions of the particles, strongly influence the electrode resistance. The model has been applied to erbia- doped bismuth oxide/Pt or (Bi 2 O 3 ) 0.7 (Er 2 O 3 ) 0.3 /Pt or EDB/Pt and Yttria-tabilized Zirconia/Strontium-doped Lanthanum Manganite (YSZ/LSM) cathodes and YSZ/Ni anodes. Chen et al. [17] developed a mechanistic model for oxygen reduction at the YSZ/LSM interface; a complete micro-model for YSZ/LSM composite cathode considering all forms of overpotential was developed which established the interrelationship among the transport phenomena, electrochemical processes and the microstructure of the composite cathode. The exchange current densities of the rate-limiting steps used in the simulation and
Transcript of Mathematical Modeling of a Solid Oxide Fuel Cell with ... · Mathematical Modeling of a Solid Oxide...

Journal of Sustainable Energy & Environment 1 (2010) 185-196
Copyright @ 2010 By Journal of Sustainable Energy and Environment 185
Mathematical Modeling of a Solid Oxide Fuel Cell with Nearly Spherical-Shaped Electrode Particles
P. Chinda1, S. Chanchaona1, P. Brault2 and W. Wechsatol1,*
1 Department of Mechanical Engineering, King Mongkut’s University of Technology Thonburi,
126 Pracha-autid Road, Bangmod, Thrungkru, Bangkok, 10140, Thailand 2 Groupe de Recherche sur l’énergétique des Milieux Ionisés (GREMI), UMR 6606 CNRS-Université d’Orléans, BP6744, 45067, Orléans Cedex 2, France
*Corresponding author: [email protected]
Abstract: A micro-scale model of a Solid Oxide Fuel Cell (SOFC) involving electrochemical reactions and mass transport behaviors throughout electrodes packed with nearly spherical-shaped particles was mathematically developed. The model was validated by comparing the predicted results with already available experimental results. By minimizing the cell overpotential, the model provides the optimal size of electrode particles corresponding to the specified porosities. The optimal volumetric ratio between ionic and electronic conducting particles is also proposed. The study results substantiate the fact that SOFC overpotential could be effectively decreased by increasing the operating temperature as well as operating pressure. The present study reveals the working mechanisms of SOFC at the micro-scale level, while demonstrating the use of microstructure relations to enhance the SOFC performance. Keywords: micro-scale model SOFC, microstructure; optimal size, overpotential, spherical-shaped particle.
1. Introduction
The solid oxide fuel cell (SOFC) is a highly efficient energy conversion system that transforms chemical energy to electrical energy and heat directly from gasified fuels by electrochemical reactions of fuels and oxidants. It can be powered with hydrocarbons such as CH4, C2H6 and C3H8, and also with CO besides H2 as a fuel sources. The SOFC can be applied to versatile power generation systems, such as stationary power supplies and auxiliary power sources for automotive and residential applications [1-2]. Researchers have been mainly focused on the SOFC fabrication with various forms, and developing new materials for commercial applications. Ramakrishna et al. [3] performed numerical analyses on a CFD-ACE package and proposed an innovative thin-walled geometry to improve the power density of SOFC. More recently, a novel 3-D SOFC was developed by Koh et al. [4] to increase the volumetric power density by increasing the volumetric surface areas of the electrodes to express its method of fabrication. Moreover, Yang et al. [5] and Hwang et al [6-7] developed a numerical model to investigate the characteristics of a mono-block-layer built (MOLB) SOFC and they found that the MOLB-SOFC had a higher fuel/oxidant utilization than the planar type SOFC. The high utilization of the fuel/oxidant reflects the high current through the SOFC. However, the current density distributions are less uniform in MOLB-type SOFC, which is a disadvantage in this type of SOFC. The major limitation of using SOFCs is their high operating temperature. As a solution to this, and to achieve stability and economy, intermediate temperature SOFCs (IT–SOFCs) and low temperature SOFCs are subject to a growing interest. The techniques of thin electrolyte and electrode coating involving new materials have been chosen for intermediate and low temperature SOFCs. Furthermore, Yttria Stabilized Zirconia or YSZ is normally used as the electrolyte for cell operation at high temperatures, however, by reducing the electrolyte thickness it is possible to use YSZ for SOFCs at intermediate and low temperatures. New materials used in SOFCs for intermediate temperature SOFCs such as ceria based electrolyte have been proposed [8–11], but for overcoming the major limitations of SOFCs, a new technique of SOFC design has been investigated by many researchers: thin film deposition. This technique has been studied for a few decades with Proton Exchange Membrane Fuel Cells (PEMFC) [12] and now shows
immense possibility to be applied to SOFC applications [13-15]. One of the main advantages of such a thin film fuel cell is that its ohmic resistance is low enough to maintain a high performance cell at low operation temperatures.
In a SOFC system, computer simulation based on theoretical modeling is known to be a very efficient method for predicting materials properties, reaction kinetics and unit cell performance. Different levels of model, depending on the objective, have been developed, each with different degrees of sophistication and detail. Theoretical modeling of SOFC can be divided into two levels: macro- and micro-scale modeling. Detailed understanding of fluid and mass transport shows whether heat transfer can be obtained from macro-scale modeling. The effects of porosity change on reactant concentration and ohmic overpotentials could also be considered in the macro-scale modeling, but the activation overpotential must be treated as a property independent of the porosity, while the electrochemical reactions must occur only at the interface between electrode and electrolyte layers. The macro-scale modeling is not a good predictor of the effect of electrode structure on the chemical reaction within SOFCs. Influence of the electrode structure on the reaction of kinetics at the three phase boundary (TPB) has recently been included in micro-scale modeling of SOFCs [16-20]. In literature for micro–scale modeling, the properties of porous electrodes and their effects on SOFC performance have been investigated from different aspects.
Costamagna et al. [16] developed a theoretical microscopic model for the evaluation of the performance of an electrode formed by a mixture of electronic and ionic conductors with nearly spherical particle shape. The results of the mode1 show that the effects of morphology, i.e. the volumetric composition of the electrode and the dimensions of the particles, strongly influence the electrode resistance. The model has been applied to erbia-doped bismuth oxide/Pt or (Bi2O3)0.7(Er2O3)0.3/Pt or EDB/Pt and Yttria-tabilized Zirconia/Strontium-doped Lanthanum Manganite (YSZ/LSM) cathodes and YSZ/Ni anodes. Chen et al. [17] developed a mechanistic model for oxygen reduction at the YSZ/LSM interface; a complete micro-model for YSZ/LSM composite cathode considering all forms of overpotential was developed which established the interrelationship among the transport phenomena, electrochemical processes and the microstructure of the composite cathode. The exchange current densities of the rate-limiting steps used in the simulation and
Journal of Sustainable Energy & Environment 1 (2010) 185-196
Copyright @ 2010 By Journal of Sustainable Energy and Environment 186
the model can be used as a tool to guide the design of high performance cathodes. Deseure et al. [18] developed a microscopic model for a composite cathode similar to Chen et al. [17]. Simulation was conducted to predict the optimal design parameters, e.g. cathode thickness, particle size, particle size ratio and YSZ volume fraction, for a LSM/YSZ composite cathode. Hussain et al. [19] considered a 1-D anode-supported planar SOFC with a thin layer reaction zone in the vicinity of electrolytes. Their numerical results showed that the increase of either porosity or tortuosity of electrodes leads to worse cell performance, while better cell performance is obtained when the volume fraction of electronic conducting particles is approximately equal to that of ionic conducting particles in the reaction zone. Recently they extended their investigation to the cell design with two distinct layers of anode electrode, i.e., reaction layer and backing layer. Ni et al. [20] developed a mathematical model for modeling the performance of SOFCs with functionally graded electrodes at the micro-scale level. The model considered all forms of overpotentials and was able to capture the coupled electrochemical reactions and mass transfer involved in the SOFC operation. Additional modeling analyses were conducted to gain better understanding of the SOFC working mechanisms at the micro-scale level and to quantify the performance of micro-structurally graded SOFCs. It was found that micro-structural grading could significantly enhance the gas transport but had negligible effects on the ohmic and activation overpotentials, especially for thick electrodes. The optimal size of particles was investigated for maximizing SOFC cell performance. The volumetric fraction between ionic and electronic conducting particles was also considered.
Unlike other previous researches, the effect of particle’s geometrical shapes is included in this model. For example, porosity and tortuosity are parameters that depend on the shape of electrode particles. Normally, porous electrodes are random stacks of nearly spherical-shaped particles. Thus, this work is aimed to maximize the SOFC performance by optimizing the microstructure of the SOFC electrodes. The optimal size of particles was investigated for maximizing SOFC cell performance. The volumetric fraction between ionic and electronic conducting particles was also considered.
2. Experimental
2.1 Mathematical modeling 2.1.1 Anode side modeling Porous composite electrodes are commonly used in fuel cells due to their extended zone for electrochemical reactions, thus improving the current output of an electrode. The performance of a porous electrode depends on, but is not limited to: (1) the activity of electro catalysts, (2) the specific surface area (m2 m−3) available for electrochemical reaction, (3) the mass transport phenomena, and (4) the ionic and electronic conductivity of the electrode. Because of the complexity of mass transport, the ionic and electronic transport and electrochemical reaction, so a complicated simulation technique was employed to predict cell performance under various operating conditions, and for parametric study. The present model aims to optimize the SOFC performance by optimizing the microstructure relations of SOFC electrode by micro-scale modeling. The relation of electrode porosity and electrode particle radius size has been investigated for maximizing SOFC cell performance. Moreover, this model is considered for optimization of the volumetric fraction of ionic and electronic conducting particles of the electrodes. For the sake of simplicity, we assume that the particle radius of both ionic and electronic conducting particles is equal.
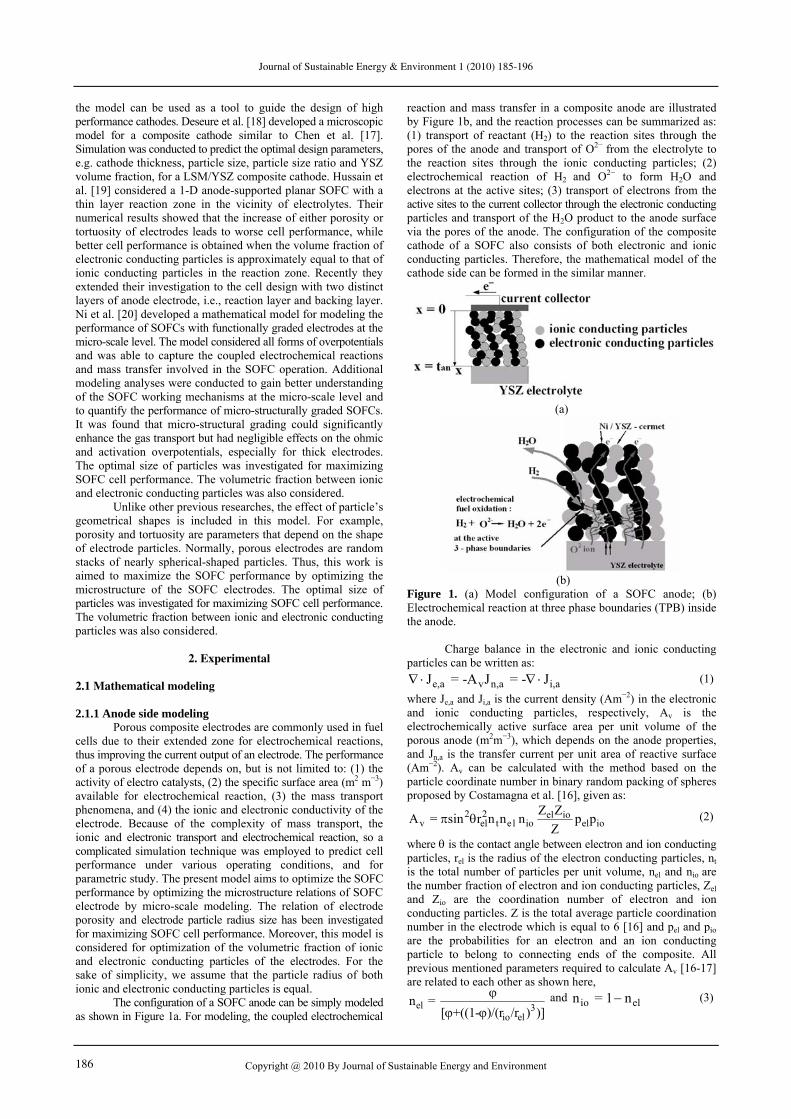
The configuration of a SOFC anode can be simply modeled as shown in Figure 1a. For modeling, the coupled electrochemical
reaction and mass transfer in a composite anode are illustrated by Figure 1b, and the reaction processes can be summarized as: (1) transport of reactant (H2) to the reaction sites through the pores of the anode and transport of O2− from the electrolyte to the reaction sites through the ionic conducting particles; (2) electrochemical reaction of H2 and O2− to form H2O and electrons at the active sites; (3) transport of electrons from the active sites to the current collector through the electronic conducting particles and transport of the H2O product to the anode surface via the pores of the anode. The configuration of the composite cathode of a SOFC also consists of both electronic and ionic conducting particles. Therefore, the mathematical model of the cathode side can be formed in the similar manner.
(a)
(b)
Figure 1. (a) Model configuration of a SOFC anode; (b) Electrochemical reaction at three phase boundaries (TPB) inside the anode.
Charge balance in the electronic and ionic conducting particles can be written as:
e,a v n,a i,aJ = -A J = - J (1)
where Je,a and Ji,a is the current density (Am−2) in the electronic and ionic conducting particles, respectively, Av is the electrochemically active surface area per unit volume of the porous anode (m2m−3), which depends on the anode properties, and Jn,a is the transfer current per unit area of reactive surface (Am−2). Av can be calculated with the method based on the particle coordinate number in binary random packing of spheres proposed by Costamagna et al. [16], given as:
2 2 el iov el t e l io el io
Z ZA = sin r n n n p p
Z (2)
where is the contact angle between electron and ion conducting particles, rel is the radius of the electron conducting particles, nt
is the total number of particles per unit volume, nel and nio are the number fraction of electron and ion conducting particles, Zel and Zio are the coordination number of electron and ion conducting particles. Z is the total average particle coordination number in the electrode which is equal to 6 [16] and pel and pio are the probabilities for an electron and an ion conducting particle to belong to connecting ends of the composite. All previous mentioned parameters required to calculate Av [16-17] are related to each other as shown here,
el 3io el
n = [ +((1- )/(r /r ) )]
and io eln = 1 n (3)

Journal of Sustainable Energy & Environment 1 (2010) 185-196
Copyright @ 2010 By Journal of Sustainable Energy and Environment 187
el 2el el io el
Z-3Z = 3+
[n (1 n )(r / r ) ] and
2io el
io 2el el io el
(Z-3)(r /r )Z = 3+
[n (1 n )(r / r ) ] (4)
0.42.5
el el - elp = 1- 4-Z
and
0.42.5
io io - iop = 1- 4-Z
(5)
where is a volume fraction of the electron conducing particle in an electrode, Zel – el represents the average coordination number between electronic particles and Zio-io represents the average coordination number between ionic particles [16-17],
2el el
el eln Z
Z = Z
and 2
io ioio io
n ZZ =
Z (6)
t 3 3el el el io el
1- n =
(4/3) r [n (1 n )(r / r ) ]
(7)
where ε is the electrode porosity and from Eq. (7), can be rewritten as:
3 3el t el el io el(4/3) r n [n (1 n )(r / r ) ] + = 1 (8)
For the sake of simplicity, assume that both ionic and electronic conducting particles have the same radius (rio = rel), thus Eq. (8) can be rewritten as,
3t el
4n r + = 1
3 (9)
Eq. (9) illustrates the constraint among , nt and the particle radius (rel, rio). If the total number of particles nt is fixed, will depend solely on the particle radius. An aim of this work is to find the optimal radius of particles leading to the maximum active surface area Av. According to the Butler and Volmer equation [17], the transfer current density Jn,a can be determined from
2
H2
Href an,a 0,a 0
P zFJ J exp
RTP
2
H O2
H O a0
P (1 )zFexp( )
RTP
(10)
where ref0J is the reference exchange current density of the
electrode – i.e. for an anode, ref0,aJ is 400 A/m2 and for a cathode,
ref0,cJ is 1320 A/m2 [19]. PH2O and
H O2
0P are respectively the
partial pressures of H2O within the porous anode and at the
anode surface. Similarly, PH2 and H2
0P are the partial pressures
of H2 within the porous anode and at the anode surface. The parameter α is the charge transfer coefficient which is 0.5 [21], while z is the number of charges involved in a reaction. The overpotential at the anode ηa [16,21] is
0 0a e,a i,a e,a i,a = ( - ) - ( - ) (11)
where i,a and e,a denote the ionic and electronic potentials.
The superscript 0 represents the equilibrium state obtained from Ohm’s law,
effe,a e,a e,a = J and
i,a i,a
effi,a = J (12)
where ρeff [19] is the effective resistivity (Ωm) and J is the current density. The subscripts i and e represent ionic and electronic conductors, respectively. ρeff can be determined by Eq. (13) [19].
effe,a
e,a
= (1- )
and eff
i,ai,a
= (1 )(1- )
(13)
where τ is electrode tortuosity, σe is the conductivity of
electronic conductor i.e. for an anode, e,a is 62 10 Sm-1
[16,21] and for a cathode, e,c is 41 10 Sm-1 [22]. σi is the
ionic conductor i.e. for an anode i,a and for a cathode, i,c is
equal to 43.44 10 exp(-10300 T ) . The first and second
derivatives of ηa are
eff effai,a i,a e,a e,a
d= J - J
dx
(14)
2i,a e,aeff eff eff effa
i,a e,a v n,a i,a e,a2
dJ dJd= - = A J ( )
dx dxdx
(15)
2
2
2Href eff effa a
v 0,a i,a e,a2 0H
Pd zF = A J ( ) exp
RTdx P
2
2
H O a0H O
P (1 )ZFexp
RTP
(16)
At the anode surface, Ji,a = 0 and Je,a= Jtotal. At the electrolyte interface, Ji,a = Jtotal and Je,a = 0. Therefore, two boundary conditions for the second order differential Eq. (16) can be written as,
effae,a total
x 0
d x = 0 , = - J
dx
and
effaan totali,a
x tan
d x = t , = J
dx
(17)
The electrochemical reactions due to mass transport occur in SOFC electrodes.
Mass transport through a porous medium can be determined using concepts described by Krishna et al. [23]. For a single component, the mass transport equation can be written as,
-3 -1ii i
(y P) = - N + R (mol m s )
RT t
(18)
where and Ni represent the porosity and the rate of mass transport (or denotes as the molar flux of each species, mol m−2 s−1), respectively, into porous media. Ri is the rate of reaction inside the porous medium. The term on the left-hand side is valid when an unsteady state is approached. The first and second terms on the right-hand side represent the diffusion rate and the rate of reaction inside the porous medium. It was assumed earlier that the diffusion process is at a steady state and that the electrochemical reactions take place at the three phase boundary (TPB) inside the electrode. Therefore, within the anode, the first and second term on the right-hand side is significant, Eq. (18), and becomes
i iN = R (19)
The rate of mass transport, Ni, generally depends on the operating conditions (reactant concentration, temperature and pressure) and the microstructure of the material (porosity, tortuosity and pore size). Three models were used to develop expressions for Ni: Fick’s, the Dusty-Gas and the Stefan–Maxwell models. Only, Fick’s and Dusty-Gas are used to describe the transport of components within porous media but the Stefan–Maxwell Model (SMM) is a well-known mass transport model applied to nonporous media [24].
Normally, to describe the transport of components within porous media the simplest method is using Fick’s model that takes into account diffusion and convection transport. The

Journal of Sustainable Energy & Environment 1 (2010) 185-196
Copyright @ 2010 By Journal of Sustainable Energy and Environment 188
convection transport term is described by the Darcy equation that relates with the permeability, viscosity of fluid, total pressure and pressure gradient [24]. However, it is assumed that the total pressure change within the pore is insignificant ( dP dx 0 ).
Thus, only the diffusion transport is necessary to determine the rate of mass transport by Fick’s model. Another model to describe the transport of components within porous media is Dusty-Gas Model (DGM) that also includes the permeation flux and is applied to take into account the effect of total pressure gradient on mass transport. However, this study was done on the basic assumption that the total pressure is uniform over the entire depth of the porous electrode. Thus, the definite total pressure gradient term can be ignored. Consequently, only the diffusion flux is addressed for the DGM model, which means the primary mode of species transport in the porous electrode is by diffusion.
The mass transfer process inside the porous electrode is by means of diffusion and was also selected for the reason described above and by recommendations in the literature [24-26]. Suwanwarangkul et al. [24] concluded that the Dusty-Gas Model (DGM) is the most appropriate model to simulate gas transport phenomena inside a SOFC electrode. The mass flux of species i can be determined by the Dusty-Gas Model (DGM) which is considered to be both Knudsen diffusion and Molecular diffusion. The DGM is the most suitable model for the H2 - H2O system [24]. Suwanwarangkul et al. also demonstrated that only the DGM is recommended for a multi component system. This is because it takes into account Knudsen diffusion effect as well as Graham’s law of diffusion to calculate the flux ratios. Thus, the DGM was used to develop the expressions for Ni in this work.
The electrochemical reactions due to mass transport occuring in SOFC electrodes is represented by the term Ri.; the rate of electrochemical reaction per unit volume of the porous electrode (mol m−3 s−1). The electrochemical reaction rate of H2O and H2 can be expressed by Faraday’s Law as:
2H v n,aR = (-A J )/(2F) (20)
2H O v n,aR = (A J )/(2F) (21)
The DGM includes the Stefan–Maxwell formulation and takes into account Knudsen diffusion and Molecular diffusion [24]. It is assumed from this model that pore walls consist of giant molecules (‘dust’) uniformly distributed in space. These dust molecules are considered to be a dummy, or pseudo species in the mixture. The general form of the DGM is shown in Eq. (22):
nj i - i ji
eff effj=1,j ii,k ij
y N y NN + =
D D
0ii eff
i,k
B Pdy1 dP- P y 1
RT dx dx D
(22)
where x is a vertical direction as shown in Figure 1a and yi, yj is the mole fraction of species i and j.
From the DGM that considers both Knudsen diffusion and Molecular diffusion, the diffusion process within a pore can be typically divided into two diffusion mechanisms that are Molecular and Knudsen diffusion. Molecular diffusion is dominant for large pore sizes and high system pressures while Knudsen diffusion becomes significant when the mean-free path of the molecular species is much larger than the pore size. Therefore the effective diffusivity of species i, ( eff
iD ) can be
written by combining the effective molecular diffusion ( effimD )
and effective Knudsen diffusion ( effi,kD ) coefficients as follows
Bosanquet formula [27]:
1
effi eff eff
im i,k
1 1D =
D D
(23)
effimD and eff
i,kD depend on the microstructure of the
porous electrode (porosity, particle size and tortuosity) and on the operating conditions (temperature and pressure). The calculation of these parameters are described in Ref. [25,28]. It should be noted that eff
iD given in Eq. (23) is derived from the
assumption of equimolar counter diffusion of reactant and product species. For binary component systems H2(1) – H2O(2), the effective diffusion for binary systems ( eff
i,BD ) becomes: 1 1
effi,B eff eff eff eff
ij i,k 12 1,k
1 1 1 1D = =
D D D D
(24)
The K nudsen diffusion coefficient ( i,kD ) and
effective Knudsen diffusion coefficient ( effi,kD ) for each gas
specie [27] can be calculated by Eqs. (25) and (26).
i,ki i
2 8RT TD r 97.0r
3 M M
(25)
effi,k i,kD D
(26)
The binary diffusion coefficient is calculated using the Chapman-Enskog equation [27].
2
ij
1/ 23/2
ijij D i j
T 1 1D = 0.0018583
p M M
(27)
where ij i j= ( + )/2 is the collision diameter (in A
), p is
total pressure (in atm), Mi and Mj are molecular weight of species i and j,
ijD is the collision integral based on the Lennard –
Jones potential [27], which can be obtained from Eq. (28).
Dij 0.15610
ijij
1.06036 0.19300=
kTkT exp(0.47635 )
ij ij
1.03587 1.76474
kT kTexp(1.52996 ) exp(3.89411 )
(28)
where k is the Boltzmann constant which is equal to 1.38066 x 10²³ J K-1 and ij is the characteristic Lennard–Jones energy given by 1/2
ij i j( ) . The parameters used for calculation of
Dij are listed in the Table 1. Table 1. List of Lennard-Jones potentials used in calculation of Dij (taken from Tod et al., [29]).
Gas species CH4 H2O CO2 CO H2 N2 O2 ai 3.758 2.641 3.941 3.69 2.827 3.798 3.467 ai 148.6 809.1 195.2 91.7 59.7 71.4 106.7
The effective binary diffusion coefficient through the
porous electrode can be calculated from Eq. (29).
effij ijD = D
(29)

Journal of Sustainable Energy & Environment 1 (2010) 185-196
Copyright @ 2010 By Journal of Sustainable Energy and Environment 189
Considering again Eq. (22) above, the second term on the right-hand side of Eq. (22) is called the permeation flux and is applied to take into account the effect of total pressure gradient on mass transport. However, it is assumed in this study that the total pressure is uniform over the entire depth of the porous anode. Thus, the definite total pressure gradient term can be ignored. Consequently, only the diffusion flux is addressed such that Eq. (22) reduces to:
nj i - i ji i
eff effj=1,j ii,k ij
y N y NN dyP + = -
RT dxD D (30)
For diffusion with heterogeneous chemical reactions, the flux ratios are governed by reaction stoichiometry. Summing Eq. (30) over n species leads to Graham’s law of diffusion in gaseous mixtures [23].
n
i ii = 1
N M = 0 (31)
where Mi is the molecular weight of component i. For two binary component systems (H2(1)–H2O(2) Eq. (30) becomes :
1 2 1 - 1 2 1eff effi,k 12
N y N y N dyP + = -
RT dxD D (32)
Rearranging Eq. (32) gives
2 1 2 1 11 eff eff
i,k 12
y y N N dy1 PN + = -
RT dxD D
(33)
Because y2 = 1 – y1 and 2 1 1 2N N = - M /M
(Graham’s law), N1 can be written as follows : 1
1 11 eff eff
12 1,k
1- y dyP 1N = - +
RT dxD D
(34)
where 1 2 = 1- M /M , and the parameters 1M and 2M
are the molecular weight of species 1 and 2 respectively. For two binary component systems (H2(1)–H2O(2) Eq. (34)
becomes
2 2
2
2 2 2
1
H HH eff eff
H o H H ,k
1- y dyP 1N = - +
RT dxD D
(35)
where2 2H H O = 1- M /M . The parameters
2HM , and
2H OM are the molecular weight of H2 and H2O, respectively.
The 2
effH ,kD and
2 2
effH o HD are the effective Knudsen diffus
tituting Eq. (35) into Eq. (19), the governing equation of H2 concentration becomes
2
2
H HHeff eff effH O H H ,k H O H
d y dy1 - y +
dxdx D D D
2 2
2 2 2 2
1 22
21
2,k 2
n,a H
eff effH H O H
A J RT y1v- = 02FP D D
2
2
2 1 (36)
Equation (36) is in the form of an ordinary differential equation, which can be solved by involving the following initial conditions.
In Eqs. (37) and (38), by recalling Dalton’s law of an
ideal gas, 2 2 H2
0H Hy = P P and the initial conditions are
following as:
IC.1 : 2 2H H ,bulkx 0
y y
(37)
IC.2:
2 2
H O H2 2 2,k
H H ,bulktotaleff eff
H
dy 1 y- RTJ 1=
dx 2FP D Dx = 0
(38)
The mole fraction of H2O can be written as,
2 2H O H y 1 - y (39)
Eq. (16) can be rewritten again as,
2
2ref eff effa a0,a i,a e,a H2
d zF = A J ( ) y expv RTdx
2
aH
(1 )ZFy exp
RT
(40)
The term AV in Eq. (40) relates to the electrode porosity and the particle radius as in Eq. (9). By combining Eqs. (9), (17) and (40) and thus varying the size of the electrode particles in the anode, the optimal size of the ion and electron conducting particles can be found. 2.1.2 Cathode side modeling
Similarly to the anode, the coupled electrochemical reactions and transport phenomena at the cathode can be determined as below:
2i,c e,ceff eff eff effc
i,c e,c v n,c i,c e,c2
dJ dJd = - = A J ( )
dx dxdx
(41)
2
2
2Oref eff effc c
v 0,c i,c e,c2 0O
Pd zF = A J ( ) exp
RTdx P
c(1 )ZFexp
RT
(42)
2
2
Oref ce,c v n,c v 0,c 0
O
P zFJ = -A J = -A J exp
RTP
c(1 )ZFexp
RT
(43)
Similarly to the anode, the boundary conditions for Eqs. (42) and (43) are:
effce,c total e,c total
dx = 0 , J = J , = - J
dx
and
effccat i,c total i,c total
d x = t , J = J , = J
dx
(44)
Because the flux of nitrogen does not participate only oxygen participates in the electrochemical reaction at the cathode. The concentration of O2 can be determined by a self-diffusion mechanism [30], and can be expressed below.
For oxygen self-diffusion on the cathode side,
2 2 2 2 2O c O O O OJ = -D C + y J (45)
2
2
2 2 2
O ,k(eff)O
O ,k(eff) O -N (eff)
D =
D + D (46)
where2OJ is oxygen mol flux (mol s-1),
2OC is oxygen
concentration (mol m-3) and 2Oy is oxygen mole fraction.
For one-dimensional diffusion,

Journal of Sustainable Energy & Environment 1 (2010) 185-196
Copyright @ 2010 By Journal of Sustainable Energy and Environment 190
2
2 2 2 2 2
OO O (eff) O O O
dCJ = -D + y J
dx (47)
Because 2O e,cJ -J /4F and
2 2O OdC dp /RT , so
2
2 2 2
O e,c
c O O O (eff) c
dP RTJ = dx
P P 4FD P (48)
Integrating this equation with the boundary condition
2 2
0O OP = P at the cathode surface yields (O2 pressure at inlet
condition)
2 2 2
22 2
c O O O e,ccat0
O (eff) cc O O
P / P RTJln = t
4FD PP / P
(49)
Therefore, the partial pressure of oxygen at the cathode reaction sites is
2
2 22 2
O e,c cat0c cO O
O O c(eff) c
RTJ tP PP = - - P exp
4FD P
(50)
where O -N2 2
2 2
1cat + D
O (eff ) cat O ,k
1 1 =
D D
(51)
and 2c,eff O (eff )D = D (52)
The differential equation of Eq. (50) is
2
2
O e,cCeff
O C
dP RTJ = - (P -
dx 4FD P
2 2 2 2 2
eff eff effO ,k O ,k O -N O- (D /(D D )) P )
(53)
The boundary condition for the transporting of O2 Eq.
(53) is 2 2
0O OP = P at x = 0.
The cathode overpotential can be expressed as Eq. (54) [16].
cat
0 0t c i,c e,c i,c(x= t ) e,c(x=0), = ( - ) - ( - ) (54)
2.1.3 The electrolyte modeling
A dense electrolyte is used to conduct O2− and typically is made from Yttrial-Stabilized Zirconia (YSZ). The overpotential of the dense electrolyte can be determined by Ohm’s law,
elec total elec elec = J R t (55)
where Relec and telec are the resistivity (Ωm) and thickness (m) of the electrolyte respectively. 2.2 Parameters used in the model
SOFC modeling needs a number of parameters for calculation. We considered the model at steady state condition, with an operating pressure and temperature of 1 atm and 800C. The supplied fuel compositions are H2 and H2O which are oxidized by oxygen in the air. The dimensions of cell components and standard parameters used in the calculations are given in Table 2. 2.3 Mathematical model validation
To confirm the accountability of our numerical scheme, we validated our results with available experimental data [32]. The parameters used for validation are listed in Table 3. The predicted cell performance is compared with the experimental data found in the literature [32], and is shown in Fig 2. The performance of the cell is predicted when the cell is supplied with 95% H2 and 5% H2O, while operating at a temperature and pressure of 800°C and 1 atm, respectively. Oxygen in the ambient air is used as oxidant. It can be seen that the present model predictions agree well with the experimental results. Most parameters used in the model validation are obtained from
Rogers et al. [32]. However, some parameters such as particle size, volumetric fraction of electronic and ionic conducting particle recommended by Hussain et al. [19] are used in place of unavailable parameters in Roger et al’s work. The value of these parameters (particle sizes, volumetric fraction of electronic and ionic conducting particle etc.) recommended by Hussain et al. are typically used in other researches [16-22, 28, 30]. The value of tortuosity is varied to obtain the best agreement between the present model predictions and the experimental results as shown in Fig. 2. The typical tortuosity value for SOFC electrodes is in the range of 2 – 6 [33]. Hence, the tortuosity value of 2.75 used in the present model predictions is still in the typical range.
Current density (A cm-2)
0.0 0.5 1.0 1.5 2.0 2.5 3.0
Cel
l vol
tage
(V
)0.3
0.4
0.5
0.6
0.7
0.8
0.9
1.0
1.1
1.2
Experimental data (Rogers et al.)Model predictions
Figure 2. The comparison between the model predictions and experimental results of Rogers et al. [32]. Table 2. Standard parameters used in this study.
Parameters Values Operating temperature, T (C) 800 Operating pressure, P (atm) 1 H2 and H2O in fuel mixture inlet mole fraction 0.95, 0.05 O2 and N2 in air inlet mole fraction 0.21, 0.79 Anode thickness, ta (m) 2000 Anode tortuosity, a [21] 4.5 Anode pore radius (rp) (μm.) 0.5 Cathode thickness, tc (m) 60 Cathode tortuosity, c [21] 4.5 Cathode pore radius, rp (μm.) 0.5 Electrolyte thickness, telec (m) 60 Contact angle between e- and O2- conducting particles, (º) [16, 19]
15
Reference anode exchange current density, ref0,aJ (A m-
2) [19] 400
Reference cathode exchange current density, ref0,cJ
(A/m-2) [19] 1320
Total average particle coordination number in electrode, Z [16,19]
6
Charge transfer coefficient, [31] 0.5 Conductivity of electronic conductor of anode, e,a
(Sm-1) [21] 2e6
Conductivity of electronic conductor of cathode,
e,c (Sm-1) [22] 1e4
Conductivity of ionic conductor of anode, i,a (Sm-1)
[16,21]
3.44e4*(exp(-10300/T))
Conductivity of ionic conductor of cathode, i,c
(Sm-1) [16,21]
3.44e4*(exp(-10300/T))
Faraday constant, F (C mol-1) [16,21] 96485
3. Results and Discussion
This numerical study was employed to gain an
understanding of the coupled mass transfer and electrochemical

Journal of Sustainable Energy & Environment 1 (2010) 185-196
Copyright @ 2010 By Journal of Sustainable Energy and Environment 191
phenomena in the electrodes of SOFCs. The present study reveals the working mechanisms of SOFC at the micro-scale level, while demonstrating the use of microstructure relationships to enhance the SOFC performance. Moreover, parametric analyses were performed to investigate the effects of operating parameters on SOFC performance. The optimal volumetric ratio between the ionic and electronic conducting particles is also proposed in this study. At present, the most favorable anode-supported configuration with thick anode and thin cathode/electrolyte is considered. The fuel, air composition, and the model parameters from the data available in the literatures used in the simulation are listed in Table 2. The simulation results are shown below in figs 3-8.
3.1 The effect of electrode microstructure parameters on the SOFC overpotentials
In this section, the electrode porosities and particle radius sizes are analyzed. From Eq. (9), it is indicated that the electrode porosity () and particle radius size (rel, rio) are mutually dependent. For simplicity in our study, we then defined that rio and rel are of equal radius. Firstly, we considered the effect of electrode porosity and its corresponding particle radius on the electrode overpotential. For each case, the volume fraction of electron conducting particles (φ) of both porous electrodes is equal to 0.6. Figure 3 shows the effect of porosities and corresponding particle radiipair on anode and cathode overpotentials. For the anode at this case, the optimal corresponding particle radius size is about 0.42 m at the an pair of about 0.59. Similarly for the cathode at this case the optimum corresponding particle size is about 0.43 m at the cat pair of about 0.59.
In general, the smaller the size of particle the larger the active surface area for electrochemical reaction of the electrode (AV) (indicated by Eq. (2) and Eq. (7)). Therefore, reducing particle size can increase the electrode reactivity and thus reduce the electrode activation overpotential. However, when the particle size is too
small, the reactant concentration at the reactive sites will approach zero and thus the concentration overpotential will increase considerably. Similarly, when considering electrode porosity, reducing porosity can reduce the ohmic overpotential as more solid particles are available to facilitate the transport of electronic and ionic charges. In addition, the activation overpotential is also reduced with decreasing porosity due to the increase in reactive .
Table 3. Parameters used for model validation.
Operating temperature, T (C) 800 Total pressure, P (atm) 1 Fuel composition, xH2, xH2O 0.95, 0.05Air composition, xO2, xN2 0.21, 0.79Anode conductivity, a (S/m) 71428.57 Cathode conductivity, σc (S/m) 5376.34 Electrolyte conductivity, κelec (S/m) 0.64 Anode electrode layer thickness, ta (m) 1000.0 Cathode electrode layer thickness, tc (m) 50.0 Electrolyte thickness, te (m) 10.0 Porosity of anode and cathode, ε 0.375 Tortuosity of anode and cathode, τ 2.75 Pore radius of anode and cathode, rp (μm.) 0.75 Contact angle between e- and O2- conducting particles, ( º ) [19] 15 Radius of electronic conducting particle, rel (μm) [19] 0.1 Radius of ionic conducting particle, rio (μm) [19] 0.1 Volume fraction of electronic conducting particle, φ [19] 0.5 Volume fraction of ionic conducting particle, 1- φ [19] 0.5 Reference H2 concentration, cH2,ref (mol m-3) [19] 10.78 Reference O2 concentration, cO2,ref (mol m-3) [19] 2.38 Reference exchange current density for H2 oxidation,
2H0,refJ (A m-2) [19] 1320
Reference exchange current density for O2 reduction, 2O0,refJ
(A m-2) [19] 400
Reaction order for H2 oxidation, γH2 [19] 0.5 Reaction order for O2 reduction, γO2 [19] 0.5 Source: Rogers et al. [32]
Corresponding particle radiuses, ran (m.)
0.350 0.375 0.400 0.425 0.450 0.475 0.500
An
od
e o
verp
ote
nti
als
(V)
0.325
0.350
0.375
0.400
0.425
0.450
0.475
0.500
0.525
0.550
0.575
0.600= 0.6
Porosities, an
0.30 0.35 0.40 0.45 0.50 0.55 0.60 0.65 0.70 0.75
An
od
e o
verp
ote
nti
als
(V)
0.325
0.350
0.375
0.400
0.425
0.450
0.475
0.500
0.525
0.550
0.575
0.600 = 0.6
(a) (b)
Corresponding particle radiuses, rcat (m.)
0.350 0.375 0.400 0.425 0.450 0.475 0.500
Cat
ho
de
ove
rpo
ten
tial
s (V
)
0.325
0.350
0.375
0.400
0.425
0.450
0.475
0.500
0.525
0.550
0.575
0.600 = 0.6
Porosities, cat
0.30 0.35 0.40 0.45 0.50 0.55 0.60 0.65 0.70 0.75
Cat
ho
de
ove
rpo
ten
tial
s (V
)
0.325
0.350
0.375
0.400
0.425
0.450
0.475
0.500
0.525
0.550
0.575
0.600 = 0.6
(c) (d)
Figure 3. Corresponding particle radii and porosities effect on anode (a,b) and cathode overpotentials (c,d).

Journal of Sustainable Energy & Environment 1 (2010) 185-196
Copyright @ 2010 By Journal of Sustainable Energy and Environment 192
surface area. However, the concentration overpotential increases with decreasing porosity due to diminishing of space available for gas transport. The combined effects of porosity on ohmic, activation, and concentration overpotentials for minimization of the overall overpotential result in an optimal porosity for the electrode.
The effect of increasing porosity when fixed solid fraction of the electrode means that the particle radius of the electrode decreases as shown in Eq. (9). This results in the reduction of the active surface area available for the electrochemical reaction as indicated by Eq. (2), so the reaction rate decreases resulting in an increase of the activation overpotential. Thus, the electrode porosities and corresponding particle radiiare mutually dependent in their effect on the overall SOFC overpotential. Therefore, minimizing the overall overpotentials resulting in an optimum of porosity and particle radius is very necessary and useful to enhance performance. Because the anode in an Anode-Supported SOFC is thicker than the cathode, the overpotential must be higher than the cathode, and the anode side will have more effect on cell performance than the cathode side for this kind of the SOFC.
Figure 4 shows effect of volume fraction of electron conducting particles (φ) on overpotentials. We considered the various fractions of φ at the various pairs of electrode porosities and corresponding particle radiuses. For simplicity, we defined rio as equal to rel. Because of our work, we considered an Anode – Supported SOFC, and mainly studied the anode side. Thus from Figure 4(a) and (b), for this case the results indicate that the minimum anode overpotential occurred at φ which is equal to 0.5 which occurs at an of about 0.57 at the corresponding pair of anode particle radius ran of about 0.43 μm. The result demonstrates the fact that the largest active area is achieved when the dimensions and volume fractions of the ion conducting and electron conducting particles are equal [16]. When φ equals 0.5, the volume fraction of ion conducting particles (1−φ) becomes equal to the volume fraction of electron conducting particles resulting in the largest active area for electrochemical reaction and hence the best performance. Moreover, the effective ionic and electronic conductivities in the reaction zone are functions of the volume fraction of electron conducting particles; increasing φ beyond 0.5 increases the effective electronic conductivity but decreases the effective ionic conductivity, which results in increasing the ohmic overpotential and thereby decreasing the cell performance.
Figure 5 shows the distribution of H2 molar fraction and H2O molar fraction in the anode region when the electrode properties of both anode and cathode are fixed at an and cat of about 0.59, φ of about 0.5, r of about 0.42 μm for anode and 0.43 μm for cathode; the other parameters for calculation are listed in Table 2. The concentration of H2 decreases considerably from the anode surface towards the anode and electrolyte interface while the concentration of H2O increases considerably from the anode surface towards the anode and electrolyte interface, indicating an importance of gas transport in thick anodes.
Figure 6 shows a mapping relation between the anode porosity (an) and the anode corresponding particle radius (ran) pairs that effect the anode activation overpotentials when all of the calculations are fixed and the design parameters are kept similar to the previous results listed in Table 2 except the value of φ on the anode and cathode side are fixed at 0.5. From figure 6, it can be seen that the lower anode overpotential occurs at the anode porosity (an) of about 0.4 to 0.7 and the corresponding particle radius pairs ranges between 0.4 -0.5 μm. Ni et al. [20] indicated that the SOFC with nearly spherical particle electrodes have radii ranging from 0.012 to 5.0 m in order to achieve porosity ranges between 0.3 to 0.7. For an electrode porosity of less than 0.3, the extent of overlap between spherical particles increases with decreasing porosity, causing the active surface area (Av) to decrease considerably with decreasing porosity [17,20]. Conversely, the increasing of the porosity then increases
the void fraction and decreases the solid fraction of the porous electrode resulting in the reduction of the active surface area (Av) available for the electrochemical reaction. Moreover, the effective ionic and electron conductivities of the porous electrode decrease with the increase of porosity, which results in the increase of ohmic overpotential. Although the concentration overpotential decreases with the increase of porosity due to the increased mass transport rates the cell performance decreases due to increased ohmic overpotential with porosity. Furthermore, for a porosity higher than 0.7, the electrode will suffer from poor particle connectivity, poor percolation and thus poor performance and causing the collapsing of electrodes [20,34]. Kenney and Karan [35] have indicated that the desirable porosity for high SOFC
Corresponding particle radiuses, ran (m.)
0.350 0.375 0.400 0.425 0.450 0.475 0.500
An
od
e o
verp
ote
nti
als
(V)
0.325
0.350
0.375
0.400
0.425
0.450
0.475
0.500
0.525
0.550
0.575
0.600 = 0.45 , 0.55 = 0.5 = 0.4 , 0.6
(a)
Porosities, an
0.30 0.35 0.40 0.45 0.50 0.55 0.60 0.65 0.70 0.75
An
od
e o
verp
ote
nti
als
(V)
0.325
0.350
0.375
0.400
0.425
0.450
0.475
0.500
0.525
0.550
0.575
0.600 = 0.45 , 0.55= 0.5 = 0.4 , 0.6
(b)
Figure 4. Anode corresponding particle radii and porosities effect on anode overpotentials at various volume fractions of electron (φ); (a) corresponding particle radii versus anode overpotentials; (b) porosities versus anode overpotentials.
Anode thickness (m)
0 2e-4 4e-4 6e-4 8e-4 1e-3 1e-3 1e-3 2e-3 2e-3 2e-3
Mo
le f
rac
tio
n
0.0
0.1
0.2
0.3
0.4
0.5
0.6
0.7
0.8
0.9
1.0
H2
H2O
Figure 5. H2 and H2O mole fraction distribution in the anode when the electrode properties of both anode and cathode are fixed at porosities of about 0.59 and volume fraction of electron conducting particles (φ) of about 0.5; and particle radii of about 0.42 μm for anode and 0.43 μm for cathode.
Journal of Sustainable Energy & Environment 1 (2010) 185-196
Copyright @ 2010 By Journal of Sustainable Energy and Environment 193
performance is in the range of 0.3–0.5 and also that an increase in porosity tends to smoothen the current density distribution. These observations can be explained by relating how porosity affects the effective ionic/electronic conductivities on the active reaction sites. The observed reduction in the average and maximum current density values with an increase in porosity can be attributed to the reduction in solid volume fraction, which results in less particle–particle contacts. This translates into a smaller number of active three phase boundary (TPB) for electrochemical reaction sites and, therefore, lowering the reaction rate for a given overpotential. Additionally, the increased porosity also reduces the effective electronic and ionic conductivity due to reduced solid fraction available for electron or ion transport. Further, an increase in porosity results in a facilitation of reactants diffusion, which minimizes the reactants transport limitation under the interconnect region and helps smoothen the current density distributions. Kenney and Karan [35] also reported that the best porosity to smoothen current density distribution is 0.5. Shi and Xue [36] show the relationship between the cell current density and the electrode porosity where the other parameters were fixed. Their results indicated that the high current density is in the porosity range of 0.5–0.8 and one can see that the maximum current densities are obtained when porosity reaches the values of about 0.75 under the pressure loss in the electrode of 1500 Pa. The extreme values of porosity are 0.2 and 0.9. These phenomena can be interpreted using the corresponding mass concentration distributions. When electrode porosity is 0.2, the permeability of the porous electrode reaches its minimum value and mass transport resistance reaches the highest value. As a result, the mass transport through the porous electrodes is difficult even with increased pressure. When the porosity increases to 0.9, the permeability of the porous electrode reaches its highest value and the mass transport resistance reaches the lowest value. However, the reactive surface area decreases due to the high electrode porosity leading to a low current density in this case.
-0.4-0.20.00.20.40.60.8
1.0
1.2
0.3500.375
0.4000.425
0.4500.475
0.500
0.300.35
0.400.45
0.500.55
0.600.65
0.70
An
od
e o
verp
ote
nti
al (
V)
Corresponding particle radius, ran (m.
︶
Porosity, an
-0.4 -0.2 0.0 0.2 0.4 0.6 0.8 1.0 1.2
Figure 6. Effect of anode porosity and corresponding anode particle radius on anode overpotential when the volume fraction of the electron conducting particle in both of electrodes (φ) are equal to 0.5.
Therefore, for the electrodes consisting of spherical particles, porosity between 0.3 and 0.7 is regarded as a practical range for good performance and good particle connectivity, but for a better performance of each cell the porosity must be matched with each corresponding pair of electrode particle radius size (indicated by Eq.(9)). Previous work did not regard the porosity and corresponding particle radius pairs [16,18,20-22,30,35-36]. They showed only that the performance i.e. current density and power density of the cell depended only on the particle radius sizes or on the electrode porosity. The results from our work are consistent with the practical range of both
electrode porosity and the particle radius, but our results regarded the relational pairs of the electrode porosity and the corresponding pairs of particle radius sizes. As such our results can be effective and useful for design and optimization of the electrode structure for maximizing cell performance.
3.2 The effect of operating parameters on the SOFC overpotentials
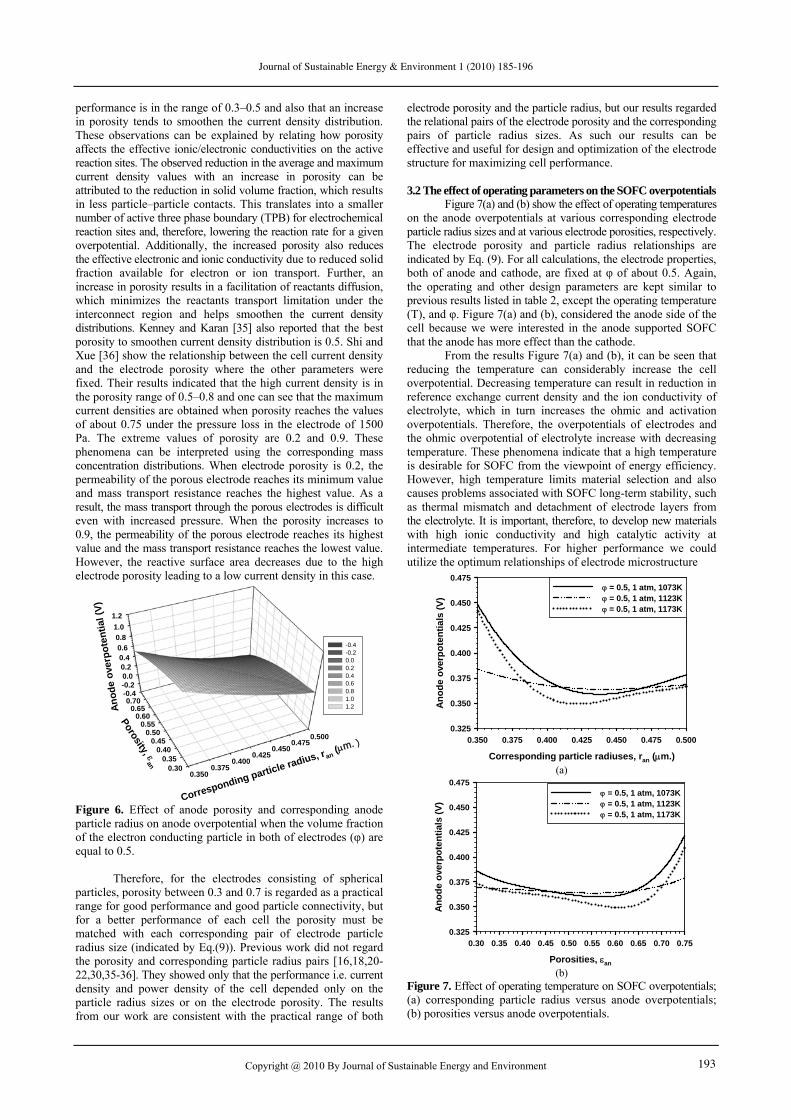
Figure 7(a) and (b) show the effect of operating temperatures on the anode overpotentials at various corresponding electrode particle radius sizes and at various electrode porosities, respectively. The electrode porosity and particle radius relationships are indicated by Eq. (9). For all calculations, the electrode properties, both of anode and cathode, are fixed at φ of about 0.5. Again, the operating and other design parameters are kept similar to previous results listed in table 2, except the operating temperature (T), and φ. Figure 7(a) and (b), considered the anode side of the cell because we were interested in the anode supported SOFC that the anode has more effect than the cathode.
From the results Figure 7(a) and (b), it can be seen that reducing the temperature can considerably increase the cell overpotential. Decreasing temperature can result in reduction in reference exchange current density and the ion conductivity of electrolyte, which in turn increases the ohmic and activation overpotentials. Therefore, the overpotentials of electrodes and the ohmic overpotential of electrolyte increase with decreasing temperature. These phenomena indicate that a high temperature is desirable for SOFC from the viewpoint of energy efficiency. However, high temperature limits material selection and also causes problems associated with SOFC long-term stability, such as thermal mismatch and detachment of electrode layers from the electrolyte. It is important, therefore, to develop new materials with high ionic conductivity and high catalytic activity at intermediate temperatures. For higher performance we could utilize the optimum relationships of electrode microstructure
Corresponding particle radiuses, ran (m.)
0.350 0.375 0.400 0.425 0.450 0.475 0.500
An
od
e o
verp
ote
nti
als
(V)
0.325
0.350
0.375
0.400
0.425
0.450
0.475 = 0.5, 1 atm, 1073K = 0.5, 1 atm, 1123K= 0.5, 1 atm, 1173K
(a)
Porosities, an
0.30 0.35 0.40 0.45 0.50 0.55 0.60 0.65 0.70 0.75
An
od
e o
verp
ote
nti
als
(V)
0.325
0.350
0.375
0.400
0.425
0.450
0.475 = 0.5, 1 atm, 1073K = 0.5, 1 atm, 1123K = 0.5, 1 atm, 1173K
(b)
Figure 7. Effect of operating temperature on SOFC overpotentials; (a) corresponding particle radius versus anode overpotentials; (b) porosities versus anode overpotentials.

Journal of Sustainable Energy & Environment 1 (2010) 185-196
Copyright @ 2010 By Journal of Sustainable Energy and Environment 194
parameters to enhance cell performance at higher temperatures, or develop new materials for utilizing cells at lower temperatures.
Figure 8(a) and (b) show the effect of operating pressure on the anode overpotential at various corresponding electrode particle radius sizes and the effect of operating pressure on the anode overpotential at various electrode porosities, respectively. The electrode porosity and particle radius relationships follow Eq. (9). For all calculations, the electrode properties, both of anode and cathode, are fixed at φ of about 0.5. Again the operating and other design parameters are kept similar to the previous results that are listed in table 2, except the operating pressure (P) and φ. From both results, it can be seen that at high pressure, the electrode overpotential is lower than at low pressure. With the increase of pressure, the reactant concentration at the reaction sites increases. This in turn enhances the rate of electrochemical reaction and the rate of mass transport resulting in the minimization of electrode overpotentials, and hence better performance. However, increase in pressure results in other problems, such as limitation on material selection, gas sealing, and mechanical strength of the cell components [31].
Corresponding particle radiuses, ran (m.)
0.350 0.375 0.400 0.425 0.450 0.475 0.500
An
od
e o
verp
ote
nti
als
(V)
0.2000.2250.2500.2750.3000.3250.3500.3750.4000.4250.4500.4750.5000.5250.5500.5750.600
= 0.5, 1073K, 1 atm = 0.5, 1073K, 3 atm = 0.5, 1073K, 5 atm
(a)
Porosities, an
0.30 0.35 0.40 0.45 0.50 0.55 0.60 0.65 0.70 0.75
An
od
e o
verp
ote
nti
als
(V)
0.2000.2250.2500.2750.3000.3250.3500.3750.4000.4250.4500.4750.5000.5250.5500.5750.600
= 0.5, 1073K, 1 atm = 0.5, 1073K, 3 atm = 0.5, 1073K, 5 atm
(b)
Figure 8. Effect of operating pressure on SOFC overpotentials; (a) corresponding particle radius versus anode overpotentials; (b) porosities versus anode overpotentials.
The modeling analysis shows that reducing the particle’s
size increases the volumetric active surface area, but adversely impedes the gas transport. There exist optimum particle sizes for both electrodes to achieve minimum overpotentials. Similar to the particle size effect, reducing electrode porosity has the opposite effect on activation and concentration overpotentials, and the ohmic overpotential can be decreased with decreasing porosity as more particles are available for electronic/ionic charge conduction. The combined effect results in a monotonic decrease in electrode overpotential with decreasing electrode porosity. From the relationship indicated by Eq. (9), the porosity and particle radius are mutually dependent on them for
better cell performance, not only dependent on the particle radius or the porosity, but on the optimum pair between them. In our study, the optimum pair is found in a wider range that provides the cell performance closely to the maximum cell capability. Moreover, the optimal values of volumetric fractions of electronic (φ) and ionic (1-φ) conducting particles in the electrode are also proposed in our work. In our study, for using the optimum value, it can enhance the cell performance and is best with the optimum pair of the electrode porosity and the corresponding electrode particle radius. In addition, the study results substantiate the fact that SOFC overpotential could be effectively decreased by increasing the operating temperature, as well as the operating pressure. Therefore, the concept of micro-model SOFC is feasible and has great potential to improve the SOFC performance by simply modifying the electrode microstructures.
4. Conclusions A micro-scale mathematical model of a Solid Oxide Fuel Cell (SOFC) has been developed to simulate the coupled electrochemical reactions and mass transfer involved in the SOFC operation. This model was developed for modeling the performance of SOFC with spherical-shaped particle electrodes. The important features of this model aim to determine the optimum relationships between porosity and electrode particle radius size or as it is called, the corresponding electrode particle radius, due to these two parameters being mutually dependent. The optimum pair of corresponding electrode particle radius can minimize the cell overpotentials. Apart from the optimum relationship of electrode particles size and porosity, this model is optimized for the electrode solid fraction between the volumetric fraction of ionic and electronic conducting particles. Furthermore, optimal values of the volumetric fraction of ionic and electronic particles were found to minimize electrode total overpotentials. At the optimal volumetric fraction of ionic and electronic conducting particles of the electrodes, parametric analyses were performed to investigate the effects of operating parameters on SOFC overpotentials. The results substantiated the fact that SOFC overpotentials could be effectively decreased by increasing the operating temperature and increasing the operating pressure. The present study reveals the working mechanisms of SOFC at the micro-scale level and demonstrates the promise of the use of microstructure relationships to enhance the SOFC performance by simply modifying the electrode. The model-predicted results are validated with the experimental data found in the literature. An excellent agreement is obtained between the predicted values and the measured data.
Acknowledgements
Authors would like to acknowledge with gratitude the financial support from the National Research University, the Thailand Higher Education Commission and the Thailand Research Fund.
Nomenclature
Av Electrochemically active surface area per unit volume (m2m-3) Dij Binary diffusion coefficient of the species i (m2s-1) Di,k Knudsen diffusion coefficient of the species i (m2s-1) F Faraday constant 96485 (C mol-1) Je Electronic current density (A m-2) Ji Ionic current density (A m-2) Jn Transfer current per unit area of reactive surface (A m−2)
ref0J Reference exchange current density of the electrode (A m−2)

Journal of Sustainable Energy & Environment 1 (2010) 185-196
Copyright @ 2010 By Journal of Sustainable Energy and Environment 195
H2refJ Reference exchange current density for H2 oxidation (A m-2)
O2refJ Reference exchange current density for O2 reduction (A m-2)
M Molecular weight (kg kmol-1) N Molar flux (mol m-2 s-1) nel Number fraction of electron conducting particle nio Number fraction of ion conducting particle nt Total number of particles per unit volume P Pressure (atm) pel Probabilities for an electron conducting particle to belong
to connecting ends of the composite pio Probabilities for an ion conducting particle to belong to
connecting ends of the composite Ri Reaction rate (mol m-3s-1)
r
Mean value of the pore radii (m) rel Radius of e- conducting particles (m) rio Radius of O2- conducting particles (m) rp Mean value of the pore radii of the electrode (m) T Temperature (K) t Thickness (m) y Molar fraction of species (mol mol-1) Z Total average particle coordination number in electrode Zel Coordination number of electron conducting particles Zio Coordination number of ion conducting particles Porosity Conductivity (S m-1) H2 Reaction order for H2 oxidation O2 Reaction order for O2 reduction ηa Anode overpotential (volt) c Cathode overpotential (volt) Tortuosity Charge transfer coefficient Electrode volume fraction of electron conducting particles
Subscripts a Anode c Cathode e Electronic conductor elec Electrolyte i Ionic conductor Superscripts eff Effective 0 The equilibrium state
References
[1] Singhal SC, Kendall K, High temperature solid oxide fuel
cells: fundamentals design and applications, Elsevier Ltd, Oxford, U.K. (2004).
[2] Larminie J, Dicks A, Fuel cell systems explained, John Wiley and Sons Ltd, Chichester (2003).
[3] Ramakrishna PA, Yang S, Sohn CH, Innovative design to improve the power density of a solid oxide fuel cell, Journal of Power Sources 158 (2006) 378–384.
[4] Koh YH, Sun JJ, Choi WY, Kim HE, Design and fabrication of three dimensional solid oxide fuel cells, Journal of Power Sources 161 (2006) 1023–1029.
[5] Yunzhen Yang, Guilan Wang, Haiou Zhang, Weisheng Xia, Computational analysis of thermo-fluid and electrochemical characteristics of MOLB-type SOFC stacks, Journal of Power Sources 173 (2007) 233–239.
[6] Hwang JJ, Chen CK, Lai DY, Computational analysis of species transport and electrochemical characteristics of a MOLB-type SOFC, Journal of Power Sources 140 (2005) 235–242.
[7] Hwang JJ, Chen CK, Lai DY, Detailed characteristic comparison between planar and MOLB-type SOFCs, Journal of Power Sources 143 (2005) 75–83.
[8] Huijsmans JPP, Van Berkel FPF, Christie GM, Intermediate temperature SOFC – a promise for the 21st century, Journal of Power Sources 71 (1998) 107–110.
[9] Choy K, Bai W, Charojrochkul S, Steele BCH, The development of intermediate – temperature solid oxide fuel cells for the next millennium, Journal of Power Sources 71 (1998) 361–369.
[10] Ralph JM, Schoeler AC, Krumpelt M, Materials for lower temperature solid oxide fuel cells, Journal of Materials Science 36 (2001) 1161–1172.
[11] Steele BCH, Materials for IT – SOFC stacks 35 years R&D: the inevitability of gradualness ?, Journal of Solid State Ionics 134 (2000) 3–20.
[12] Rabat H, Brault P, Plasma sputtering deposition of PEMFC porous carbon platinum electrodes, Fuel Cells 8 (2008) 81– 86.
[13] Beckel D, Bieberle-Hutter A, Harvey A, Infortuna A, Muecke UP, Prestat M, Rupp JLM, Gauckler LJ, Thin films for micro solid oxide fuel cells, Journal of Power Sources 173 (2007) 325–345.
[14] Morse JD, Jankowski AF, A novel thin film solid oxide fuel cell for micro scale energy conversion, American Society of Mechanical Engineers, International Mechanical Engineering Congress and Exposition, Nahsville, Tennessee November 15 - 20, 1999.
[15] Pederson LR, Singh P, Zhou X-D, Application of vacuum deposition methods to solid oxide fuel cells, Vacuum (Surface Engineering, Surface Instrumentation and Vacuum Technology) 80 (2006) 1066–1083.
[16] Costamagna P, Costa P, Antonucci V, Micro-modeling of solid oxide fuel cell electrodes, Electrochimica Acta 43 (1998) 375 – 394.
[17] Chen XJ, Chan SH, Khor KA, Simulation of a composite cathode in solid oxide fuel cells, Electrochimica Acta 49 (2004) 1851–1861.
[18] Deseure J, Bultel Y, Dessemond L, Siebert E, Theoretical optimization of a SOFC composite cathode, Electrochimica Acta 50 (2005) 2037–2046.
[19] Hussain MM, Li X, Dincer I, Mathematical modeling of planar solid oxide fuel cells, Journal of Power Sources 161 (2006) 1012–1022.
[20] Ni M, Leung MKH, Leung DYC, Micro-scale modeling of solid oxide fuel cells with micro-structurally graded electrodes, Journal of Power Sources 168 (2007) 369–378.
[21] Chan SH, Xia ZT, Anode micro model of solid oxide fuel cell, Journal of the Electrochemical Society 148 (2001) A388–A394.
[22] Chan SH, Chen XJ, Khor KA, Cathode micro model of solid oxide fuel cell, Journal of the Electrochemical Society 151 (2004) A164–A172.
[23] Krishna R, Wesselingh JA, The Maxwell - Stefan approach to mass transfer, Chemical Engineering Science 52/6 (1997) 861–911.
[24] Suwanwarangkul R, Croiset E, Fowler MW, Douglas PL, Entchev E, Douglas MA, Performance comparison of Fick’s, Dusty – Gas and Stefan – Maxwell models to predict the concentration overpotential of a SOFC anode, Journal of Power Sources 122 (2003) 9-18.
[25] Yakabe H, Hishinuma M, Uratani M, Matsuzaki Y, Yasuda I, Evaluation and modeling of performance of anode-supported solid oxide fuel cell, Journal of Power Sources 86 (2000) 423-431.
[26] Lehnert W, Meusinger J, Thom F, Modeling of gas transport phenomena in SOFC anodes, Journal of Power Sources 87 (2000) 57-63.

Journal of Sustainable Energy & Environment 1 (2010) 185-196
Copyright @ 2010 By Journal of Sustainable Energy and Environment 196
[27] Bird RB, Stewart WE, Lightfoot EN, Transport phenomena, Second edition, John Wiley and Sons, New York, U.S.A. (2001).
[28] Chan SH, Xia ZT, Polarization effects in electrolyte/electrode-supported solid oxide fuel cells, Journal of Applied Electrochemistry 32 (2002) 339–349.
[29] Tod B, Young JB, Thermodynamics and transport properties of gases for use in solid oxide fuel cell modeling, Journal of Power Sources 110 (2002) 186-200.
[30] Chan SH, Khor KA, Xia ZT, A complete polarization model of a solid oxide fuel cell and its sensitivity to the change of cell component thickness, Journal of Power Sources 93 (2001) 130-140.
[31] O’Hayre R, Won Cha S, Colella W, Prinz FB, Fuel cell fundamentals, John Wiley and Sons New York U.S.A. (2006).
[32] Rogers WA, Gemmen RS, Johnson C, Prinkey M, Shahnam M, Validation and application of a CFD-based
model for solid oxide fuel cells and stacks, Fuel Cell Sci. Eng. Technol. ASME (2003) 517–520.
[33] Iwata M, Hikosaka T, Morita M, Iwanari T, Ito K, Onda K, Esaki Y, Sakaki Y, Nagata S, Performance analysis of planar-type unit SOFC considering current and temperature distributions, Solid State Ionics 132 (2000) 297–308.
[34] Lee KR, Choi SH, Kim J, Lee HW, Lee JH, Viable image analyzing method to characterize the microstructure and the properties of the Ni/YSZ cermet anode of SOFC, Journal of Power Sources 140 (2005) 226–234.
[35] Kenney B, Karan K, Engineering of microstructure and design of a planar porous composite SOFC cathode: a numerical analysis, Solid State Ionics 178 (2007) 297-306.
[36] Shi J, Xue X, CFD analysis of a symmetrical planar SOFC with heterogeneous electrode properties, Electrochimica Acta 55 (2010) 5263–5273.