Mathematical Interventions for Secondary Students With ... file178 Exceptional Children 84(2)...
21
Exceptional Children 2018, Vol. 84(2) 177–196 © The Author(s) 2017 DOI: 10.1177/0014402917737467 journals.sagepub.com/home/ecx Article In an increasingly competitive job market, where the demand for mathematics-intensive science and engineering jobs is outpacing overall job growth three to one (National Mathematics Advisory Panel, 2008), the abil- ity to think mathematically is a crucial skill. Although the percentage of students reaching proficient levels in mathematics has increased over the past decade, it is disconcerting that, as children progress from the elementary grades into secondary grades, the mathematical gains made in elementary school are, on average, not matched in later years (National Mathematics Advisory Panel, 2008). For example, on the 2015 National Assessment of Educational Progress, only 33% of U.S. eighth-grade stu- dents, compared with 40% of fourth-grade stu- dents, were proficient or advanced in their knowledge of mathematics (National Center for Education Statistics, 2015). Further, the 2015 National Assessment of Educational Progress data indicated that the goal of the No Child Left Behind legislation to eradicate achievement differences among student sub- groups had not yet been met (Dossey, McCrone, & Halvorsen, 2016). For example, 45% of fourth graders with disabilities scored below the basic level on the 2015 National Assessment of Educational Progress, com- pared with 14% without disabilities; further, 68% of eighth graders with disabilities scored below the basic level versus 23% without dis- abilities. In addition, the National Longitudi- nal Transition Study-2 (Wagner, Newman, 737467ECX XX X 10.1177/0014402917737467Exceptional ChildrenJitendra et al. research-article 2017 1 University of Minnesota 2 Bellarmine University Corresponding Author: Asha K. Jitendra, University of Minnesota, 245 Education Sciences Building, 56 E. River Road, Minneapolis, MN 55455. E-mail: [email protected] Mathematical Interventions for Secondary Students With Learning Disabilities and Mathematics Difficulties: A Meta-Analysis Asha K. Jitendra 1 , Amy E. Lein 2 , Soo-hyun Im 1 , Ahmed A. Alghamdi 1 , Scott B. Hefte 1 , and John Mouanoutoua 1 Abstract This meta-analysis is the first to provide a quantitative synthesis of empirical evaluations of mathematical intervention programs implemented in secondary schools for students with learning disabilities and mathematics difficulties. Included studies used a treatment-control group design. A total of 19 experimental and quasi-experimental studies containing 20 independent samples met study inclusion criteria. Results of a random effects model analysis indicated that mathematical interventions influence mathematics outcomes (g = 0.37, 95% confidence interval [0.18, 0.56]) for students with learning disabilities and mathematics difficulties. In addition, instructional time moderated the relation between mathematics interventions and student learning. Limitations of the study, future directions for research, and implications for practice are discussed.
Transcript of Mathematical Interventions for Secondary Students With ... file178 Exceptional Children 84(2)...

https://doi.org/10.1177/0014402917737467
Exceptional Children2018, Vol. 84(2) 177 –196© The Author(s) 2017 DOI: 10.1177/0014402917737467journals.sagepub.com/home/ecx
Article
In an increasingly competitive job market, where the demand for mathematics-intensive science and engineering jobs is outpacing overall job growth three to one (National Mathematics Advisory Panel, 2008), the abil-ity to think mathematically is a crucial skill. Although the percentage of students reaching proficient levels in mathematics has increased over the past decade, it is disconcerting that, as children progress from the elementary grades into secondary grades, the mathematical gains made in elementary school are, on average, not matched in later years (National Mathematics Advisory Panel, 2008). For example, on the 2015 National Assessment of Educational Progress, only 33% of U.S. eighth-grade stu-dents, compared with 40% of fourth-grade stu-dents, were proficient or advanced in their knowledge of mathematics (National Center for Education Statistics, 2015). Further, the 2015 National Assessment of Educational
Progress data indicated that the goal of the No Child Left Behind legislation to eradicate achievement differences among student sub-groups had not yet been met (Dossey, McCrone, & Halvorsen, 2016). For example, 45% of fourth graders with disabilities scored below the basic level on the 2015 National Assessment of Educational Progress, com-pared with 14% without disabilities; further, 68% of eighth graders with disabilities scored below the basic level versus 23% without dis-abilities. In addition, the National Longitudi-nal Transition Study-2 (Wagner, Newman,
737467 ECXXXX10.1177/0014402917737467Exceptional ChildrenJitendra et al.research-article2017
1University of Minnesota2Bellarmine University
Corresponding Author:Asha K. Jitendra, University of Minnesota, 245 Education Sciences Building, 56 E. River Road, Minneapolis, MN 55455. E-mail: [email protected]
Mathematical Interventions for Secondary Students With Learning Disabilities and Mathematics Difficulties: A Meta-Analysis
Asha K. Jitendra1, Amy E. Lein2, Soo-hyun Im1, Ahmed A. Alghamdi1, Scott B. Hefte1, and John Mouanoutoua1
AbstractThis meta-analysis is the first to provide a quantitative synthesis of empirical evaluations of mathematical intervention programs implemented in secondary schools for students with learning disabilities and mathematics difficulties. Included studies used a treatment-control group design. A total of 19 experimental and quasi-experimental studies containing 20 independent samples met study inclusion criteria. Results of a random effects model analysis indicated that mathematical interventions influence mathematics outcomes (g = 0.37, 95% confidence interval [0.18, 0.56]) for students with learning disabilities and mathematics difficulties. In addition, instructional time moderated the relation between mathematics interventions and student learning. Limitations of the study, future directions for research, and implications for practice are discussed.
178 Exceptional Children 84(2)
Cameto, Levine, & Garza, 2006) found that secondary students with learning disabilities (LD) perform worse than their peers without disabilities on mathematics subtests.
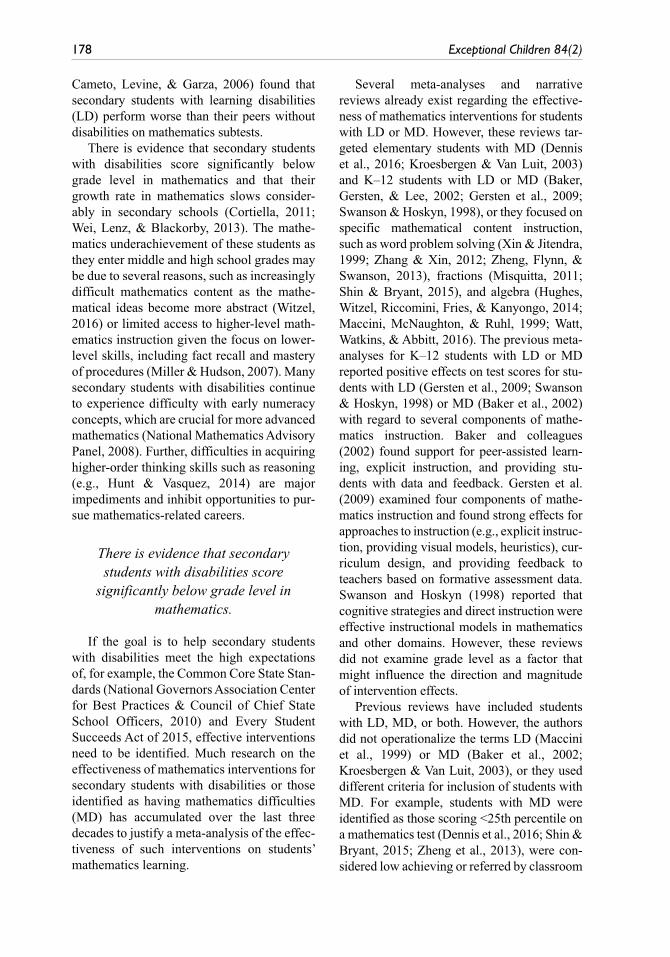
There is evidence that secondary students with disabilities score significantly below grade level in mathematics and that their growth rate in mathematics slows consider-ably in secondary schools (Cortiella, 2011; Wei, Lenz, & Blackorby, 2013). The mathe-matics underachievement of these students as they enter middle and high school grades may be due to several reasons, such as increasingly difficult mathematics content as the mathe-matical ideas become more abstract (Witzel, 2016) or limited access to higher-level math-ematics instruction given the focus on lower-level skills, including fact recall and mastery of procedures (Miller & Hudson, 2007). Many secondary students with disabilities continue to experience difficulty with early numeracy concepts, which are crucial for more advanced mathematics (National Mathematics Advisory Panel, 2008). Further, difficulties in acquiring higher-order thinking skills such as reasoning (e.g., Hunt & Vasquez, 2014) are major impediments and inhibit opportunities to pur-sue mathematics-related careers.
There is evidence that secondary students with disabilities score
significantly below grade level in mathematics.
If the goal is to help secondary students with disabilities meet the high expectations of, for example, the Common Core State Stan-dards (National Governors Association Center for Best Practices & Council of Chief State School Officers, 2010) and Every Student Succeeds Act of 2015, effective interventions need to be identified. Much research on the effectiveness of mathematics interventions for secondary students with disabilities or those identified as having mathematics difficulties (MD) has accumulated over the last three decades to justify a meta-analysis of the effec-tiveness of such interventions on students’ mathematics learning.
Several meta-analyses and narrative reviews already exist regarding the effective-ness of mathematics interventions for students with LD or MD. However, these reviews tar-geted elementary students with MD (Dennis et al., 2016; Kroesbergen & Van Luit, 2003) and K–12 students with LD or MD (Baker, Gersten, & Lee, 2002; Gersten et al., 2009; Swanson & Hoskyn, 1998), or they focused on specific mathematical content instruction, such as word problem solving (Xin & Jitendra, 1999; Zhang & Xin, 2012; Zheng, Flynn, & Swanson, 2013), fractions (Misquitta, 2011; Shin & Bryant, 2015), and algebra (Hughes, Witzel, Riccomini, Fries, & Kanyongo, 2014; Maccini, McNaughton, & Ruhl, 1999; Watt, Watkins, & Abbitt, 2016). The previous meta-analyses for K–12 students with LD or MD reported positive effects on test scores for stu-dents with LD (Gersten et al., 2009; Swanson & Hoskyn, 1998) or MD (Baker et al., 2002) with regard to several components of mathe-matics instruction. Baker and colleagues (2002) found support for peer-assisted learn-ing, explicit instruction, and providing stu-dents with data and feedback. Gersten et al. (2009) examined four components of mathe-matics instruction and found strong effects for approaches to instruction (e.g., explicit instruc-tion, providing visual models, heuristics), cur-riculum design, and providing feedback to teachers based on formative assessment data. Swanson and Hoskyn (1998) reported that cognitive strategies and direct instruction were effective instructional models in mathematics and other domains. However, these reviews did not examine grade level as a factor that might influence the direction and magnitude of intervention effects.
Previous reviews have included students with LD, MD, or both. However, the authors did not operationalize the terms LD (Maccini et al., 1999) or MD (Baker et al., 2002; Kroesbergen & Van Luit, 2003), or they used different criteria for inclusion of students with MD. For example, students with MD were identified as those scoring <25th percentile on a mathematics test (Dennis et al., 2016; Shin & Bryant, 2015; Zheng et al., 2013), were con-sidered low achieving or referred by classroom

Jitendra et al. 179
teachers as being at risk for failure in mathe-matics (Zhang & Xin, 2012), were receiving remedial mathematics instruction (Shin & Bryant, 2015; Xin & Jitendra, 1999), or were classified as struggling learners (Hughes et al., 2014; Misquitta, 2011).
Another limitation of the previous reviews is the inconsistencies in calculating effect sizes that impede directly comparing effect sizes among reviews. For example, in two meta-anal-yses (Xin & Jitendra, 1999; Zhang & Xin, 2012), the authors included several single-group pre-test-posttest design studies and measured changes in scores from pre- to postintervention. There are concerns with the use of change scores and the lack of a control group because matura-tion effects cannot be detected and standardized mean change effects would be inflated (Borman, Hewes, Overman, & Brown, 2003).
Our main objective was to conduct a meta-analysis of the effects of mathematics inter-ventions aimed at improving the mathematics performance of secondary students with LD and MD. Given the difficulties that secondary students with LD and MD experience with mathematics, there is a need to improve the understanding of research related to mathe-matics interventions across mathematical con-tent areas for this group of students. Although evidence suggests that students with mathe-matics LD and those with MD (i.e., scored below average to low average on tests of math achievement) are characteristically different (Mazzocco, 2007), they often encounter simi-lar challenges with mathematics that justify the need for high-quality instruction (Fuchs, Fuchs, & Compton, 2013). We found three recent narrative reviews (Hwang & Riccomini, 2016; Marita & Hord, 2017; Myers, Wang, Brownell, & Gagnon, 2015) of mathematics intervention research for secondary students with or at risk for LD, but we did not find a meta-analysis to date on this topic. These nar-rative reviews provide a summary of existing research (group and single-case studies) by taking a qualitative rather than quantitative approach. The three reviews extended the ear-lier review of the topic by Maccini, Mulcahy, and Wilson (2007). Hwang and Riccomini (2016) reviewed studies of mathematical prob-
lem solving and found that the efficacy of intervention approaches (heuristic, semantic, or authentic) varied and that these interven-tions differed with regard to real-world con-nections. Marita and Hord (2017) focused on interventions directed to students with LD and found that a variety of interventions, such as systematic instruction, problem-based learn-ing, and visual representations, can improve the problem-solving skills of students with LD. Finally, Myers and colleagues (2015) detailed several instructional approaches and noted the benefits of cognitive and metacogni-tive strategies and enhanced anchored instruc-tion for secondary students with LD.
The question of whether and to what extent mathematics interventions are effective for sec-ondary students with LD and MD has not been considered in the previous reviews. As such, there is a need to integrate the empirical research on mathematics interventions for secondary students with LD and MD and answer questions regarding their effectiveness. This can be addressed by a meta-analysis, as it can estimate the average effectiveness of mathematics inter-ventions on students’ mathematical learning. In addition, a meta-analysis can explore the types of settings or student populations for which the intervention works best. The present review sought to answer the following questions:
•• What is the average effect of mathe-matical interventions for secondary students with LD and MD?
•• Does it vary by student status (LD vs. MD)?
•• What instructional characteristics (e.g., setting, instructional time) or method-ological characteristics (e.g., research design, implementer, fidelity of imple-mentation [FOI]) of mathematical inter-ventions moderate student outcomes?
Method
Literature Search and Criteria for Inclusion
We conducted a literature search of mathemat-ics intervention studies ending in May 2017.

180 Exceptional Children 84(2)
First, we included the online databases ERIC, PsycINFO, and ProQuest Dissertation and Theses. We searched abstracts for key popula-tion search terms and roots (learning dis-abilit*, learning difficult*, at-risk, struggling, learning problem, underperforming, below average, underachieving, disadvantaged) in conjunction with mathematics search terms and roots (math, mathematic*, intervention, instruction, treatment, training, teaching method*) and grade search terms (middle school, high school, secondary, adolescent*) in various combinations. Second, we scanned the reference sections of each study to locate other possible studies, as well as the reference sections of existing meta-analyses and review studies on this topic. Third, we hand-searched key journals in special education from 2016 to 2017: Exceptional Children, Journal of Learn-ing Disabilities, The Journal of Special Educa-tion, Learning Disability Quarterly, Learning Disabilities Research & Practice, and Reme-dial and Special Education.
The primary literature search yielded 3,355 abstracts for screening, and after removal of duplicate abstracts, 3,175 abstracts remained. Of these, 2,970 were not considered per title and abstract review. The remaining 205 stud-ies retrieved in the primary search appeared to match the selection criteria based on their titles and abstracts. However, most of the selected studies were removed after retrieval of their full-text versions, either because studies were outside the age/grade range of this meta-analy-sis (n = 46) or did not have a suitable research design (no control group, correlational studies; n = 83). Moreover, 12 reports were reviews, editorials, or commentaries, and 19 studies included all students but did not contain a suf-ficient sample of students identified as having LD or did not identify students as MD based on standardized test scores. For 26 studies, there were other reasons for exclusion, such as dissertations that were published and studies that did not focus on mathematical interven-tions or did not provide sufficient information to compute effect sizes. The primary search resulted in a total of 19 relevant studies.
We applied seven criteria for inclusion in this meta-analysis. First, participants had to
be identified with a learning disability (school or researcher identified) or mathematics diffi-culty. We operationally defined students as having MD when they scored ≤35th percen-tile on a standardized mathematics test. This criterion was selected to ensure broad repre-sentation of students who may be at low to high risk of developing MD (see Fuchs et al., 2014; Mazzocco, 2007). We included studies when >50% of the participants were students with LD or MD or disaggregated data were provided for students identified as such.
Second, the studies had to involve students with LD or MD in Grades 6 to 12. The third cri-terion was that studies were based on a random-ized controlled trial (RCT) or quasi-experimental design and that they compared students in treat-ment groups taught via a specific mathematics intervention with those in control groups who were taught via standard methods or an alterna-tive intervention. Fourth, studies could have been conducted in any country, but the report had to be available in English. Fifth, to be included, studies had to evaluate the effects of mathematics interventions or programs on learn-ing of mathematical subjects. The sixth criterion is based on studies providing the necessary quantitative information to estimate effect sizes. Last, the dependent measures had to include quantitative measures of mathematics perfor-mance. Studies were excluded if they examined only measures of student attitudes toward math-ematics or strategy use.
Coding Procedure and Intercoder Agreement
Two authors developed a coding form to extract and record relevant information from each study. We evaluated the form multiple times in repetitive cycles in consultation with the coders. Then we coded studies for instruc-tional and methodological characteristics.
Instructional Characteristics
Participants. We coded how students with LD or MD were identified, using open-ended items (LD or MD as described in text, criteria for classifying students with MD). We also

Jitendra et al. 181
coded participants’ grade as middle school (Grades 6–8), high school (Grades 9–12), or combined.
Intervention approaches. We examined written descriptions of interventions used in the stud-ies. Interventions varied in their approaches and sometimes included a combination of approaches; however, most studies included explicit and systematic instruction. We coded intervention approaches as a categorical vari-able: (a) visual models only (e.g., fraction circles or squares, manipulative objects, dia-grams, mental representations); (b) visual models combined with other strategies, such as priming the underlying problem structure, cognitive strategy, or contextualized instruc-tion (problems used real-world scenarios); (c) computer-based modules (e.g., videos) com-bined with visual models or contextualized instruction; and (d) other (i.e., problem-based learning, peer-assisted learning strategies and curriculum-based instruction, question-and-answer strategy).
Intervention features. We gathered information on intervention features using three open-ended items (i.e., setting, implementation of the intervention, instructional time). We coded instructional setting as general education classroom, special education classroom, or combined. We coded implementation of the intervention as a dichotomous variable, with instruction conducted in small groups (<10 students) or large groups (≥10 students). We coded the time of treatment implementation in hours and then categorized it as ≤10 hr or >10 hr. Specifically, we calculated instructional time as the hours of intervention across the duration of the intervention (i.e., number of sessions multiplied by the length of each session).
Mathematical topic. We coded the mathemati-cal topic of instruction as a categorical variable with the following categories, based on the Common Core State Standards for mathemat-ics (National Governors Association Center for Best Practices & Council of Chief State School Officers, 2010): (a) foundational skills and
concepts, such as operations and algebraic thinking (e.g., arithmetic word problem solv-ing) and number system (e.g., fractions, deci-mals), and (b) higher-level mathematics topics (i.e., ratio and proportional relationships, expressions and equations). The higher-level mathematics category also included studies that encompassed several mathematical topics or a combination of foundational and higher-level topics (e.g., number system, ratio and proportional relationships, measurement and data).
Methodological Characteristics
We coded the type of report or publication source as a dichotomous variable (journal article, unpublished report). We coded the year of publication as either 2000 and before or 2001 and later. We created a dichotomous variable to code research design as RCT ver-sus quasi-experimental. RCTs referred to studies in which students, teachers or class-rooms, or schools were randomly assigned to conditions and the level of random assign-ment determined the unit of analysis. In con-trast, quasi-experiments may also have used random assignment at the teacher or class-room and school levels, but the analysis was done at the student level because of limited samples of classrooms or schools. We coded studies to identify who delivered the interven-tion to students: researcher or school person-nel. In addition, we created a dichotomous variable to code FOI as either reported (yes) or not reported (no). We coded FOI when studies reported this information, and we recorded the percentage of FOI. We catego-rized the types of measures as being researcher developed or standardized. We examined the type of control group as a proxy variable for the strength of the control condition or the counterfactual with regard to its effect on observed treatment effects. We coded this variable as either business as usual (BAU; tra-ditional textbook method) or an alternative intervention.
Four coders received training from a researcher with experience in coding on the use and interpretation of each item, with several

182 Exceptional Children 84(2)
examples provided. Coders practiced by inde-pendently coding the same article, and they dis-cussed discrepancies and checked reliability by comparing their ratings with that of the researcher. The training continued until ≥90% agreement was reached. The four coders inde-pendently coded the studies; all studies and effect sizes were double-coded by two coders. The coders discussed any discrepancies in cod-ing and resolved differences by either reexam-ining the studies to settle on the most appropriate coding or consulting with the first author when the disagreement could not be resolved. The intercoder agreement was 88% for all studies and 98% for all effect sizes.
Effect-Size Calculation
We used Hedges’s g, a measure of effect size, for each study in this meta-analysis because the samples in many of the studies were small and Hedges’s g correction was used to reduce this small sample size bias. We first calculated effect sizes as the difference between treat-ment and control groups’ posttests after adjust-ments for pretests and other covariates, divided by the pooled standard deviation; then, we applied the Hedges’s g correction to all effect sizes to adjust for the small sample size (Borenstein, Hedges, Higgins, & Rothstein, 2009). We extracted adjusted effect sizes, which were either based on means of gain scores (i.e., posttests – pretests) and standard deviations of pretest scores or based on covari-ance-adjusted means and unadjusted standard deviations (see What Works Clearinghouse, 2014). For three studies that reported only the treatment and comparison groups’ mean post-test scores, standard deviation, and sample sizes, we calculated unadjusted effect sizes, which do not take into account other variables that might have had an influence on the out-comes. In one case (Ives, 2007), no means and standard deviations were available, and we estimated g from the F statistics (Lipsey & Wilson, 2001).
We used independent samples as the unit of analysis to address effect size dependency issues. For example, we coded Manalo, Bunnell, and Stillman (2000) as two independent studies,
each based on a different sample. In addition, we extracted effect sizes for each outcome, and when studies included more than one outcome measure that qualified for inclusion in the meta-analysis, we calculated separate effect sizes for each outcome. However, when estimating the overall effect of mathematics interventions, we averaged the effect sizes from all measures so that the sample contributed only one effect size to the analysis.
Data Analysis
We used Comprehensive Meta-Analysis soft-ware (Borenstein, Hedges, Higgins, & Rothstein, 2011) for data analysis. We selected a random effects model to analyze the effect sizes and com-pute estimates of mean effects and standard errors, as this model allows for generalizations to be made beyond the studies included in the anal-ysis to the population of studies from which they come (Card, 2012).
We also conducted an analysis of publica-tion bias, especially given that our unpub-lished studies were primarily dissertations, meaning that we cannot rule out the possibil-ity that other studies with nonsignificant findings may have been excluded. Therefore, we first conducted an analysis of publication bias by visually inspecting a funnel plot illustrating the relation between effect size and study size or precision (standard error of the effect estimate). This approach would suggest a possible presence of publication bias if there is a gap indicating missing stud-ies on the left side of the distribution. Sec-ond, to further assess for publication bias, we used Duval and Tweedie’s (2000) trim-and-fill procedure, which is available as part of the Comprehensive Meta-Analysis software.
We evaluated heterogeneity of variance using the Q statistic and conducted testing for moderators only when statistically significant variance was found under the mixed effects model (Lipsey & Wilson, 2001). When stud-ies failed to provide sufficient data to code all moderator variables, we dropped those stud-ies from the moderator analysis for the vari-ables but included them in the overall estimate of the mean effect size. In addition, we

Jitendra et al. 183
included levels of each moderator in the mod-erator analysis only if the sample was ade-quately powered (five or more effect sizes; Borenstein et al., 2009). As such, our conclu-sions based on the moderator analyses are ten-tative because of low power.
Results
Characteristics of the Selected Studies
Table 1 summarizes the key features of each study. The literature search located 19 reports that met our study inclusion criteria, with the 19 reports providing 20 effect sizes. These studies spanned 27 years (1990–2017). The sample sizes in the reported studies ranged from 17 to 806, with a total sample size of 1,959. Of those with available ethnicity data (n = 1,416), 65% were White, and 35% were minorities (i.e., Black, Hispanic, Asian, American Indian, multiracial). Nine studies included middle school students; six involved high school students; and four included both. Fourteen studies (74%) involved students with LD. There were important differences among the studies that examined the efficacy of mathematics interventions for secondary school students with LD and MD: 79% were published in a peer-reviewed journal; 68% were RCTs; 63% were conducted after the articulation of the National Council of Teach-ers of Mathematics (2000) standards; in 68%, school personnel implemented the intervention; 63% included BAU as the con-trol group; 68% reported FOI; 63% were conducted in special education classrooms; and 63% addressed higher-level mathemati-cal content.
Overall Effects
Of the 20 overall effect sizes, 16 were in a positive direction, three in a negative direc-tion, and one exactly 0. The mean effect size, g = 0.37, was statistically significant (p < .001, 95% confidence interval [0.18, 0.56]), with the 20 effect sizes ranging from −1.10 to 1.83. In addition, the homogeneity test for
effect sizes was significant, Qb(19) = 58.7, p <
.001, suggesting that between-study variation in effect sizes is larger than what can be explained by sampling error alone. The mean effect size estimate for students with LD was 0.50, suggesting that the average student in the treatment group performed at about the 69th percentile of the control group; the mean effect size of 0.14 for students with MD sug-gests that the average student in the treatment group performed at about the 55th percentile of the control group. However, the moderator analysis comparing students with LD and those with MD was not statistically signifi-cant, Q
b(1) = 2.98, p = .08; therefore, student
status (LD or MD) did not moderate effect size. Thus, in what follows, we describe the aggregated results for students with LD and MD with regard to the effects of interventions on mathematics outcomes.
Examining Publication Bias
We first conducted a visual inspection of the funnel plot (Rothstein, Sutton, & Borenstein, 2005) to determine initial evidence of publi-cation bias based on asymmetrical distribu-tion of studies around the mean effect sizes (Kepes, Banks, & Oh, 2014). Our funnel plot showed a symmetrical inverted funnel with larger studies toward the top and smaller stud-ies scattered at the bottom, suggesting the absence of bias. Next, we examined whether our meta-analytic effect size point estimate differed much from Duval and Tweedie’s (2000) trim-and-fill imputed effect size point estimate. Results showed no difference between the trim-and-fill imputed point esti-mate (0.37) and the random effects model point estimate (0.37). This suggests that there was an absence of publication bias, providing validity for our results.
Testing for Moderators on the Overall Effect Sizes
Table 2 summarizes the findings from the analysis of the moderator variables. Here we summarize the findings by key instructional and methodology characteristics and discuss

184
Tab
le 1
. St
udy
Cha
ract
eris
tics
Incl
uded
in t
he M
eta-
Ana
lysi
s.
Stud
yaR
esea
rch
desi
gnSa
mpl
e,
grad
eSe
ttin
gIO
I (n)
Inte
rven
tion
(n)
Inst
ruct
ion
time,
hr
Impl
emen
ter
Mat
h to
pic
FOI,
%ES
Bott
ge &
H
asse
lbri
ng
(199
3)
RC
TM
D, 9
Spec
ed
Smal
l gro
up
(7–8
)T
(15
): C
onte
xtua
lized
pr
oble
m in
stru
ctio
n vi
a vi
deod
isc
pres
enta
tion
C (
14):
BAU
(ke
ywor
d m
etho
d)
3.3
(5 s
essi
ons,
40
min
)T
each
erFr
actio
nsY
es (
98.0
)0.
14
Bott
ge e
t al
. (20
15)
RC
TM
D, 6
–8G
en e
dLa
rge
grou
p (M
= 2
0)T
(62
): En
hanc
ed a
ncho
red
inst
ruct
ion
(com
pute
r-ba
sed,
vid
eo-b
ased
, and
ha
nds-
on a
ctiv
ities
)
C (
72):
BAU
49.5
~82
.5 (
66
sess
ions
, 45–
75
min
)
Tea
cher
Rat
io a
nd
prop
ortio
nal
rela
tions
hips
, nu
mbe
r sy
stem
, st
atis
tics
and
prob
abili
ty,
geom
etry
Yes
(87
.0)
0.35
Butle
r, M
iller
, C
reha
n, B
abbi
tt,
& P
ierc
e (2
003)
QEX
LD, 6
–8Sp
ec e
dLa
rge
grou
p (1
2–13
)T
(26
): C
oncr
ete-
repr
esen
tatio
nal-a
bstr
act
C (
24):
Rep
rese
ntat
iona
l-ab
stra
ct
7.5
(10
sess
ions
, 45
min
)T
each
erFr
actio
nsY
es (
100)
0.22
Cal
hoon
& F
uchs
(2
003)
QEX
LD, 9
–12
Spec
ed
Smal
l gro
up
(M =
9.2
)T
(45
): PA
LS a
nd C
BM
C (
47):
BAU
15.0
(30
ses
sion
s,
30 m
in)
Tea
cher
Ope
ratio
ns a
nd
alge
brai
c th
inki
ng,
mea
sure
men
t, ge
omet
ry
Yes
(90
.0–
96.2
)0.
04
Hut
chin
son
(199
3)R
CT
LD, 8
–10
Spec
ed
Smal
l gro
up
(one
-to-
one)
T (
12):
Cog
nitiv
e st
rate
gy
inst
ruct
ion
and
visu
als
C (
8): B
AU
26.7
(40
ses
sion
s,
40 m
in)
Res
earc
her
Alg
ebra
No
1.22
Ives
(20
07)
RC
TLD
, 7–1
2Sp
ec e
dLa
rge
grou
p (~
10)
T (
14):
Gra
phic
org
aniz
ers
and
stra
tegy
inst
ruct
ion
C (
16):
Stra
tegy
inst
ruct
ion
3.3
(4 s
essi
ons,
50
min
)R
esea
rche
rA
lgeb
raN
o0.
58
Jiten
dra,
Dup
uis,
St
ar, &
Rod
rigu
ez
(201
6)
RC
TM
D, 7
Gen
ed
Larg
e gr
oup
(M
= 2
7.6)
T (
149)
: Sch
ema-
base
d in
stru
ctio
n
C (
111)
: BA
U
24.2
(30
ses
sion
s,
45–5
0 m
in)
Tea
cher
Rat
io a
nd
prop
ortio
nal
rela
tions
hips
Yes
(87
.0–
97.0
)0.
40
Jiten
dra,
Har
wel
l, D
upui
s, &
Kar
l (2
017)
RC
TM
D, 7
Gen
ed
Larg
e gr
oup
(M
= 2
4.0)
T (
399)
: Sch
ema-
base
d in
stru
ctio
n
C (
407)
: BA
U
24.2
(30
ses
sion
s,
45–5
0 m
in)
Tea
cher
Rat
io a
nd
prop
ortio
nal
rela
tions
hips
Yes
(68
.0)
0.26
(con
tinue
d)

185
(con
tinue
d)
Stud
yaR
esea
rch
desi
gnSa
mpl
e,
grad
eSe
ttin
gIO
I (n)
Inte
rven
tion
(n)
Inst
ruct
ion
time,
hr
Impl
emen
ter
Mat
h to
pic
FOI,
%ES
Kel
ly, G
erst
en, &
C
arni
ne (
1990
)R
CT
LD, 9
–11
Spec
ed
Smal
l gro
up
(7–8
)T
(12
): D
irec
t in
stru
ctio
n w
ith M
aste
ring
Dec
imal
s an
d Pe
rcen
ts v
ideo
disc
pro
gram
C (
16):
BAU
7.5
(10
sess
ions
, 45
min
)R
esea
rche
rFr
actio
nsY
es (
93.0
–94
.0)
0.88
Kon
old
(200
4)b
RC
TLD
, 6–1
2G
en e
d +
spe
c ed
Larg
e gr
oup
T (
37):
Con
cret
e-re
pres
enta
tiona
l-abs
trac
t an
d co
gniti
ve s
trat
egy
inst
ruct
ion
C (
24):
BAU
5.5
(11
sess
ions
, 30
min
)T
each
erEx
pres
sion
s an
d eq
uatio
nsY
es (
97.0
)0.
02
Lam
bert
(19
96)b
RC
TLD
, 9–1
2Sp
ec e
dSm
all g
roup
(M
= 9
)T
(38
): C
ogni
tive
stra
tegy
in
stru
ctio
n an
d vi
sual
s
C (
38):
BAU
7.3
(8 s
essi
ons,
55
min
)T
each
erW
hole
num
ber
oper
atio
ns,
frac
tions
, dec
imal
s,
perc
ent
No
0.11
Man
alo,
Bun
nell,
&
Still
man
(20
00)
(1)
RC
TLD
, 8N
ASm
all g
roup
(3
–5)
T (
9): P
roce
ss m
nem
onic
s
C (
8): D
emon
stra
tion
imita
tion
4.2
(10
sess
ions
, 25
min
)R
esea
rche
rW
hole
num
ber
com
puta
tions
in
volv
ing
all f
our
oper
atio
ns
No
− 0
.03
Man
alo
et a
l. (2
000)
(2)
RC
TLD
, 8N
ASm
all g
roup
(3
–5)
T (
9): P
roce
ss m
nem
onic
s
C (
8): D
emon
stra
tion
imita
tion
4.2
(10
sess
ions
, 25
min
)R
esea
rche
rW
hole
num
ber
com
puta
tions
in
volv
ing
all f
our
oper
atio
ns
No
−0.
22
Muo
neke
(20
01)b
QEX
LD, 9
–12
Spec
ed
Smal
l gro
up
(M =
8)
T (
26):
Que
stio
n-an
d-an
swer
st
rate
gy
C (
21):
BAU
24.0
~36
.0 (
16–2
4 se
ssio
ns, 9
0 m
in)
Tea
cher
Who
le n
umbe
r on
e-st
ep a
dditi
ve
wor
d pr
oble
ms;
tw
o-st
ep w
ord
prob
lem
s in
volv
ing
all f
our
oper
atio
ns
Yes
(85
.0)
1.35
Rod
gers
(20
11)b
QEX
MD
, 11
Spec
ed
Smal
l gro
up
(8–1
0)T
(18
): Pr
oble
m-b
ased
le
arni
ng a
nd t
radi
tiona
l m
ath
C (
17):
BAU
3.0
(4 s
essi
ons,
45
min
)N
AG
eom
etry
—pe
rim
eter
, are
a,
surf
ace
area
, vo
lum
e
No
−1.
10
Tab
le 1
. (co
ntin
ued)

186
Stud
yaR
esea
rch
desi
gnSa
mpl
e,
grad
eSe
ttin
gIO
I (n)
Inte
rven
tion
(n)
Inst
ruct
ion
time,
hr
Impl
emen
ter
Mat
h to
pic
FOI,
%ES
Wal
ker
& P
otee
t (1
989–
1990
)Q
EXLD
, 6–8
Spec
ed
Smal
l gro
up
(M =
8)
T (
33):
Dia
gram
mat
ic
C (
37):
BAU
(ke
ywor
d m
etho
d)
8.5
(17
sess
ions
, 30
min
)T
each
erO
ne-s
tep
addi
tive
wor
d pr
oble
ms
Yes
(10
0)0.
31
Witz
el, M
erce
r, &
M
iller
(20
03)
RC
TLD
, 6–7
Gen
ed
Larg
e gr
oup
(M
= 3
0)T
(34
): C
oncr
ete-
repr
esen
tatio
nal-a
bstr
act
C (
34):
Rep
rese
ntat
iona
l-ab
stra
ct
15.8
(19
ses
sion
s,
50 m
in)
Tea
cher
Expr
essi
ons
and
equa
tions
Yes
(10
0)0.
69
Woo
dwar
d,
Baxt
er, &
R
obin
son
(199
9)
QEX
LD, 8
–9Sp
ec e
dLa
rge
grou
p (2
1–23
)T
(21
): M
athe
mat
ics
in t
he
Min
d’s
Eye:
Mod
elin
g R
atio
nals
C (
23):
Mas
terin
g D
ecim
als
and
Perc
ents
vid
eodi
sc
prog
ram
16.7
(20
ses
sion
s,
50 m
in)
Tea
cher
Dec
imal
sN
o0.
00
Woo
dwar
d &
Br
own
(200
6)Q
EXLD
, 6G
en e
dLa
rge
grou
p (N
A)
T (
25):
Tra
nsiti
onal
m
athe
mat
ics
C (
28):
Con
nect
ed
mat
hem
atic
s pr
ogra
m
One
sch
ool y
ear
(55
min
dai
ly)
Tea
cher
Ope
ratio
ns a
nd
alge
brai
c th
inki
ng,
num
ber
syst
em,
mea
sure
men
t an
d da
ta, s
tatis
tics
and
prob
abili
ty,
geom
etry
Yes
(N
A)
1.13
Xin
, Jite
ndra
, &
Dea
tline
-Bu
chm
an (
2005
)
RC
TLD
, 6–8
Spec
ed
Smal
l gro
up
(4–7
)T
(11
): Sc
hem
a-ba
sed
inst
ruct
ion
C (
11):
Gen
eral
str
ateg
y in
stru
ctio
n
12.0
(12
ses
sion
s,
60 m
in)
Res
earc
her
Rat
io a
nd p
ropo
rtio
n w
ord
prob
lem
sY
es (
94.0
)1.
83
Not
e. IO
I = im
plem
enta
tion
of in
terv
entio
n; F
OI =
fide
lity
of im
plem
enta
tion;
ES
= e
ffect
siz
e; R
CT
= r
ando
miz
ed c
ontr
olle
d tr
ial;
MD
= m
athe
mat
ics
diffi
culti
es; s
pec
ed =
spe
cial
ed
ucat
ion
clas
sroo
m; T
= t
reat
men
t; C
= c
ontr
ol; B
AU
= b
usin
ess
as u
sual
; gen
ed
= g
ener
al e
duca
tion
clas
sroo
m; Q
EX =
qua
si-e
xper
imen
tal;
LD =
lear
ning
dis
abili
ty; P
ALS
and
C
BM =
pee
r-as
sist
ed le
arni
ng s
trat
egie
s an
d cu
rric
ulum
-bas
ed m
easu
rem
ent;
NA
= n
ot a
vaila
ble.
a Inde
pend
ent
sam
ple.
b Dis
sert
atio
n.
Tab
le 1
. (co
ntin
ued)

Jitendra et al. 187
Table 2. Testing for Moderators of Effect Sizes Based on Random Effects Model.
Variable k g SE 95% CI Qb
p
Instructional characteristicsGrade level 0.49 .48 Middle school 10 0.44 0.11 [0.23, 0.66] High school 6 0.23 0.29 [–0.34, 0.79] Combined 4 0.36 0.25 [–0.13, 0.85] Intervention approach 1.53 .22 Visuals only 6 0.28 0.13 [0.04, 0.53] Visuals + other strategies 8 0.52 0.14 [0.24, 0.80] CBM + other strategies 3 0.39 0.16 [0.09, 0.70] Other 3 0.10 0.61 [–1.09, 1.28] Instructional setting 0.07 .79 General education 5 0.46 0.12 [0.24, 0.69] Special education 12 0.41 0.18 [0.05, 0.77] General and special education 1 0.02 0.26 [–0.49, 0.53] Not specified 2 –0.13 0.34 [–0.79, 0.53] Implementation of intervention 0.00 .99 Large group 9 0.37 0.09 [0.20, 0.55] Small group 11 0.38 0.21 [–0.04, 0.79] Instructional time 5.74* .02 ≤10 hr 10 0.11 0.15 [–0.18, 0.39] >10 hr 10 0.58 0.13 [0.32, 0.84] Mathematics topic 0.01 .92 Foundational content 8 0.36 0.17 [0.02, 0.70] Higher-level content 12 0.38 0.12 [0.13, 0.62]
Methodological characteristicsYear of publication 0.64 .43 1990–2000 8 0.27 0.14 [0.00, 0.54] 2001–2017 12 0.42 0.13 [0.16, 0.67] Research design 0.15 .70 RCT 13 0.39 0.09 [0.20, 0.57] QEX 7 0.28 0.26 [–0.23, 0.79] Implementer 1.37 .24 Researcher 6 0.70 0.29 [0.14, 1.27] School personnel 13 0.35 0.08 [0.19, 0.52] Fidelity of implementation 2.43 .12 Yes 13 0.47 0.10 [0.27, 0.68] No 7 0.06 0.25 [–0.43, 0.54] Type of measure 0.12 .73 Researcher developed 19 0.39 0.11 [0.18, 0.59] Standardized 6 0.48 0.24 [0.01, 0.94] Type of control group 1.05 .30 Business as usual 12 0.29 0.11 [0.07, 0.50] Alternative intervention 8 0.53 0.21 [0.12, 0.93]
Note. k = number of effect sizes; CI = confidence interval; CBM = computer-based modules; RCT = randomized controlled trial; QEX = quasi-experimental.*p < .05. **p < .01. ***p < .001.

188 Exceptional Children 84(2)
outcomes that are based on five or more out-comes.
Instructional characteristics. We examined six key instructional characteristics: grade level, instructional approach, instructional setting, implementation of intervention, instructional time, and mathematical topic. The results by grade level showed no statistically significant difference (p = .48) between the mean effect size estimate for middle school studies (g = 0.44) and that for high school studies (g = 0.23). With regard to instructional approaches, the eight studies of visual models combined with other strategies (e.g., priming the under-lying problem structure, cognitive strategy) produced the largest effect size, 0.52, and the effect size for studies of only visual models was 0.28; however, the difference was not statistically significant (p = .22). The advan-tage of using these approaches, as compared with regular classroom instruction or alterna-tive approaches, was significant for both approaches, indicated by the fact that the con-fidence intervals of the effect sizes did not contain 0.
Effect sizes were similar for studies con-ducted in general education (g = 0.46) or spe-cial education settings (g = 0.41), and the difference was not statistically significant (p = .79). We also found no significant differences (p = .99) between large group (g = 0.37) and small group (g = 0.38) implementation of intervention. The effect of instructional time was found to be significant, Q
b(1) = 5.74, p =
.02. The mean effect size for instruction pro-vided for >10 hr (g = 0.58) was greater than that for instructional time ≤10 hr (g = 0.11). The effect of mathematical topic was not sig-nificant (p = .92), with similar effect sizes for studies addressing foundational content (g = 0.36) and higher-level content (g = 0.38).
Methodology characteristics. We examined six key methodology characteristics: year of pub-lication, research design, implementer, FOI, type of measure, and type of control group. By year of publication, the mean effect size estimate for studies conducted after 2000 was 0.42 and 0.27 for studies conducted between
1990 and 2000; this difference between means was not statistically significant (p = .43). In addition, the study design variable was not statistically significant (p = .70): The mean effect size estimate for RCT studies was 0.39, and that for quasi-experimental studies was 0.28. Researcher-implemented interventions yielded a large effect size, 0.70, whereas the mean effect size estimate for interventions implemented by school personnel was 0.35, indicating a small to moderate effect. How-ever, the contrast between means was not sta-tistically significant (p = .24), suggesting that treatment implementer did not moderate effect size. Results indicated a moderate effect size, 0.47, for studies reporting fidelity of intervention. In contrast, the mean effect size estimate for studies not reporting fidelity of intervention was 0.06, a small to negligible effect. However, the difference between means for the instructional variable of FOI was not significant.
Similarly, the type of measure was not sig-nificant (p = .73): Researcher-developed assessments and standardized assessments yielded small to moderate effect sizes (g = 0.39 and 0.48, respectively). With regard to type of control group, studies using BAU instruction yielded a small effect size, 0.29, whereas studies using alternative interven-tions indicated a moderate effect size, 0.53; however, the contrast between means was not statistically significant (p = .30).
Discussion
The purpose of this meta-analytic review was to extend prior evaluations of mathematical interventions for secondary students with LD and MD by quantifying intervention effec-tiveness in terms of effect sizes. The finding from this review indicates a small to moder-ate effect size (g = 0.37). An effect size of 0.37 can be interpreted as approximately 65% of students in the treatment group performing above the mean of students in the control group (Lipsey et al., 2012). Our finding that the interventions in these studies were effec-tive is largely congruent with the conclusion of prior reviews of mathematics interventions

Jitendra et al. 189
for K–12 students with or at risk for MD (Baker et al., 2002; Dennis et al., 2016; Ger-sten et al., 2009; Kroesbergen & Van Luit, 2003; Swanson & Hoskyn, 1998). In addition to the overall findings, this review examined the differential effects of mathematics inter-ventions on student mathematics outcomes by various instructional and methodological features.
Instructional Characteristics
The effect sizes for the following instructional characteristics were nearly identical: (a) gen-eral education and special education settings (g = 0.46 and 0.41, respectively), (b) large and small group implementation (g = 0.37 and 0.38, respectively), and (c) foundational con-tent and higher-level mathematical content (g = 0.36 and 0.38, respectively). These findings for setting, grouping, and mathematical topic are somewhat surprising given the different profiles of students with LD and MD served in general education and special education classrooms (Wagner, Marder, Blackorby, & Cardoso, 2002) and the different kinds of structures and mathematical topics covered in the two environments. However, the compa-rable findings would be expected if research-ers took these differences (e.g., large group instruction in general education classrooms, adding prerequisite knowledge to be learned) into account and designed appropriate inter-ventions.
With respect to the grade-level feature examined in this meta-analysis, research indi-cates that the mathematical skills of children with LD progress about 1 year for every 2 years in school but plateau by age 10 or 12 (Cawley, Parmar, Yan, & Miller, 1998; Wei et al., 2013). Further, the mathematics content targeted in high schools is more complex and advanced than the content in middle school. Note also that the average annual growth effect sizes for typically achieving students ranged from 0.30 in Grades 6 and 7 to 0.01 in Grades 11 and 12 on nationally normed mea-sures of mathematics achievement, indicating a decrease in effect sizes as grade level increases (see Bloom, Hill, Black, & Lipsey,
2008). Thus, one could argue that interven-tions would be expected to produce stronger effects for middle school than high school stu-dents. Although average effects for the two grade levels were aligned with this expecta-tion (i.e., middle school, g = 0.44, vs. high school, g = 0.23) and the advantage for middle school was significant (i.e., the confidence interval of the effect sizes did not contain 0), this contrast was not statistically significant. The most likely explanation for this finding has to do with the inability to include all stud-ies in these two levels of the variable for this moderator analysis, which could have decreased the statistical power of the meta-analysis.
In terms of intervention approaches, there are contrasting hypotheses to consider in exam-ining the results of the meta-analysis. On one hand, single-component interventions (visuals only) may by parsimonious and work best for students with LD and MD because of limited cognitive, behavioral, and attentional capaci-ties (e.g., Compton, Fuchs, Fuchs, Lambert, & Hamlett, 2011; Fuchs et al., 2014; Geary, Hoard, Byrd-Craven, Nugent, & Numtee, 2007). On the other, multicomponent interven-tions (i.e., visual models combined with other strategies) may produce stronger effects; meta-analysis of reading interventions support this expectation (see Wanzek, Wexler, Vaughn, & Ciullo, 2010). The results revealed a tendency toward this latter hypothesis (i.e., visuals only, g = 0.28, vs. visuals combined with other strat-egies, g = 0.52), but the contrast was not statis-tically significant. However, it is encouraging that the effect size for visuals combined with strategies is somewhat higher than the effect size (g = 0.47) found in Gersten et al. (2009).
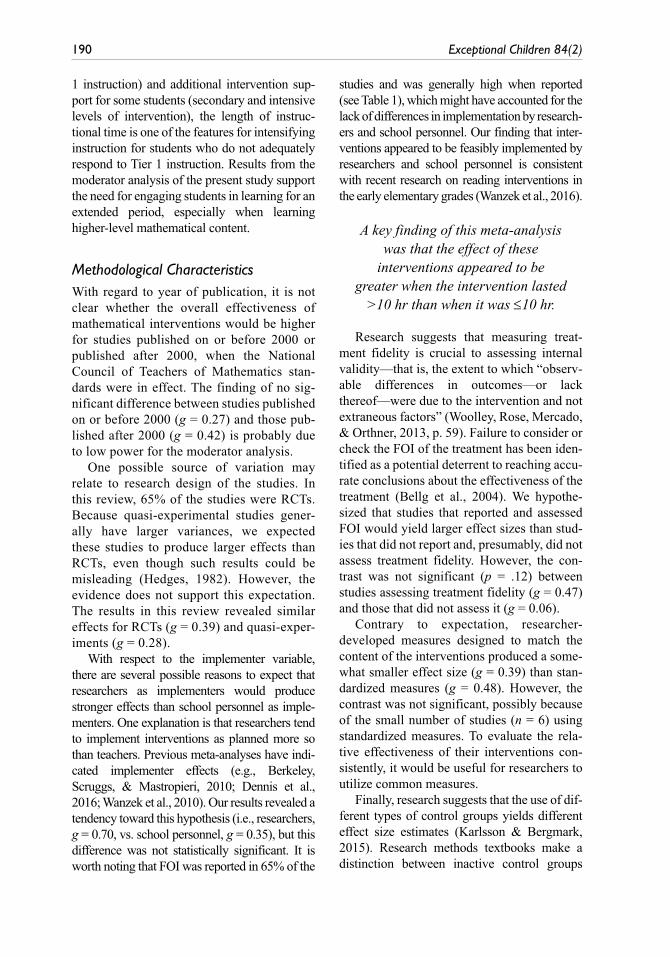
A key finding of this meta-analysis was that the effect of these interventions appeared to be greater when the intervention lasted >10 hr than when it was ≤10 hr. This finding is consistent with research regarding the length of instruc-tional time provided to students being an essen-tial variable to learning (Rosenshine & Berliner, 1978). Further, within the context of a multi-tiered system of support model, a framework for providing high-quality mathematical con-tent and instruction to all students (core or Tier
190 Exceptional Children 84(2)
1 instruction) and additional intervention sup-port for some students (secondary and intensive levels of intervention), the length of instruc-tional time is one of the features for intensifying instruction for students who do not adequately respond to Tier 1 instruction. Results from the moderator analysis of the present study support the need for engaging students in learning for an extended period, especially when learning higher-level mathematical content.
Methodological CharacteristicsWith regard to year of publication, it is not clear whether the overall effectiveness of mathematical interventions would be higher for studies published on or before 2000 or published after 2000, when the National Council of Teachers of Mathematics stan-dards were in effect. The finding of no sig-nificant difference between studies published on or before 2000 (g = 0.27) and those pub-lished after 2000 (g = 0.42) is probably due to low power for the moderator analysis.
One possible source of variation may relate to research design of the studies. In this review, 65% of the studies were RCTs. Because quasi-experimental studies gener-ally have larger variances, we expected these studies to produce larger effects than RCTs, even though such results could be misleading (Hedges, 1982). However, the evidence does not support this expectation. The results in this review revealed similar effects for RCTs (g = 0.39) and quasi-exper-iments (g = 0.28).
With respect to the implementer variable, there are several possible reasons to expect that researchers as implementers would produce stronger effects than school personnel as imple-menters. One explanation is that researchers tend to implement interventions as planned more so than teachers. Previous meta-analyses have indi-cated implementer effects (e.g., Berkeley, Scruggs, & Mastropieri, 2010; Dennis et al., 2016; Wanzek et al., 2010). Our results revealed a tendency toward this hypothesis (i.e., researchers, g = 0.70, vs. school personnel, g = 0.35), but this difference was not statistically significant. It is worth noting that FOI was reported in 65% of the
studies and was generally high when reported (see Table 1), which might have accounted for the lack of differences in implementation by research-ers and school personnel. Our finding that inter-ventions appeared to be feasibly implemented by researchers and school personnel is consistent with recent research on reading interventions in the early elementary grades (Wanzek et al., 2016).
A key finding of this meta-analysis was that the effect of these
interventions appeared to be greater when the intervention lasted
>10 hr than when it was ≤10 hr.
Research suggests that measuring treat-ment fidelity is crucial to assessing internal validity—that is, the extent to which “observ-able differences in outcomes—or lack thereof—were due to the intervention and not extraneous factors” (Woolley, Rose, Mercado, & Orthner, 2013, p. 59). Failure to consider or check the FOI of the treatment has been iden-tified as a potential deterrent to reaching accu-rate conclusions about the effectiveness of the treatment (Bellg et al., 2004). We hypothe-sized that studies that reported and assessed FOI would yield larger effect sizes than stud-ies that did not report and, presumably, did not assess treatment fidelity. However, the con-trast was not significant (p = .12) between studies assessing treatment fidelity (g = 0.47) and those that did not assess it (g = 0.06).
Contrary to expectation, researcher-developed measures designed to match the content of the interventions produced a some-what smaller effect size (g = 0.39) than stan-dardized measures (g = 0.48). However, the contrast was not significant, possibly because of the small number of studies (n = 6) using standardized measures. To evaluate the rela-tive effectiveness of their interventions con-sistently, it would be useful for researchers to utilize common measures.
Finally, research suggests that the use of dif-ferent types of control groups yields different effect size estimates (Karlsson & Bergmark, 2015). Research methods textbooks make a distinction between inactive control groups

Jitendra et al. 191
(e.g., no treatment, BAU or standard treatment, or a waiting-list control) and active control groups (e.g., an alternative intervention), which produce absolute and relative effect estimates, respectively. An additional distinction is that, compared with no-treatment controls, BAU often includes “some potentially effective com-ponents that may be absent in no-treatment controls” (p. 422). Therefore, and as expected, the more effective the comparison group com-ponents, the smaller the effect size estimates. However, we found no significant difference between studies using BAU controls (g = 0.29) and alternative intervention controls (g = 0.53). A possible explanation is that the BAU control condition in the included studies taught the same content and for the same duration as the treatment group.
Limitations and Future Directions
Similar to other meta-analyses and primary studies, there are at least three limitations that are relevant to the current meta-analysis. First, there is the possible limitation of generalizing results from the small set of RCT and quasi-experimental studies. Despite our exhaustive search process, including published and unpub-lished studies, we found only 19 studies in the past 27 years that focused on the outcome of secondary mathematics interventions for stu-dents with LD and MD. This number is rela-tively small compared to intervention studies of reading and other content areas. For example, prior meta-analyses identified 43 reading inter-vention studies and 28 science intervention studies for secondary students with disabilities (Scammacca, Roberts, Vaughn, & Stuebing, 2015; Scruggs, Mastropieri, Berkeley, & Graetz, 2010). Further, the effect of the small number of studies influenced results of the moderator analyses, which are lower powered than the main effect analysis (Hedges & Pigott, 2004). Future studies may reveal that our find-ing of no significant difference between the MD and LD groups is a product of having too few studies with too few participants. Given the increasing growth in jobs related to STEM (sci-ence, technology, engineering, and mathemat-ics) and how crucial it is for secondary students
with LD and MD to develop the necessary mathematics skills to enter or advance in STEM-related careers (see Hughes et al., 2014), we urge researchers to continue to conduct stud-ies that will provide evidence about effective interventions in mathematics for these students.
A second limitation is that we found only five studies of students with MD that met our inclusion criteria. Further, how students were identified as LD may account for the variabil-ity in effect sizes because most authors studied school-identified students, and, although they provided some description of the identification process, most did not provide sufficient infor-mation about these students’ MD. It is clear that in order to identify how to better meets the needs of students with LD and MD and improve intervention outcomes, more studies need to be conducted with these populations.
Another limitation is posed by the lack of availability of sufficient studies to inform the field about what intervention approaches are most effective. We found that the most com-monly used method in the studies included in this meta-analysis was visual representa-tions. Although not statistically significant, visuals combined with other strategies resulted in the largest effect size (g = 0.52), which is practically significant and can be interpreted as showing that approximately 70% of students in the treatment group per-formed above the mean of students in the control group (Lipsey et al., 2012). However, the strategies were varied (i.e., priming the underlying structure, cognitive strategy, or contextualized instruction), with few in each category. Additional testing of these inter-ventions needs to be addressed in future research.
Implications for Practice
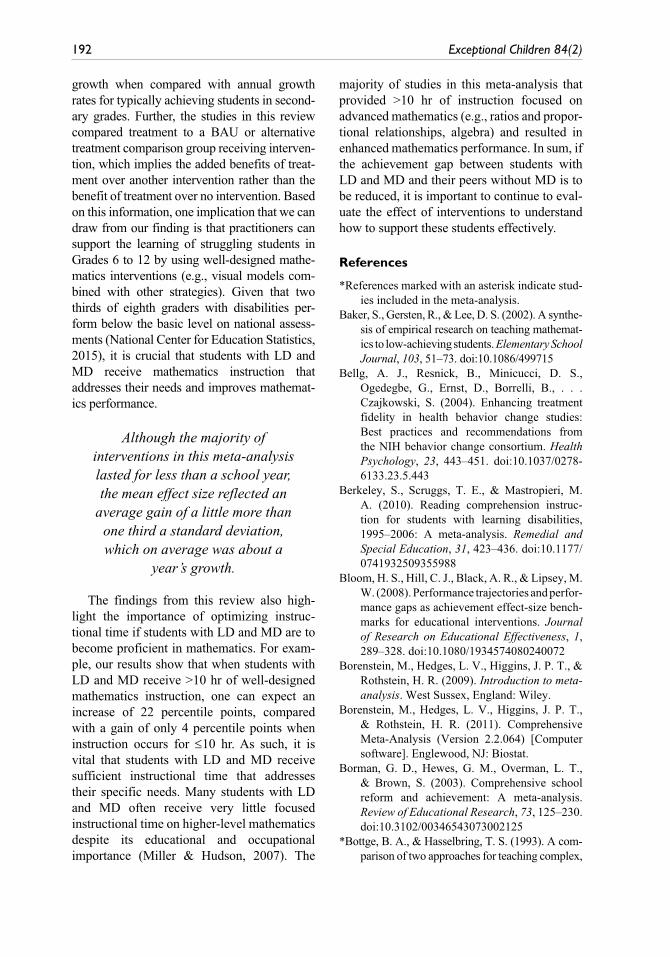
The results of this meta-analysis demonstrate that secondary students with LD and MD ben-efit from well-designed mathematics interven-tions. Although the majority of interventions in this meta-analysis lasted for less than a school year, the mean effect size reflected an average gain of a little more than one third a standard deviation, which on average was about a year’s
192 Exceptional Children 84(2)
growth when compared with annual growth rates for typically achieving students in second-ary grades. Further, the studies in this review compared treatment to a BAU or alternative treatment comparison group receiving interven-tion, which implies the added benefits of treat-ment over another intervention rather than the benefit of treatment over no intervention. Based on this information, one implication that we can draw from our finding is that practitioners can support the learning of struggling students in Grades 6 to 12 by using well-designed mathe-matics interventions (e.g., visual models com-bined with other strategies). Given that two thirds of eighth graders with disabilities per-form below the basic level on national assess-ments (National Center for Education Statistics, 2015), it is crucial that students with LD and MD receive mathematics instruction that addresses their needs and improves mathemat-ics performance.
Although the majority of interventions in this meta-analysis lasted for less than a school year, the mean effect size reflected an
average gain of a little more than one third a standard deviation, which on average was about a
year’s growth.
The findings from this review also high-light the importance of optimizing instruc-tional time if students with LD and MD are to become proficient in mathematics. For exam-ple, our results show that when students with LD and MD receive >10 hr of well-designed mathematics instruction, one can expect an increase of 22 percentile points, compared with a gain of only 4 percentile points when instruction occurs for ≤10 hr. As such, it is vital that students with LD and MD receive sufficient instructional time that addresses their specific needs. Many students with LD and MD often receive very little focused instructional time on higher-level mathematics despite its educational and occupational importance (Miller & Hudson, 2007). The
majority of studies in this meta-analysis that provided >10 hr of instruction focused on advanced mathematics (e.g., ratios and propor-tional relationships, algebra) and resulted in enhanced mathematics performance. In sum, if the achievement gap between students with LD and MD and their peers without MD is to be reduced, it is important to continue to eval-uate the effect of interventions to understand how to support these students effectively.
References
*References marked with an asterisk indicate stud-ies included in the meta-analysis.
Baker, S., Gersten, R., & Lee, D. S. (2002). A synthe-sis of empirical research on teaching mathemat-ics to low-achieving students. Elementary School Journal, 103, 51–73. doi:10.1086/499715
Bellg, A. J., Resnick, B., Minicucci, D. S., Ogedegbe, G., Ernst, D., Borrelli, B., . . . Czajkowski, S. (2004). Enhancing treatment fidelity in health behavior change studies: Best practices and recommendations from the NIH behavior change consortium. Health Psychology, 23, 443–451. doi:10.1037/0278-6133.23.5.443
Berkeley, S., Scruggs, T. E., & Mastropieri, M. A. (2010). Reading comprehension instruc-tion for students with learning disabilities, 1995–2006: A meta-analysis. Remedial and Special Education, 31, 423–436. doi:10.1177/ 0741932509355988
Bloom, H. S., Hill, C. J., Black, A. R., & Lipsey, M. W. (2008). Performance trajectories and perfor-mance gaps as achievement effect-size bench-marks for educational interventions. Journal of Research on Educational Effectiveness, 1, 289–328. doi:10.1080/1934574080240072
Borenstein, M., Hedges, L. V., Higgins, J. P. T., & Rothstein, H. R. (2009). Introduction to meta-analysis. West Sussex, England: Wiley.
Borenstein, M., Hedges, L. V., Higgins, J. P. T., & Rothstein, H. R. (2011). Comprehensive Meta-Analysis (Version 2.2.064) [Computer software]. Englewood, NJ: Biostat.
Borman, G. D., Hewes, G. M., Overman, L. T., & Brown, S. (2003). Comprehensive school reform and achievement: A meta-analysis. Review of Educational Research, 73, 125–230. doi:10.3102/00346543073002125
*Bottge, B. A., & Hasselbring, T. S. (1993). A com-parison of two approaches for teaching complex,

Jitendra et al. 193
authentic mathematics problems to adolescents in remedial math classes. Exceptional Children, 59, 556–566. doi:10.1177/001440299305900608
*Bottge, B. A., Toland, M. D., Gassaway, L., Butler, M., Choo, S., Griffen, A. K., & Ma, X. (2015). Impact of enhanced anchored instruc-tion in inclusive math classrooms. Exceptional Children, 81, 158–175. doi:10.1177/001 4402914551742
*Butler, F. M., Miller, S. P., Crehan, K., Babbitt, B., & Pierce, T. (2003). Fraction instruction for students with mathematics disabilities: Comparing two teaching sequences. Learning Disabilities Research & Practice, 18, 99–111. doi:10.1111/1540-5826.00066
*Calhoon, M. B., & Fuchs, L. S. (2003). The effects of peer-assisted learning strategies and curriculum-based measurement on the mathematics performance of secondary stu-dents with disabilities. Remedial and Special Education, 24, 235–245. doi:10.1177/07419325030240040601
Card, N. (2012). Applied meta-analysis for social science research. New York, NY: Guilford.
Cawley, J. F., Parmar, R. S., Yan, W., & Miller, J. H. (1998). Arithmetic computation per-formance of students with learning disabili-ties: Implications for curriculum. Learning Disabilities Research & Practice, 13, 68–74.
Compton, D. L., Fuchs, L. S., Fuchs, D., Lambert, W., & Hamlett, C. (2011). The cognitive and academic profiles of read-ing and mathematics learning disabilities. Journal of Learning Disabilities, 45, 79–95. doi:10.1177/0022219410393012
Cortiella, C. (2011). The state of learning dis-abilities. New York, NY: National Center for Learning Disabilities.
Dennis, M. S., Sharp, E., Chovanes, J., Thomas, A., Burns, R. M., Custer, B., & Park, J. (2016). A meta-analysis of empirical research on teaching students with mathematics learning difficulties. Learning Disabilities Research & Practice, 31, 156–168. doi:10.1111/ldrp.12107
Dossey, J., McCrone, S., & Halvorsen, K. (2016). Mathematics education in the United States 2016: A capsule summary book written for the Thirteenth International Congress on Mathematical Education (ICME-13). Reston, VA: National Council of Teachers of Mathematics.
Duval, S., & Tweedie, R. (2000). Trim and fill: A simple funnel-plot–based method of test-ing and adjusting for publication bias in
meta-analysis. Biometrics, 56, 455–463. doi:10.1111/j.0006-341X.2000.00455.x
Every Student Succeeds Act of 2015, Pub. L. No. 114-95, § 1177. Stat. (2015).
Fuchs, L. S., Fuchs, D., & Compton, D. L. (2013). Intervention effects for students with comor-bid forms of learning disability understand-ing the needs of nonresponders. Journal of Learning Disabilities, 46, 534–548. doi:10.1177/0022219412468889
Fuchs, L. S., Schumacher, R. F., Sterba, S. K., Long, J., Namkung, J., Malone, A., . . . Changas, P. (2014). Does working memory moderate the effects of fraction intervention? An aptitude-treatment interaction. Journal of Educational Psychology, 106, 499–514. doi:10.1037/a0034341
Geary, D. C, Hoard, M. K., Byrd-Craven, J., Nugent, L, & Numtee, C. (2007). Cognitive mechanisms underlying achievement deficits in children with mathematics learning dis-ability. Child Development, 78, 1343–1359. doi:10.1111/j.1467-8624.2007.01069.x
Gersten, R., Chard, D. J., Jayanthi, M., Baker, S. K., Morphy, P., & Flojo, J. (2009). Mathematics instruction for students with learning disabilities: A meta-analysis of instructional components. Review of Educational Research, 79, 1202–1242. doi:10.3102/0034654309334431
Hedges, L. V. (1982). Estimation of effect size from a series of independent experi-ments. Psychological Bulletin, 92, 490–499. doi:10.1037/0033-2909.92.2.490
Hedges, L. V., & Pigott, T. D. (2004). The power of statistical tests for moderators in meta-analysis. Psychological Methods, 9, 426–445. doi:10.1037/1082-989X.9.4.426
Hughes, E. M., Witzel, B. S., Riccomini, P. J., Fries, K. M., & Kanyongo, G. Y. (2014). A meta-analysis of algebra interventions for learners with disabilities and struggling learn-ers. Journal of the International Association of Special Education, 15, 36–47.
Hunt, J. H., & Vasquez, E., III. (2014). Effects of ratio strategies intervention on knowledge of ratio equivalence for students with learning disability. The Journal of Special Education, 48, 180–190. doi:10.1177/0022466912474102
*Hutchinson, N. L. (1993). Effects of cognitive strategy instruction on algebra problem solv-ing of adolescents with learning disabilities. Learning Disability Quarterly, 16, 34–63. doi:10.2307/1511158

194 Exceptional Children 84(2)
Hwang, J., & Riccomini, P. J. (2016). Enhancing mathematical problem solving for second-ary students with or at risk of learning dis-abilities: A literature review. Learning Disabilities Research & Practice, 31, 169–181. doi:10.1111/ldrp.12105
*Ives, B. (2007). Graphic organizers applied to secondary algebra instruction for students with learning disorders. Learning Disabilities Research & Practice, 22, 110–118. doi:10.1111/j.1540-5826.2007.00235.x
*Jitendra, A. K., Dupuis, D. N., Star, J. R., & Rodriguez, M. C. (2016). The effects of schema-based instruction on the proportional thinking of students with mathematics diffi-culties with and without reading difficulties. Journal of Learning Disabilities, 49, 354–367. doi:10.1177/0022219414554228
*Jitendra, A. K., Harwell, M. R., Dupuis, D. N., & Karl, S. R. (2017). A randomized trial of the effects of schema-based instruction on pro-portional problem solving for students with mathematics problem-solving difficulties. Journal of Learning Disabilities. 50, 322–336. doi:10.1177/0022219416629646
Karlsson, P., & Bergmark, A. (2015). Compared with what? An analysis of control-group types in Cochrane and Campbell reviews of psychosocial treatment efficacy with sub-stance use disorders. Addiction, 110, 420–428. doi:10.1111/add.12799
*Kelly, B., Gersten, R., & Carnine, D. (1990). Student error patterns as a function of cur-riculum design: Teaching fractions to remedial high school students and high school students with learning disabilities. Journal of Learning Disabilities, 23, 23–29. doi:10.1177/002221949002300108
Kepes, S., Banks, G. C., & Oh, I. S. (2014). Avoiding bias in publication bias research: The value of “null” findings. Journal of Business and Psychology, 29, 183–203. doi:10.1007/s10869-012-9279-0
*Konold, K. B. (2004). Using the concrete-rep-resentational-abstract teaching sequence to increase algebra problem-solving skills (Doctoral dissertation). Available from ProQuest Dissertations and Theses. (Accession Order No. AAT 3143383)
Kroesbergen, E. H., & Van Luit, J. E. (2003). Mathematics interventions for children with special educational needs a meta-analysis. Remedial and Special Education, 24, 97–114. doi:10.1177/07419325030240020501
*Lambert, M. A. (1996). Teaching students with learning disabilities to solve word-problems: A comparison of a cognitive strategy and a traditional textbook method (Doctoral disser-tation). Available from ProQuest Dissertations and Theses. (UMI No. 9639550)
Lipsey, M. W., Puzio, K., Yun, C., Hebert, M. A., Steinka-Fry, K., Cole, M. W., . . . Busick, M. D. (2012). Translating the statistical rep-resentation of the effects of education inter-ventions into more readily interpretable forms (Publication No. NCSER 2013-3000). Washington, DC: National Center for Special Education Research. Retrieved from https://ies.ed.gov/ncser/pubs/20133000/pdf/20133000.pdf
Lipsey, M. W., & Wilson, D. B. (2001). Practical meta-analysis. Thousand Oaks, CA: SAGE.
Maccini, P., McNaughton, D., & Ruhl, K. L. (1999). Algebra instruction for students with learn-ing disabilities: Implications from a research review. Learning Disability Quarterly, 22, 113–126. doi:10.2307/1511270
Maccini, P., Mulcahy, C. A., & Wilson, M. G. (2007). A follow-up of mathematics inter-ventions for secondary students with learning disabilities. Learning Disabilities Research & Practice, 22, 58–74. doi:10.1111/j.1540-5826.2007.00231.x
*Manalo, E., Bunnell, J. K., & Stillman, J. A. (2000). The use of process mnemonics in teaching students with mathematics learning disabilities. Learning Disability Quarterly, 23, 137–156. doi:10.2307/1511142
Marita, S., & Hord, C. (2017). Review of math-ematics interventions for secondary stu-dents with learning disabilities. Learning Disability Quarterly, 40, 29–40. doi:10.1177/ 0731948716657495
Mazzocco, M. M. M. (2007). Defining and dif-ferentiating mathematical learning disabilities and difficulties. In D. B. Berch & M. M. M. Mazzocco (Eds.), Why is math so hard for some children? The nature and origins of mathematical learning difficulties and disabil-ities (pp. 29–47). Baltimore, MD: Brookes.
Miller, S. P., & Hudson, P. J. (2007). Using evidence-based practices to build mathe-matics competence related to conceptual, pro-cedural, and declarative knowledge. Learning Disabilities Research & Practice, 22, 47–57. doi:10.1111/j.1540-5826.2007.0023.x
Misquitta, R. (2011). A review of the literature: Fraction instruction for struggling learners in

Jitendra et al. 195
mathematics. Learning Disabilities Research & Practice, 26, 109–119. doi:10.1111/j.1540-5826.2011.00330.x
*Muoneke, A. F. (2001). The effects of a question and action strategy on the mathematical word problem-solving skills of students with learn-ing problems in mathematics (Doctoral disser-tation). Available from ProQuest Dissertations and Theses. (Accession Order No. AAT 3008402)
Myers, J. A., Wang, J., Brownell, M. T., & Gagnon, C. J. (2015). Mathematics interventions for students with learning disabilities (LD) in secondary school: A review of the litera-ture. Learning Disabilities: A Contemporary Journal, 13, 207–235.
National Center for Education Statistics. (2015). National Assessment of Educational Progress. Washington, DC: U.S. Department of Education. Retrieved from http://nces.ed.gov/nationsreportcard/
National Council of Teachers of Mathematics. (2000). Principles and standards for school mathematics. Reston, VA: Author.
National Governors Association Center for Best Practices & Council of Chief State School Officers (2010). Common Core State Standard in mathematics. Washington, DC: Author.
National Mathematics Advisory Panel. (2008). Foundations for success: Final report of the National Mathematics Advisory Panel. Washington, DC: U.S. Department of Education.
*Rodgers, L. D. (2011). Examining the imple-mentation of a problem-based learning and traditional hybrid model of instruction in remedial mathematics classes designed for state testing preparation of eleventh grade students (Doctoral dissertation). Available from ProQuest Dissertations and Theses. (Accession Order No. AAT 3532763)
Rosenshine, B. V., & Berliner, D. C. (1978). Academic engaged time. British Journal of Teacher Education, 4, 3–16. doi:10.1080/ 0260747780040102
Rothstein, H. R., Sutton, A. J., & Borenstein, M. (Eds.). (2005). Publication bias in meta-anal-ysis: Prevention, assessment, and adjustment. New York, NY: Wiley.
Scammacca, N. K., Roberts, G., Vaughn, S., & Stuebing, K. K. (2015). A meta-analysis of interventions for struggling readers in Grades 4–12. Journal of Learning Disabilities, 48, 369–390. doi:10.1177/0022219413504995
Scruggs, T. E., Mastropieri, M. A., Berkeley, S., & Graetz, J. E. (2010). Do special educa-tion interventions improve learning of sec-ondary content? A meta-analysis. Remedial and Special Education, 31, 437–449. doi.org/10.1177/0741932508327465
Shin, M., & Bryant, D. P. (2015). Fraction inter-ventions for students struggling to learn math-ematics: A research synthesis. Remedial and Special Education, 36, 374–387. doi:10.1177/ 0741932515572910
Swanson, H. L., & Hoskyn, M. (1998). Experimental intervention research on stu-dents with learning disabilities: A meta-analysis of treatment outcomes. Review of Educational Research, 68, 277–321. doi:10.3102/00346543068003277
Wagner, M., Marder, C., Blackorby, J., & Cardoso, D. (2002). The children we serve: The demo-graphic characteristics of elementary and middle school students with disabilities and their households. Menlo Park, CA: SRI International.
Wagner, M., Newman, L., Cameto, R., Levine, P., & Garza, N. (2006). An overview of find-ings from Wave 2 of the National Longitudinal Transition Study-2 (NLTS2). Retrieved from https://ies.ed.gov/ncser/pdf/20063004.pdf
*Walker, D. W., & Poteet, J. A. (1989–1990). A comparison of two methods of teaching math-ematics story problem-solving with learning disabled students. National Forum of Special Education Journal, 1, 44–51.
Wanzek, J., Vaughn, S., Scammacca, N., Gatlin, B., Walker, M., & Capin, P. (2016). Meta-analyses of the effects of Tier 2 type reading interventions in Grades K–3. Educational Psychology Review, 28, 551–576. doi:10.1007/s10648-015-9321-7
Wanzek, J., Wexler, J., Vaughn, S., & Ciullo, S. (2010). Reading interventions for struggling readers in the upper elementary grades: A synthesis of 20 years of research. Reading and Writing, 23, 889–912. doi:10.1007/s11145-009-9179-5
Watt, S. J., Watkins, J. R., & Abbitt, J. (2016). Teaching algebra to students with learning disabilities: Where have we come and where should we go? Journal of Learning Disabilities, 49, 437–447. doi:10.1177/0022219414564220
Wei, X., Lenz, K. B., & Blackorby, J. (2013). Math growth trajectories of students with disabili-ties: Disability category, gender, racial, and socioeconomic status differences from ages

196 Exceptional Children 84(2)
7 to 17. Remedial and Special Education, 34, 154–165. doi:10.1177/0741932512448253
What Works Clearinghouse. (2014). WWC pro-cedures and standards handbook. Retrieved from https://ies.ed.gov/ncee/wwc/Docs/refer-enceresources/wwc_procedures_v3_0_stan-dards_handbook.pdf
Witzel, B. S. (Ed.) (2016). Bridging the gap between arithmetic and algebra. Arlington, VA: Council for Exceptional Children.
*Witzel, B. S., Mercer, C. D., & Miller, M. D. (2003). Teaching algebra to students with learning difficulties: An investigation of an explicit instruction model. Learning Disabilities Research & Practice, 18, 121–131. doi:10.1111/1540-5826.00068
*Woodward, J., Baxter, J., & Robinson, R. (1999). Rules and reasons: Decimal instruction for aca-demically low achieving students. Learning Disabilities Research & Practice, 14, 15–24. doi:10.1207/sldrp1401_2
*Woodward, J., & Brown, C. (2006). Meeting the curricular needs of academically low-achieving students in middle grade mathematics. The Journal of Special Education, 40, 151–159. doi:10.1177/00224669060400030301
Woolley, M. E., Rose, R. A., Mercado, M., & Orthner, D. K. (2013). Teachers teaching dif-ferently: A qualitative study of implementa-
tion fidelity to professional development. Journal of Education and Training Studies, 1, 55–68. doi:10.11114/jets.v1i1.48
Xin, Y. P., & Jitendra, A. K. (1999). The effects of instruction in solving mathematical word problems for students with learning prob-lems: A meta-analysis. The Journal of Special Education, 32, 207–225. doi:10.1177/ 002246699903200402
*Xin, Y. P., Jitendra, A. K., & Deatline-Buchman, A. (2005). The effects of mathematical word problem-solving instruction on middle school students with learning problems. The Journal of Special Education, 39, 181–192. doi:10.117 7/00224669050390030501
Zhang, D., & Xin, Y. P. (2012). A follow-up meta-analysis for word-problem-solving inter-ventions for students with mathematics diffi-culties. Journal of Educational Research, 105, 303–318. doi:10.1080/00220671.2011.627397
Zheng, X., Flynn, L. J., & Swanson, H. L. (2013). Experimental intervention stud-ies on word problem solving and math dis-abilities a selective analysis of the literature. Learning Disability Quarterly, 36, 97–111. doi:10.1177/0731948712444277
Manuscript received August 2017; accepted Sep-tember 2017.

Copyright of Exceptional Children is the property of Sage Publications Inc. and its contentmay not be copied or emailed to multiple sites or posted to a listserv without the copyrightholder's express written permission. However, users may print, download, or email articles forindividual use.