Math in data
60
Math & Data Science Dr June Andrews July 29, 2015 Dr June Andrews Math & Data Science July 29, 2015 1 / 59
-
Upload
june-andrews -
Category
Data & Analytics
-
view
377 -
download
0
Transcript of Math in data

Math & Data Science
Dr June Andrews
July 29, 2015
Dr June Andrews Math & Data Science July 29, 2015 1 / 59

Table of contents
1 Data ScienceOriginsPeopleWork
2 Math Behind Data ScienceExperimentationGrowth NormalizationIf Time
Dr June Andrews Math & Data Science July 29, 2015 2 / 59

First Data Science Job Rec
Be challenged at LinkedIn. We’re looking for superb analyticalminds of all levels to expand our small team that will build someof the most innovative products at LinkedIn.
No specific technical skills are required (we’ll help you learnSQL, Python, and R). You should be extremely intelligent, havequantitative background, and be able to learn quickly and workindependently. This is the perfect job for someone who’s reallysmart, driven, and extremely skilled at creatively solvingproblems. You’ll learn statistics, data mining, programming, andproduct design, but you’ve gotta start with what we can’t teach- intellectual sharpness and creativity.
Figure: LinkedIn Job Posting April 2008
Dr June Andrews Math & Data Science July 29, 2015 3 / 59

Latest Data Science Job Rec
Data Scientist – Growth Analytics at LinkedInData Scientists on our team partner with product managers, engineers and a cross-functional team to driveLinkedIn membership growth and connectivity. We inform product strategy and product decisions by:
Extracting and analyzing LinkedIn data to derive actionable insights.Formulating success metrics for completely novel products and creating dashboards/reports to monitorthem.Designing and analyzing experiments to test new product ideas.Developing models and data-driven solutions that add material lift to principal performance metrics.
LinkedIn member data is amazingly rich and provides a fantastic opportunity for Data Scientists to explore andcreate, ultimately developing ways for members to improve their professional lives. Youll have the opportunity towork with some of the best data people anywhere in an environment which truly values data-driven decisions.Required qualifications include:
BS/MS in a quantitative discipline: Statistics, Applied Mathematics, Operations Research, ComputerScience, Engineering, Economics, etc.1+ years experience working with large amounts of real data with SQL (Teradata, Oracle, or MySQL)and R, or other statistical package.1+ years work experience programming in Java or Python - Pig experience desired.Proficiency in a Unix/Linux environment for automating processes with shell scripting.Able to translate business objectives into actionable analyses.Able to communicate findings clearly to both technical and non-technical audiences
Preferred Qualifications include:
Experience with Consumer Internet products.Knowledge in one of the following areas is a strong plus: Viral Growth mechanisms, user acquisition inInternational markets, Search Engine Optimization (SEO)Expertise in applied statistics, understanding of controlled experiments.
Figure: LinkedIn Job Posting July 2015
Dr June Andrews Math & Data Science July 29, 2015 4 / 59

Latest Data Science Job Rec - Applicants
Figure: Applicants now have SQL, Python, and R. 702 applicants in 5 months.
Dr June Andrews Math & Data Science July 29, 2015 5 / 59

Trend is to Demand More
Definition (Data Science as a Victim of Success)
When use of a skill demonstrates improvements in support and innovation,it is added to the next job rec.
Rule of thumb when hiring, does your favorite colleague pass yourinterview?
Dr June Andrews Math & Data Science July 29, 2015 6 / 59

Goals
Invariant
Use data to support colleagues: marketing, finance, engineering, . . .
Use data to innovate: products, strategies, performance, . . .
Cherry on Top
Do what it takes to drive company success.
Dr June Andrews Math & Data Science July 29, 2015 7 / 59

Progress
1 Data ScienceOriginsPeopleWork
2 Math Behind Data ScienceExperimentationGrowth NormalizationIf Time
Dr June Andrews Math & Data Science July 29, 2015 8 / 59

LinkedIn Data
Dr June Andrews Math & Data Science July 29, 2015 9 / 59

Source of 125k Data Professionals
Figure: Incredibly diverse.
Dr June Andrews Math & Data Science July 29, 2015 10 / 59

Data Professionals on LinkedIn
> 2k degree fields (after standardization)
16% are Unique Degrees:
Oral Surgery
Phytopathology
Wedding Planning
Ground Transportation
Library Sciences
Turfgrass Management
Embryology
Fire Fighting
Stagecraft
Art Conservation
Dr June Andrews Math & Data Science July 29, 2015 11 / 59

Data Science Homogenization Trend
Dr June Andrews Math & Data Science July 29, 2015 12 / 59

Uneven Growth of Top 10 Backgrounds
Dr June Andrews Math & Data Science July 29, 2015 13 / 59

Uneven Growth of Top 10 Backgrounds
Figure: Increased recruitment of economists and statisticans.
Dr June Andrews Math & Data Science July 29, 2015 14 / 59

Destinations of Data Professionals
Dr June Andrews Math & Data Science July 29, 2015 15 / 59

Industry Diversification of Data Professionals
Dr June Andrews Math & Data Science July 29, 2015 16 / 59

Uneven Growth of Top 10 Industries
Dr June Andrews Math & Data Science July 29, 2015 17 / 59

Trends
Homogenization of Sources of Data Professionals
Diversification of Industry Destinations of Data Professionals
Dr June Andrews Math & Data Science July 29, 2015 18 / 59

Progress
1 Data ScienceOriginsPeopleWork
2 Math Behind Data ScienceExperimentationGrowth NormalizationIf Time
Dr June Andrews Math & Data Science July 29, 2015 19 / 59

Product Cycle
Figure: What portion of work data scientists do on a daily basis depends onproduct life cycle.
Dr June Andrews Math & Data Science July 29, 2015 20 / 59

Content
Ask - Make content go big.
Dr June Andrews Math & Data Science July 29, 2015 21 / 59

Connection Network
Figure: Content spreads along existing connection network.
Dr June Andrews Math & Data Science July 29, 2015 22 / 59

Follow Network
Figure: Change the game. Increase readership and visibilty via follows.
Dr June Andrews Math & Data Science July 29, 2015 23 / 59

Product Cycle - Follow Network
Stage Work Time
IdeationExplore how to make content go big.Follows.
2 weeks
Design & SpecDefine a Follow for security, PR,marketing, all teams possibly affected.
3 weeks
DevelopmentDatabase engineering, rollback safe,experimental framework.
6 months
Test & Iterate Slow release experiment. 3 months
Release Clean up code, outline fast follows 1 month
Table: Follow Network, slow and steady development cycle.
Dr June Andrews Math & Data Science July 29, 2015 24 / 59

Types of Work
Area of Data GoalAnalyze UnderstandVisualize CommunicateBusiness Decisions Orchestrate ActionPrototype Product Demonstrate UsefulnessRefine Product Maximize UsefulnessDesign Experiment Measure ChangesAnalyze Experiment LearnLog Save EverythingProcess Make Data UseableLoad to Server/DB Make Data Accessible
Table: General data science stack.
Dr June Andrews Math & Data Science July 29, 2015 25 / 59

Who does What
Figure: Depth v. breadth of different fields.
Dr June Andrews Math & Data Science July 29, 2015 26 / 59

Skills of Data Professionals
Languages Tools Hard Skills Soft Skills
SQLMicrosoft (Office,Excel, SQL, Visio)
Research Management
Java Oracle Statistics LeadershipMatlab SAS ETL Process ImprovementJavascript SharePoint Data Modeling Customer ServiceR SAP Software Dev Software DocsPython Cisco Data Mining StrategyC++ Salseforce Forecasting Public SpeakingXML Six Sigma Database Design Team Leadership
Table: From LinkedIn’s 125k Data Professionals.
Dr June Andrews Math & Data Science July 29, 2015 27 / 59

Network Product Development
1 Data ScienceOriginsPeopleWork
2 Math Behind Data ScienceExperimentationGrowth NormalizationIf Time
Dr June Andrews Math & Data Science July 29, 2015 28 / 59

Traditional A/B Testing
Figure: Traditional ab testing. [Salesforce]
High Level
Randomly divides users into two groups for different treatments.
Dr June Andrews Math & Data Science July 29, 2015 29 / 59

Social Influence
Figure: Users can communicate experiences in social networks.
Cross Over
Testing interaction features such as messaging, connections, and profileviews inherently have cross cohort communication.
Dr June Andrews Math & Data Science July 29, 2015 30 / 59

Elegant Solution
Figure: See geographical bounds. [Ugander et al]
High Level
Partition network into relatively low intra communication groups.
Dr June Andrews Math & Data Science July 29, 2015 31 / 59

Elegant Solution
Downside
Costly to implement and assign elegant solution. Limited number ofexperiments can run simultaneousl.
Cohort Actual Performance Observed Performance Observed DiffA x zB y c · z c − 1
Table: What exists and is observed.2 equations, 3 variables, can compute upper bound for x
y
Dr June Andrews Math & Data Science July 29, 2015 32 / 59

Elegant v. Brute Force Tradeoff
Bound
Actual impact a is bounded by observed impact c & viral coefficient V :
a = c−V1−cV
Figure: Small impact for low viral products. [Andrews]
Dr June Andrews Math & Data Science July 29, 2015 33 / 59

Alternative Brute Force
Control Interactions
Split on the interaction at the cost of inconsistent user experience. Benefitis test the impact of sending or receiving.
Sender / Receiver A B
A Treatment ControlB Control Control
Dr June Andrews Math & Data Science July 29, 2015 34 / 59

Progress
1 Data ScienceOriginsPeopleWork
2 Math Behind Data ScienceExperimentationGrowth NormalizationIf Time
Dr June Andrews Math & Data Science July 29, 2015 35 / 59

Health Care’s Relations with other Industries
Figure: Since 2008 Health Care has increased relationships with Recruiters.
Dr June Andrews Math & Data Science July 29, 2015 36 / 59

Not so Fast
Figure: Growth of relationships is dominated by LinkedIn’s growth.
Dr June Andrews Math & Data Science July 29, 2015 37 / 59

Confounding or Masking Variables
Control Confounding Variables
Data quality and growth can dominate underlyingtrends.
LinkedIn’s Network Growth is massive anddiverse
Venture Capitalists and Recruiters are hyperconnectors
Figure: Stan Lee
Dr June Andrews Math & Data Science July 29, 2015 38 / 59

Control for Growth and Behavioral Variables
Approach
Set as constants the number of users in an industry and how manyconnections they have. Then reconnect connections at random.
Figure: Break edges and reconnect randomly.
Dr June Andrews Math & Data Science July 29, 2015 39 / 59

Expected Connections
Closed Form Solution
Reducible to pulling red and blue balls from a bag without replacement.The solution is the expectation of the Hypergeometric distribution.
E [‖Edges(Health Care, I)‖] = ‖Edges(Health Care)‖‖Edges(I )‖∑i,j ‖Edges(i ,j)‖−‖Edges(Health Care)‖
Dr June Andrews Math & Data Science July 29, 2015 40 / 59

Expected Connections
Figure: Given growth and behavioral patterns, we expect some industries to havea dramatic number of connections to health care professionals.
Dr June Andrews Math & Data Science July 29, 2015 41 / 59

Significant Relations with Health Care Appear
Figure: Venture Capitalists and Recruiters are no longer in the top rankings.
Dr June Andrews Math & Data Science July 29, 2015 42 / 59

Significant Relations with Health Care Appear
Relations Now Reflect the LargerEconomy
City programs have increasedinhome and preventative care
Many hospitals are named afterSaints and affliated withReligious Denominations
Medical Devices andPharmaceuticals have and havealways had strong connectionto Health Care
Figure: Industries with SignificantConnections to Health Care
Dr June Andrews Math & Data Science July 29, 2015 43 / 59

Significant Relations with Realtors
Figure: Period of dramatic growth for real estate
Dr June Andrews Math & Data Science July 29, 2015 44 / 59

Significant Relations with Realtors
Figure: Period of economic change
Dr June Andrews Math & Data Science July 29, 2015 45 / 59

Significant Relations with Construction
Figure: Symmetric relationship between real estate and construction.Construction workers migrate between real estate and oil and mining.
Dr June Andrews Math & Data Science July 29, 2015 46 / 59

Industry Migration - Mechanics
Figure: Construction workers connecting with Oil & Mining over Real Estate
Dr June Andrews Math & Data Science July 29, 2015 47 / 59

Industry Migration - Mechanics
How?
Is migration prompted by influential people?
Is migration independent pockets of movement?
Dr June Andrews Math & Data Science July 29, 2015 48 / 59

Industry Migration - Cascades
Figure: Median is 4 neighbors migrated before conversion
Dr June Andrews Math & Data Science July 29, 2015 49 / 59

Industry Migration - Mechanics
Figure: Size of bubble is proportional to size of complete cascade.
How?
Migration is largely independent, with some cascades.
Dr June Andrews Math & Data Science July 29, 2015 50 / 59

Wrap
1 Data ScienceOriginsPeopleWork
2 Math Behind Data ScienceExperimentationGrowth NormalizationIf Time
Dr June Andrews Math & Data Science July 29, 2015 51 / 59

Data & Computing Growth
Figure: Data growth is exponential. Rule of thumb is doubles every 4-8 months.
Dr June Andrews Math & Data Science July 29, 2015 52 / 59

Linearity Wins
Figure: Linear algorithms are fast, predictable, and complete.
Dr June Andrews Math & Data Science July 29, 2015 53 / 59

Takes a Village - Thank You!
Figure: Every project involved at least 3 people.Dr June Andrews Math & Data Science July 29, 2015 54 / 59

Progress
1 Data ScienceOriginsPeopleWork
2 Math Behind Data ScienceExperimentationGrowth NormalizationIf Time
Dr June Andrews Math & Data Science July 29, 2015 55 / 59

MAP
MAP combines:
Precision - Give me only what I wantRecall - Give me everything I want
Figure: (Precision, Recall) values with same MAP score.Dr June Andrews Math & Data Science July 29, 2015 56 / 59

MAP
Figure: Two sets of (Precision, Recall) values with same MAP score.
Dr June Andrews Math & Data Science July 29, 2015 57 / 59

MAP
Figure: Improve a search algorithm from point a with either small increase inRecall or a large increase in Precision.
Dr June Andrews Math & Data Science July 29, 2015 58 / 59

MAP
Figure: Additional points.
Dr June Andrews Math & Data Science July 29, 2015 59 / 59
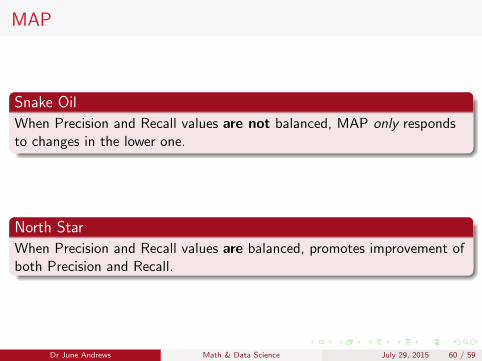
MAP
Snake Oil
When Precision and Recall values are not balanced, MAP only respondsto changes in the lower one.
North Star
When Precision and Recall values are balanced, promotes improvement ofboth Precision and Recall.
Dr June Andrews Math & Data Science July 29, 2015 60 / 59