Math for Machine Learning 1 Calculus
21
Hal Daum´ e III 28 August 2009 Math for Machine Learning The goal of this document is to provide a “refresher” on continuous mathematics for computer science students. It is by no means a rigorous course on these topics. The presentation, motivation, etc., are all from a machine learning perspective. The hope, however, is that it’s useful in other contexts. The two major topics covered are linear algebra and calculus (probability is currently left off)). 1 Calculus Calculus is classically the study of the relationship between variables and their rates of change. However, this is not what we use calculus for. We use differential calculus as a method for finding extrema of functions; we use integral calculus as a method for probabilistic modeling. 1.1 Differential Calculus Example 1. To be more concrete, a classical statistics problem is linear regression. Suppose that I have linear regression. a bunch of points (x 1 ,y 1 ), (x 2 ,y 2 ),..., (x N ,y N ), and I want to fit a line of the form y = mx + b. If I have a lot of points, it’s pretty unlikely that there is going to be a line that actually passes exactly through all of them. So we can ask instead for a line y = mx + b that lies as close to the points as possible. See Figure ??. One easy option is to use squared error as a measure of closeness. For a point (x n ,y n ) and a line defined by m and b, we can measure the squared error as [(mx n + b) - y n ] 2 . That is: our predicted value minus the true value, all squared. 1 We can easily sum all of the point-wise errors to get a total error (which, for some strange reason, we’ll call “J ”) of: J (m, b)= N X n=1 (mx n + b) - y n 2 (1) Note that we have written the error J as a function of m and b, since, for any setting of m and b, we will get a different error. Now, our goal is to find values of m and b that minimize the error. How can we do this? Differential calculus tells us that the minimum of the J function can be computed by finding the zeros of its derivatives. (Assuming it is convex: see Section 1.3.) The derivative of a function at a point is the slope of the function at that point (a derivative is like a derivative velocity). See Figure ??. To be precise, suppose we have a function f that maps real numbers to real velocity numbers. (That is: f : R → R; see Section ??). For instance, f (x)=3x 2 - e x . The derivative of f with respect to x, denoted ∂f/∂x, is 2 : ∂f ∂x (x 0 ) = lim h→0 f (x 0 + h) - f (x 0 ) h (2) This essentially says that the derivative of f with respect to x, evaluated at a point x 0 , is the rate of change of f at x 0 . It is fairly common to see ∂f/∂x denoted by f 0 . The disadvantage to this notation is that when f is a function of multiple variables (such as J in linear regression; see Example 1), then f 0 is ambiguous as 1 As discussed in the notation (see Section ??), we count data points by 1 ...N and index them by n. In general, things that range from 1 ...X will be indexed by x. 2 Note that there are other definitions that catch interesting corner cases. 1
Transcript of Math for Machine Learning 1 Calculus

Hal Daume III 28 August 2009
Math for Machine Learning
The goal of this document is to provide a “refresher” on continuous mathematics for computer sciencestudents. It is by no means a rigorous course on these topics. The presentation, motivation, etc., are allfrom a machine learning perspective. The hope, however, is that it’s useful in other contexts. The two majortopics covered are linear algebra and calculus (probability is currently left off)).
1 Calculus
Calculus is classically the study of the relationship between variables and their rates of change. However, thisis not what we use calculus for. We use differential calculus as a method for finding extrema of functions;we use integral calculus as a method for probabilistic modeling.
1.1 Differential Calculus
Example 1. To be more concrete, a classical statistics problem is linear regression. Suppose that I have linear regression.
a bunch of points (x1, y1), (x2, y2), . . . , (xN , yN ), and I want to fit a line of the form y = mx + b. If I havea lot of points, it’s pretty unlikely that there is going to be a line that actually passes exactly through all ofthem. So we can ask instead for a line y = mx+ b that lies as close to the points as possible. See Figure ??.
One easy option is to use squared error as a measure of closeness. For a point (xn, yn) and a line definedby m and b, we can measure the squared error as [(mxn + b)− yn]2. That is: our predicted value minus thetrue value, all squared.1 We can easily sum all of the point-wise errors to get a total error (which, for somestrange reason, we’ll call “J”) of:
J(m, b) =N∑n=1
[(mxn + b)− yn
]2 (1)
Note that we have written the error J as a function of m and b, since, for any setting of m and b, we willget a different error.
Now, our goal is to find values of m and b that minimize the error. How can we do this? Differentialcalculus tells us that the minimum of the J function can be computed by finding the zeros of its derivatives.(Assuming it is convex: see Section 1.3.)
The derivative of a function at a point is the slope of the function at that point (a derivative is like a derivative
velocity). See Figure ??. To be precise, suppose we have a function f that maps real numbers to real velocity
numbers. (That is: f : R → R; see Section ??). For instance, f(x) = 3x2 − ex. The derivative of f withrespect to x, denoted ∂f/∂x, is2:
∂f
∂x(x0) = lim
h→0
f(x0 + h)− f(x0)h
(2)
This essentially says that the derivative of f with respect to x, evaluated at a point x0, is the rate of changeof f at x0. It is fairly common to see ∂f/∂x denoted by f ′. The disadvantage to this notation is that whenf is a function of multiple variables (such as J in linear regression; see Example 1), then f ′ is ambiguous as
1As discussed in the notation (see Section ??), we count data points by 1 . . . N and index them by n. In general, things thatrange from 1 . . . X will be indexed by x.
2Note that there are other definitions that catch interesting corner cases.
1
Math for Machine Learning 2
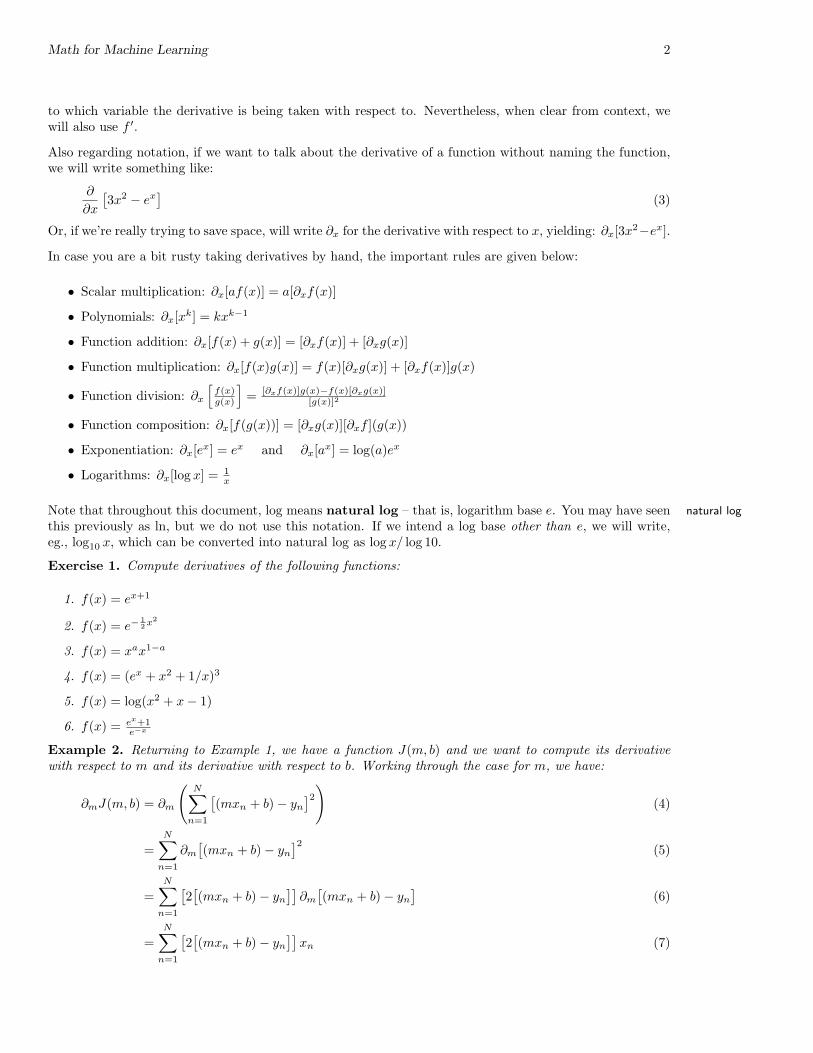
to which variable the derivative is being taken with respect to. Nevertheless, when clear from context, wewill also use f ′.
Also regarding notation, if we want to talk about the derivative of a function without naming the function,we will write something like:
∂
∂x
[3x2 − ex
](3)
Or, if we’re really trying to save space, will write ∂x for the derivative with respect to x, yielding: ∂x[3x2−ex].
In case you are a bit rusty taking derivatives by hand, the important rules are given below:
• Scalar multiplication: ∂x[af(x)] = a[∂xf(x)]
• Polynomials: ∂x[xk] = kxk−1
• Function addition: ∂x[f(x) + g(x)] = [∂xf(x)] + [∂xg(x)]
• Function multiplication: ∂x[f(x)g(x)] = f(x)[∂xg(x)] + [∂xf(x)]g(x)
• Function division: ∂x[f(x)g(x)
]= [∂xf(x)]g(x)−f(x)[∂xg(x)]
[g(x)]2
• Function composition: ∂x[f(g(x))] = [∂xg(x)][∂xf ](g(x))
• Exponentiation: ∂x[ex] = ex and ∂x[ax] = log(a)ex
• Logarithms: ∂x[log x] = 1x
Note that throughout this document, log means natural log – that is, logarithm base e. You may have seen natural log
this previously as ln, but we do not use this notation. If we intend a log base other than e, we will write,eg., log10 x, which can be converted into natural log as log x/ log 10.
Exercise 1. Compute derivatives of the following functions:
1. f(x) = ex+1
2. f(x) = e−12x
2
3. f(x) = xax1−a
4. f(x) = (ex + x2 + 1/x)3
5. f(x) = log(x2 + x− 1)
6. f(x) = ex+1e−x
Example 2. Returning to Example 1, we have a function J(m, b) and we want to compute its derivativewith respect to m and its derivative with respect to b. Working through the case for m, we have:
∂mJ(m, b) = ∂m
(N∑n=1
[(mxn + b)− yn
]2) (4)
=N∑n=1
∂m[(mxn + b)− yn
]2 (5)
=N∑n=1
[2[(mxn + b)− yn
]]∂m[(mxn + b)− yn
](6)
=N∑n=1
[2[(mxn + b)− yn
]]xn (7)
Math for Machine Learning 3
In the first step, we apply the function addition rule; in the second step, we apply the composition rule; inthe third step, we apply the polynomial rule.
Exercise 2. Compute ∂bJ(m, b).
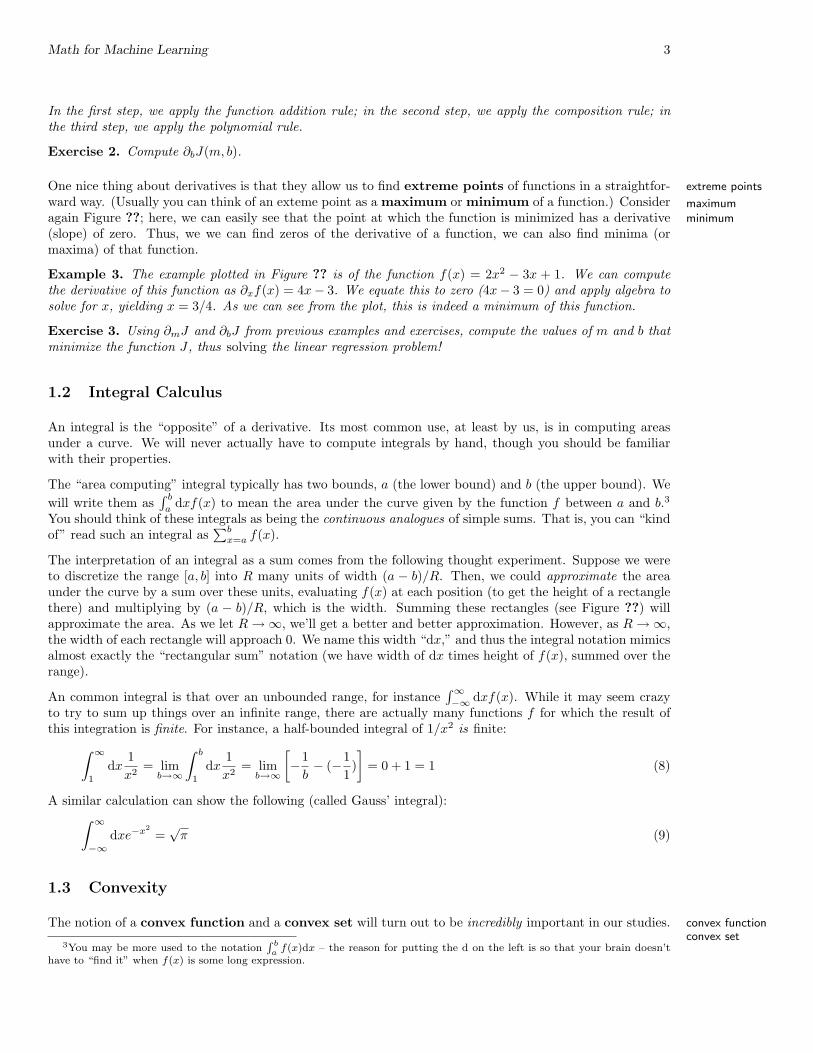
One nice thing about derivatives is that they allow us to find extreme points of functions in a straightfor- extreme points
ward way. (Usually you can think of an exteme point as a maximum or minimum of a function.) Consider maximumminimumagain Figure ??; here, we can easily see that the point at which the function is minimized has a derivative
(slope) of zero. Thus, we we can find zeros of the derivative of a function, we can also find minima (ormaxima) of that function.
Example 3. The example plotted in Figure ?? is of the function f(x) = 2x2 − 3x + 1. We can computethe derivative of this function as ∂xf(x) = 4x− 3. We equate this to zero (4x− 3 = 0) and apply algebra tosolve for x, yielding x = 3/4. As we can see from the plot, this is indeed a minimum of this function.
Exercise 3. Using ∂mJ and ∂bJ from previous examples and exercises, compute the values of m and b thatminimize the function J , thus solving the linear regression problem!
1.2 Integral Calculus
An integral is the “opposite” of a derivative. Its most common use, at least by us, is in computing areasunder a curve. We will never actually have to compute integrals by hand, though you should be familiarwith their properties.
The “area computing” integral typically has two bounds, a (the lower bound) and b (the upper bound). Wewill write them as
∫ ba
dxf(x) to mean the area under the curve given by the function f between a and b.3
You should think of these integrals as being the continuous analogues of simple sums. That is, you can “kindof” read such an integral as
∑bx=a f(x).
The interpretation of an integral as a sum comes from the following thought experiment. Suppose we wereto discretize the range [a, b] into R many units of width (a − b)/R. Then, we could approximate the areaunder the curve by a sum over these units, evaluating f(x) at each position (to get the height of a rectanglethere) and multiplying by (a − b)/R, which is the width. Summing these rectangles (see Figure ??) willapproximate the area. As we let R→∞, we’ll get a better and better approximation. However, as R→∞,the width of each rectangle will approach 0. We name this width “dx,” and thus the integral notation mimicsalmost exactly the “rectangular sum” notation (we have width of dx times height of f(x), summed over therange).
An common integral is that over an unbounded range, for instance∫∞−∞ dxf(x). While it may seem crazy
to try to sum up things over an infinite range, there are actually many functions f for which the result ofthis integration is finite. For instance, a half-bounded integral of 1/x2 is finite:∫ ∞
1
dx1x2
= limb→∞
∫ b
1
dx1x2
= limb→∞
[−1b− (−1
1)]
= 0 + 1 = 1 (8)
A similar calculation can show the following (called Gauss’ integral):∫ ∞−∞
dxe−x2
=√π (9)
1.3 Convexity
The notion of a convex function and a convex set will turn out to be incredibly important in our studies. convex functionconvex set
3You may be more used to the notationR b
a f(x)dx – the reason for putting the d on the left is so that your brain doesn’thave to “find it” when f(x) is some long expression.

Math for Machine Learning 4
A convex function is, in many ways, “well behaved.” Although not a precise definition, you can think ofa convex function as one that has a single point at which the derivative goes to zero, and this point is aminimum. For instance, the function f(x) = 2x2 − 3x + 1 from Figure ?? is convex. One usually thinks ofcontext functions as functions that “hold water” – i.e., if you were to pour water into them, it wouldn’t spillout.
The opposite of a convex function is a concave function. A function f is concave if the function −f is concavefunctionconvex. So convex functions look like valleys, concave functions like hills.
The reason we care about convexity is because it means that finding minima is easy. For instance, the factthat f(x) = 2x2 − 3x + 1 is convex means that once we’ve found a point that has a zero derivative, wehave found the unique, global minimum. For instance, consider the function f(x) = x4 + x3 − 4x2, which isplotted in Figure ??. This function is non-convex. It has three points at which the derivative goes to zero.The left-most corresponds to a global minimum, the middle to a local maximum and the right-most to a localminimum. What this means is that even if we are able to find a point x for which ∂xf(x) = 0, it is notnecessarily true that x is a minimum (or maximum) of f .
More formally, a function f is convex on the range [a, b] if its second derivative is positive everywhere in convex
that range. The second derivative is simply the derivative of the derivative (and is physically associated withacceleration). The second derivative of f with respect to x is typically denoted by one of the following: acceleration
∂2f
∂x∂x=
∂2f
∂x2=
∂
∂x
[∂f
∂x
]= ∂x∂xf (10)
A function f is convex everywhere if f is convex on the range (−∞,∞). convexeverywhere
Example 4. Consider the function f(x) = 2x2− 3x+ 1. We’ve already computed the first derivative of thisfunction: ∂xf(x) = 4x − 3. To compute the second derivative of f , we just re-differentiate the derivative,yielding ∂x∂xf(x) = 4. Clearly, the function that maps everything to 4 is positive everywhere, so we knowthat f is convex.
Example 5. Now, consider the non-convex function f(x) = x4 + x3− 4x2. The first derivative is ∂xf(x) =4x3 + 3x2 − 4x and the second derivative is 12x2 + 6x− 4. It’s fairly easy to find a value of x for which thesecond derivative is negative: 0 is such an example. It is moderately interesting to note that while this f isnot convex everywhere, it is convex in certain ranges, for instance the open intervals (−∞,−1) and (0.5,∞)are ranges over which f is convex.
Exercise 4. Verify whether the functions from Exercise 1 are convex, concave or neither.
An analogous notion to a convex function is a convex set. Consider some subset A of the real line. We’ll convex set
denote the real line by R, so we have A ⊂ R. We say that A is convex whenever the following holds: for all convex
x, y ∈ A and λ ∈ [0, 1], the point λx+ (1− λ)y is also in A. In more mathy terms, A is convex if it is closedunder convex combination.
The way to think of this is as follows. Given two points x and y on the plane, the function f(λ) = λx+(1−λ)yon the range λ ∈ [0, 1] denotes the line segment that joins x and y. A set A is convex if all points on all line segment
such line segments are also contained in A.4
Example 6. For example, the closed interval [1, 3] is convex. To show this, let x, y ∈ [1, 3] be given, andlet λ ∈ [0, 1] be given. Let z = λx+ (1− λ)y. First, we show that z ≥ 1. Without loss of generality, x ≤ y,so z = λx + (1 − λ)y ≥ λx + (1 − λ)x = x ≥ 1. Next, we show that z ≤ 3. Similarly, z = λx + (1 − λ)y ≤λy + (1− λ)y = y ≤ 3.
In general, all open and closed intervals of the real line are convex.4Except under strange conditions, it is sufficient to check that for all x, y ∈ A, the point (x + y)/2 is also in A. This is
equivalent to just checking the case for λ = 0.5.

Math for Machine Learning 5
Exercise 5. Show that [−3,−1] ∪ [1, 3] (the union of the closed interval [−3,−1] and the closed interval[1, 3]) is not convex.
Why do we care about convex sets? A lot of times we’re going to be trying to minimize some function f(x),but under a constraint that x lies in some set A. If A is convex, the life is much easier. This is because itmeans that if we have two solutions, both in A, we can try to find a better solution between them, and thisis guaranteed to still be in A (by convexity). (We’ll come back to this later in Section 3.1.
An immediate question is: convex sets and convex functions share the word “convex.” This implies thatthey have something in common. They do, but we’ll need to get to multidimensional analogues before wecan see this (see Section 3.1.
1.4 Wrap-up
The important concepts from this section are:
• Differentiation as a tool to finding maxima/minima of a function.
• Integration as a tool for computing area under a function.
• Convex functions hold water.
If you feel comfortable with these issues and can solve most of the exercises, you’re in good shape!
2 Linear Algebra
A large part of statistics and machine learning has to do with modeling data. Although not always the case,for many problems, it is useful to think of data points as being points in some high dimensional space. Forinstance, we might characterize a car by it’s length, width, height and maximum velocity. A given car canthen be realized by a point in 4-dimensional space, where the value in each dimension corresponds to one ofthe properties we are measuring. Linear algebra gives us a set of tools for describing and manipulating suchobjects.
2.1 Vector Spaces
Our presentation here is going to be focused on on particular type of vector space, namely D-dimensionalEuclidean space; that is, the space RD. It’s very important to realize, however, that the ideas in linear Euclidean space
algebra are much more general. All of our examples will be from D ∈ {2, 3}, since these are the only onesfor which we have a chance of drawing examples.
We begin by defining a vector. This is simply an element x that lives in our vector space. In two dimen- vector
sions, vectors are simply points on the plane. The vector x ∈ RD has D-many components, denoted by〈x1, x2, . . . , xD〉. We’ll typically use small d to denote one particular dimension; thus, xd is the (real value!)corresponding to the dth dimension of x.
There are several things we might want to do with vectors: add them, and multiply them by a scalar. Theseoperations are defined by the following rules:
• For x ∈ RD and a ∈ R, the scalar product of x and a, denoted ax given by the vector in RD defined scalar product
component-wise by 〈ax1, ax2, . . . , axD〉.

Math for Machine Learning 6
• For x,y ∈ RD, the vector sum (or simply the sum) of x and y, denoted x + y, is again a vector in vector sum
RD defined component-wise by 〈x1 + y1, x2 + y2, . . . , xD + yD〉.
Figure ?? shows a simple example of vector addition and scalar product.
As you can deduce from the above, there is a vector, called the zero vector, often denoted 0, defined as zero vector
〈0, 0, . . . , 0〉 ∈ RD that is the additive identity: that is, x + 0 = x for all x ∈ RD. additive identity
Figure ?? shows an example of a scalar product (left) of the vector 〈1, 2〉 with two values of a: 0.5 and 2.Note that multiplying by 0.5 brings the point “closer” to the origin, while multiplying by 2 pushes it outfurther. On the right, we see an example of vector addition between the vector 〈1, 2〉 and the vector 〈2, 1〉 toyield the vector 〈3, 3〉. As can be seen from this figure, it is often helpful to think of vectors as “rays” thatpoint from the origin to the value x. This makes visualizing vector addition more straightforward.
Given this construction, one can also define, for instance, subtraction. x− y is just x + (−1)y, where (−1)is the real value of negative one.
The rules that govern scalar produces and vector sums agree with what one might imagine:
• x + y = y + x
• a0 = 0
• 0x = 0
• a(x + y) = ax + ay
TODO. . . Should we generalize here and talk about vector spaces in general, like `2 and L2 and `1, etc.?
2.2 Vector Norms
In many cases, we care about measuring the length of a vector, or the distance between two vectors. The length
distancenotion of a vector norm allows us to do this.vector norm
For instance, in the (uninteresting) vector space R, the standard norm would be absolute value. Using absolute valuejust the notion of absolute value, we can define the size of a number x as |x| and the distance between twonumbers x and y as |x− y|.
We now need to generalize this notion to arbitrary vector spaces, such as RD. A norm is any function g norm
that maps vectors to real numbers that satisfies the following conditions:
• Non-negativity: for all x ∈ RD, g(x) ≥ 0 Non-negativity
• Strictly positive: for all x, g(x) = 0 implies that x = 0 Strictly positive
• Homogeneity: for all x and a, g(ax) = |a| g(x), where |a| is the absolute value. Homogeneity
• Triangle inequality: for all x,y, g(x + y) ≤ g(x) + g(y) Triangleinequality
These conditions state, in turn, the following. First, lengths are always positive. Second, a length of zeroimplies that you are zero. Third, scalar multiplication extends lengths in a predictable way. Fourth, distancesadd “reasonably.”
Exercise 6. Verify that for the vector space R, the absolute value norm g(x) = |x| satisfies all four conditions.
An immediate question is: are norms unique (i.e., for every space, is there a single, unique norm for thatspace)? The answer is a resounding no!. For RD, there are lots of functions g that satisfy the aboveconditions. Here are some examples:

Math for Machine Learning 7
1. Euclidean norm: g(x) =√∑D
d=1 x2d
2. Manhattan norm: g(x) =∑Dd=1 |xd|
3. Maximum norm: g(x) = maxd |xd|
4. Zero norm: g(x) =∑Dd=1 1[xd 6= 0]
(Here, to define the zero norm, we have used an indicator function, denoted by “1[•]”. The value of 1[•] indicatorfunctionis one whenever “•” is “true” and zero otherwise.)
These three norms behave quite differently. Euclidean norm is probably the one you’re most familiar with.It corresponds in two dimensions to the Pythagorean theorem. Essentially, it measures length by walking ina straight line from the original to the point x.
Manhattan norm (named because of the grid system for laying out streets in Manhattan—not unlike SaltLake City!) measure length by walking along each dimension separately. You are not allowed to “cut across”diagonally.
Maximum norm measures the size of a vector as just the size of the maximum element in that vector.
Zero norm simply counts the number of non-zero elements in the vector.
Exercise 7. Compute each of the four norms on the following vectors:
1. 〈1, 2, 3〉
2. 〈1,−1, 0〉
3. 〈0, 0, 0〉
4. 〈1, 5,−6〉
Example 7. Let’s verify that the Euclidean norm is actually a norm (i.e., it satisfies the four conditions).
• Non-negativity: Let x be some vector; then look at√∑D
d=1 x2d. We know this value will be non-negative
so long as the sum is non-negative. But the sum is the sum of a bunch of values squared, so each ofthem has to be positive. Thus, Euclidean norm is non-negative.
• Strictly positive: suppose x is such that g(x) = 0. For contradiction, suppose that x 6= 0, which meansthere is some dimension d for which xd 6= 0. But now it cannot be the case that g(x) = 0 becausex2d > 0. This is a contradiction, so Euclidean norm is strictly positive.
• Homogeneity: let x and a be given. Then compute: g(ax) =√∑D
d=1(axd)2 =√∑D
d=1 a2x2d =√
a2∑Dd=1 x
2d = |a|
√∑Dd=1 x
2d = |a| g(x).
• Triangle inequality: this follows directly from the Pythagorean theorem.
Exercise 8. Verify that the Manhattan norm, the Maximum norm and the Zero norm are actually norms.(These are actually easier than the Euclidean case.)
One nice thing about these four norms is that they’re actually specific cases of a family of norms called theell-p norms, sometimes denoted by `p. (Note that it’s a script `, not a roman l.) This is either pronounced ell-p
“ell p” or “little ell p”, depending on the context. (There is another set of norms called the Lp norms, which

Math for Machine Learning 8
are often called the “big ell p” norms.) These are defined as follows. Let p be in the range [0,∞]; then the`p norm of x, denoted by ||x||p, is defined by:
||x||p =
(D∑d=1
|xd|p)1/p
(11)
Given this definition, it is easy to see that Euclidean norm is the `2 norm and Manhattan norm is the `1norm.
Maximum norm is a bit harder to see: it is actually the `∞ norm. The way to think about this is as follows.Take a vector of (positive) numbers and raise them all to some gigantic (almost infinite; say 1000000) power.Even if the vector is 〈2, 2, 2, 2.001, 2, 2〉, after raising it to a gigantic power, the fourth element, 2.0011000000
is going to totally dominate: it will be almost-infinitely bigger than the others. So then when we add themup, we’ll end up with a sum that is not really any different from 2.0011000000. So then when we raise thesum to 1/p, we’ll just get 2.001 back. (Yes, this is hand-wavy. But you can prove it formally by taking alimit as p tends toward infinity.)
Zero norm is also a bit tricky. Again, to prove it formally you have to argue in terms of limits as p approacheszero (from above). The intuition, however, is that as p goes to zero, any element xd that is non-zero will mapto x0
d = 1. On the other hand, any element xd that is zero, will map just to zero. So the non-zero elementsmap to one and the zero elements map to zero and we sum the resulting vector. This gives us precisely theZero norm.
Which norm should you use? It depends on your application. Definitely the most common are Euclidean(`2) and Manhattan (`1).
Once we’ve chosen a norm, we immediately get a method for computing distances. We define the distance distance
between two vectors x and y as ||x− y||, where ||•|| denotes the norm of our choosing. Thus, you can thinkof the length of the vector ||x|| as the distance of that point to the origin.
We will often make use of unit vectors. These are vectors x that have unit norm: ||x|| = 1 (for whatever unit vectors
particular norm we are using). So long as x is not the zero vector, we can normalize x by multiplying it by normalize
1/ ||x||. This yields a unit vector x/ ||x|| in the “same direction” (see Section 2.3) as x, but with unit norm.
Exercise 9. Verify that for non-zero x, we have that the norm of (1/ ||x||)x = 1. For simplicity, first showthat this is true for Euclidean norm. Next, show that it is true for any norm that satisfies the requiredproperties.
2.3 Dot Products
One thing that has been noticible absent from our discussion thus far is any notion of multiplying two vectorstogether. A standard variety of multiplication of vectors is the dot product. Before we define it, however, dot product
let’s motivate it a bit.
Let’s say I hand you two vectors x and y and I want to know if they are perpendicular to each other perpendicular
or not. In two dimensions, they are perpendicular if the angle between them is 90 degrees. That doesn’tanswer our question, though, because we don’t know how to generalize the notion of angle! Moreover, wemight want to know if x and y are roughly in the same direction. The dot product allows us to answer thesequestions.
Let x and y be vectors in RD. We define the dot product between x and y, denoted x · y as: dot product
x · y =D∑d=1
xdyd (12)
Math for Machine Learning 9
Note that the dot product returns a real value, not another vector. (Sometimes you will see different notationfor the dot product. The two other standard notations are 〈x,y〉 or x>y. We will actually use both of thesein the future, for different purposes, so be fore-warned! The latter will make more sense when we talk aboutmatrices—see Section 2.4).
Example 8. We can compute the dot product between 〈5, 3,−1〉 and 〈2, 0, 1〉 as:
(5× 2) + (3× 0) + (−1× 1) = 10 + 0− 1 = 9 (13)
Exercise 10. Compute the following dot products:
1. 〈1, 2, 3〉 · 〈4, 5, 6〉
2. 〈4,−1, 2〉 · 〈1, 1, 1〉
3. 〈0, 0, 1〉 · 〈1,−1, 1〉
Note that the dot product has a nice relationship to the Euclidean norm:
||x||22 = x · x (14)
The dot product (at least in Euclidean space) has a nice relationship to the angle between two vectors. Let angle
x and y be two vectors. Then it is easy to show that:
x · y = ||x||2 ||y||2 cos θ (15)
Where θ is the angle between x and y. Figure ?? has an example.
Thus, now that we have the notion of a dot product in hand, we can answer a whole host of questions. Wesay that two (non-zero) vectors are perpendicular if x · y = 0 (this means that cos θ = 90). And, we canmeasure the angle between x and y by their angle:
θ = arccos(
x · y||x|| ||y||
)(16)
The dot product satisfies the following useful properties:
• Commutativity: x · y = y · x Commutativity
• Distributivity: x · (y + z) = x · y + x · z Distributivity
The more mathy term for “perpendicular” is orthogonal. We will stick with this word from now on. orthogonal
Exercise 11. We claimed earlier that you can normalize a (non-zero) vector x by multiplying it by thescalar value (1/ ||x||), and that these two vectors are in the “same direction.” Show that this is true bydemonstrating that the angle between x and (1/ ||x||)x is zero.
One significant use of dot products is to evaluate projections. That is, u · v can be interpreted as a projections
projection of the vector u onto the vector v. It gives a scalar value that represents the distance that u goesin the direction of v. See Figure ?? for a geometric intuition. This makes the most sense when v is a unitvector. See Section 2.5 for more details.

Math for Machine Learning 10
2.4 Matrices
A real-valued matrix is a rectangular collection of real values. For instance, we might define the following matrix
matrix:
A =
5 10−2 0
1 −1
(17)
An index into a matrix is in row-by-column notation. This example matrix A has 3 rows and 2 columns.The value in the 2nd row and 1st column, denoted A2,1 is −2. (This is a bit confusing at first for those usedto thinking of x-by-y notation: it seems backwards.)
A matrix with N rows and M columns is usually called an N × M (“N by M”) matrix, and we writeA ∈ RN×M .
Note that we can think of vectors as matrices where one of the dimensions is 1. The standard is to say thata vector of length D is a matrix with D rows and 1 column. Thus, vectors are “tall skinny” matrices thatlive in RD×1.
Matrices can be manipulated in very similar ways to vectors, in terms of sums and products:
• For A ∈ RN×M and a ∈ R, the matrix aA is also in RN×M with values given by (aA)n,m = aAn,m.(Here, we denote the n,mth element of aA as (aA)n,m.)
• For A,B ∈ RN×M , the sum A+B is of the same size with values given by (A+B)n,m = An,m+Bn,m
One convenient piece of notation is the matrix cut. Let A be N ×M . Then, we write An,• to denote the matrix cut
row vector obtained by taking the nth row of A. Similarly, A•,m is the column vector obtained by takingthe mth column of A.
Just as we defined many different norms over vectors, we can also define different matrix norms. However, matrix norms
since we won’t make use of these properties in any great depth, we’ll just mention the most common. Thisis analogous to the Euclidean (`2) norm on vectors and is called the Frobenius norm: Frobenius norm
||A||Fro =
√√√√ N∑n=1
M∑m=1
A2n,m (18)
There are two important notions of multiplication of matrices, each of which has different properties. Theeasiest to understand is the Hadamard product, also called the element-wise product, typically denoted Hadamard
product
element-wiseproduct
�:
(A�B)n,m = An,mBn,m (19)
The Hadamard product is only defined over matrices of equal size (say, N ×M) and returns a matrix of thatsize (again, N ×M). The value in each cell of the returned matrix is just the product of the values in thecorresponding cells of the original two matrices.
Example 9. An easy example of Hadamard product: 5 10−2 0
1 −1
� 2 −1−1 5
0 1
=
5× 2 10×−1−2×−1 0× 5
1× 0 −1× 1
=
10 −102 00 −1
(20)
Exercise 12. The two two matrices from the previous example and compute the Hadamard product betweeneach and itself. How does this relate to Frobenius norm?

Math for Machine Learning 11
Hadamard multiplication is commutative: A�B = B�A; associative: A� (B�C) = (A�B)�C); anddistributive: A� (B + C) = A�B + A�C.
The second, perhaps more common, type of matrix multiplication is the inner product. Let A be N×K matrixmultiplication
inner product
and let B be K ×M . Then the inner product of A and B, written AB is a matrix of size N ×M . It iscalled an inner product because the inner dimensions of the multiplication must “match up.” The productis defined as:
(AB)n,m =K∑k=1
An,kBk,m (21)
This can be though of in terms of matrix cuts. The n,mth cell in the resulting matrix is given by the (vector)dot product 〈An,•,B•,m〉. Note that since the internal dimension size K must match up, this vector dotproduct is well defined.
Example 10. As an example of matrix multiplication, we have:
[5 −2 1
10 0 −1
]︸ ︷︷ ︸
dims 2×3
2 −1−1 5
0 1
︸ ︷︷ ︸
dims 3×2
=
dims 2×2︷ ︸︸ ︷[5× 2 + (−2)× (−1) + 1× 0 5× (−1) + (−2)× 5 + 1× 110× 2 + 0× (−1) +−1× 0 10× (−1) + 0× 5 +−1× 1
]
=[
12 −1420 −11
]Exercise 13. Compute the following matrix products:
1.[
1 2 34 5 6
] −1−2−3
2.[−1 1 −1 1
1 −1 1 −1
]−1 1−2 2−3 3−4 4
Matrix multiplication is associative: A(BC) = (AB)C); and distributive: A(B + C) = AB + AC, but isnot commutative! In general, it is not true that AB = BA (even if A and B are square).
A useful matrix operation is the transpose operator, denoted “>”. The transpose of a matrix A is simply transpose
the matrix you get by “rotating” A. That is, if we start out with A ∈ RN×M , then the transpose, denotedA>, is now in RM×N . The values are defined by:
(A>)m,n = An,m (22)
Example 11. For instance, we can compute the following transpose: 5 10−2 0
1 −1
> =[
5 −2 110 0 −1
](23)
The notion of transposition is where we get the previously mention notation for vector dot products. The dot products
vector 〈1, 2, 3〉 corresponds to the 3 × 1 matrix [1 2 3]>. Similarly, the vector 〈4, 5, 6〉 corresponds to the
Math for Machine Learning 12
3× 1 matrix [4 5 6]>. Taking the transpose of the first, we get a 3× 1 matrix and a 1× 3 matrix. Thesecan be multiplied (in the matrix multiplication sense) to yield a scalar value: 1
23
> 456
= [1 2 3]
456
= (1× 4) + (2× 5) + (3× 6) = 5 + 10 + 18 = 33 (24)
Which is precisely the dot product between these two vectors. This is where the notation x>y for the dotproduct between two vectors comes from.
Exercise 14. Let A be the left-most matrix from Eq (20). What is the value A>A? What is the valueAA>? How does these relate to the Frobenius norm?
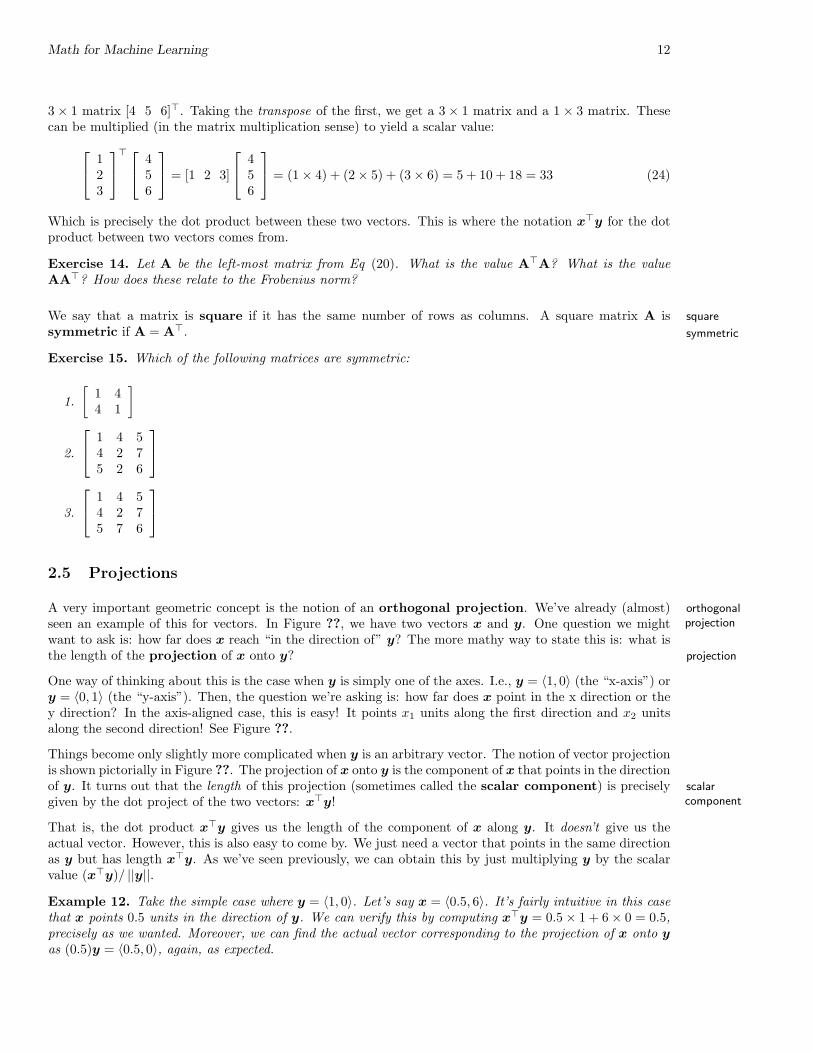
We say that a matrix is square if it has the same number of rows as columns. A square matrix A is square
symmetric if A = A>. symmetric
Exercise 15. Which of the following matrices are symmetric:
1.[
1 44 1
]
2.
1 4 54 2 75 2 6
3.
1 4 54 2 75 7 6
2.5 Projections
A very important geometric concept is the notion of an orthogonal projection. We’ve already (almost) orthogonalprojectionseen an example of this for vectors. In Figure ??, we have two vectors x and y. One question we might
want to ask is: how far does x reach “in the direction of” y? The more mathy way to state this is: what isthe length of the projection of x onto y? projection
One way of thinking about this is the case when y is simply one of the axes. I.e., y = 〈1, 0〉 (the “x-axis”) ory = 〈0, 1〉 (the “y-axis”). Then, the question we’re asking is: how far does x point in the x direction or they direction? In the axis-aligned case, this is easy! It points x1 units along the first direction and x2 unitsalong the second direction! See Figure ??.
Things become only slightly more complicated when y is an arbitrary vector. The notion of vector projectionis shown pictorially in Figure ??. The projection of x onto y is the component of x that points in the directionof y. It turns out that the length of this projection (sometimes called the scalar component) is precisely scalar
componentgiven by the dot project of the two vectors: x>y!
That is, the dot product x>y gives us the length of the component of x along y. It doesn’t give us theactual vector. However, this is also easy to come by. We just need a vector that points in the same directionas y but has length x>y. As we’ve seen previously, we can obtain this by just multiplying y by the scalarvalue (x>y)/ ||y||.
Example 12. Take the simple case where y = 〈1, 0〉. Let’s say x = 〈0.5, 6〉. It’s fairly intuitive in this casethat x points 0.5 units in the direction of y. We can verify this by computing x>y = 0.5× 1 + 6× 0 = 0.5,precisely as we wanted. Moreover, we can find the actual vector corresponding to the projection of x onto yas (0.5)y = 〈0.5, 0〉, again, as expected.
Math for Machine Learning 13
Exercise 16. Take x from the previous example and project it onto the other axis. What is the length ofthis projection? What is the vector corresponding to the projection?
Exercise 17. Compute the projection of x onto y (as a vector) for each of the following pairs:
1. x = 〈6, 0.5〉 and y = 〈1, 2〉
2. x = 〈1, 2〉 and y = 〈1, 2〉
3. x = 〈2, 3〉 and y = 〈1, 0〉
4. x = 〈−2, 3〉 and y = 〈1, 0〉
One way to think about projections of x onto y is in terms of projections of vectors onto the one-dimensionalsubspace defined by {y}. If we think of the y a one dimensional subspace, then the projection of x onto yis precisely the projection of x onto the subspace defined by y. subspace
Now, let’s consider some special cases. Let u = 〈2, 0.5 and let v = 〈1, 0〉 and w = 〈0, 1〉. Note that both vand w are unit vectors. What is the projection of u onto v? 2. And onto w? 0.5. We note an interestingfact: we can write u as 2v + 0.5w. In fact, this is a general fact, so long as v and w are unit and orthogonal(which you can easily verify). See Figure ??.
Let’s take this a step further. Let v = 〈√
2/2,√
2/2〉 and w = 〈−√
2/2,√
2/2〉. Again, you can verify thatthese are unit vectors and that they are orthogonal. Now, let’s compute:
u · v =√
2 +√
2/4 = 54
√2 (25)
u ·w =√
2−√
2/4 = 34
√2 (26)
This implies that we can write u = 54
√2u + 3
4
√2w, which we can verify geometrically in Figure ??.
This way of thinking is useful to generalize the notion of projecting a vector onto a vector to that of projectinga vector onto a matrix. Let x be a vector in RD and let A be an N ×D matrix. As before, we think of thespan of A as the span of the N -many D-dimensional vectors obtained through cuts of A. The projection ofx onto A is just the projection of x onto the subspace spanned by A: see Figure ??.
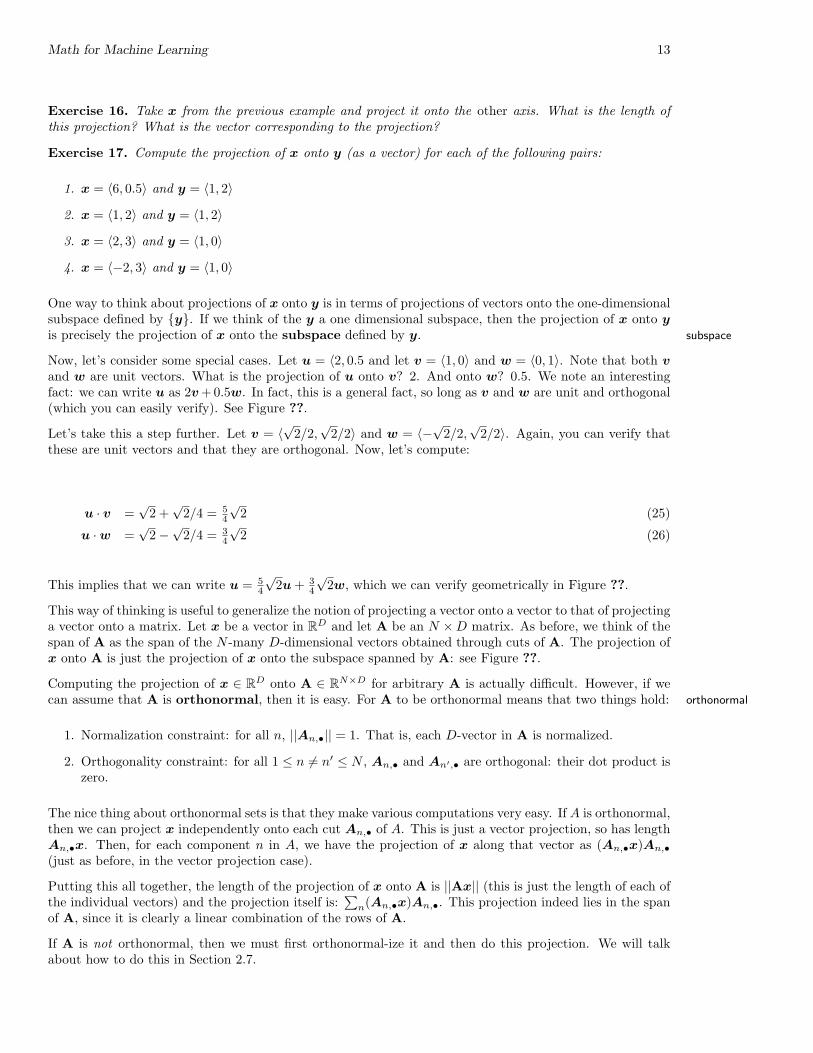
Computing the projection of x ∈ RD onto A ∈ RN×D for arbitrary A is actually difficult. However, if wecan assume that A is orthonormal, then it is easy. For A to be orthonormal means that two things hold: orthonormal
1. Normalization constraint: for all n, ||An,•|| = 1. That is, each D-vector in A is normalized.
2. Orthogonality constraint: for all 1 ≤ n 6= n′ ≤ N , An,• and An′,• are orthogonal: their dot product iszero.
The nice thing about orthonormal sets is that they make various computations very easy. If A is orthonormal,then we can project x independently onto each cut An,• of A. This is just a vector projection, so has lengthAn,•x. Then, for each component n in A, we have the projection of x along that vector as (An,•x)An,•(just as before, in the vector projection case).
Putting this all together, the length of the projection of x onto A is ||Ax|| (this is just the length of each ofthe individual vectors) and the projection itself is:
∑n(An,•x)An,•. This projection indeed lies in the span
of A, since it is clearly a linear combination of the rows of A.
If A is not orthonormal, then we must first orthonormal-ize it and then do this projection. We will talkabout how to do this in Section 2.7.
Math for Machine Learning 14
2.6 Important Matrices
There are a few matrices that will come up over an over again. The first is the identity matrix. The identity matrix
identity matrix is always square (that is, it has dimension D ×D). The D-dimensional identity matrix is square
the matrix that has zeros in every cell except the diagonal. It is denoted ID, or, when the dimensionality isclear from context, just I. A few examples:
I2 =[
1 00 1
]; I3 =
1 0 00 1 00 0 1
; I4 =
1 0 0 00 1 0 00 0 1 00 0 0 1
(27)
The identity matrix has several nice properties. Assuming dimensions match up, we have:
• I> = I
• IA = AI = A
Exercise 18. Prove the second claim.
Another important matrix is the zero matrix, denoted 0 (not to be confused with the zero vector, 0). This zero matrix
is the (not necessarily square) matrix of all zeros. Again, assuming dimensions match up, the zero matrixhas the nice properties that:
• 0> = 0
• 0A = A0 = 0
Finally, there’s the ones matrix, denoted 1 (not to be confused with the indicator function 1[•]). This is ones matrix
the (not necessarily square) matrix of all ones. It only obeys the symmetry property (when it is square).
2.7 Matrix Properties: Trace, Determinant and Rank
At this point, you’re going to have to suspend disbelief and just acknowledge that what we’re about to talkabout is at all important. As we progress, it will become obvious that these things are very important. Butfor now, just have faith.
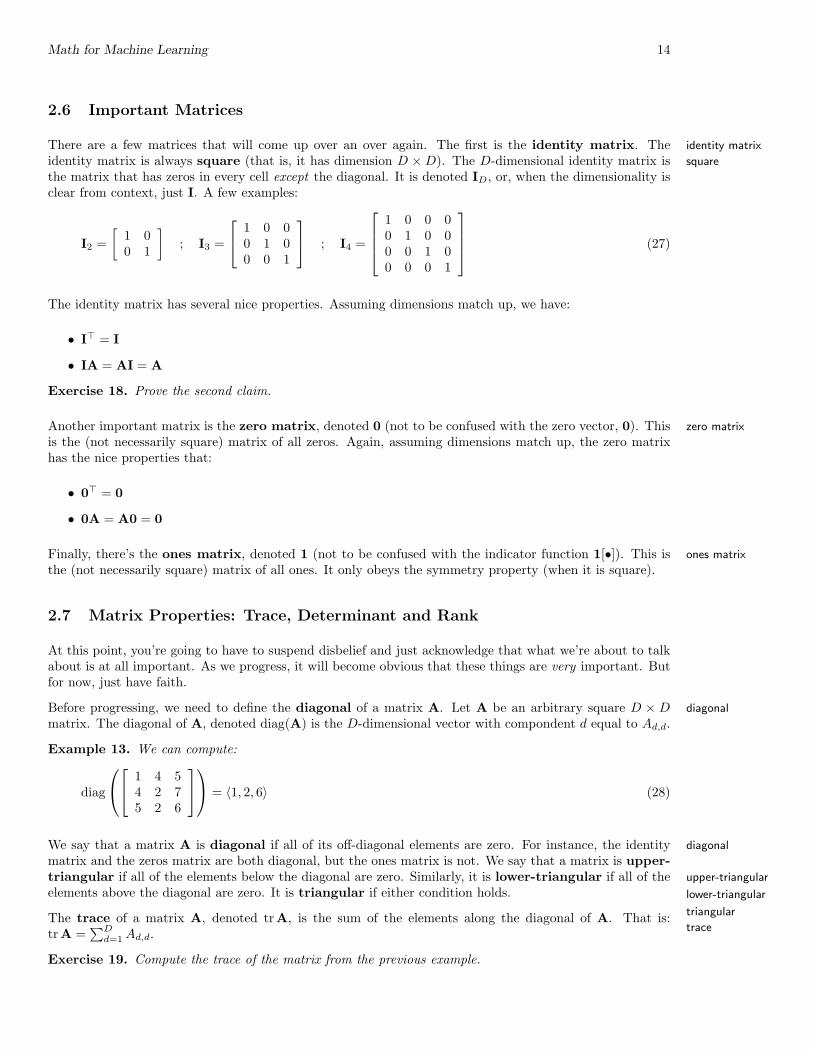
Before progressing, we need to define the diagonal of a matrix A. Let A be an arbitrary square D × D diagonal
matrix. The diagonal of A, denoted diag(A) is the D-dimensional vector with compondent d equal to Ad,d.
Example 13. We can compute:
diag
1 4 54 2 75 2 6
= 〈1, 2, 6〉 (28)
We say that a matrix A is diagonal if all of its off-diagonal elements are zero. For instance, the identity diagonal
matrix and the zeros matrix are both diagonal, but the ones matrix is not. We say that a matrix is upper-triangular if all of the elements below the diagonal are zero. Similarly, it is lower-triangular if all of the upper-triangular
lower-triangularelements above the diagonal are zero. It is triangular if either condition holds.triangularThe trace of a matrix A, denoted tr A, is the sum of the elements along the diagonal of A. That is:tracetr A =
∑Dd=1Ad,d.
Exercise 19. Compute the trace of the matrix from the previous example.

Math for Machine Learning 15
The trace of a matrix, although simplistic, is often used as a measure of the “size” of a matrix. Note that itis not a norm, in that it doesn’t satisfy the necessary requirements, but it is sort of reasonable.
Exercise 20. What is the value of tr[AA>]? What about tr[A>A]? What do these remind you of?
While the trace is fairly easy to comprehend, the determinant is quite a bit more complicated. We’ll start determinant
with a special case of 2 × 2 matrices. The determinant of a matrix A, denoted det A, is defined as followsfor 2× 2 matrices:
det[a bc d
]= ad− bc (29)
Note that if A is diagonal, the the determinant is the product of the elements along its diagonal. However,if it’s not diagonal, the determinant is quite a bit different.
Exercise 21. Compute the determinant of the following matrices:
1. I2
2.[
5 12 4
]
3.[
2 103 6
]
Extending the notion of a determinant to larger matrices is a bit involved. We’ll give a recursive definitionand then give an example.
Let A be a D×D matrix. Denote by A−i,−j the matrix obtained by removing the ith row and jth columnfrom A. (Thus, A−i,−j is a (D − 1)× (D − 1) matrix.) For arbitrary A, the determinant of A is:
det A =D∑d=1
(−1)1+dA1,d det A−1,−d (30)
We can end the recursion once we’ve gotten down to a 2× 2 matrix, for which we know how to perform thecomputation.
What this computation is doing is the following. We loop (d) over every column of A. On column d, weremove the first row and dth column from A and recursively compute the determinant on that smallermatrix. We multiply this value by A1,d. Then, if d is odd, we add the resulting value to the running sum; ifd id even, we subtract the resulting value. (This last part is encoded in the (−1)1+d term.)
It is not terribly important for our purposes that you know how to compute a determinant (there are muchmore efficient methods than actually evaluating the recursion).
Here are some important observations about determinants:
• If A is triangular, then the determinant is the product of the diagonal of A.
• If we take some row Ad,• of A and add it to another row (perhaps scaled in some way), then thedeterminant is unchanged !
• If two rows of A are swapped to produce B, then det A = −det B.
• If one row of A is multiplied by a scalar a to produce B, then det B = k det A.
Math for Machine Learning 16
This last property tells us that det(aA) = aDA, since the standard scalar product over matrices multiplesevery row by the scalar a, and there are D-many rows.
These properties may seem mysterious at first (the certainly did to me!), but their importance will becomeclear later on when we start using determinants to do computation.
The difficulty arises with A is not orthonormal. (Actually, the normalization aspect is irrelevant. We onlyare worried with A is not orthogonal.) In this case, we have to ask ourselves: what is the size of the smallestmatrix B that has the same span as A. Such a matrix B will not be unique, but its dimensionality will be.
Example 14. Consider the matrix defined by the set of vectors in R3: {〈1, 0, 1〉, 〈0, 1, 0〉, 〈1, 2, 1}. This doesnot define an orthogonal set. In particular, the third element can be obtained as a linear combination of thefirst two, and is therefore not orthogonal. In this case, we can see that if we simply drop the third element,we are left with a set of 2 points that are orthogonal and do span the same space as the original set. Thismeans the the rank of the original matrix was actually 2.
The important property of the rank of a matrix is that it tells us the true size of the subspace spanned bythis matrix. We say that a matrix A ∈ RN×D (with N ≤ D) is full rank if the rank of A is equal to N . In full rank
general, we like to work with full rank matrices: a matrix that is not full rank is somehow wasteful.
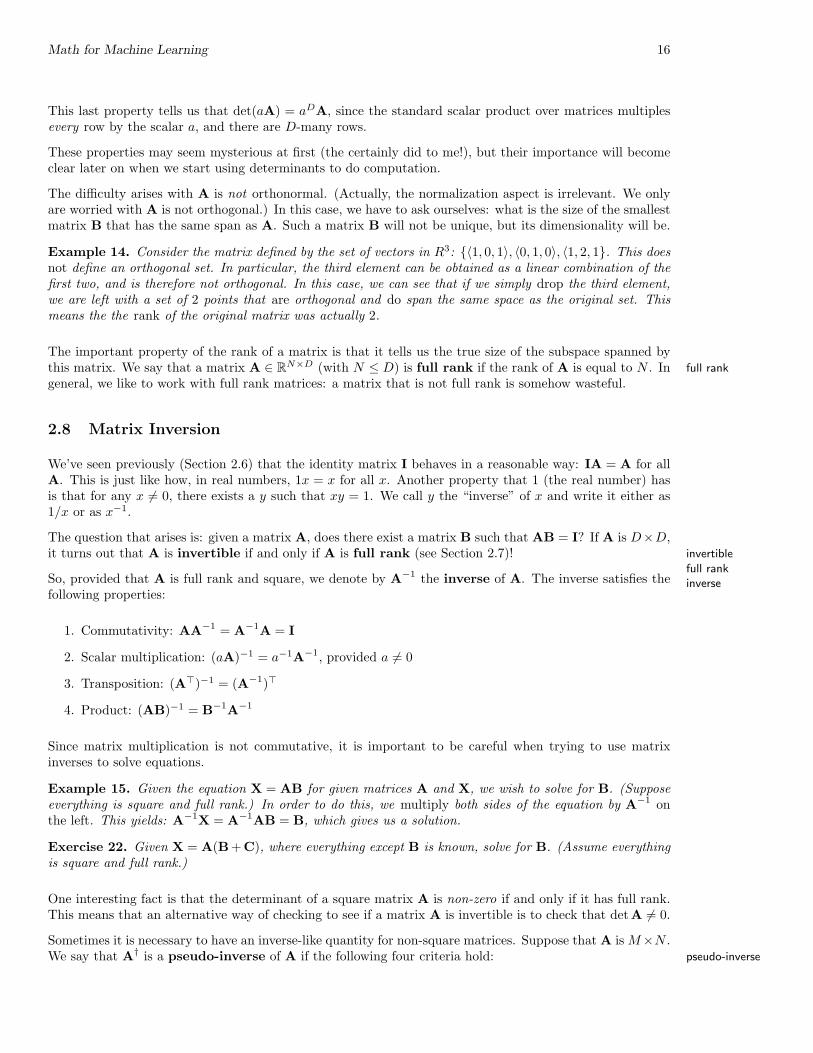
2.8 Matrix Inversion
We’ve seen previously (Section 2.6) that the identity matrix I behaves in a reasonable way: IA = A for allA. This is just like how, in real numbers, 1x = x for all x. Another property that 1 (the real number) hasis that for any x 6= 0, there exists a y such that xy = 1. We call y the “inverse” of x and write it either as1/x or as x−1.
The question that arises is: given a matrix A, does there exist a matrix B such that AB = I? If A is D×D,it turns out that A is invertible if and only if A is full rank (see Section 2.7)! invertible
full rankSo, provided that A is full rank and square, we denote by A−1 the inverse of A. The inverse satisfies the inversefollowing properties:
1. Commutativity: AA−1 = A−1A = I
2. Scalar multiplication: (aA)−1 = a−1A−1, provided a 6= 0
3. Transposition: (A>)−1 = (A−1)>
4. Product: (AB)−1 = B−1A−1
Since matrix multiplication is not commutative, it is important to be careful when trying to use matrixinverses to solve equations.
Example 15. Given the equation X = AB for given matrices A and X, we wish to solve for B. (Supposeeverything is square and full rank.) In order to do this, we multiply both sides of the equation by A−1 onthe left. This yields: A−1X = A−1AB = B, which gives us a solution.
Exercise 22. Given X = A(B + C), where everything except B is known, solve for B. (Assume everythingis square and full rank.)
One interesting fact is that the determinant of a square matrix A is non-zero if and only if it has full rank.This means that an alternative way of checking to see if a matrix A is invertible is to check that det A 6= 0.
Sometimes it is necessary to have an inverse-like quantity for non-square matrices. Suppose that A is M×N .We say that A† is a pseudo-inverse of A if the following four criteria hold: pseudo-inverse
Math for Machine Learning 17
1. AA†A = A
2. A†AA† = A
3. (AA†)> = AA†
4. (A†A)> = A†A
It turns out that the pseudo-inverse exists and is unique for any matrix A. In the case that A is invertible,A−1 = A†, so the pseudo-inverse extends the notion of inverse.
Sometimes the pseudo-inverse is called the Moore-Penrose inverse. Moore-Penroseinverse
2.9 Eigenvectors and Eigenvalues
TODO. . . write this!
2.10 Wrap-up
The most important concepts from this section are:
• Definition of basic operations on vectors and matrices
• Interpreting dot products as projections
• Vector and matrix norms
• The properties of the matrix inverse (and that you can’t always invert a matrix!)
The matrix cookbook (http://matrixcookbook) provides lots more detail on all of these things and more!
3 Multidimensional Calculus
We’ve already hinted several times that differentiation in high dimensional spaces is going to be important.
For example, suppose we have vectors w and x and a function f(w,x) = w>x. We might want to differ-entiate f with respect to w so that we can (for instance) maximize it. This is where differentiation withrespect to vectors becomes important.
We’ll start with a definition and then just convince you that differentiating in high dimensions is exactly thesame as differentiating in one dimension.
Suppose f(w) is some function of a D-dimensional vector w = 〈w1, w2, . . . , wD〉. We can compute partialderivatives of f with respect to each component of w:
∂f
∂w1,
∂f
∂w2,
∂f
∂w3, . . . ,
∂f
∂wD(31)
Each of these are just univariate derivatives. If we package them together into a vector, we get the gradient gradient
of f with respect to the vector w. Gradient is just the fancy term for multidimensional derivative. It isdenoted by ∇wf , and is formally defined as:

Math for Machine Learning 18
∇wf =
∂f∂w1∂f∂w2∂f∂w3
...∂f∂wD
(32)
Example 16. Let’s take a simple example. Suppose f(w) = w>〈1, 2, 3, 0,−1〉 = 1w1+2w2+3w3+0w4−1w5.We can compute:
∂f
∂w1= 1 (33)
∂f
∂w2= 2 (34)
∂f
∂w3= 3 (35)
∂f
∂w4= 0 (36)
∂f
∂w5= −1 (37)
(38)
So the gradient is simply ∇wf = 〈1, 2, 3, 0,−1〉. Note that this is complete analogous to a standard derivative.f is just the “product” of w and 〈1, 2, 3, 0,−1 and it’s “derivative” is just the vector 〈1, 2, 3, 0,−1〉.
Example 17. Let’s take another example that’s slightly more complicated: f(w) = w>w (note that thisis just squared Euclidean norm). Rewriting in non-vector notation, we have f(w) =
∑i w
2i . Let’s compute
partial derivatives:
∂f
∂w1= 2w1 (39)
∂f
∂w2= 2w2 (40)
... (41)∂f
∂wD= 2wD (42)
(43)
Note, that, in general, ∂f/∂wi = 2wi, which means that ∇wf = 2w! Again, w>w is basically like w2 andthe derivative is just like 2w!
Example 18. Let’s do one more really simple example. Note that we can express “the sum of the elementsof w” as f(w) = 1>w, where 1 is a vector of ones. Can you guess what ∇wf is? Let’s work it out.f(w) =
∑i 1wi, so ∂f/∂wj = 1 for all j. Thus, ∇wf = 1. Note that this is the ones vector, and is not
the constant one.

Math for Machine Learning 19
As you might expect, function composition works in exactly the same way as in univariate calculus.
Exercise 23. Suppose f(w) = (w>x)2 for some constant vector x. Compute ∇wf . Hint: Begin by writingf in non-vector form. Then take the derivative with respect to some component wj. Package these up intoa vector to get the gradient.
Exercise 24. Similar to the previous exercise, verify that when f(w) = exp[w>x], we get ∇wf = exp[w>x]x.
We can generalize this as follows. Suppose f(w) = g(h(w)) for some arbitrary functions g and h. We wishto compute ∇wf . First, we compute the gradient of the “inside” and let u = ∇wh. Now, we take thederivative of g – which we’ll call g′ here. The gradient of f is then just ug′(h(w)), as in univarite calculus.
As you can see, most of these conform to our intuitions based on univariate calculus. There are lots ofidentities listed in the matrix cookbook (http://matrixcookbook):
Just as gradients are the multidimensional equivalents of derivatives, the Hessian matrix is the multidi- Hessian matrix
mensional equivalents of second derivatives. Let f(w) be a D-dimensional function. The Hessian of f is thematrix of second derivatives:
H(f) =
∂2f∂w2
1
∂2f∂w1∂w2
. . . ∂2f∂w1∂wD
∂2f∂w1∂w2
∂2f∂w2
2. . . ∂2f
∂w2∂wD
......
......
∂2f∂w1∂wD
∂2f∂w2∂wD
. . . ∂2f∂w2
D
(44)
That is, it is a matrix where(H(f)
)i,j
= ∂2f∂wi∂wj
. By physical analogy, the derivative of a function is it’s
rate of change (“velocity”). The gradient of a function is its velocity in each available dimension. The secondderivative of a function is the rate of change of it’s velocity, aka it’s acceleration. The Hessian of a functionis the rate at which different dimension accelerate together. In other words, if H2,2 is high, then it meansthat there is a high (positive) rate of change in the second dimension. If H1,2 is high, then it means thatas we accelerate in the first dimension, we simultaneously accelerate in the second dimension. If H1,2 isnegative, it means that as we accelerate in the first dimension, we decelerate in the second dimension.
3.1 Multidimensional Convexity
We discussed the idea of convex subsets of R in Section 1.3. Namely, a set A ⊆ R is convex if and only if∀x, y ∈ A,∀λ ∈ [0, 1] it holds that λx+ (1−λ)y ∈ A. The definition for high dimensional spaces is identical.Let RD be D-dimensional Euclidean space, then A ⊂ RD is convex if and only if for all vectors x,y ∈ A andall λ ∈ [0, 1], we have that λx+ (1−λ)y ∈ A. Figure ?? shows an example of a convex set and a non-convexset. Convex sets look like balls, non-convex sets look like potatoes (or worse!).
Example 19. Let Ap be a D dimensional `p ball centered at the origin. Namely Ap is the set of all pointswith `p norm less than or equal to one; that is: Ap = {x : ||x||p ≤ 1}. Figure ?? shows examples of suchballs for different p. As we can see from these figures, the `p balls for p < 1 are non-convex but the `p ballsfor p ≥ 1 are convex!.
Exercise 25. Prove the above claim for p = 0.5, p = 1 and p = 2.
Exercise 26. Prove the above claim for all p. (This is kind of hard.)
Convex functions in higher dimensional space are actually harder to define that convex sets.
Now, recall from one dimension that f is convex if f ′′ ≥ 0 (it’s strictly convex if f ′′ > 0). This was easy,because f ′′ is just a scalar value. How we have a matrix and we need some equivalent statement. The
Math for Machine Learning 20
equivalent statement is that the matrix H is positive semi-definite, written H � 0 (in Latex, this is positivesemi-definitesucceq). (Similarly, it is strictly convex if H � 0, or H is positive definite.) positive definite
3.1.1 Positive Semi-Definite-ness
The whole notion of being positive semi-definite is something that is hard to grasp, but it comes up all thetime. The reason it comes up all the time is because begin positive semi-definite is the analogue for matricesof just being a non-negative real number: something that comes up all the time! It’s terribly annoying towrite “positive semi-definite” all the time, so we will just write psd in the future. psd
There are actually lots of ways to define what it means to be psd. We’ll do it by making an analogy to justregular positive numbers. Let a be a real value. We’ll define a to be “fluffy” if the following holds: for allreal values x, we have that ax2 ≥ 0. This is a slightly odd definition, but the important thing to realize isthat a is fluffy if and only if a is non-negative! That is, we’ve essentially redefined non-negativeness in avery strange way. Note that we can equivalently write the fluffy requirement as being: for all x, xax ≥ 0.
Now, let’s move to matrices. Define a matrix A to be “multi-dimensional fluffy” if for all vectors x, wehave that x>Ax ≥ 0. If we carry out the computation, this is just saying that for all x, we have that∑i,j Ai,jxixj ≥ 0. Hopefully it’s clear that being multi-dimensional fluffy is a strict generalization of being
fluffy.
Well, and here’s the magic: multi-dimensional fluffy is just the definition of being positive semi-definite!That is, a psd matrix is just the multi-dimensional analogue of a non-negative real value!
3.1.2 Convex Sets and Convex Functions
So what do convex functions have to do with convex sets? The first thing they have in common is thatthey’re easy to deal with. However, the real reason is that you can equivalently define convex functions interms of convex sets. To see this, let f be some function. Define the set A = {(x, y) ∈ R2 : f(x) ≤ y}. Ineffect, this set A is the set of all points that lie above the plot of the function f . It can be shown that f is aconvex function if and only if A is a convex set.
Exercise 27. Prove the above claim. (This is kind of hard!)
3.2 Wrap-up
The things you should know are:
• Gradients are multidimensional derivatives
• How to compute gradients
• Hessians are multidimensional second derivatives
• Convex sets are not potatoes
• Positive definite matrices are just like positive numbers
• Convex functions are those whose Hessians are psd

Math for Machine Learning 21
4 Probability & Statistics
PRML actually has a fairly good discussion of basic probability and statistics. See Section 1.2 (though butnot including the part on “Bayesian probabilities”) and Section TODO. . . .
The important things that you should really know are:
• The difference between computing the probability of some event and sampling from the associateddistribution
• Joint and conditional distributions
• Marginal distributions
• Chain rule and Bayes’ rule
• Standard distributions: Bernoulli, Binomial, Multinomial, Uniform and Gaussian
• Expectation, variance and standard deviation
• Covariance
One thing that always seems to trip students up who aren’t used to these this is that it is okay for acontinuous distribution to have density greater than one at some point.
Example 20. Let p be a Gaussian distribution with zero mean and variance 0.1. Let’s compute it’s densityat 0:
p(0) = Nor(0 | 0, 0.1) (45)
= 1√2π0.1
exp[− 1
2(0.1)02]
(46)
=√
12π0.1 (47)
=√
10.6283 (48)
=√
1.5915 (49)= 1.2615 (50)
This is very definitely above one! In fact, if we replace 0.1 with 0.01, we get a value of almost 4!
The thing to remember is that continuous probability densities are not like discrete densities. That is, fora continuous density, p(0) is not the probability of drawing a zero from this distribution. If you think ofa Gaussian, the probability of drawing any value at all is always zero! This is because you’re drawing realnumbers, and you’re never going to draw exactly some given value (it will always differ in the 100th decimalplace or something). The right way to interpret it is that the probability of drawing some value in the range[a, b] is
∫ ba
dxp(x). It is this value that should always be less than (or equal to) one.5
5Keep in mind that it’s easy to have a function that takes values greater than one, but still integrates to one. Simply recallthe example from Section 1.2 of f(x) = 1/x2, which takes value 4 at x = 0.5, but still integrates to 1.