Math 152 Calculus and Analytic Geometry II · 2012-04-03 · Math 152 Calculus and Analytic...
13
Math152Sec51AreasAndDistancesNotesDone.notebook March 30, 2012 Math 152 Calculus and Analytic Geometry II Sec 5.1 Areas and Distances How can you find the area of a region with curvy sides? How can you find the total distance travelled when the velocity is changing? How can you find the area of a region with curvy sides? How can you find the total distance travelled when the velocity is changing?
Transcript of Math 152 Calculus and Analytic Geometry II · 2012-04-03 · Math 152 Calculus and Analytic...

Math152Sec51AreasAndDistancesNotesDone.notebook March 30, 2012
Math 152 Calculus and Analytic Geometry II
Sec 5.1 Areas and Distances
How can you find the area of a region with curvy sides?
How can you find the total distance travelled when the velocity is changing?
How can you find the area of a region with curvy sides?
How can you find the total distance travelled when the velocity is changing?

Math152Sec51AreasAndDistancesNotesDone.notebook March 30, 2012
Start by plotting g(x)=x^2-2x+1 with n=1. Then change g(x) and change n, a and b.
http://www.math.ohiostate.edu/~maharry/GeoGebra/RiemanSums.html
http://mathworld.wolfram.com/RiemannSum.html
http://demonstrations.wolfram.com/CommonMethodsOfEstimatingTheAreaUnderACurve/
Try to do the same with y=x^2 over the interval from [0,4] with 4 intervals. Use the left endpoints.
Try the same with 8 intervals?
Try it with the applet before to see what happens with many intervals...

Math152Sec51AreasAndDistancesNotesDone.notebook March 30, 2012
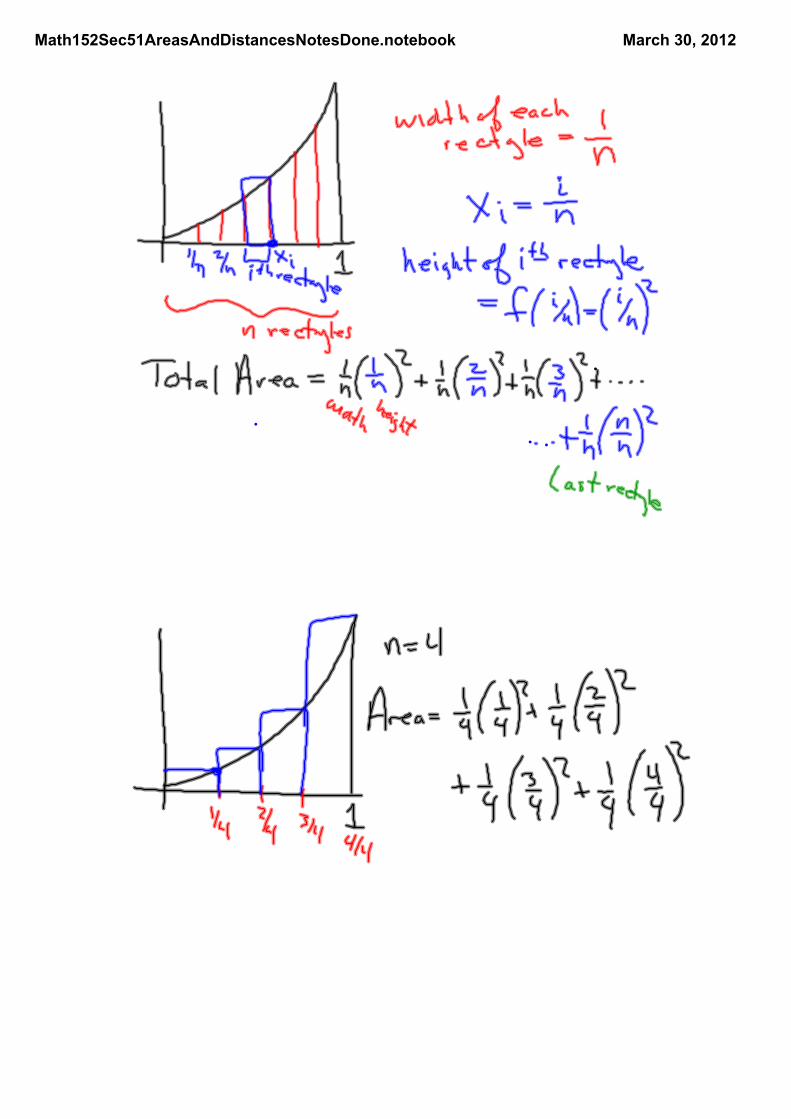
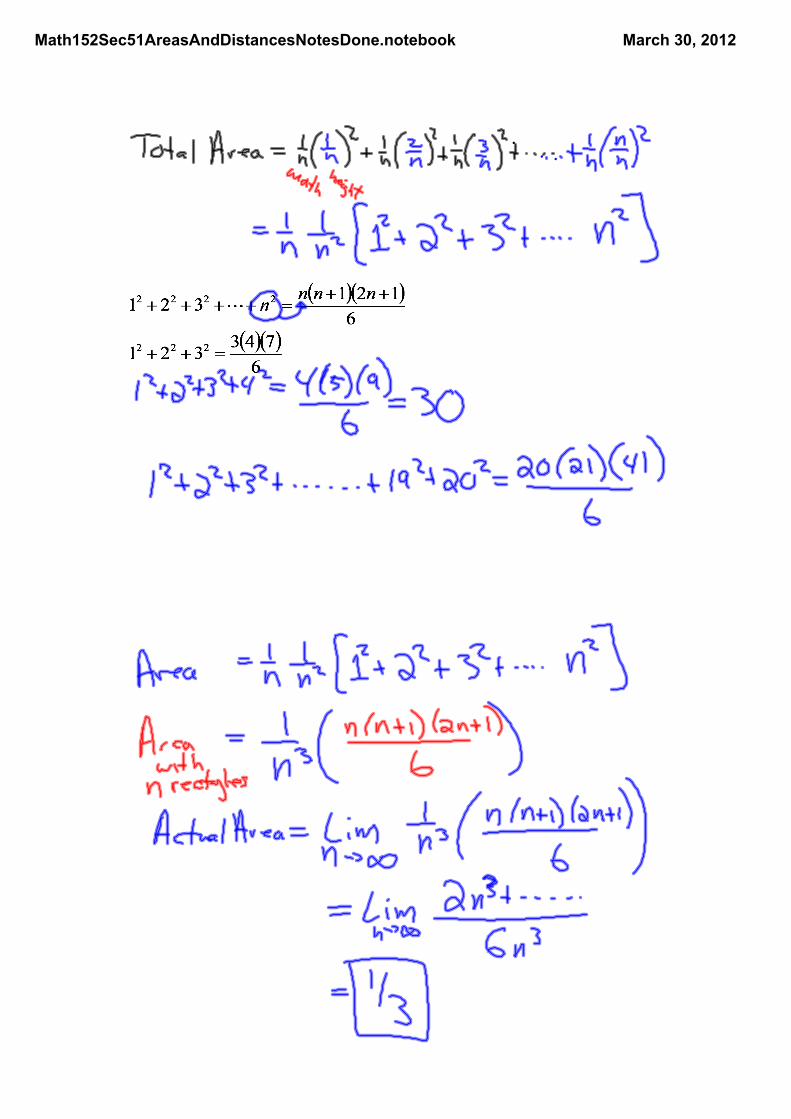
Find the area under the curve y=x^2 on the interval [0,1] using n rectangles and the right endpoints.
Use this formula:
Math152Sec51AreasAndDistancesNotesDone.notebook March 30, 2012
Math152Sec51AreasAndDistancesNotesDone.notebook March 30, 2012

Math152Sec51AreasAndDistancesNotesDone.notebook March 30, 2012
Now we will try the same idea with a general function y=f(x) on the interval [a,b] using n equal intervals.
Math152Sec51AreasAndDistancesNotesDone.notebook March 30, 2012
Another Riemann Sum Plotterhttp://mathworld.wolfram.com/RiemannSum.html
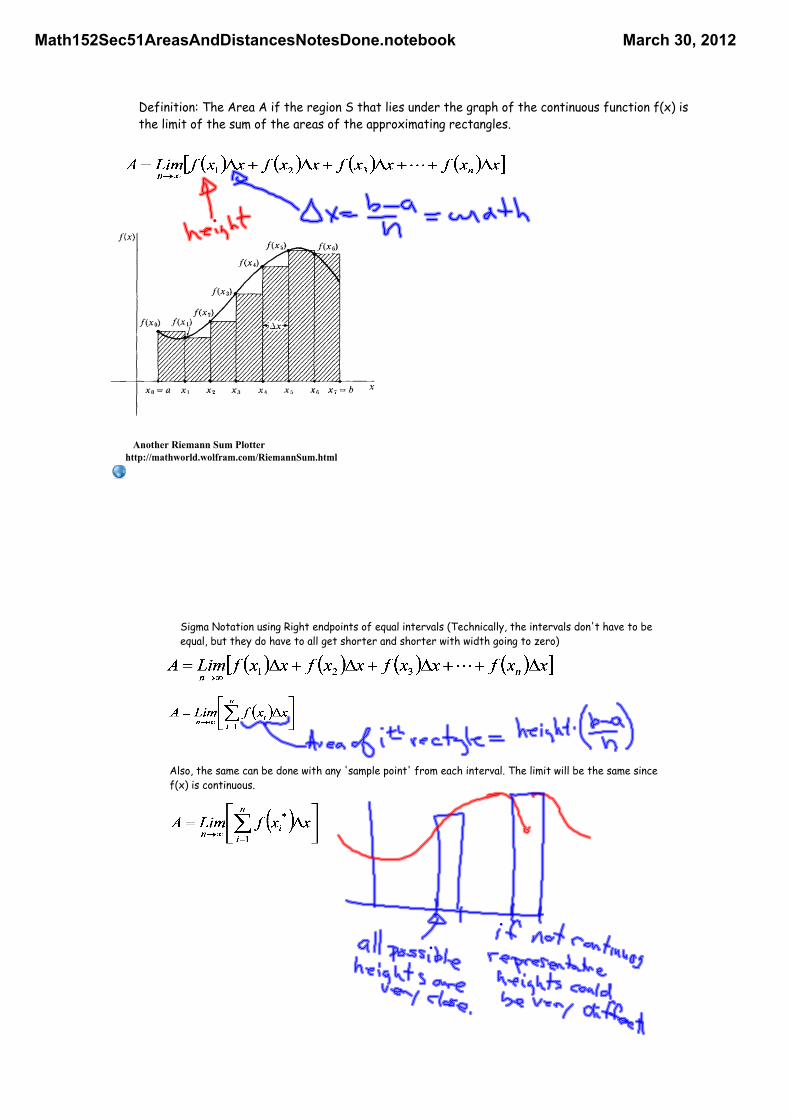
Definition: The Area A if the region S that lies under the graph of the continuous function f(x) is the limit of the sum of the areas of the approximating rectangles.
Sigma Notation using Right endpoints of equal intervals (Technically, the intervals don't have to be equal, but they do have to all get shorter and shorter with width going to zero)
Also, the same can be done with any 'sample point' from each interval. The limit will be the same since f(x) is continuous.
Math152Sec51AreasAndDistancesNotesDone.notebook March 30, 2012
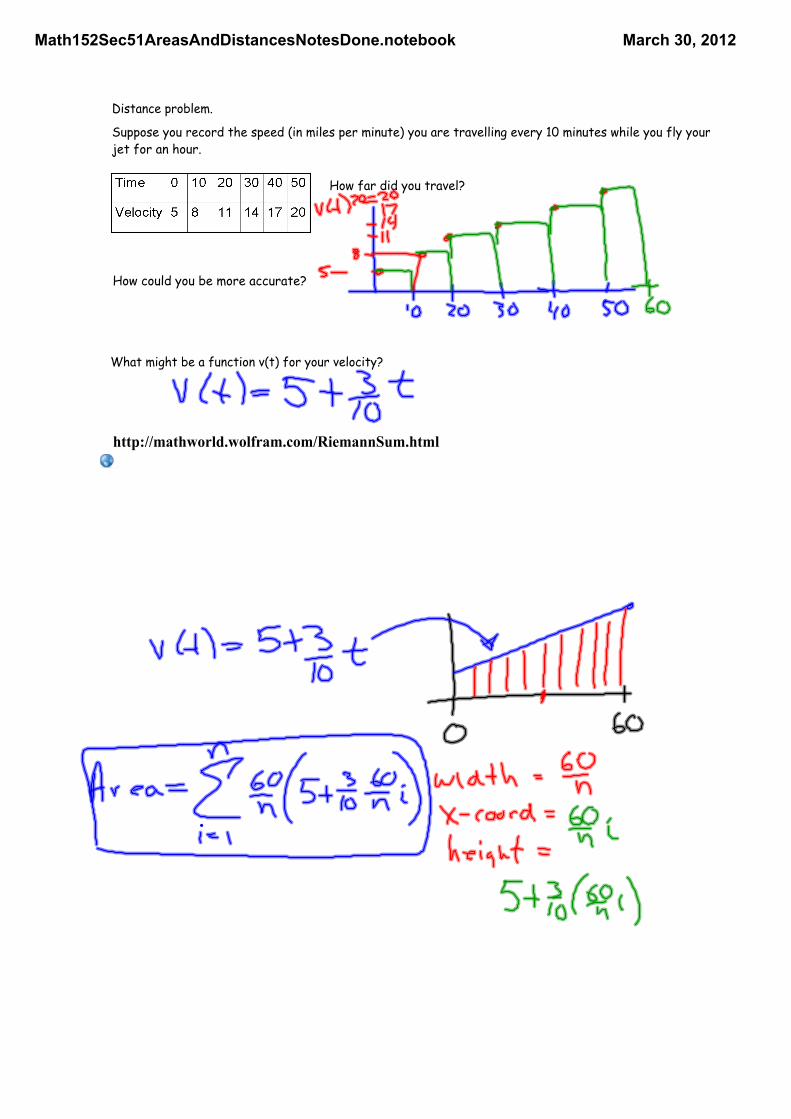
Distance problem.
Suppose you record the speed (in miles per minute) you are travelling every 10 minutes while you fly your jet for an hour.
How far did you travel?
http://mathworld.wolfram.com/RiemannSum.html
How could you be more accurate?
What might be a function v(t) for your velocity?
Math152Sec51AreasAndDistancesNotesDone.notebook March 30, 2012
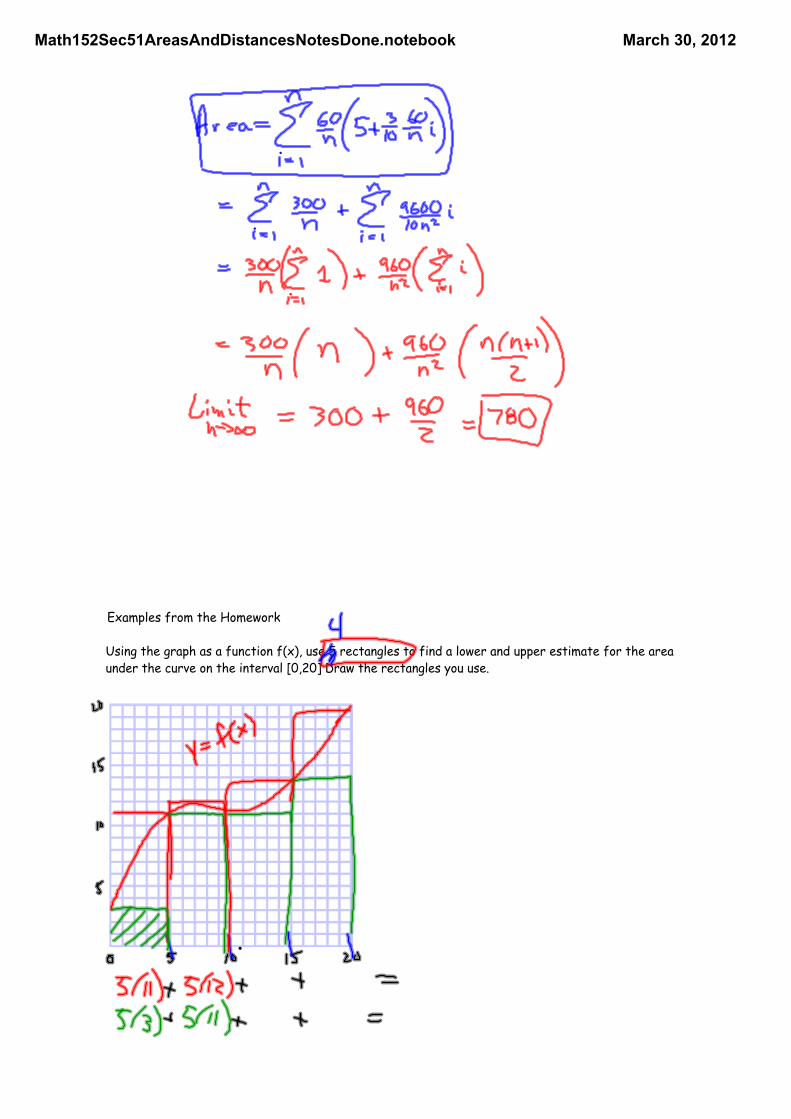
Examples from the Homework
Using the graph as a function f(x), use 5 rectangles to find a lower and upper estimate for the area under the curve on the interval [0,20] Draw the rectangles you use.

Math152Sec51AreasAndDistancesNotesDone.notebook March 30, 2012
#13 Oil leaked from a tank at a rate of r(t) liters per hour. The values are given in the table in 2-hour intervals. Find the upper and lower estimates for the amount of oil that leaked.
Determine a region whose area is equal to the given limit. Don't try to evaluate it...
Math152Sec51AreasAndDistancesNotesDone.notebook March 30, 2012
Math152Sec51AreasAndDistancesNotesDone.notebook March 30, 2012

Math152Sec51AreasAndDistancesNotesDone.notebook March 30, 2012

![Calculus with analytic geometry [Louis leithold]](https://static.fdocuments.in/doc/165x107/557d0e89d8b42a8c2f8b5288/calculus-with-analytic-geometry-louis-leithold.jpg)