Maternal Mortality: 1990 to 2008 - World Health...
55
Trends in Maternal Mortality: 1990 to 2008 Estimates developed by WHO, UNICEF, UNFPA and The World Bank
Transcript of Maternal Mortality: 1990 to 2008 - World Health...

ISBN 978 92 4 150026 5
Trends in Maternal Mortality:
1990 to 2008Estimates developed by
WHO, UNICEF, UNFPA and The World Bank
For more information, please contact:
Department of Reproductive Health and ResearchWorld Health OrganizationAvenue Appia 20, CH-1211 Geneva 27SwitzerlandFax: +41 22 791 4171E-mail: [email protected]/reproductivehealth
cover-A3-EN pantone 301.indd 1 10/09/2010 09:09:36


Trends in Maternal Mortality:
1990 to 2008Estimates developed by
WHO, UNICEF, UNFPA and The World Bank

WHO Library Cataloguing-in-Publication Data
Trends in maternal mortality: 1990 to 2008.
1.Maternal mortality - trends. 2.Maternal welfare. 3.Data collection - methods. 4.Models, Statistical. 5.Millennium Development Goals. I.World Health Organization. II.World Bank. III.UNICEF. IV.United Nations Population Fund.
ISBN 978 92 4 150026 5 (NLM classification: WQ 16)
© World Health Organization 2010
All rights reserved. Publications of the World Health Organization can be obtained from WHO Press, World Health Organization, 20 Avenue Appia, 1211 Geneva 27, Switzerland (tel.: +41 22 791 3264; fax: +41 22 791 4857; e-mail: [email protected]). Requests for permission to reproduce or translate WHO publications – whether for sale or for noncommercial distribution – should be addressed to WHO Press, at the above address (fax: +41 22 791 4806; e-mail: [email protected]).
The designations employed and the presentation of the material in this publication do not imply the expression of any opinion whatsoever on the part of the World Health Organization concerning the legal status of any country, territory, city or area or of its authorities, or concerning the delimitation of its frontiers or boundaries. Dotted lines on maps represent approximate border lines for which there may not yet be full agreement.
The mention of specific companies or of certain manufacturers’ products does not imply that they are endorsed or recommended by the World Health Organization in preference to others of a similar nature that are not mentioned. Errors and omissions excepted, the names of proprietary products are distinguished by initial capital letters.
All reasonable precautions have been taken by the World Health Organization to verify the information contained in this publication. However, the published material is being distributed without warranty of any kind, either expressed or implied. The responsibility for the interpretation and use of the material lies with the reader. In no event shall the World Health Organization be liable for damages arising from its use.

iii
iii
Trends in maternal mortality: 1990–2008
ACKNOWLEDGEMENTS V
ACRONYMS AND ABBREVIATIONS VI
1. INTRODUCTION 3
2. MEASURING MATERNAL MORTALITY 4
2.1 Concepts and definitions 4
2.2 Measures of maternal mortality 5
2.3 Approaches for measuring maternal mortality 6
3. THE DEVELOPMENT OF 2008 ESTIMATES OF MATERNAL MORTALITY 9
3.1 Sources of country data used for the 2008 estimates 9
3.2 Methods used to estimate MMR in 2008 according to data source 10
3.3 Calculation of adult lifetime risk of maternal mortality 14
3.4 Global and regional estimates 15
3.5 Differences in the 2008 methodology compared with 2005 15
3.6 Differences from other recent estimates 15
4. ANALYSIS AND INTERPRETATION OF 2008 ESTIMATES 17
4.1 Maternal mortality estimates for 2008 17
5. IS THE FIFTH MDG ACHIEVABLE? 22
ANNEXES 23
Annex 1. Estimates of maternal mortality ratio (MMR, deaths per 100 000 live births), number of maternal deaths and lifetime risk (2008) 23
Annex 2. Map with countries by category according to their maternal mortality ratio (MMR, deaths per 100 000 live births), 2008 27
Annex 3. Comparison of 1990, 1995, 2000, 2005, and 2008 estimates of maternal mortality ratio (MMR, deaths per 100 000 live births) by country 28
Annex 4. Countries with 40% or more decrease in maternal mortality ratio (MMR, deaths per 100 000 live births) between 1990 and 2008 33
CONTENTS

Trends in maternal mortality: 1990–2008
iv APPENDICES 34
Appendix 1. Adjustment factor to account for misclassification of maternal deaths in civil registration, literature review of published reports 34
Appendix 2. Sixty-three countries with civil registration data characterized as complete, with good attribution of cause of death 35
Appendix 3. Eighty-five countries lacking good complete registration data but where registration and/or other types of data are available 36
Appendix 4. Twenty-four countries with no nationally representative data on maternal mortality meeting inclusion criteria 36
Appendix 5. Estimation of maternal deaths due to HIV 37
Appendix 6. Estimates of maternal mortality ratio (MMR, deaths per 100 000 live births), number of maternal deaths and lifetime risk by WHO regions, 2008 39
Appendix 7. Comparison of 1990, 1995, 2000, 2005, and 2008 estimates of maternal mortality ratio (MMR, deaths per 100 000 live births) by WHO regions 39
Appendix 8. Estimates of maternal mortality ratio (MMR, deaths per 100 000 live births), number of maternal deaths and lifetime risk by UNICEF regions, 2008 40
Appendix 9. Comparison of 1990, 1995, 2000, 2005, and 2008 estimates of maternal mortality ratio (MMR, deaths per 100 000 live births) by UNICEF regions 40
Appendix 10. Estimates of maternal mortality ratio (MMR, deaths per 100 000 live births), number of maternal deaths and lifetime risk by UNFPA regions, 2008 41
Appendix 11. Comparison of 1990, 1995, 2000, 2005, and 2008 estimates of maternal mortality ratio (MMR, deaths per 100 000 live births) by UNFPA regions 41
Appendix 12. Estimates of maternal mortality ratio (MMR, deaths per 100 000 live births), number of maternal deaths and lifetime risk by The World Bank regions and income groups, 2008 42
Appendix 13. Comparison of 1990, 1995, 2000, 2005, and 2008 estimates of maternal mortality ratio (MMR, deaths per 100 000 live births) by The World Bank regions and income groups 42
Appendix 14. Estimates of maternal mortality ratio (MMR, deaths per 100 000 live births), number of maternal deaths and lifetime risk by United Nations Population Division regions, 2008 43
Appendix 15. Comparison of 1990, 1995, 2000, 2005, and 2008 estimates of maternal mortality ratio (MMR, deaths per 100 000 live births) by United Nations Population Division regions 43
REFERENCES 44

v
v
Trends in maternal mortality: 1990–2008
ACKNOWLEDGEMENTS
The Maternal Mortality Estimation Inter-Agency Group (MMEIG), together with Professor John Wilmoth,
Nobuko Mizoguchi, Sarah Zureick, and Reid Hamel of the University of California at Berkeley collaborated in
developing the maternal mortality estimates.
The MMEIG consists of the following individuals, listed in alphabetical order: Carla Abou Zahr of the
World Health Organization (WHO), Mohamed Ali of WHO, Ties Boerma of WHO, Eduard Bos of
The World Bank, Doris Chou of WHO, Ralph Hakkert of the United Nations Population Fund (UNFPA),
Sara Hertog of the United Nations Population Division (UNPD), Mie Inoue of WHO, Colin Mathers of WHO,
Michael Mbizvo of WHO, Samuel Mills of The World Bank, Holly Newby of the United Nations Children’s Fund
(UNICEF), Mikkel Oestergaard of WHO, Lale Say of WHO, Armando Seuc of WHO, Emi Suzuki of
The World Bank, and Tessa Wardlaw of UNICEF.
An external Technical Advisory Group (TAG) contributed to the development of these estimates by providing
external technical advice. The members of the TAG are the following: Saifuddin Ahmed of Johns Hopkins
University, David Braunholz of Aberdeen University, Peter Byass of Umea University, Wendy Graham of
Aberdeen University, Kenneth Hill of Harvard University, Thomas Pullum of University of Texas at Austin,
Dag Roll-Hansen of Statistics Norway, Neff Walker of Johns Hopkins University, and John Wilmoth of the
University of California at Berkeley.
Thomas Pullum and Eduardo Bergel reviewed the draft report. Mie Inoue, Alexandre Peregoudov, and
Armando Seuc provided translation during country consultations. Liliana Carvajal of UNICEF provided
technical assistance during preparation of the report. The Department of Governing Bodies and External
Relations of WHO, WHO regional and country offices, UNFPA country offices, and UNICEF country offices,
are gratefully acknowledged for facilitating the country consultations. Thanks to the focal points of
governments who reviewed the preliminary MMR estimates and provided valuable feedback.
The WHO, The World Bank Netherlands Partnership Program (BNPP), and USAID provided financial support.
This report was prepared by Doris Chou, Mie Inoue, Colin Mathers, Mikkel Oestergaard, and Lale Say of WHO,
Samuel Mills and Emi Suzuki of The World Bank, and John Wilmoth of the University of California at Berkeley.
Contact person: Lale Say, Department of Reproductive Health and Research, WHO.
E-mail: [email protected]

Trends in maternal mortality: 1990–2008
vi AMDF AIDS adjusted PMDF
CEMD Confidential Enquiry into Maternal Deaths
DHS Demographic and Health Surveys
GDP gross domestic product per capita based on purchasing power parity conversion
GFR general fertility rate
HDI Human Development Index
HIV/AIDS human immunodeficiency virus/acquired immunodeficiency syndrome
ICD-10 International Statistical Classification of Diseases and Related Health Problems (10th Revision)
MDG Millennium Development Goal
MMEIG Maternal Mortality Estimation Inter-Agency Group
MMR maternal mortality ratio
MMRate maternal mortality rate
PMDF proportion maternal among deaths of females of reproductive age
PPP purchasing power parity
RAMOS reproductive-age mortality studies
SAB skilled attendant at birth as a proportion of total live births
TAG Technical Advisory Group
TFR total fertility rate
UNAIDS The Joint United Nations Programme on HIV/AIDS
UNFPA United Nations Population Fund
UNICEF United Nations Children’s Fund
UNPD United Nations Population Division
WHO World Health Organization
ACRONYMS AND ABBREVIATIONS
vi

1
1
Trends in maternal mortality: 1990–2008
EXECUTIVE SUMMARY
Five years remain until the 2015 deadline to
achieve the Millennium Development Goals (MDG)
adopted at the 2000 Millennium Summit. There are
two targets for assessing progress in improving
maternal health (MDG 5): reducing the maternal
mortality ratio (MMR) by three quarters between
1990 and 2015, and achieving universal access to
reproductive health by 2015. Closer examination
of maternal mortality levels is needed to inform
planning of reproductive health programmes, to
guide advocacy efforts and research at the national
and international levels, and to inform decision-
making for the achievement of MDG 5. To be useful
for the latter purpose, the country estimates must be
internationally comparable.
It has been a challenge to assess the extent of
progress towards the MDG 5 target due to the
lack of reliable and accurate data on maternal
mortality – particularly in developing-country
settings where maternal mortality is high. The World
Health Organization (WHO), the United Nations
Children’s Fund (UNICEF), and the United Nations
Population Fund (UNFPA) have previously published
internationally comparable estimates of maternal
mortality for 1990, 1995, and 2000. In 2005,
the three agencies, along with The World Bank,
developed country, regional, and global estimates
and made the first attempt to assess trends in MMR
at the regional and global levels. As an update to
this ongoing effort, the four agencies now present
the global maternal mortality data for 2008 as well
as for years 1990, 1995, 2000, and 2005. These
estimates revise and improve upon the earlier
methodology used.
An estimated 358 000 maternal deaths occurred
worldwide in 2008, a 34% decline from the
levels of 1990. Despite this decline, developing
countries continued to account for 99% (355 000)
of the deaths. Sub-Saharan Africa and South Asia
accounted for 87% (313 000) of global maternal
deaths. Eleven countries including Afghanistan,
Bangladesh, the Democratic Republic of the Congo,
Ethiopia, India, Indonesia, Kenya, Nigeria, Pakistan,
Sudan, and the United Republic of Tanzania,
comprised 65% of all maternal deaths in 2008.
Overall, it was estimated that there were 42 000
deaths due to HIV/AIDS among pregnant women
in 2008. About half of those were assumed to be
maternal. The contribution of HIV/AIDS was highest
in sub-Saharan Africa where 9% of all maternal
deaths were due to HIV/AIDS. Without these deaths,
the MMR for sub-Saharan Africa would have been
580 maternal deaths per 100 000 live births instead
of 640.
The MMR in 2008 was highest in developing regions
(290) in stark contrast to developed regions (14) and
countries of the Commonwealth of Independent
States (40). Among developing regions, sub-Saharan
Africa had the highest MMR at 640 maternal deaths
per 100 000 live births in 2008, followed by South
Asia (280), Oceania (230), South-Eastern Asia (160),
North Africa (92), Latin America and the Caribbean
(85), Western Asia (68), and Eastern Asia (41). Forty-
five countries had high estimated MMR (MMR ≥300)
with four countries (Afghanistan, Chad, Guinea-
Bissau, and Somalia), having extremely high MMR
(MMR ≥1000). Outside of sub-Saharan Africa, the
seven countries with high MMR were: Afghanistan
(1400), the Lao People’s Democratic Republic (580),
Nepal (380), Timor-Leste (370), Bangladesh (340),
Haiti (300), and Cambodia (290).
During the period 1990–2008, 147 countries
experienced a decline in MMR, 90 of which showed
a decline of 40% or more. In two countries, there
was no estimated change in MMR, while 23
countries had an increase.
The adult lifetime risk of maternal death (the
probability that a 15-year-old female will die
eventually from a maternal cause) as measured in
2008 is highest in sub-Saharan Africa (at 1 in 31),
followed by Oceania (1 in 110), and South Asia
(1 in 120), while developed regions had the smallest
lifetime risk (1 in 4300). Of the 172 countries and
territories, Afghanistan had the highest estimated
lifetime risk of 1 in 11.

Trends in maternal mortality: 1990–2008
2 The fifth MDG aims to improve maternal health with
a target of reducing MMR by 75% between 1990
and 2015 – that is, it seeks to achieve a 5.5% annual
decline in MMR from 1990. Globally the annual
percentage decline in MMR between 1990 and 2008
was only 2.3%. Among countries with an MMR ≥100
in 1990, it is evident that 30 countries have made
insufficient or no progress, including 23 from sub-
Saharan Africa.
These estimates provide an up-to-date indication of
the extent of the maternal mortality problem globally.
They reflect the efforts by countries, which have
increasingly been engaged in studies to measure
maternal mortality and strengthen systems to
obtain better information about maternal deaths.
The modest and encouraging progress in reducing
maternal mortality is likely due to increased attention
to developing and implementing policies and
strategies targeting increased access to effective
interventions. Such efforts need to be expanded and
intensified, to accelerate progress towards reducing
the still very wide disparities between developing
and developed worlds.

3
3
Trends in maternal mortality: 1990–2008
1. INTRODUCTION
Improving maternal health is one of the eight
Millennium Development Goals (MDG) adopted at
the 2000 Millennium Summit. The two targets for
assessing progress in improving maternal health
(MDG 5) are reducing the maternal mortality ratio
(MMR) by three quarters between 1990 and 2015,
and achieving universal access to reproductive
health by 2015. With only five years left until
the 2015 deadline to achieve the MDGs, closer
examination of maternal mortality levels is needed to
inform planning of reproductive health programmes
and to guide advocacy efforts and research at the
national level. These estimates are also needed at
the international level, to inform decision-making
concerning funding support for the achievement
of MDG 5. To be useful for the latter purpose,
the country estimates must be internationally
comparable.
It has been a challenge to assess the extent of
progress towards the MDG 5 target, due to scarcity
of reliable and accurate data on maternal mortality
– particularly in developing-country settings where
maternal mortality is high. WHO, UNICEF, UNFPA,
and The World Bank have collaborated to develop
and update five-yearly estimates of maternal
mortality using statistical modelling for countries
where no reliable data on maternal mortality exist.
The latest interagency estimates were published
in 2007, reporting on maternal mortality in 2005.1,2
Recently, another study by an academic institute
reported a set of estimates developed using an
alternative methodology.3
The four agencies have now updated the global
maternal mortality data for 2008 as well as for
1990, 1995, 2000, and 2005. The Maternal Mortality
Estimation Inter-Agency Group (MMEIG), together
with a Technical Advisory Group (TAG) consisting of
outside technical experts, has revised and improved
the previous methods used to estimate maternal
mortality1,2 with a particular emphasis on developing
methods for estimating trends in maternal mortality
from 1990 to 2008. The MMR estimates were
released in September 2010 to provide input to
the United Nations General Assembly on progress
towards achieving the MDGs.
Following the development of the MMR estimates,
consultations with countries were carried out during
July–August 2010: to give countries the opportunity
to review the country estimates, data sources, and
methods; to obtain additional primary data sources
that may not have been previously reported or used;
and to build mutual understanding of the strengths
and weaknesses of available data and ensure broad
ownership of the results. After the consultations, the
statistical model was run again to incorporate any
new data provided by countries.
This report presents the global, regional, and
country estimates of maternal mortality in 2008,
and the findings of the assessment of trends of
maternal mortality levels since 1990. It summarizes
the challenges involved in measuring maternal
mortality and the main approaches to measurement,
and explains the methodology of the 2008 maternal
mortality estimates. The final section discusses
the use and limitations of the estimates, with an
emphasis on the importance of improved data
quality for estimating maternal mortality. The
appendices present the sources of data for the
country estimates as well as MMR estimates for
the different regional groupings for WHO, UNICEF,
UNFPA, The World Bank, and UNPD.

The death of a woman while pregnant or within 42 days of termination of pregnancy, irrespective of the duration and site of the pregnancy, from any cause related to or aggravated by the pregnancy or its management but not from accidental or incidental causes.
Trends in maternal mortality: 1990–2008
4
2. MEASURING MATERNAL MORTALITY
systems with correct attribution of causes of death
are inadequate.
With the publication of ICD-10, WHO recommended
adding a checkbox on the death certificate for
recording a woman’s pregnancy status at the time of
death.4 This would help to identify indirect maternal
deaths, but has not been implemented in many
countries. For countries using ICD-10 coding for
registered deaths, all deaths coded to the maternal
chapter (O codes) and A34 (maternal tetanus) were
counted as maternal deaths.
A concept of "pregnancy-related death" included in
ICD-10 is defined as any death during pregnancy,
childbirth, or the postpartum period even if it is
due to accidental or incidental causes (Box 1).
This alternative definition allows measurement of
deaths that are related to pregnancy, even though
they do not strictly conform with the standard
"maternal death" concept in settings where accurate
information about causes of deaths based on
medical certificates are unavailable. For instance,
in surveys, relatives of a reproductive-age woman
who has died are asked about her pregnancy status
at the time of death without eliciting any further
information on cause of death. These surveys
usually measure pregnancy-related deaths rather
than maternal deaths.
Prior to 2010, indirect maternal deaths due to HIV,
which were coded to Chapter 1 according to ICD-10
rule 5.8.3 (in Vol. 2), were not included in the tally of
maternal deaths. An amendment has recently been
made to ICD-10, introducing code O98.7 to identify
indirect maternal deaths due to HIV. These indirect
maternal deaths are those in which HIV complicates
the pregnancy or the delivery. Incidental HIV deaths
in which the women happened to be pregnant would
not be included in the MMR.
Complications of pregnancy or childbirth can also
lead to death beyond the six-weeks postpartum
period. In addition, increasingly available modern
life-sustaining procedures and technologies enable
more women to survive adverse outcomes of
2.1 Concepts and definitions
In the International Statistical Classification of
Diseases and Related Health Problems, Tenth
Revision, 1992 (ICD-10), WHO defines maternal
death as:
This definition allows identification of maternal
deaths, based on their causes as either direct or
indirect. Direct obstetric deaths are those resulting
from obstetric complications of the pregnant
state (pregnancy, delivery, and postpartum), from
interventions, omissions, incorrect treatment, or from
a chain of events resulting from any of the above.
Deaths due to, for example, haemorrhage,
pre-eclampsia/eclampsia or those due to
complications of anaesthesia or caesarean section
are classified as direct obstetric deaths. Indirect
obstetric deaths are those resulting from previous
existing disease, or diseases that developed during
pregnancy, and which were not due to direct
obstetric causes but aggravated by physiological
effects of pregnancy. For example, deaths due to
aggravation of an existing cardiac or renal disease
are indirect obstetric deaths.
Accurate identification of the causes of maternal
deaths by differentiating the extent to which they
are due to direct or indirect obstetric causes, or
due to accidental or incidental events, is not always
possible – particularly in settings where deliveries
occur mostly at home, and/or where civil registration

5
5
Trends in maternal mortality: 1990–2008
Box 1. Alternative definitions of maternal death in ICD-10
Pregnancy-related death The death of a woman while pregnant or within 42 days of termination of pregnancy, irrespective of the cause of death.
Late maternal death The death of a woman from direct or indirect obstetric causes, more than 42 days but less than one year after termination of pregnancy.
Maternal mortality ratio Number of maternal deaths during a given time period per 100 000
live births during the same time-period.
Maternal mortality rate Number of maternal deaths in a given period per 100 000 women of
reproductive age during the same time-period.
Adult lifetime risk of maternal death The probability of dying from a maternal cause during a woman’s reproductive lifespan.
Box 2. Statistical measures of maternal mortality
pregnancy and delivery, and to delay death beyond
42 days postpartum. Despite being caused by
pregnancy-related events, these deaths do not
count as maternal deaths in routine civil registration
systems. An alternative concept of late maternal
death was included in ICD-10, in order to capture
these delayed deaths that occur between six weeks
and one year postpartum (Box 1). Some countries,
particularly those with more developed civil
registration systems, use this definition.
2.2 Measures of maternal mortality
The number of maternal deaths in a population is
essentially the product of two factors: the risk of
mortality associated with a single pregnancy or a
single live birth, and the number of pregnancies
or births that are experienced by women of
reproductive age. The MMR is defined as the
number of maternal deaths in a population divided
by the number of live births. It depicts the risk of
maternal death relative to the number of live births.
By contrast, the maternal mortality rate (MMRate)
is defined as the number of maternal deaths in a
population divided by the number of women of
reproductive age. It reflects not only the risk of
maternal death per pregnancy or per birth (live
birth or stillbirth), but also the level of fertility in the
population. In addition to the MMR and the MMRate,
it is possible to calculate the adult lifetime risk of
maternal mortality for women in the population
(Box 2). An alternative measure of maternal mortality,
the proportion maternal among deaths of females
of reproductive age (PMDF), is calculated as the
number of maternal deaths divided by the total
deaths among females aged 15–49 years.

Trends in maternal mortality: 1990–2008
6 2.3 Approaches for measuring maternal mortality
Although widely-used standardized definitions of
maternal mortality exist, it is difficult to measure
accurately the levels of maternal mortality in
a population – for several reasons. First, it is
challenging to identify maternal deaths precisely,
particularly in settings where routine recording
of deaths is not complete within civil registration
systems, and the death of a woman of reproductive
age might not be recorded. Second, even if such a
death were recorded, the woman’s pregnancy status
may not have been known and the death would
therefore not have been reported as a maternal
death even if the woman were pregnant. Third, in
most developing-country settings where medical
certification of cause of death does not exist,
accurate attribution of a female death as a maternal
death is difficult.
Even in developed countries where routine
registration of deaths is in place, maternal deaths
may be unidentified due to misclassification of
ICD-10 coding, and identification of the true
numbers of maternal deaths may require additional
special investigations into the causes of deaths.5–9
A specific example of such an investigation is the
Confidential Enquiry into Maternal Deaths (CEMD).
An early form of this system has been established
in England and Wales since 1928, and has been
reporting for the United Kingdom since 1985.10
The most recent report of CEMD (for 2003–2005)
identified 90% more maternal deaths than was
reported in the routine civil registration system.10
Other studies on the accuracy of the number of
maternal deaths reported in civil registration systems
have shown that the true number of maternal deaths
could be up to almost 200% higher than routine
reports.7 Appendix 1 summarizes the results of
a literature review for such studies. These have
estimated adjustment factors for misclassification of
maternal mortality in death registration data ranging
from 0.9 to 3.2 with a median value of 1.5.
These studies are diverse, depending on the
definition of maternal mortality used, the sources
considered (death certificates, other vital event
certificates, medical records, questionnaires, or
autopsy reports), and the way maternal deaths
are identified (record linkage, or assessment from
experts). In addition, the system of reporting causes
of death to a civil registry differs from one country to
another, depending on the death certificate forms,
the type of certifiers, and the coding practice.
Under identification of maternal deaths was more
common among the following.
• Early pregnancy deaths, those not linked to
reportable birth outcome.
• Deaths in the later postpartum period (these were
less likely to be reported than early postpartum
deaths).
• Deaths at extremes of maternal age (youngest
and oldest).
• Miscoding by ICD-9 or ICD-10, most often seen
in cases of deaths caused by:
– cerebrovascular diseases;
– cardiovascular diseases.
Potential reasons cited for under reporting/
misclassification include the following.
• Inadequate understanding of ICD rules (either
ICD-9 or ICD-10).
• Death certificates completed without mention of
pregnancy status.
• Desire to avoid litigation.
• Desire to suppress information (especially as
related to abortion deaths).
In the absence of complete and accurate civil
registration systems, MMR estimates are based
upon a variety of methods – including household
surveys, sisterhood methods, reproductive-age
mortality studies (RAMOS), verbal autopsies, and
censuses. Each of these methods has limitations
in estimating the true levels of maternal mortality.
Brief descriptions of the methods together with their
limitations are shown in Box 3.

7
7
Trends in maternal mortality: 1990–2008
Civil registration systems This approach involves routine registration of births and deaths. Ideally, maternal mortality statistics should be obtained through civil registration data. However,
• even where coverage is complete and the causes of all deaths are identified based on standard medical certificates, in the absence of active case-finding, maternal deaths may be missed or misclassified; and therefore
• confidential enquiries are used to identify the extent of misclassification and
underreporting.11
Household surveys Where civil registration data are not available, household surveys provide an alternative. Limitations of household surveys include the following:
• the survey identifies pregnancy-related deaths (not maternal deaths);• because maternal deaths are rare events in epidemiological terms, surveys to
measure their levels require large sample sizes to provide statistically reliable estimates and therefore they are expensive;
• even with large sample sizes, the obtained estimates are still subject to uncertainty (wide confidence intervals), making it difficult to monitor changes over time.
Sisterhood methods12,13 Sisterhood methods obtain information by interviewing a representative sample of respondents about the survival of all their adult sisters (to determine the number of ever-married sisters, how many are alive, how many are dead, and how many died during pregnancy, delivery, or within six weeks of pregnancy). This approach reduces the sample size, but:
• it identifies pregnancy-related deaths, rather than maternal deaths; • the problem of wide confidence intervals remains, thereby precluding trend
analysis;• the originally developed version (indirect sisterhood method) is not appropriate
for use in settings where fertility levels are low (i.e. total fertility rate <4) or where there has been substantial migration or other causes of social dislocation;
• it provides a retrospective rather than a current maternal mortality estimate (over 10 years prior to the survey);
• the Demographic and Health Surveys (DHS) use a variant of the sisterhood approach (direct sisterhood method) – this approach relies on fewer assumptions than the original method and collects more information than the indirect method (i.e. the age of all siblings, age at death and year of death of those dead, in addition to the information obtained by the indirect method), but requires larger sample sizes and the analysis is more complicated;
• the estimates refer to a period approximately five years prior to the survey; and• as in the indirect method, the problem of wide confidence intervals remains
(hence, the monitoring of trends is limited) and this approach also provides information concerning pregnancy-related deaths rather than maternal deaths.
Box 3. Approaches to measuring maternal mortality
continued on next page

Trends in maternal mortality: 1990–2008
8
Box 3. continued
Reproductive-age mortality
studies (RAMOS)12–14
This approach involves identifying and investigating the causes of all deaths of women of reproductive age in a defined area/population by using multiple sources of data (e.g. interviews of family members, vital registrations, health facility records, burial records, traditional birth attendants) and has the following characteristics.
• Multiple and varied sources of information must be used to identify deaths of women of reproductive age; no single source identifies all the deaths.
• Inadequate identification of all deaths of reproductive-aged women results in underestimation of maternal mortality levels.
• Interviews with household members and health-care providers and reviews of facility records are used to classify the deaths as maternal or otherwise.
• If properly conducted, this approach provides a fairly complete estimation of maternal mortality (in the absence of reliable routine registration systems) and could provide subnational MMRs.
• This approach can be complicated, time-consuming, and expensive to undertake – particularly on a large scale.
• The number of live births used in the computation may not be accurate, especially in settings where most women deliver at home.
Verbal autopsy15–17 This approach is used to assign cause of death through interviews with family or community members, where medical certification of cause of death is not available. Records of births and deaths are collected periodically among small populations (typically in a district) under demographic surveillance systems maintained by research institutions in developing countries. The following limitations characterize this approach.
• Misclassification of causes of reproductive-aged female deaths with this technique is not uncommon.
• This approach may fail to identify correctly a group of maternal deaths, particularly those occurring early in pregnancy (e.g. ectopic, abortion-related) and indirect causes of maternal death (e.g. malaria).
• The accuracy of the estimates depends on the extent of family members’ knowledge of the events leading to the death, the skill of the interviewers, and the competence of physicians who do the diagnosis and coding.
• Demographic surveillance systems are expensive to maintain, and the findings cannot be extrapolated to obtain national MMRs.
Census18 A national census, with the addition of a limited number of questions, could produce estimates of maternal mortality; this approach eliminates sampling errors (because the entire population is covered) and hence allows a more detailed breakdown of the results, including time trends, geographic subdivisions, and social strata.
• This approach allows identification of deaths in the household in a relatively short reference period (1–2 years), thereby providing recent maternal mortality estimates, but is conducted at 10-year intervals and therefore limits monitoring of maternal mortality.
• The training of enumerators is crucial, since census activities collect information on a range of other topics which are unrelated to maternal deaths.
• Results must be adjusted for the completeness of births and deaths declared in the census, and for distortions in age structures, in order to arrive at reliable estimates.
9
9
Trends in maternal mortality: 1990–2008
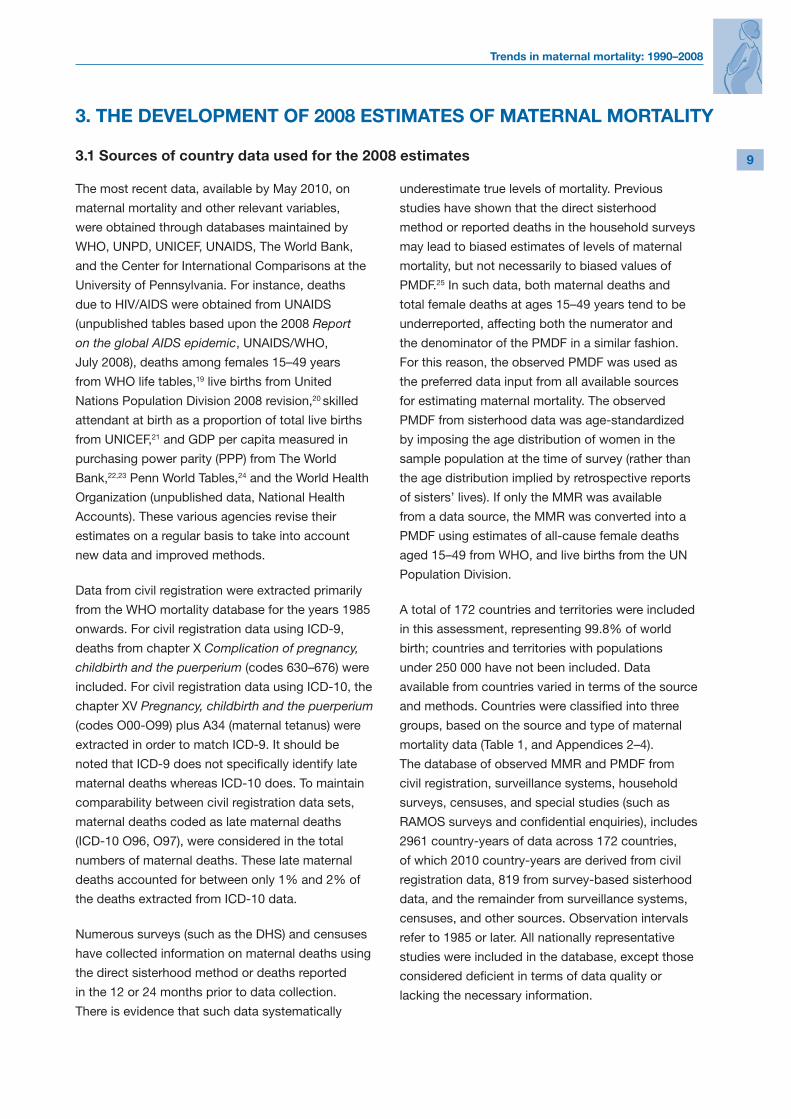
The most recent data, available by May 2010, on
maternal mortality and other relevant variables,
were obtained through databases maintained by
WHO, UNPD, UNICEF, UNAIDS, The World Bank,
and the Center for International Comparisons at the
University of Pennsylvania. For instance, deaths
due to HIV/AIDS were obtained from UNAIDS
(unpublished tables based upon the 2008 Report
on the global AIDS epidemic, UNAIDS/WHO,
July 2008), deaths among females 15–49 years
from WHO life tables,19 live births from United
Nations Population Division 2008 revision,20 skilled
attendant at birth as a proportion of total live births
from UNICEF,21 and GDP per capita measured in
purchasing power parity (PPP) from The World
Bank,22,23 Penn World Tables,24 and the World Health
Organization (unpublished data, National Health
Accounts). These various agencies revise their
estimates on a regular basis to take into account
new data and improved methods.
Data from civil registration were extracted primarily
from the WHO mortality database for the years 1985
onwards. For civil registration data using ICD-9,
deaths from chapter X Complication of pregnancy,
childbirth and the puerperium (codes 630–676) were
included. For civil registration data using ICD-10, the
chapter XV Pregnancy, childbirth and the puerperium
(codes O00-O99) plus A34 (maternal tetanus) were
extracted in order to match ICD-9. It should be
noted that ICD-9 does not specifically identify late
maternal deaths whereas ICD-10 does. To maintain
comparability between civil registration data sets,
maternal deaths coded as late maternal deaths
(ICD-10 O96, O97), were considered in the total
numbers of maternal deaths. These late maternal
deaths accounted for between only 1% and 2% of
the deaths extracted from ICD-10 data.
Numerous surveys (such as the DHS) and censuses
have collected information on maternal deaths using
the direct sisterhood method or deaths reported
in the 12 or 24 months prior to data collection.
There is evidence that such data systematically
3. THE DEVELOPMENT OF 2008 ESTIMATES OF MATERNAL MORTALITY
underestimate true levels of mortality. Previous
studies have shown that the direct sisterhood
method or reported deaths in the household surveys
may lead to biased estimates of levels of maternal
mortality, but not necessarily to biased values of
PMDF.25 In such data, both maternal deaths and
total female deaths at ages 15–49 years tend to be
underreported, affecting both the numerator and
the denominator of the PMDF in a similar fashion.
For this reason, the observed PMDF was used as
the preferred data input from all available sources
for estimating maternal mortality. The observed
PMDF from sisterhood data was age-standardized
by imposing the age distribution of women in the
sample population at the time of survey (rather than
the age distribution implied by retrospective reports
of sisters’ lives). If only the MMR was available
from a data source, the MMR was converted into a
PMDF using estimates of all-cause female deaths
aged 15–49 from WHO, and live births from the UN
Population Division.
A total of 172 countries and territories were included
in this assessment, representing 99.8% of world
birth; countries and territories with populations
under 250 000 have not been included. Data
available from countries varied in terms of the source
and methods. Countries were classified into three
groups, based on the source and type of maternal
mortality data (Table 1, and Appendices 2–4).
The database of observed MMR and PMDF from
civil registration, surveillance systems, household
surveys, censuses, and special studies (such as
RAMOS surveys and confidential enquiries), includes
2961 country-years of data across 172 countries,
of which 2010 country-years are derived from civil
registration data, 819 from survey-based sisterhood
data, and the remainder from surveillance systems,
censuses, and other sources. Observation intervals
refer to 1985 or later. All nationally representative
studies were included in the database, except those
considered deficient in terms of data quality or
lacking the necessary information.
3.1 Sources of country data used for the 2008 estimates
Trends in maternal mortality: 1990–2008
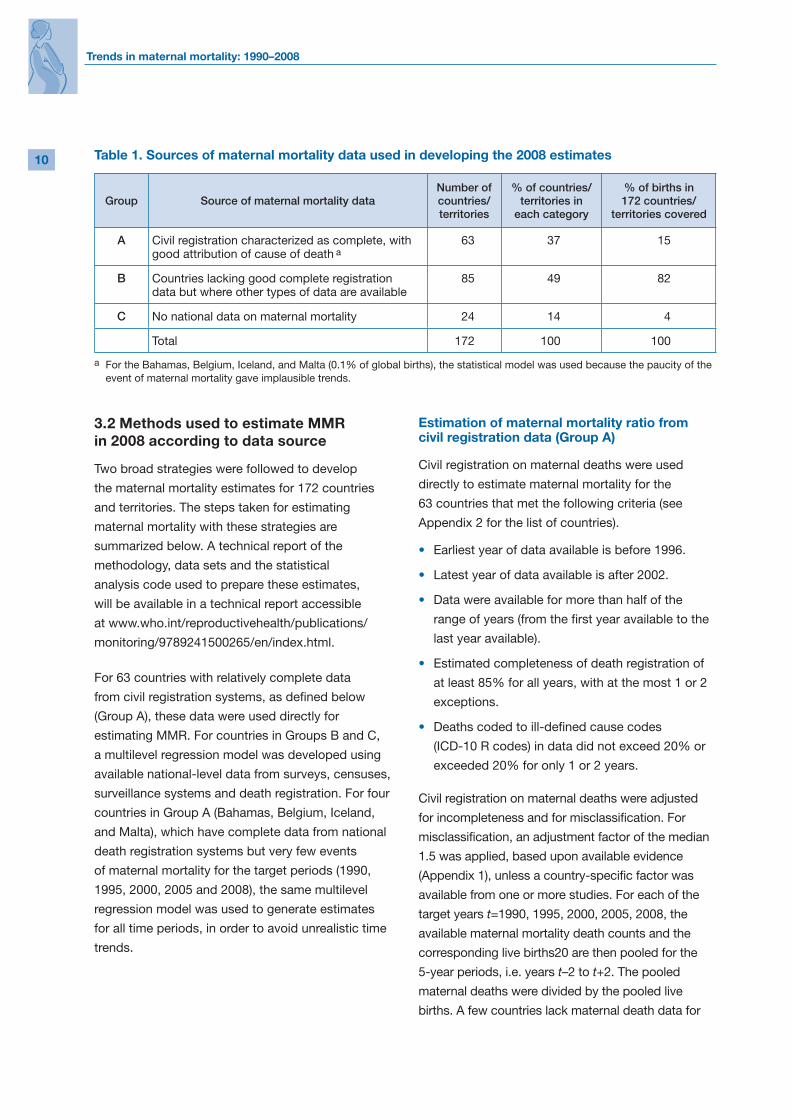
10 Table 1. Sources of maternal mortality data used in developing the 2008 estimates
Group Source of maternal mortality dataNumber of countries/ territories
% of countries/ territories in
each category
% of births in 172 countries/
territories covered
A Civil registration characterized as complete, with good attribution of cause of death a
63 37 15
B Countries lacking good complete registration data but where other types of data are available
85 49 82
C No national data on maternal mortality 24 14 4
Total 172 100 100
a For the Bahamas, Belgium, Iceland, and Malta (0.1% of global births), the statistical model was used because the paucity of the event of maternal mortality gave implausible trends.
3.2 Methods used to estimate MMR in 2008 according to data source
Two broad strategies were followed to develop
the maternal mortality estimates for 172 countries
and territories. The steps taken for estimating
maternal mortality with these strategies are
summarized below. A technical report of the
methodology, data sets and the statistical
analysis code used to prepare these estimates,
will be available in a technical report accessible
at www.who.int/reproductivehealth/publications/
monitoring/9789241500265/en/index.html.
For 63 countries with relatively complete data
from civil registration systems, as defined below
(Group A), these data were used directly for
estimating MMR. For countries in Groups B and C,
a multilevel regression model was developed using
available national-level data from surveys, censuses,
surveillance systems and death registration. For four
countries in Group A (Bahamas, Belgium, Iceland,
and Malta), which have complete data from national
death registration systems but very few events
of maternal mortality for the target periods (1990,
1995, 2000, 2005 and 2008), the same multilevel
regression model was used to generate estimates
for all time periods, in order to avoid unrealistic time
trends.
Estimation of maternal mortality ratio from civil registration data (Group A)
Civil registration on maternal deaths were used
directly to estimate maternal mortality for the
63 countries that met the following criteria (see
Appendix 2 for the list of countries).
• Earliest year of data available is before 1996.
• Latest year of data available is after 2002.
• Data were available for more than half of the
range of years (from the first year available to the
last year available).
• Estimated completeness of death registration of
at least 85% for all years, with at the most 1 or 2
exceptions.
• Deaths coded to ill-defined cause codes
(ICD-10 R codes) in data did not exceed 20% or
exceeded 20% for only 1 or 2 years.
Civil registration on maternal deaths were adjusted
for incompleteness and for misclassification. For
misclassification, an adjustment factor of the median
1.5 was applied, based upon available evidence
(Appendix 1), unless a country-specific factor was
available from one or more studies. For each of the
target years t=1990, 1995, 2000, 2005, 2008, the
available maternal mortality death counts and the
corresponding live births20 are then pooled for the
5-year periods, i.e. years t–2 to t+2. The pooled
maternal deaths were divided by the pooled live
births. A few countries lack maternal death data for

11
11
Trends in maternal mortality: 1990–2008
the interval centred on 1990 or have only one year
of observation in the interval 2003–2007. For these
countries, the estimate from the multilevel regression
model was used instead. If data exist for 2008 or
2009, the average 2004–2008 or 2004–2009 was
taken as the point estimate for 2008. When data were
not yet available for 2008 or 2009, it was assumed
that the point estimate for 2005 (based on the 2003–
2007 average) remained constant through 2008.
Estimation of maternal mortality ratio using statistical model (Groups B and C)
Previous interagency estimates of maternal mortality
used a covariate-based regression analysis to obtain
out-of-sample PMDF predictions for countries
without recent reliable data, and used the most
recent PMDF observation for countries with data.1,2
In the current round, a multilevel regression model
was developed to derive estimates and projections
of maternal deaths at specific time points (1990,
1995, 2000, 2005, and 2008). The model represents
maternal deaths due to direct obstetric causes or
to indirect causes other than HIV/AIDS deaths for
which pregnancy was a substantial aggravating
factor. HIV-related indirect maternal deaths were
treated separately. The three selected covariates
of the model are: the gross domestic product per
capita (GDP), the general fertility rate (GFR), and
the presence of a skilled attendant at birth as a
proportion of total live births (SAB). These covariates
were chosen from a broader list of potential
covariates which fell into three groups: (i) indicators
of social and economic development (such as
GDP, Human Development Index, and female life
expectancy at birth); (ii) process variables (SAB,
proportions receiving antenatal care, proportion of
institutional births, etc.); and (iii) risk exposure as a
function of fertility (GFR or the total fertility rate).
Covariate time series
Virtually complete time series of annual estimates for
three covariates were obtained or constructed back
to 1985. Annual estimates were then averaged over
the time interval of each PMDF or MMR observation
to create covariates for use in estimating the
regression model.
• GDP per capita measured in purchasing power
parity (PPP) equivalent international dollars
using 2005 as the base year (derived from World
Bank,22,23 Penn World Tables,24 and WHO
(unpublished data, National Health Accounts).
Where the complete series was unavailable,
annual estimates were obtained using linear
interpolation between two observations and
assuming constant values before the first
observation and after the last data point.
• GFR estimates were calculated from average
births and female population over the PMDF
or MMR time interval using data from the UN
Population Division, 2008 revision.20
• SAB data consist of time series derived using
all available data from health surveys and other
sources (in databases maintained by UNICEF).21
Annual series were estimated by fitting a simple
model of the logit (or log-odds) of SAB with
time as the sole covariate; such a model was
estimated separately for each country. When
a country had only one observation, it was
assumed that the SAB proportion remained
constant over time. For some countries with more
than one observation (including Fiji, Guyana,
Montenegro, New Zealand, and Thailand), the
logit model did not fit well. For such cases, annual
values were estimated as follows:
– estimates before the first observation were
assumed equal to the first observation;
– if the desired time reference fell between
the reference points of two observations,
the estimated value was calculated by linear
interpolation between the two observations;
– estimates after the last observation were
assumed equal to the last observation.
Adjustments to the input data
When civil registration data were used as inputs
into the model, maternal deaths were adjusted for
misclassification and divided by the number of
female deaths 15–49 to derive the PMDF.
When non-civil registration data (censuses,
surveys or enquiries) reported specific adjustment

Trends in maternal mortality: 1990–2008
12 factors for bias, these were retained. If no specific
adjustments for completeness were reported,
PMDFs derived from these data sources were
adjusted upwards by a factor of 1.1 to take
account of the likely under-identification of maternal
deaths due to unreported abortion-related deaths or
other causes. To estimate a maternal PMDF from a
pregnancy-related PMDF, pregnancy-related deaths
were adjusted downwards by a factor of 0.9 (a 10%
reduction) for sub-Saharan African countries and
0.85 (a 15% reduction) for other low- and middle-
income countries, respectively, to account for
incidental or accidental deaths. These factors were
derived from an analysis of the average risk of injury
deaths in the reproductive ages for women.26
Multilevel regression model
A regression model was used for deriving MMR
estimates for 113 countries (which includes
Bahamas, Belgium, Iceland, and Malta from Group
A, as explained previously). A range of models
were compared and the preferred model was
chosen by assessing the statistical goodness of
fit, the within sample predictive accuracy, and the
plausibility of estimates out-of-sample. Goodness
of fit was measured using deviance scores derived
from standard log-likelihood calculations. The
predictive accuracy of each model was evaluated by
repeatedly holding out a portion of the data, fitting
the model to the remaining subset of data and then
comparing model predictions against the data that
had been held out.
Multilevel (or hierarchical) modelling offers a
statistically well-grounded means of representing
country data about levels and trends of maternal
mortality within a global model that can also be used
for predicting out-of-sample values.27 The model
was fit with three selected covariates (GDP, GFR,
and SAB) and random intercept effects for countries
and regions.
The model can be described as follows:
log�PMDF�� = β₀ + β₁ log�GDP�� + β₂ log�GFR�� + β₃ SAB� + + + log�1 – 𝑎�� + ε�
where the following are associated with each observation i, within country j, within region k:
PMDF� = proportion maternal among deaths of females of reproductive age
GDP� = gross domestic product per capita (in 2005 PPP dollars)
GFR� = general fertility rate (live births per woman aged 15–49)
SAB� = skilled attendant at birth (as a proportion of total births)
= variable intercept component for country 𝑗
= variable intercept component for region 𝑘
𝑎� = proportion of AIDS deaths among total deaths to women aged 15–49
ε� = error term.
The model was estimated using the ‘lme4’ package28 in the R statistical language.29
Use of a non-zero offset, log (1 – 𝑎), changes the interpretation of the regression model, which becomes a
predictive model for log (AMDF ) rather than log (PMDF ), since, in general:
PMDF
1 – 𝑎AMDF = AIDS-adjusted PMDF =

13
13
Trends in maternal mortality: 1990–2008
is also some evidence from community studies
that women with HIV infection have a higher risk of
maternal death, although this may be offset by lower
fertility.30–32 If HIV is prevalent, then there will also be
more incidental deaths among pregnant women. It is
thus important to address the issue of incidental and
indirect maternal deaths among HIV-positive women
in estimating maternal mortality for these countries.
The MMEIG/TAG examined several approaches
for dealing with this issue and adopted a strategy
that involves further adjustment of observed
PMDF values to create a set of observations
for a “maternal, non-HIV-related” PMDF. Thus,
the dependent variable of the regression model
described above includes only “maternal” deaths
properly defined but excludes all HIV/AIDS deaths
from “pregnancy-related” observations (even
HIV/AIDS deaths that could properly be termed
“maternal”, in the sense that the pregnancy was a
substantial aggravating factor for a death caused
primarily by HIV infection). Thus, the regression
model was used to estimate the number of maternal
deaths not primarily due to HIV infection, and then
the estimated number of indirect maternal deaths
due to HIV/AIDS was added back to obtain the total
number of maternal deaths (see Appendix 5 for
details).
Uncertainty of estimates
In this report, estimates of maternal mortality are
presented along with upper and lower limits of
intervals designed to depict the uncertainty of
those estimates. The intervals are the product of a
detailed probabilistic evaluation of the uncertainty
attributable to the various components of the
estimation process.
For estimates derived from the multilevel regression
model, the components of uncertainty were
divided into two groups: those reflected within the
regression model (internal sources), and those due
to assumptions or calculations that occur outside
the model (external sources). Estimates of the total
uncertainty reflect a combination of these various
sources.
Only non-HIV-related maternal deaths are
included in the numerator of the PMDF used as
the dependent variable of the regression model.
The AMDF defined in this manner minimizes the
influence of the HIV epidemic on observed PMDF
values by removing HIV/AIDS deaths from both the
numerator and the denominator.
The model was fitted to the complete set of
observations for 172 countries. Observations from
civil registration data were collapsed into five-year
time periods, and each such observation received
a weight of one in the regression model. Most
other data sources (a single survey, census, special
study, etc.) yielded a single observation referring to
some time period; such observations also received
a weight of one in the regression model. Some
surveys, however, yielded more than one data point
for multiple time periods; in such cases all of the
various observations were included in the model but
with a combined weight of one.
To predict PMDF using the model, country covariate
data and relevant country and regional effects were
used. For countries with data available on maternal
mortality, predictions were based on country and
regional random effects, whereas for countries with
no available data, predictions used regional random
effects only.
After a final adjustment for indirect maternal deaths
due to HIV/AIDS (see below), predicted PMDF
values were converted to estimates of the MMR as
follows:
MMR = PMDFDB
where D is the number of female deaths at ages
15–49 estimated from WHO death rates,19 and
UNPD20 population estimates, and B is the number
of live births from UNPD population estimates.20
Estimation of indirect HIV maternal deaths
For countries with high HIV/AIDS prevalence,
HIV/AIDS has become a leading cause of death
during pregnancy and the postpartum period. There

Trends in maternal mortality: 1990–2008
14 The internal component includes only the inferential
uncertainty affecting the estimates themselves,
and not the additional uncertainty of prediction
with respect to individual data points. The external
component includes uncertainty regarding
assumptions for key parameters that are inputs
to the modelling process (e.g. adjustment factors
applied to observed data), along with uncertainty
about data inputs to calculations that occur outside
the model in the process of deriving the final
estimates.
For estimates computed directly from civil
registration data, the external component of
uncertainty was treated in the same manner as
described above. For the internal component,
however, the regression analysis was replaced by a
simple model of stochastic variation as a function of
population size.
To obtain the intervals presented here, all
components of estimation uncertainty were
depicted by probability distributions. For the
internal component, the parameters of these
distributions were obtained from the output of the
regression model (using ‘lme4’ in R).28,29 For the
external component, distributions were chosen
by assumption after considering a range of
plausible alternatives and assessing the sensitivity
of final estimates to choices within that range.
After simulating the combined effect of these
components on the estimation process, uncertainty
intervals were chosen by computing the 2.5th and
97.5th percentiles of a simulated distribution of
estimates. Details can be found at the web page:
www.who.int/reproductivehealth/publications/
monitoring/9789241500265/en/index.html.
3.3 Calculation of adult lifetime risk of maternal mortality
In countries where there is a high risk of maternal
death, many girls die in childhood before reaching
reproductive age. For this reason, it makes sense
to consider the lifetime risk of maternal mortality
conditional on survival to adulthood. Data presented
here include estimates of adult lifetime risk of
maternal mortality, which equals the probability
that a 15-year-old female will die eventually from a
maternal cause if she experiences throughout her
lifetime the risks of maternal death and the overall
levels of fertility and mortality that are observed for
a given population.
The adult lifetime risk of maternal mortality can be
derived using either the maternal mortality ratio,
MMR, or the maternal mortality rate, MMRate.
However, a precise estimate of lifetime risk requires
knowledge of how the MMR or the MMRate changes
within the reproductive lifespan of women. Although
such information is not generally available, it can be
assumed that neither the MMR nor the MMRate is
constant over the reproductive lifespan. Because
this assumption is more realistic for the MMRate
than for the MMR, the adult lifetime risk was
calculated using the MMRate33 as shown in Box 4.
This formula yields an estimate of the adult lifetime
risk that takes into account competing causes of
Box 4. Formula for estimating adult lifetime risk
Adult lifetime risk of maternal mortality = × MMRate
where ℓ₁₅, 𝑇₁₅, and 𝑇₅₀ are quantities from a life table for the female population during the period
in question (ℓ₁₅ equals the probability of survival from birth until age 15, and �𝑇₁₅ – 𝑇₅₀��ℓ₁₅ equals
the average number of years lived between ages 15 and 50 – up to a maximum of 35 years – among
survivors to age 15).

15
15
Trends in maternal mortality: 1990–2008
death. The 2008 country estimates of lifetime risk of
maternal mortality are shown in Annex 1, while the
regional estimates are presented in Table 2 and in
Appendices 6, 8,10, 12, and 14.
3.4 Global and regional estimates
Global and regional maternal mortality estimates
(according to the MDG, WHO, UNICEF, UNFPA,
The World Bank and UNPD regional groupings) were
also computed. The MMR in a given region was
computed as the estimated total number of maternal
deaths divided by the number of live births for that
region. Additionally, the adult lifetime risk of maternal
mortality was based on the weighted average of
�𝑇₁₅ – 𝑇₅₀��ℓ₁₅ for a given region multiplied by the
MMRate of that region.
3.5 Differences in the 2008 methodology compared with 2005
There were substantial differences in the methods
used for the 2008 maternal mortality estimation
compared with those for 2005.2
• Compared with the 2005 estimates, the database
employed for this exercise was much larger,
consisting of 2961 country-years of data across
172 countries, of which 2010 country-years
derive from civil registration data, 819 from
survey-based sisterhood data, and the remainder
from surveillance systems, censuses, and other
sources.
• Previous interagency estimates of maternal
mortality used a regression model to generate
PMDF estimates referring to a single point in
time. The model was used to obtain out-of-
sample predictions of PMDF for countries without
recent data, and used the most recent PMDF
observation for countries with data. In the current
round of estimation, a multilevel regression
model was developed to derive estimates of
maternal deaths at multiple time points from 1990
to 2008. The multilevel approach (with random
intercepts for both countries and regions) offers a
statistically well-grounded means of representing
country data about levels and trends of maternal
mortality within a global model that can also be
used for predicting out-of-sample.
• Unlike the 2005 estimation, this round of
estimation took into consideration the issue of
incidental and indirect maternal deaths among
HIV-positive women in estimating maternal
mortality for countries with high HIV/AIDS
prevalence (described in detail in Appendix 5).
• In the approach for the 2008 estimates, an effort
was made to exclude incidental deaths during
pregnancy in order to better capture true maternal
deaths.
• For the 2008 estimates, countries were classified
into just three groups on the basis of available
data (as noted above) instead of the eight groups
used for the 2005 estimates (the latter were based
on the data source used for deriving an estimate
for the most recent time period). One reason for
this change is that for the 2008 estimation some
countries had multiple data sources over time
so that they could not be assigned to a single
data source. For instance, El Salvador had data
from civil registration (which was not complete),
reproductive health surveys and RAMOS; Turkey
has moved from one-time special studies to
ongoing surveillance systems to improve data
quality.
3.6 Differences from other recent estimates
Recently, an academic institute (Institute of Health
Metrics and Evaluation – IHME) published estimates
of maternal mortality for 181 countries using an
alternative statistical methodology.3 There are
differences in various aspects of the IHME study and
this interagency analysis by MMEIG/TAG described
here. These include:
• Input data: the type of data sources and
adjustments made to data from various
sources (e.g. to sibling history data) differed.
The interagency estimates used only nationally
representative data, while the IHME study used
subnational data in some cases.
• Statistical models: modelling strategies differed.

Trends in maternal mortality: 1990–2008
16 • Covariates: the IHME analysis used total fertility
rate, GDP, HIV prevalence, neonatal mortality
rate, and female education, while the interagency
analysis used GDP, GFR, and SAB.
• Addressing HIV: the IHME analysis used HIV
prevalence as a covariate for the model which
included HIV/AIDS-related maternal deaths in
the output variable. The interagency analysis
separately estimated the numbers of non-HIV
related deaths and indirect maternal deaths due
to HIV/AIDS, and combined them later.
• Number of female deaths at ages 15–49: both
analyses applied the estimated PMDF to the
estimated number of deaths to women at
reproductive age. The life tables used for this
application were different. Even if the estimated
PMDFs from the two analyses were similar,
differences in the number of deaths of women
of reproductive age would contribute to different
findings. The IHME used the life tables created by
their institute, while this interagency analysis used
the WHO life tables.
• Process: the interagency estimation involved a
period of interaction with countries to give the
opportunity to review the preliminary estimates,
data sources and methods; to obtain additional
data sources that may not have been used; and
to build mutual understanding of the strengths
and weaknesses of available data.

17
17
Trends in maternal mortality: 1990–2008
4. ANALYSIS AND INTERPRETATION OF 2008 ESTIMATES
deaths reported in 2008. In contrast, 27 countries (all
middle- or high-income countries) had five or fewer
maternal deaths in 2008.
As shown in Annexes 1 and 2, 45 countries
had high MMR (defined as MMR ≥300 maternal
deaths per 100 000 live births) with four countries
(Afghanistan, Chad, Guinea-Bissau, and Somalia),
having extremely high MMR (defined as MMR ≥1000
maternal deaths per 100 000 live births). In 2008,
the 10 highest MMR countries in sub-Saharan
Africa in descending order were: Chad (1200),
Somalia (1200), Guinea-Bissau (1000), Liberia (990),
Burundi (970), Sierra Leone (970), the Central African
Republic (850), Nigeria (840), Mali (830), and Niger
(820). Although most sub-Saharan African countries
had high MMR, Mauritius and Cape Verde had low
MMR (defined as MMR 20–99 maternal deaths per
100 000 live births), while Namibia and Botswana
had moderate MMR (defined as MMR 100–299
maternal deaths per 100 000 live births). Outside
sub-Saharan Africa, the seven countries with high
MMR were Afghanistan (1400), the Lao People's
Democratic Republic (580), Nepal (380), Timor-Leste
(370), Bangladesh (340), Haiti (300), and Cambodia
(290).
Among developing regions, the adult lifetime risk of
maternal death (the probability that a 15-year-old
female will die eventually from a maternal cause) is
highest in sub-Saharan Africa (at 1 in 31), followed
by Oceania (1 in 110) and South Asia (1 in 120),
while the developed regions had the smallest lifetime
risk (1 in 4300). Of all 172 countries and territories
for which estimates were made, Afghanistan had the
highest estimated lifetime risk of 1 in 11.
Appendices 6, 8, 10, 12, and 14 present the MMR,
number of maternal deaths, and adult lifetime risk
for WHO, UNICEF, UNFPA, The World Bank, and
UNPD regions, respectively.
Overall, it was estimated that there were 42 000
deaths due to HIV/AIDS among pregnant women.
About half of those were assumed to be maternal
(21 000, u=0.5; see Appendix 5). The contribution of
4.1 Maternal mortality estimates for 2008
Table 2 and Annex 1 present the estimates of
MMR, the range of uncertainty of MMR estimates,
the number of maternal deaths, and the lifetime
risk by MDG regional groupings and by country,
respectively. Although the point estimates are
considered the most likely levels of MMR, the
uncertainty ranges are intervals estimated to contain
the true MMR with 95% probability.
For 2008, there were an estimated 358 000 maternal
deaths in the world, or a maternal mortality ratio
(MMR) of 260 maternal deaths per 100 000 live
births. There is a range of uncertainty around both
estimates, suggesting that the true number of
maternal deaths in 2008 could plausibly have been
as low as 265 000 or as high as 503 000. Likewise,
the plausible range for the global MMR in 2008
extends from 200 to 370.
Of the estimated total of 358 000 maternal deaths
worldwide, developing countries accounted for
99% (355 000) (Table 2). Nearly three fifths of the
maternal deaths (204 000) occurred in the sub-
Saharan Africa region alone, followed by South Asia
(109 000). Thus, sub-Saharan Africa and South Asia
accounted for 87% (313 000) of global maternal
deaths. The MMR in 2008 was highest in developing
regions (290) in stark contrast to developed
regions (14) and countries of the Commonwealth
of Independent States (40). Among the developing
regions, sub-Saharan Africa had the highest MMR at
640 maternal deaths per 100 000 live births in 2008,
followed by South Asia (280), Oceania (230), South-
Eastern Asia (160), North Africa (92), Latin America
and the Caribbean (85), Western Asia (68), and
Eastern Asia (41).
By country (Annex 1), India had the largest number
of maternal deaths (63 000), followed by Nigeria
(50 000), the Democratic Republic of the Congo
(19 000), Afghanistan (18 000), Ethiopia (14 000),
Pakistan (14 000), the United Republic of Tanzania
(14 000), Bangladesh (12 000), Indonesia (10 000),
Sudan (9700), and Kenya (7900). These 11 countries
comprised an estimated 65% of the global maternal

Trends in maternal mortality: 1990–2008
18 HIV/AIDS was highest in sub-Saharan Africa where
9% of all maternal deaths were due to HIV/AIDS as
shown in Table 3. Without HIV/AIDS, the MMR for
sub-Saharan Africa would have been 580 maternal
deaths per 100 000 live births instead of 640.
Estimates of MMR trends, 1990–2008
The methodological approach used to estimate
maternal mortality in this round of MMEIG/TAG
estimates is substantially different from the ones
used in the earlier rounds. In addition, more input
data were available for the analysis of this round
as a result of consultations with countries and
the increased attempts by countries to measure
the MMR in recent years. Therefore, the findings
of this exercise should not be compared with the
earlier MMEIG published estimates.1,2 This exercise
generated updated MMR figures for years 1990,
1995, 2000, 2005 and 2008 with new and improved
methodology. The findings, presented in Annex 3,
allow analysis of trends in maternal mortality
between 1990 and 2008.
Table 4 shows the comparison of the MDG regional
groupings of maternal mortality estimates for
1990 and 2008 and the percentage change in the
MMR between 1990 and 2008 (similar tables for
the different regional groupings for WHO, UNICEF,
UNFPA, The World Bank, and UNPD are shown
in Appendices 7, 9, 11, 13, and 15, respectively).
Worldwide, maternal deaths fell from 546 000 in
1990 to 358 000 in 2008 while the MMR declined
by 34% from 400 in 1990 to 260 in 2008 (Table 4).
Annually, the MMR declined 2.3% (uncertainty
interval 1.8 to 2.8).
Table 2. Estimates of maternal mortality ratio (MMR, deaths per 100 000 live births), number of maternal deaths, and lifetime risk by United Nations MDG regions, 2008
RegionEstimated
MMRa
Number of maternal deathsa
Lifetime risk of maternal deatha: 1 in:
Range of uncertainty on MMR estimates
Lower estimate
Upper estimate
WORLD TOTAL 260 358 000 140 200 370Developed regionsb 14 1700 4300 13 16Countries of the Commonwealth of Independent States (CIS)c 40 1500 1500 34 48
Developing regions 290 355 000 120 220 410Africa 590 207 000 36 430 850
Northern Africad 92 3400 390 60 140Sub-Saharan Africa 640 204 000 31 470 930
Asia 190 139 000 220 130 270Eastern Asia 41 7800 1400 27 66South Asia 280 109 000 120 190 420South-Eastern Asia 160 18 000 260 110 240Western Asia 68 3300 460 45 110
Latin America and the Caribbean 85 9200 490 72 100Oceania 230 550 110 100 500
a The MMR and lifetime risk have been rounded according to the following scheme: <100, no rounding; 100–999, rounded to nearest 10; and >1000, rounded to nearest 100. The numbers of maternal deaths have been rounded as follows: <1000, rounded to nearest 10; 1000–9999, rounded to nearest 100; and >10 000, rounded to nearest 1000.
b Includes Albania, Australia, Austria, Belgium, Bosnia and Herzegovina, Bulgaria, Canada, Croatia, Czech Republic, Denmark, Estonia, Finland, France, Germany, Greece, Hungary, Iceland, Ireland, Italy, Japan, Latvia, Lithuania, Luxembourg, Malta, Montenegro, Netherlands, New Zealand, Norway, Poland, Portugal, Romania, Serbia, Slovakia, Slovenia, Spain, Sweden, Switzerland, The former Yugoslav Republic of Macedonia, the United Kingdom, and the United States of America.
c The CIS countries are Armenia, Azerbaijan, Belarus, Georgia, Kazakhstan, Kyrgyzstan, Tajikistan, Turkmenistan, the Republic of Moldova, the Russian Federation, and Uzbekistan.
d Excludes Sudan, which is included in sub-Saharan Africa.

19
19
Trends in maternal mortality: 1990–2008
Table 3. Estimates of maternal mortality due to HIV/AIDS by United Nations MDG regions, 2008
Region
MMR (maternal
deaths per 100 000 live
births)a
HIV-specific maternal mortality
ratio
Number of maternal
deaths due to HIV/AIDSa
Percentage of maternal deaths due to HIV/AIDS
Number of maternal deathsa
WORLD TOTAL 260 15 21 000 5.8 358 000
Developed regionsb 14 1 90 5.6 1700
Countries of the Commonwealth of Independent States (CIS)c 40 2 70 4.7 1500
Developing regions 290 17 21 000 5.8 355 000
Africa 590 52 18 000 8.9 207 000
Northern Africad 92 0 10 0.3 3400
Sub-Saharan Africa 640 58 18 000 9.0 204 000
Asia 190 2 1700 1.2 139 000
Eastern Asia 41 0 80 1.0 7800
South Asia 280 3 1300 1.2 109 000
South-Eastern Asia 160 3 310 1.7 18 000
Western Asia 68 0 0 0 3300
Latin America and the Caribbean 85 4 480 5.2 9200
Oceania 230 2 10 1.1 550
a The MMR and lifetime risk have been rounded according to the following scheme: <100, no rounding; 100–999, rounded to nearest 10; and >1000, rounded to nearest 100. The numbers of maternal deaths have been rounded as follows: <1000, rounded to nearest 10; 1000–9999, rounded to nearest 100; and >10 000, rounded to nearest 1000.
b Includes Albania, Australia, Austria, Belgium, Bosnia and Herzegovina, Bulgaria, Canada, Croatia, Czech Republic, Denmark, Estonia, Finland, France, Germany, Greece, Hungary, Iceland, Ireland, Italy, Japan, Latvia, Lithuania, Luxembourg, Malta, Montenegro, Netherlands, New Zealand, Norway, Poland, Portugal, Romania, Serbia, Slovakia, Slovenia, Spain, Sweden, Switzerland, The former Yugoslav Republic of Macedonia, the United Kingdom, and the United States of America.
c The CIS countries are Armenia, Azerbaijan, Belarus, Georgia, Kazakhstan, Kyrgyzstan, Tajikistan, Turkmenistan, the Republic of Moldova, the Russian Federation, Ukraine, and Uzbekistan.
d Excludes Sudan, which is included in sub-Saharan Africa.
By the broad MDG regions, all regions presented
declines in MMR between 1990 and 2008, both in
the total for the period and annually. The total MMR
percentage decline in developing regions was 34%,
more than twice that of the developed regions of
13%. It is important to note that it is easier to reduce
the MMR when levels are high than when they are
low. Among the developing regions, Eastern Asia
had the largest decline, 63%, followed by South-
Eastern Asia 57%, South Asia 53%, Asia 52%,
Western Asia 52%, Latin America and the Caribbean
41%, sub-Saharan Africa 26%, and Oceania 22%.
Annex 3 presents MMR estimates by country for
the period 1990–2008, as well total and annual
percentage change for the same period. Out of the
172 countries and territories that were covered in
this exercise, between 1990 and 2008, there was no
estimated change in MMR in 2 countries, while 23
countries had an increase in MMR and 147 countries
experienced total MMR percentage declines. The list
of the 90 countries with a decline of 40% or more
in the MMR between 1990 and 2008 is presented in
Annex 4.
Among sub-Saharan African countries, it is estimated
that the largest total percentage declines in MMR
occurred in: Equatorial Guinea (–73%), Eritrea
(–69%), Cape Verde (–58%), Ethiopia (–53%) and
Rwanda (–51%). The five countries that experienced
the estimated largest percentage increases were:
Botswana (133%), Zimbabwe (102%), South Africa
(80%), Swaziland (62%), and Lesotho (44%). The
latter group of countries are all in Southern Africa,
the subregion with the highest HIV prevalence in
the world.

Trends in maternal mortality: 1990–2008
20 Issues to consider in using the 2008 maternal mortality estimates
The estimates for 2008 provided in this report are
the fifth in a series of attempts by the UN agencies
to examine the likely global dimensions of the
problem of maternal mortality. Several issues should
be considered in using these estimates.
First, it should be noted that the data and methods
have improved over time. The 2008 estimates
should not be compared with those from the
previous exercises to assess changes in time.
Trends in maternal mortality calculated using the
same improved methodology and presented for
years 1990, 1995, 2000, 2005, and 2008 in this
report show the changes over time.
Second, depending on the type of data source
used, the primary data for individual countries had
to be adjusted for specific characteristics. These
characteristics included the extent of potential
underreporting of maternal deaths, which is an issue
even in highly developed civil registration systems,
to obtain MMR estimates that are comparable
across study designs. Such an adjustment allows
regional and global aggregation. For this reason,
the presented point estimates usually differ from the
country-reported figures.
Third, despite the improved methodology, the global
database on maternal mortality remains weak.
Only slightly over a third of countries/territories
have complete civil registration systems and good
attribution of cause of death (Group A). The ability
to generate country, regional, and global estimates
with higher precision and accuracy would be greatly
facilitated if country civil registration systems were
further improved. This improvement would obviate
Table 4. Comparison of 1990 and 2008 maternal mortality by United Nations MDG regions
Region
1990a 2008a % changein MMR between 1990 and
2008
Annual % change in MMR between 1990 and
2008
MMRMaternal deaths
MMRMaternal deaths
WORLD TOTAL 400 546 000 260 358 000 –34 –2.3Developed regionsb 16 2000 14 1700 –13 –0.8Countries of the Commonwealth of Independent States (CIS)c 68 3200 40 1500 –41 –3.0
Developing regions 450 540 000 290 355 000 –34 –2.3Africa 780 208 000 590 207 000 –25 –1.6
Northern Africad 230 8600 92 3400 –59 –5.0Sub-Saharan Africa 870 199 000 640 204 000 –26 –1.7
Asia 390 315 000 190 139 000 –52 –4.0Eastern Asia 110 29 000 41 7800 –63 –5.5South Asia 590 234 000 280 109 000 –53 –4.2South-Eastern Asia 380 46 000 160 18 000 –57 –4.7Western Asia 140 6100 68 3300 –52 –4.0
Latin America and the Caribbean 140 17 000 85 9200 –41 –2.9Oceania 290 540 230 550 –22 –1.4
a The 1990 estimates have been revised using the same methodology used for 2008, which make them comparable. The MMRs have been rounded according to the following scheme: <100, no rounding; 100–999, rounded to nearest 10; and >1000, rounded to nearest 100. The numbers of maternal deaths have been rounded as follows: <1000, rounded to nearest 10; 1000–9999, rounded to nearest 100; and >10 000, rounded to nearest 1000.
b Includes Albania, Australia, Austria, Belgium, Bosnia and Herzegovina, Bulgaria, Canada, Croatia, Czech Republic, Denmark, Estonia, Finland, France, Germany, Greece, Hungary, Iceland, Ireland, Italy, Japan, Latvia, Lithuania, Luxembourg, Malta, Montenegro, Netherlands, New Zealand, Norway, Poland, Portugal, Romania, Serbia, Slovakia, Slovenia, Spain, Sweden, Switzerland, The former Yugoslav Republic of Macedonia, the United Kingdom, and the United States of America.
c The CIS countries are Armenia, Azerbaijan, Belarus, Georgia, Kazakhstan, Kyrgyzstan, Tajikistan, Turkmenistan,the Republic of Moldova, the Russian Federation, Ukraine, and Uzbekistan.
d Excludes Sudan, which is included in sub-Saharan Africa.
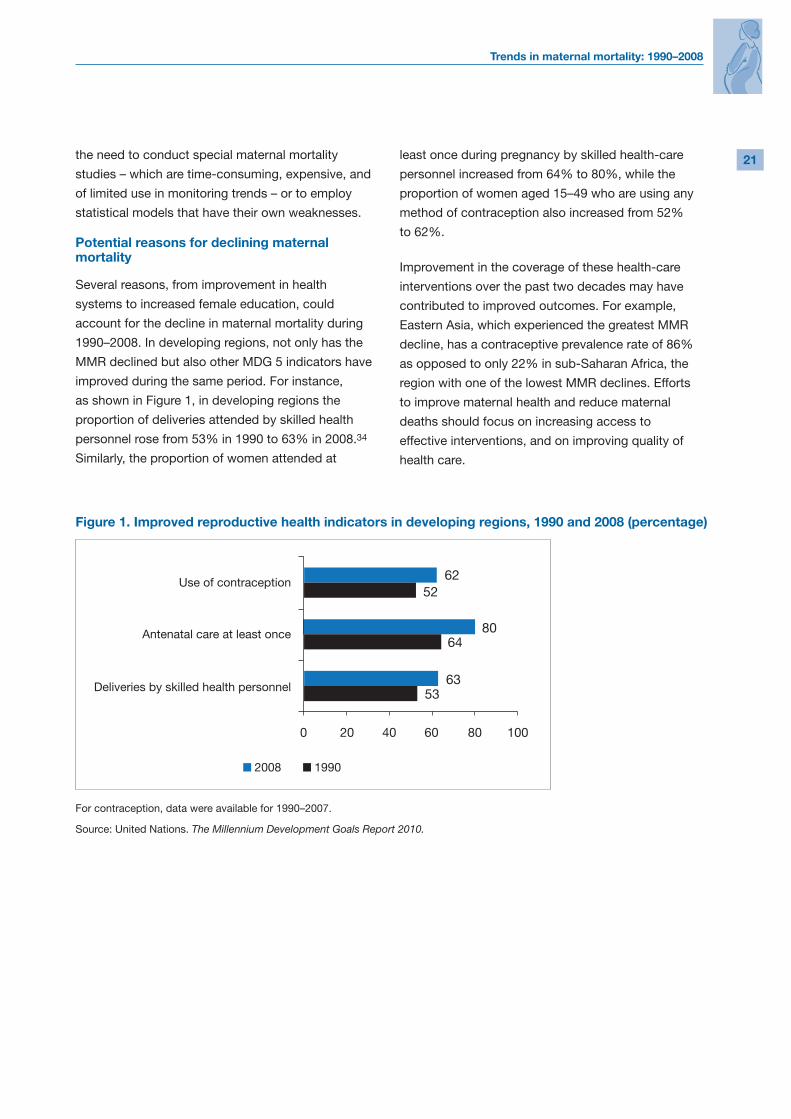
21
21
Trends in maternal mortality: 1990–2008
the need to conduct special maternal mortality
studies – which are time-consuming, expensive, and
of limited use in monitoring trends – or to employ
statistical models that have their own weaknesses.
Potential reasons for declining maternal mortality
Several reasons, from improvement in health
systems to increased female education, could
account for the decline in maternal mortality during
1990–2008. In developing regions, not only has the
MMR declined but also other MDG 5 indicators have
improved during the same period. For instance,
as shown in Figure 1, in developing regions the
proportion of deliveries attended by skilled health
personnel rose from 53% in 1990 to 63% in 2008.34
Similarly, the proportion of women attended at
least once during pregnancy by skilled health-care
personnel increased from 64% to 80%, while the
proportion of women aged 15–49 who are using any
method of contraception also increased from 52%
to 62%.
Improvement in the coverage of these health-care
interventions over the past two decades may have
contributed to improved outcomes. For example,
Eastern Asia, which experienced the greatest MMR
decline, has a contraceptive prevalence rate of 86%
as opposed to only 22% in sub-Saharan Africa, the
region with one of the lowest MMR declines. Efforts
to improve maternal health and reduce maternal
deaths should focus on increasing access to
effective interventions, and on improving quality of
health care.
Figure 1. Improved reproductive health indicators in developing regions, 1990 and 2008 (percentage)
For contraception, data were available for 1990–2007.
Source: United Nations. The Millennium Development Goals Report 2010.
2008 1990
6252
8064
53
0 40 60 80 10020
Use of contraception
Antenatal care at least once
Deliveries by skilled health personnel63

Trends in maternal mortality: 1990–2008
22
5. IS THE FIFTH MDG ACHIEVABLE?
The fifth MDG aims to improve maternal health with
a target of reducing the MMR by 75% between 1990
and 2015. That is, it seeks to achieve an average
annual decline of 5.5% in the MMR from 1990 to
2015. According to these new estimates, both the
number of maternal deaths and the MMR fell by
a third or more since 1990. Globally the average
annual percentage decline in the MMR between
1990 and 2008 was 2.3%. None of the broad MDG
regions was on track to achieve MDG 5, except
Eastern Asia with a 5.5% annual decline (Table 4).
Oceania and sub-Saharan Africa have made the
least progress at 1.4% and 1.7%, respectively.
Fourteen countries achieved an average annual
decline of 5.5% or more between 1990 and 2008:
Bhutan, Bolivia (Plurinational State of), China, Egypt,
Equatorial Guinea, Eritrea, Estonia, Iran (Islamic
Republic of), Latvia, Maldives, Poland, Romania,
Turkey, and Viet Nam (Annex 3).
To measure progress, countries with an MMR ≥100
in 1990, have been categorized as “on track”,
“making progress”, “insufficient progress” or “no
progress” in improving maternal health. A country is
considered to be “on track” if the annual percentage
decline between 1990 and 2008 is 5.5% or more.
If the annual decline in MMR is between 2% and
5.5%, the country is considered to be “making
progress”. Countries with an annual decline of less
than 2% are considered to have made “insufficient
progress” and countries with rising MMR have been
categorized as making “no progress”. As shown in
Annex 3, of the 87 countries with an MMR ≥100 in
1990, 10 countries are considered to be “on track”
to improving maternal health, 47 countries have
been “making progress”, 22 have made “insufficient
progress” and 8 have made “no progress”. In sub-
Saharan Africa only Equatorial Guinea, and Eritrea
and are “on track”, while three countries in South
Asia (Bhutan, Iran (Islamic Republic of), Maldives)
are also “on track”.
The international community has been increasingly
concerned about the fairly slow progress in
improving maternal health. During 2010, the United
Nations Secretary-General launched the Global
Strategy for Women’s and Children’s Health, which
seeks to catalyse action for renewed and enhanced
commitments by all partners for adequate financing
and policy to improve women’s and children’s
health.35 The commitments would support the
following elements to accelerate progress towards
MDG 5:
• Country-led health plans – development
partners to support governments to implement
country-led plans to improve access to
reproductive health services.
• A comprehensive, integrated package of
essential interventions and services – women
and children should have access to a package
of integrated services including family planning,
antenatal care, skilled care at birth, emergency
obstetric and newborn care, safe abortion
services (where abortion is not prohibited by law)
and prevention of mother-to-child transmission of
HIV services.
• Health systems strengthening – development
partners to support governments to strengthen
health systems to deliver high-quality services
particularly in underserved communities.
• Health workforce capacity building –
development partners to work with governments
to address the critical shortage of health workers
by implementing national plans to train, retain and
deploy health workers.
• Coordinated research and innovation –
development partners to develop, fund and
implement a prioritized, coordinated and
innovative research agenda for women’s and
children’s health.
Fulfilling these commitments in line with the
elements of the Global Strategy for Women’s and
Children’s Health should help advance progress in
maternal health.

23
23
Trends in maternal mortality: 1990–2008
Country Estimated
MMRa
Range of uncertainty on MMR estimates Number of
maternal deathsa
Lifetime risk of
maternal deatha:
1 in:
Proportion of maternal deaths due to HIV(%)b
PMDFc
(%)Groupd
Lower estimate
Upper estimate
Afghanistan 1400 740 2600 18 000 11 39.8 BAlbania 31 19 50 14 1700 1.5 BAlgeria 120 61 220 840 340 6.2 BAngola 610 270 1400 4800 29 15.3 CArgentina 70 61 77 480 600 4.8 AArmenia 29 18 45 14 1900 1.4 BAustralia 8 6 10 20 7400 0.6 AAustria 5 5 6 4 14 300 0.3 AAzerbaijan 38 24 60 63 1200 1.6 BBahamas 49 38 57 3 1000 1.5 ABahrain 19 11 30 3 2200 1.8 BBangladesh 340 170 660 12 000 110 8 BBarbados 64 55 72 2 1100 1.6 ABelarus 15 12 20 15 5100 0.4 ABelgium 5 4 7 6 10 900 0.3 ABelize 94 56 140 7 330 5.6 ABenin 410 250 690 1400 43 15.1 BBhutan 200 110 370 30 170 6.6 BBolivia (Plurinational State of) 180 120 280 470 150 9.2 B
Bosnia and Herzegovina 9 5 16 3 9300 0.4 B
Botswana 190 84 380 91 180 77.9 2.1 BBrazil 58 38 87 1800 860 2.6 BBrunei Darussalam 21 13 34 2 2000 1.9 BBulgaria 13 11 15 9 5800 0.4 ABurkina Faso 560 330 950 4000 28 17 BBurundi 970 410 2300 2700 25 17.4 CCambodia 290 180 480 1100 110 8.4 BCameroon 600 360 960 4200 35 14.2 11.6 BCanada 12 7 20 42 5600 0.7 ACape Verde 94 39 210 11 350 6 CCentral African Republic 850 490 1400 1300 27 11.6 12.1 B
Chad 1200 670 2100 5900 14 27.8 BChile 26 15 43 64 2000 2 AChina 38 23 60 6900 1500 1.9 BColombia 85 74 94 780 460 6.5 AComoros 340 140 780 72 71 12.7 CCongo 580 330 1000 720 39 11.8 11.8 BCosta Rica 44 24 82 33 1100 3.5 ACôte d'Ivoire 470 290 730 3400 44 15.2 10.5 BCroatia 14 11 17 6 5200 0.7 ACuba 53 36 76 63 1400 2.2 ACyprus 10 4 23 <2 6600 0.9 CCzech Republic 8 5 12 9 8500 0.5 A
Annex 1. Estimates of maternal mortality ratio (MMR, deaths per 100 000 live births), number of maternal deaths and lifetime risk (2008)
ANNEXES

Trends in maternal mortality: 1990–2008
24
Annex 1. continued
Country Estimated
MMRa
Range of uncertainty on MMR estimates Number of
maternal deathsa
Lifetime risk of
maternal deatha:
1 in:
Proportion of maternal deaths due to HIV(%)b
PMDFc
(%)Groupd
Lower estimate
Upper estimate
Democratic People's Republic of Korea 250 84 690 810 230 5.4 C
Democratic Republic of the Congo 670 340 1300 19 000 24 19.7 B
Denmark 5 5 6 3 10 900 0.4 ADjibouti 300 140 610 73 93 14.9 6.8 CDominican Republic 100 62 170 240 320 12.2 5.5 BEcuador 140 81 230 380 270 6.6 BEgypt 82 51 130 1600 380 5.8 BEl Salvador 110 71 170 140 350 4.8 BEquatorial Guinea 280 130 630 70 73 12.6 6.3 CEritrea 280 160 510 520 72 6.6 15.5 BEstonia 12 9 14 2 5300 0.5 AEthiopia 470 270 790 14 000 40 16.4 BFiji 26 14 48 5 1300 1.1 BFinland 8 7 8 4 7600 0.5 AFrance 8 5 14 63 6600 0.6 AGabon 260 150 420 100 110 26.1 5.2 BGambia 400 190 910 250 49 15.7 CGeorgia 48 30 76 25 1300 1.8 BGermany 7 6 8 49 11 100 0.4 AGhana 350 210 600 2600 66 9.6 11.3 BGreece 2 2 3 2 31 800 0.2 AGuatemala 110 56 190 480 210 7.1 AGuinea 680 390 1100 2700 26 21.2 BGuinea-Bissau 1000 440 2300 650 18 25 CGuyana 270 180 410 37 150 5.7 BHaiti 300 180 520 820 93 7.3 9.3 BHonduras 110 71 180 230 240 8 BHungary 13 10 17 13 5500 0.5 AIceland 5 5 6 <2 9400 0.6 AIndia 230 150 350 63 000 140 8.2 BIndonesia 240 140 380 10 000 190 6.1 BIran (Islamic Republic of) 30 18 50 420 1500 1.9 B
Iraq 75 41 140 710 300 4.9 BIreland 3 2 3 2 17 800 0.3 AIsrael 7 6 7 9 5100 1.2 AItaly 5 4 6 26 15 200 0.3 AJamaica 89 60 120 47 450 8.9 3.4 BJapan 6 5 8 65 12 200 0.4 AJordan 59 35 100 92 510 5.3 BKazakhstan 45 34 61 140 950 1.2 AKenya 530 320 850 7900 38 13.9 12 BKuwait 9 8 10 5 4500 1.4 AKyrgyzstan 81 50 130 97 450 3.1 BLao People's Democratic Republic 580 320 1000 980 49 14.5 B

25
25
Trends in maternal mortality: 1990–2008
Annex 1. continued
Country Estimated
MMRa
Range of uncertainty on MMR estimates Number of
maternal deathsa
Lifetime risk of
maternal deatha:
1 in:
Proportion of maternal deaths due to HIV(%)b
PMDFc
(%)Groupd
Lower estimate
Upper estimate
Latvia 20 18 23 5 3600 0.5 ALebanon 26 14 48 17 2000 1.4 BLesotho 530 260 850 310 62 58.9 3.6 BLiberia 990 520 1800 1400 20 27.5 BLibyan Arab Jamahiriya 64 26 140 94 540 5.2 CLithuania 13 11 16 4 5800 0.3 ALuxembourg 17 15 19 <2 3800 1.1 AMadagascar 440 270 700 3000 45 19 BMalawi 510 300 760 3000 36 31.8 9.1 BMalaysia 31 14 68 170 1200 2.4 CMaldives 37 21 64 2 1200 4.2 BMali 830 520 1400 4500 22 21.3 BMalta 8 7 9 <2 9200 0.7 AMauritania 550 300 980 590 41 18.3 BMauritius 36 30 41 7 1600 1.6 AMexico 85 74 95 1700 500 6.2 AMongolia 65 27 150 32 730 2.4 CMontenegro 15 8 26 <2 4000 0.8 BMorocco 110 63 190 720 360 8.4 BMozambique 550 310 870 4800 37 25.5 8.7 BMyanmar 240 140 410 2400 180 4.7 BNamibia 180 93 270 100 160 50.1 3.4 BNepal 380 210 650 2800 80 9.3 BNetherlands 9 7 10 16 7100 0.6 ANew Zealand 14 12 15 8 3800 1 ANicaragua 100 57 180 150 300 7.7 BNiger 820 470 1400 6500 16 33.8 BNigeria 840 460 1500 50 000 23 17.9 BNorway 7 4 12 4 7600 0.6 AOman 20 9 45 12 1600 2.4 CPakistan 260 140 490 14 000 93 12.8 BPanama 71 58 84 50 520 5 APapua New Guinea 250 110 560 530 94 9.3 CParaguay 95 57 150 150 310 8 BPeru 98 62 160 600 370 6.5 BPhilippines 94 61 140 2100 320 6.5 BPoland 6 2 13 21 13 300 0.3 APortugal 7 5 10 8 9800 0.4 APuerto Rico 18 12 26 10 3000 19.8 1.1 BQatar 8 4 19 <2 4400 1.5 CRepublic of Korea 18 16 20 81 4700 0.9 ARepublic of Moldova 32 28 35 14 2000 0.9 ARomania 27 17 44 57 2700 1 ARussian Federation 39 33 46 600 1900 0.7 ARwanda 540 320 910 2200 35 5.0 18.6 BSaudi Arabia 24 13 45 140 1300 2.2 BSenegal 410 240 680 1900 46 18.1 B

Trends in maternal mortality: 1990–2008
26
Country Estimated
MMRa
Range of uncertainty on MMR estimates Number of
maternal deathsa
Lifetime risk of
maternal deatha:
1 in:
Proportion of maternal deaths due to HIV(%)b
PMDFc
(%)Groupd
Lower estimate
Upper estimate
Serbia 8 7 9 9 7500 0.4 ASierra Leone 970 530 1800 2200 21 22 BSingapore 9 8 10 3 10 000 0.5 ASlovakia 6 5 6 3 13 300 0.3 ASlovenia 18 15 20 3 4100 1.1 ASolomon Islands 100 44 240 16 230 8 CSomalia 1200 510 2800 4800 14 34.5 CSouth Africa 410 240 610 4500 100 42.5 2.8 BSpain 6 5 7 28 11 400 0.4 ASri Lanka 39 26 57 140 1100 2.2 BSudan 750 420 1300 9700 32 19.4 BSuriname 100 86 110 10 400 3.8 ASwaziland 420 180 800 150 75 75.1 3 BSweden 5 3 8 5 11 400 0.5 ASwitzerland 10 8 11 7 7600 0.7 ASyrian Arab Republic 46 20 100 270 610 3.9 CTajikistan 64 29 140 120 430 4.9 CThailand 48 32 68 470 1200 23.1 1.2 BThe former Yugoslav Republic of Macedonia 9 6 14 2 7300 0.5 A
Timor-Leste 370 150 860 160 44 24.2 CTogo 350 210 600 740 67 14.6 9.2 BTrinidad and Tobago 55 35 82 11 1100 1.7 ATunisia 60 32 110 98 860 4 BTurkey 23 15 36 310 1900 1.8 BTurkmenistan 77 33 190 85 500 2.3 CUganda 430 240 670 6300 35 24.0 11.3 BUkraine 26 20 33 120 3000 0.5 AUnited Arab Emirates 10 4 24 7 4200 1.3 CUnited Kingdom 12 11 14 90 4700 0.8 AUnited Republic of Tanzania 790 470 1300 14 000 23 11.1 15.8 B
United States of America 24 20 27 1000 2100 1.3 A
Uruguay 27 22 33 14 1700 1.7 AUzbekistan 30 25 35 170 1400 1.5 AVenezuela (Bolivarian Republic of) 68 59 75 400 540 4.6 A
Viet Nam 56 27 120 840 850 6.7 2.6 CYemen 210 110 400 1800 91 14.2 BZambia 470 250 680 2600 38 37.0 7.8 BZimbabwe 790 410 1200 3000 42 52.7 4.3 B
a The MMR and lifetime risk have been rounded according to the following scheme: <100, no rounding; 100–999, rounded to near-est 10; and >1000, rounded to nearest 100. The numbers of maternal deaths have been rounded as follows: <100, no rounding; 100–999 rounded to nearest 10; 1000–9999, rounded to nearest 100; and >10 000, rounded to nearest 1000.
b The proportion of maternal deaths due to HIV/AIDS in countries with high HIV/AIDS prevalence. Data are not presented for coun-tries without generalized HIV epidemic.
c The proportion of maternal deaths among females of reproductive age (PMDF).
d Group A=63 countries with good civil registration systems; Group B=85 countries with modelled MMR estimates using available country data; Group C=24 countries with modelled MMR estimates but with no available maternal mortality data.
Annex 1. continued

27
27
Trends in maternal mortality: 1990–2008
Annex 2. Map with countries by category according to their maternal mortality ratio (MMR, deaths per 100 000 live births), 2008
Maternal Mortality Ratio, 2008
<20
20–99
100–299
300–549
550–999
≥1000
Population <250 000 not included in the assessement
Not applicable
The boundaries and names shown and the designations used on this map do not imply the expression of any opinion whatsoever on the part of the World Health Organization concerning the legal status of any country, territory, city or area or of its authorities, or concerning the delimitation of its frontiers or boundaries. Dotted lines on maps represent approximate border lines for which there may not yet be full agreement.

Trends in maternal mortality: 1990–2008
28
Annex 3. Comparison of 1990, 1995, 2000, 2005, and 2008 estimates of maternal mortality ratio (MMR, deaths per 100 000 live births) by country
Country Estimated MMRa % change in MMR between 1990 and
2008
Annual % change in MMR between 1990 and
2008b
Progress towards improving
maternal healthc1990 1995 2000 2005 2008
Afghanistan 1700 1800 1800 1500 1400 –17 –1.0 insufficient progress
Albania 48 44 41 34 31 –35 –2.4 Algeria 250 180 140 120 120 –53 –4.1 making progressAngola 1000 1000 880 720 610 –41 –2.9 making progressArgentina 72 61 63 70 70 –3 –0.2 Armenia 51 44 34 32 29 –44 –3.2 Australia 10 13 9 8 8 –22 –1.4 Austria 10 7 5 5 5 –48 –3.7 Azerbaijan 64 79 59 44 38 –41 –2.9 Bahamas 55 59 56 48 49 –11 –0.7 Bahrain 25 22 23 21 19 –25 –1.6 Bangladesh 870 640 500 420 340 –61 –5.3 making progressBarbados 120 42 50 62 64 –47 –3.5 making progressBelarus 37 28 31 20 15 –58 –4.8 Belgium 7 7 6 5 5 –20 –1.2 Belize 72 32 100 94 94 32 1.5 Benin 790 690 560 460 410 –48 –3.6 making progressBhutan 940 650 420 260 200 –79 –8.6 on trackBolivia (Plurinational State of) 510 410 300 220 180 –65 –5.8 on track
Bosnia and Herzegovina 18 15 11 10 9 –50 –3.8
Botswana 83 130 310 280 190 133 4.7 Brazil 120 98 79 64 58 –52 –4.0 making progressBrunei Darussalam 28 25 24 23 21 –23 –1.4 Bulgaria 24 23 28 14 13 –49 –3.7
Burkina Faso 770 730 650 600 560 –27 –1.8 insufficient progress
Burundi 1200 1200 1200 1100 970 –17 –1.0 insufficient progress
Cambodia 690 640 470 350 290 –58 –4.8 making progress
Cameroon 680 680 660 640 600 –12 –0.7 insufficient progress
Canada 6 7 7 12 12 94 3.7 Cape Verde 230 200 170 120 94 –58 –4.9 making progressCentral African Republic 880 890 900 910 850 –3 –0.2 insufficient
progress
Chad 1300 1300 1300 1200 1200 –5 –0.3 insufficient progress
Chile 56 40 29 26 26 –54 –4.3 China 110 82 60 44 38 –66 –6.0 on trackColombia 140 120 110 85 85 –41 –2.9 making progressComoros 530 450 390 360 340 –36 –2.5 making progressCongo 460 520 590 590 580 26 1.3 no progressCosta Rica 35 42 41 43 44 25 1.3 Côte d'Ivoire 690 620 580 530 470 –31 –2.1 making progressCroatia 8 14 11 14 14 64 2.8

29
29
Trends in maternal mortality: 1990–2008
Annex 3. continued
Country Estimated MMRa % change in MMR between 1990 and
2008
Annual % change in MMR between 1990 and
2008b
Progress towards improving
maternal healthc1990 1995 2000 2005 2008
Cuba 63 62 65 53 53 –16 –1.0 Cyprus 17 17 14 11 10 –41 –3.0 Czech Republic 15 9 7 7 8 –49 –3.8 Democratic People's Republic of Korea 270 270 260 250 250 –7 –0.4 insufficient
progressDemocratic Republic of the Congo 900 910 850 740 670 –26 –1.7 insufficient
progressDenmark 7 11 5 4 5 –27 –1.8
Djibouti 370 350 330 320 300 –19 –1.2 insufficient progress
Dominican Republic 220 170 120 100 100 –52 –4.1 making progressEcuador 230 190 170 140 140 –40 –2.9 making progressEgypt 220 150 110 90 82 –63 –5.5 on trackEl Salvador 200 170 140 120 110 –44 –3.2 making progressEquatorial Guinea 1000 900 480 320 280 –73 –7.3 on trackEritrea 930 590 420 330 280 –69 –6.6 on trackEstonia 48 46 14 23 12 –76 –7.9 Ethiopia 990 920 750 560 470 –53 –4.2 making progressFiji 40 36 32 28 26 –34 –2.3 Finland 7 5 5 6 8 16 0.8 France 13 13 10 8 8 –35 –2.4
Gabon 260 250 260 260 260 –2 –0.1 insufficient progress
Gambia 750 690 560 460 400 –46 –3.4 making progressGeorgia 58 64 50 52 48 –17 –1.0 Germany 13 9 7 7 7 –42 –3.0 Ghana 630 540 500 400 350 –44 –3.3 making progressGreece 6 2 5 3 2 –60 –5.2
Guatemala 140 140 110 110 110 –27 –1.7 insufficient progress
Guinea 1200 1100 920 780 680 –43 –3.2 making progress
Guinea-Bissau 1200 1100 1100 1100 1000 –16 –1.0 insufficient progress
Guyana 310 250 120 190 270 –12 –0.7 insufficient progress
Haiti 670 620 450 350 300 –55 –4.4 making progressHonduras 210 180 160 130 110 –47 –3.5 making progressHungary 23 23 10 10 13 –43 –3.2 Iceland 8 7 6 6 5 –33 –2.2 India 570 470 390 280 230 –59 –4.9 making progressIndonesia 620 440 350 270 240 –62 –5.4 making progressIran (Islamic Republic of) 150 90 59 38 30 –80 –8.9 on track
Iraq 93 94 84 82 75 –19 –1.2 Ireland 6 4 6 2 3 –57 –4.6 Israel 12 10 9 7 7 –43 –3.1 Italy 10 6 4 5 5 –53 –4.2 Jamaica 66 76 91 87 89 36 1.7

Trends in maternal mortality: 1990–2008
30
Annex 3. continued
Country Estimated MMRa % change in MMR between 1990 and
2008
Annual % change in MMR between 1990 and
2008b
Progress towards improving
maternal healthc1990 1995 2000 2005 2008
Japan 12 9 9 7 6 –49 –3.7 Jordan 110 95 79 66 59 –48 –3.6 making progressKazakhstan 78 76 59 45 45 –42 –3.0 Kenya 380 460 560 580 530 38 1.8 no progressKuwait 10 10 8 9 9 –8 –0.4 Kyrgyzstan 77 98 81 78 81 5 0.3 Lao People's Democratic Republic 1200 970 790 650 580 –51 –4.0 making progress
Latvia 57 58 42 21 20 –64 –5.7 Lebanon 52 45 36 29 26 –50 –3.8 Lesotho 370 340 470 570 530 44 2.0 no progress
Liberia 1100 1400 1100 1100 990 –14 –0.8 insufficient progress
Libyan Arab Jamahiriya 100 85 74 68 64 –39 –2.7 making progress Lithuania 34 21 20 12 13 –61 –5.2 Luxembourg 6 11 11 17 17 170 5.5 Madagascar 710 680 580 490 440 –38 –2.6 making progressMalawi 910 830 770 620 510 –44 –3.2 making progressMalaysia 56 46 39 34 31 –44 –3.2 Maldives 510 240 110 52 37 –93 –14.6 on trackMali 1200 1100 980 880 830 –31 –2.1 making progressMalta 14 12 11 9 8 –41 –2.9 Mauritania 780 710 640 590 550 –30 –2.0 making progressMauritius 72 67 28 32 36 –50 –3.9 Mexico 93 85 90 87 85 –8 –0.5 Mongolia 130 110 93 79 65 –48 –3.6 making progressMontenegro 15 18 20 17 15 1 0 Morocco 270 220 160 130 110 –59 –5.0 making progressMozambique 1000 890 780 640 550 –47 –3.5 making progressMyanmar 420 350 290 250 240 –43 –3.1 making progress
Namibia 180 170 220 240 180 –3 –0.2 insufficient progress
Nepal 870 700 550 440 380 –56 –4.6 making progressNetherlands 10 11 13 8 9 –16 –1.0 New Zealand 18 13 12 14 14 –22 –1.4 Nicaragua 190 170 140 110 100 –44 –3.2 making progressNiger 1400 1300 1100 910 820 –43 –3.1 making progress
Nigeria 1100 1100 980 900 840 –24 –1.5 insufficient progress
Norway 9 4 8 9 7 –21 –1.3 Oman 49 35 27 22 20 –60 –5.1 Pakistan 490 410 340 290 260 –48 –3.6 making progressPanama 86 71 71 71 71 –18 –1.1
Papua New Guinea 340 300 290 270 250 –25 –1.6 insufficient progress
Paraguay 130 120 110 100 95 –28 –1.8 insufficient progress
Peru 250 220 160 120 98 –61 –5.2 making progress

31
31
Trends in maternal mortality: 1990–2008
Annex 3. continued
Country Estimated MMRa % change in MMR between 1990 and
2008
Annual % change in MMR between 1990 and
2008b
Progress towards improving
maternal healthc1990 1995 2000 2005 2008
Philippines 180 140 120 110 94 –48 –3.6 making progressPoland 17 14 8 5 6 –67 –6.2 Portugal 15 10 9 8 7 –51 –3.9 Puerto Rico 29 31 23 19 18 –37 –2.6 Qatar 15 13 11 9 8 –46 –3.4 Republic of Korea 18 18 19 18 18 1 0 Republic of Moldova 62 60 39 25 32 –49 –3.7 Romania 170 72 52 31 27 –84 –10.3 on trackRussian Federation 74 72 57 39 39 –47 –3.6 Rwanda 1100 1400 1100 720 540 –51 –3.9 making progressSaudi Arabia 41 32 28 25 24 –41 –3.0 Senegal 750 690 560 460 410 –45 –3.3 making progressSerbia 13 15 9 8 8 –40 –2.8
Sierra Leone 1300 1400 1300 1100 970 –25 –1.6 insufficient progress
Singapore 6 6 15 10 9 50 2.3 Slovakia 15 11 13 6 6 –62 –5.4 Slovenia 11 11 12 15 18 59 2.6
Solomon Islands 130 110 110 110 100 –22 –1.4 insufficient progress
Somalia 1100 1200 1200 1200 1200 12 0.6 no progressSouth Africa 230 260 380 440 410 80 3.3 no progressSpain 7 4 5 6 6 –13 –0.8 Sri Lanka 91 73 59 45 39 –58 –4.8
Sudan 830 780 770 760 750 –9 –0.5 insufficient progress
Suriname 84 39 110 100 100 21 1.0 Swaziland 260 220 340 440 420 62 2.7 no progressSweden 7 5 5 4 5 –25 –1.6 Switzerland 8 8 7 8 10 22 1.1 Syrian Arab Republic 120 77 58 50 46 –61 –5.2 making progressTajikistan 120 170 120 75 64 –44 –3.3 making progressThailand 50 52 63 51 48 –4 –0.2 The former Yugoslav Republic of Macedonia 16 14 15 10 9 –43 –3.2
Timor-Leste 650 590 520 420 370 –43 –3.2 making progressTogo 650 550 450 380 350 –46 –3.5 making progressTrinidad and Tobago 86 90 59 55 55 –36 –2.5 Tunisia 130 110 83 67 60 –54 –4.3 making progressTurkey 68 51 39 29 23 –66 –6.0 Turkmenistan 91 98 95 82 77 –16 –0.9 Uganda 670 690 640 510 430 –36 –2.5 making progressUkraine 49 45 35 26 26 –47 –3.5 United Arab Emirates 28 20 15 12 10 –62 –5.4 United Kingdom 10 10 12 13 12 20 1.0 United Republic of Tanzania 880 920 920 860 790 –10 –0.6 insufficient
progress

Trends in maternal mortality: 1990–2008
32
Annex 3. continued
Country Estimated MMRa % change in MMR between 1990 and
2008
Annual % change in MMR between 1990 and
2008b
Progress towards improving
maternal healthc1990 1995 2000 2005 2008
United States of America 12 11 14 24 24 96 3.7
Uruguay 39 35 25 27 27 –30 –2.0 Uzbekistan 53 32 29 30 30 –44 –3.2 Venezuela (Bolivarian Republic of) 84 88 82 68 68 –20 –1.2
Viet Nam 170 120 91 66 56 –66 –6.0 on trackYemen 540 460 340 250 210 –61 –5.3 making progressZambia 390 490 600 560 470 19 1.0 no progressZimbabwe 390 450 670 830 790 102 3.9 no progress
a The MMR have been rounded according to the following scheme: <100, no rounding; 100–999, rounded to nearest 10; and >1000, rounded to nearest 100.
b Negative values indicate a decreasing MMR from 1990 to 2008, while positive values indicate an increasing MMR. Given that the uncertainty intervals are wide for some countries, these will have to interpreted with caution.
c Countries with MMR ≥100 in 1990 are categorized as “on track” if there has been 5.5% decline or more annually, “making progress” if MMR has declined between 2% and 5.5%, making “insufficient progress” if MMR has declined less than 2% annually, and having “no progress” if there has been an annual increase in MMR. Countries with MMR <100 in 1990 are not categorized.

33
33
Trends in maternal mortality: 1990–2008
Country% change
in MMR between 1990 and 2008a
Lebanon –50Mauritius –50Bulgaria –49Czech Republic –49Japan –49Republic of Moldova –49Austria –48Benin –48Jordan –48Mongolia –48Pakistan –48Philippines –48Barbados –47Honduras –47Mozambique –47Russian Federation –47Ukraine –47Gambia –46Qatar –46Togo –46Senegal –45Armenia –44El Salvador –44Ghana –44Malawi –44Malaysia –44Nicaragua –44Tajikistan –44Uzbekistan –44Guinea –43Hungary –43Israel –43Myanmar –43Niger –43The former Yugoslav Republic of Macedonia –43
Timor-Leste –43Germany –42Kazakhstan –42Angola –41Azerbaijan –41Colombia –41Cyprus –41Malta –41Saudi Arabia –41Ecuador –40Serbia –40
Annex 4. Countries with 40% or more decrease in maternal mortality ratio (MMR, deaths per 100 000 live births) between 1990 and 2008
Country% change
in MMR between 1990 and 2008a
Maldives –93Romania –84Iran (Islamic Republic of) –80
Bhutan –79Estonia –76Equatorial Guinea –73Eritrea –69Poland –67China –66Turkey –66Viet Nam –66Bolivia (Plurinational State of) –65
Latvia –64Egypt –63Indonesia –62Slovakia –62United Arab Emirates –62Bangladesh –61Lithuania –61Peru –61Syrian Arab Republic –61Yemen –61Greece –60Oman –60India –59Morocco –59Belarus –58Cambodia –58Cape Verde –58Sri Lanka –58Ireland –57Nepal –56Haiti –55Chile –54Tunisia –54Algeria –53Ethiopia –53Italy –53Brazil –52Dominican Republic –52Lao People's Democratic Republic –51
Portugal –51Rwanda –51Bosnia and Herzegovina –50
a Percentages have been rounded.

Trends in maternal mortality: 1990–2008
34 Appendix 1. Adjustment factor to account for misclassification of maternal deaths in civil registration, literature review of published reports
Country Period/yearAdditional maternal
deaths identified (%)Adjustment factor
Australia2000–2002 110 2.12003–2005 90 1.9
Austria 1980–1998 60 1.6Brazil, capital cities 2002 40 1.4
Canada1988–1992 60 1.61997–2000 50 1.5
China, Taiwan 1984–1988 60 1.6El Salvador June 2005–May 2006 220 3.2
Finland1987–1994 –10 0.91999–2000 100 2.0
France
1999 10 1.11988 Dec–1989 Mar 130 2.3
2001–2003 20 1.22004–2006 20 1.2
Japan 2005 35 1.35
Netherlands1983–1992 40 1.41993–2005 50 1.5
United Kingdom
1985–1987 40 1.41988–1990 40 1.41991–1993 50 1.51994–1996 60 1.61997–1999 80 1.82000–2002 70 1.72003–2005 70 1.7
USA 1995–1997 50 1.5USA, Maryland 1993–2000 60 1.6USA, North Carolina 1999–2000 10 1.1Median 1.5
APPENDICES

35
35
Trends in maternal mortality: 1990–2008
Appendix 2. Sixty-three countries with civil registration data characterized as complete, with good attribution of cause of deatha
Argentina Greece Portugal
Australia Guatemala Republic of Korea
Austria Hungary Republic of Moldova
Bahamas Iceland Romania
Barbados Ireland Russian Federation
Belarus Israel Serbia
Belgium Italy Singapore
Belize Japan Slovakia
Bulgaria Kazakhstan Slovenia
Canada Kuwait Spain
Chile Latvia Suriname
Colombia Lithuania Sweden
Costa Rica Luxembourg Switzerland
Croatia Malta The former Yugoslav Republic of Macedonia
Cuba Mauritius Trinidad and Tobago
Czech Republic Mexico Ukraine
Denmark Netherlands United Kingdom
Estonia New Zealand United States of America
Finland Norway Uruguay
France Panama Uzbekistan
Germany Poland Venezuela (Bolivarian Republic of)
a For the Bahamas, Belgium, Iceland and Malta (0.1% of global births), the statistical model was used because the paucity of the event of maternal mortality gave implausible trends.

Trends in maternal mortality: 1990–2008
36 Appendix 3. Eighty-five countries lacking good complete registration data but where registration and/or other types of data are available
Afghanistan Fiji Namibia
Albania Gabon Nepal
Algeria Georgia Nicaragua
Armenia Ghana Niger
Azerbaijan Guinea Nigeria
Bahrain Guyana Pakistan
Bangladesh Haiti Paraguay
Benin Honduras Peru
Bhutan India Philippines
Bolivia (Plurinational State of) Indonesia Puerto Rico
Bosnia and Herzegovina Iran (Islamic Republic of) Rwanda
Botswana Iraq Saudi Arabia
Brazil Jamaica Senegal
Brunei Darussalam Jordan Sierra Leone
Burkina Faso Kenya South Africa
Cambodia Kyrgyzstan Sri Lanka
Cameroon Lao People's Democratic Republic Sudan
Central African Republic Lebanon Swaziland
Chad Lesotho United Republic of Tanzania
China Liberia Thailand
Congo Madagascar Togo
Côte d'Ivoire Malawi Tunisia
Democratic Republic of the Congo Maldives Turkey
Dominican Republic Mali Uganda
Ecuador Mauritania Yemen
Egypt Montenegro Zambia
El Salvador Morocco Zimbabwe
Eritrea Mozambique
Ethiopia Myanmar
Appendix 4. Twenty-four countries with no nationally representative data on maternal mortality meeting inclusion criteria
Angola Gambia Solomon Islands
Burundi Guinea-Bissau Somalia
Cape Verde Libyan Arab Jamahiriya Syrian Arab Republic
Comoros Malaysia Tajikistan
Cyprus Mongolia Timor-Leste
Democratic People's Republic of Korea
Oman Turkmenistan
Djibouti Papua New Guinea United Arab Emirates
Equatorial Guinea Qatar Viet Nam

37
37
Trends in maternal mortality: 1990–2008
Appendix 5. Estimation of maternal deaths due to HIV
To construct the dependent variable of the multilevel regression model, a fraction of estimated HIV deaths
among pregnant women was subtracted from PMDF observations (already adjusted for completeness and
misclassification) to create PMDFna for maternal, non-HIV-related deaths as follows:
PMDFna = PMDFadj – 𝑎ũ𝑣
where
𝑎 is the proportion of HIV/AIDS deaths among all deaths to women aged 15–49. It is derived from
the number of deaths as estimated by WHO for its life tables and from the number of deaths due
to HIV/AIDS as estimated by UNAIDS.
ũ is the fraction of HIV/AIDS deaths in the pregnancy-related period that were presumably
included in a PMDF or MMR observation. It is assumed that ũ equals one for all observations
with a “pregnancy-related” definition (with or without accidents) and that ũ equals zero for all
vital registration (VR) data. For non-VR observations with a “maternal” definition, the value of ũ
is based on empirical evidence when possible and is assumed to be 0.5 otherwise (this choice
affects rather few data points in situations where HIV/AIDS deaths are frequent).
𝑣 is the proportion of HIV/AIDS deaths to women aged 15–49 that occur during pregnancy.
The value of 𝑣 can be computed as follows:
𝑣 = 𝑐 𝑘 GFR
1 + 𝑐 (𝑘 – 1) GFR
where
GFR is the general fertility rate
𝑐 is the average exposure time (in years) to the risk of pregnancy-related mortality per live birth
(set equal to 1 for this analysis);
𝑘 is the relative risk of dying from HIV/AIDS for a pregnant versus a non-pregnant woman
(reflecting both the decreased fertility of HIV-positive women and the increased mortality risk of
HIV positive pregnant women).
The value of 𝑘 proved difficult to estimate directly from available study data, and instead a statistical approach
was adopted that involved choosing a value of 𝑘 to maximize measures of goodness of fit for the regression
model. The resulting value of 𝑘 = 0.4 was used for all countries.
For pregnancy-related observations, the definitional adjustment described earlier (removing 10% or 15% of
such deaths) was applied after subtracting HIV-related deaths.

Trends in maternal mortality: 1990–2008
38 After estimating PMDFna using the multilevel regression model, final PMDF estimates were computed by
adding back a constant fraction, u, of the estimated number of pregnancy-related HIV/AIDS deaths, which are
counted here as “indirect maternal” deaths:
estimated PMDF = estimated PMDFna + 𝑎u𝑣
where
u is the fraction of pregnancy-related deaths among HIV-infected women assumed to be indirect
maternal deaths.
The MMEIG/TAG reviewed available study data on HIV/AIDS deaths among pregnant women and
recommended using u = 0.5. Given the scarcity of appropriate data for choosing the proper value of this
parameter (which could vary over time and space), the value of 0.5 was chosen in order to minimize the
expected error that is implied by any symmetrical probability distribution of uncertainty (over the interval
of zero to one). Overall, it was estimated that there were 42 000 deaths due to HIV/AIDS among pregnant
women. About half of those are estimated to be maternal.

39
39
Trends in maternal mortality: 1990–2008
Appendix 6. Estimates of maternal mortality ratio (MMR, deaths per 100 000 live births), number of maternal deaths and lifetime risk by WHO regions, 2008
RegionEstimated
MMRa
Range of uncertainty on MMR estimates Number of
maternal deathsa
Lifetime risk of maternal death:a
1 in:Lowerestimate
Upper estimate
Africa 620 450 890 190 000 32Americas 66 56 80 10 000 670South-East Asia 240 160 350 91 000 150Europe 21 19 25 2300 2900Eastern Mediterranean 320 220 520 52 000 84Western Pacific 51 35 74 13 000 1100WORLD 260 200 370 358 000 140
a The MMR and lifetime risk have been rounded according to the following scheme: <100, no rounding; 100–999, rounded to near-est 10; and >1000, rounded to nearest 100. The numbers of maternal deaths have been rounded as follows: <1000, rounded to nearest 10; 1000–9999, rounded to nearest 100; and >10 000, rounded to nearest 1000.
Appendix 7. Comparison of 1990, 1995, 2000, 2005, and 2008 estimates of maternal mortality ratio (MMR, deaths per 100 000 live births) by WHO regions
RegionEstimated MMRa
% change in MMR between 1990 and
2008
Annual % change in MMR
between 1990 and 2008b1990 1995 2000 2005 2008
Africa 850 830 780 690 620 –27 –1.7Americas 110 93 81 70 66 –39 –2.7South-East Asia 580 470 380 280 240 –59 –5.0Europe 44 37 29 22 21 –52 –4.1Eastern Mediterranean 430 410 390 350 320 –24 –1.5Western Pacific 130 97 75 58 51 –59 –5.0WORLD 400 370 340 290 260 –34 –2.3
a The MMR have been rounded according to the following scheme: <100, no rounding; 100–999, rounded to nearest 10; and >1000, rounded to nearest 100.
b Negative values indicate a decreasing MMR from 1990 to 2008, while positive values indicate an increasing MMR. Given that the uncertainty values are wide for some countries, these will have to be interpreted with caution.

Trends in maternal mortality: 1990–2008
40 Appendix 8. Estimates of maternal mortality ratio (MMR, deaths per 100 000 live births), number of maternal deaths and lifetime risk by UNICEF regions, 2008
RegionEstimated
MMRa
Range of uncertainty on MMR estimates
Number of maternal deathsa
Lifetime risk of maternal death:a 1 in:Lower estimate Upper estimate
Africa 590 430 840 207 000 36Sub-Saharan Africa 640 470 920 204 000 31
Eastern and Southern Africa 550 400 770 79 000 38Western and Central Africa 720 490 1100 115 000 26
Middle East and North Africa 170 120 270 17 000 190Asia 200 140 290 135 000 210
South Asia 290 190 430 109 000 110East Asia and Pacific 88 61 130 27 000 600
Latin America and Caribbean 85 72 110 9200 480Central and Eastern Europe and the Commonwealth of Independent States
34 29 41 1900 1700
Industrialized countries 14 12 16 1600 4300Developing countries 290 220 410 356 000 120Least developed countries 590 420 840 166 000 37WORLD 260 200 370 358 000 140
a The MMR and lifetime risk have been rounded according to the following scheme: <100, no rounding; 100–999, rounded to near-est 10; and >1000, rounded to nearest 100. The numbers of maternal deaths have been rounded as follows: <1000, rounded to nearest 10; 1000–9999, rounded to nearest 100; and >10 000, rounded to nearest 1000.
Appendix 9. Comparison of 1990, 1995, 2000, 2005, and 2008 estimates of maternal mortality ratio (MMR, deaths per 100 000 live births) by UNICEF regions
Region
Estimated MMRa%
change in MMR between 1990 and
2008
Annual % change in MMR between 1990 and
2008b1990 1995 2000 2005 2008
Africa 780 770 720 650 590 –25 –1.6Sub-Saharan Africa 870 850 790 710 640 –26 –1.7
Eastern and Southern Africa 750 760 720 630 550 –26 –1.7Western and Central Africa 980 940 870 780 720 –27 –1.7
Middle East and North Africa 270 230 200 180 170 –37 –2.6Asia 410 340 300 230 200 –51 –4.0
South Asia 610 510 430 330 290 –53 –4.2East Asia and Pacific 200 160 130 100 88 –56 –4.5
Latin America and Caribbean 140 130 110 91 85 –41 –2.9Central and Eastern Europe and the Commonwealth of Independent States 69 60 48 36 34 –52 –4.0
Industrialized countries 12 10 11 14 14 16 0.8Developing countries 440 410 370 320 290 –34 –2.3Least developed countries 900 840 750 650 590 –35 –2.4WORLD 400 370 340 290 260 –34 –2.3
a The MMR have been rounded according to the following scheme: <100, no rounding; 100–999, rounded to nearest 10; and >1000, rounded to nearest 100.
b Negative values indicate a decreasing MMR from 1990 to 2008, while positive values indicate an increasing MMR. Given that the uncertainty values are wide for some countries, these will have to be interpreted with caution.

41
41
Trends in maternal mortality: 1990–2008
Appendix 11. Comparison of 1990, 1995, 2000, 2005, and 2008 estimates of maternal mortality ratio (MMR, deaths per 100 000 live births) by UNFPA regions
RegionEstimated MMRa
% change in MMR between 1990 and
2008
Annual % change in MMR between 1990 and
2008b1990 1995 2000 2005 2008
Asia and the Pacific 400 340 290 230 200 –51 –4.0Eastern Europe and Central Asia 66 57 45 34 32 –52 –4.0Latin America and the Caribbean 140 130 110 91 85 –41 –2.9Middle East and North Africa 340 310 280 260 250 –27 –1.8Sub-Saharan Africa 870 850 790 700 630 –27 –1.8Non-UNFPA list (40 countries) 13 11 12 15 15 16 0.8WORLD 400 370 340 290 260 –34 –2.3
a The MMR have been rounded according to the following scheme: <100, no rounding; 100–999, rounded to nearest 10; and >1000, rounded to nearest 100.
b Negative values indicate a decreasing MMR from 1990 to 2008, while positive values indicate an increasing MMR. Given that the uncertainty values are wide for some countries, these will have to be interpreted with caution.
Appendix 10. Estimates of maternal mortality ratio (MMR, deaths per 100 000 live births), number of maternal deaths and lifetime risk by UNFPA regions, 2008
Region Estimated MMRa
Range of uncertainty on MMR estimates Number of
maternal deathsa
Lifetime risk of maternal death:a 1 in:Lower
estimateUpper
estimateAsia and the Pacific 200 140 290 136 000 210Eastern Europe and Central Asia 32 27 39 1900 1800Latin America and the Caribbean 85 72 110 9200 480Middle East and North Africa 250 170 390 21 000 120Sub-Saharan Africa 630 460 910 189 000 31Non-UNFPA list (40 countries) 15 13 17 1700 4000WORLD 260 200 370 358 000 140
a The MMR and lifetime risk have been rounded according to the following scheme: <100, no rounding; 100–999, rounded to near-est 10; and >1000, rounded to nearest 100. The numbers of maternal deaths have been rounded as follows: <1000, rounded to nearest 10; 1000–9999, rounded to nearest 100; and >10 000, rounded to nearest 1000.

Trends in maternal mortality: 1990–2008
42 Appendix 12. Estimates of maternal mortality ratio (MMR, deaths per 100 000 live births), number of maternal deaths and lifetime risk by The World Bank regions and income groups, 2008
Region and income groupa Estimated MMRb
Range of uncertainty on MMR estimates Number of
maternal deathsb
Lifetime risk of maternal death:b 1 in:Lower
estimateUpper
estimateLow income 580 420 830 162 000 39Middle income 200 150 290 195 000 190
Lower middle income 230 160 330 181 000 160Upper middle income 82 64 100 14 000 570
Low and middle income 290 210 400 357 000 120East Asia and Pacific 89 62 130 26 000 580Europe and Central Asia 32 27 39 1900 1800Latin America and the Caribbean 86 72 110 9200 480Middle East and North Africa 88 62 130 6700 380South Asia 290 190 430 109 000 110Sub-Saharan Africa 650 470 920 203 000 31
High income 15 14 17 1900 3900WORLD 260 200 370 358 000 140
a Income groups were based on 2009 gross national income per capita estimates: low income, US$ 995 or less; lower middle income US$ 996–3945; upper middle income US$ 3946–12 195; and high income, US$ 12 196 or more.
b The MMR and lifetime risk have been rounded according to the following scheme: <100, no rounding; 100–999, rounded to near-est 10; and >1000, rounded to nearest 100. The numbers of maternal deaths have been rounded as follows: <1000, rounded to nearest 10; 1000–9999, rounded to nearest 100; and >10 000, rounded to nearest 1000.
Appendix 13. Comparison of 1990, 1995, 2000, 2005, and 2008 estimates of maternal mortality ratio (MMR, deaths per 100 000 live births) by The World Bank regions and income groups
Region and income groupaEstimated MMRb
% change in MMR between 1990 and
2008
Annual % change in MMR
between 1990 and 2008c1990 1995 2000 2005 2008
Low income 850 800 740 640 580 –32 –2.1Middle income 350 310 280 230 200 –41 –3.0
Lower middle income 400 360 320 260 230 –43 –3.1Upper middle income 120 100 97 88 82 –31 –2.0
Low and middle income 440 410 370 320 290 –34 –2.3East Asia and Pacific 200 160 130 100 89 –56 –4.6Europe and Central Asia 66 57 45 34 32 –52 –4.0Latin America and the Caribbean 140 130 110 91 86 –41 –2.9Middle East and North Africa 210 160 120 98 88 –59 –4.9South Asia 610 510 430 330 290 –53 –4.2Sub-Saharan Africa 870 850 800 710 650 –26 –1.7
High income 15 14 13 15 15 –1 –0.1WORLD 400 370 340 290 260 –34 –2.3
a Income groups were based on 2009 gross national income per capita estimates: low income, US$ 995 or less; lower–middle income US$ 996–3945; upper–middle income US$ 3946–12 195; and high income, US$ 12 196 or more.
b The MMR have been rounded according to the following scheme: <100, no rounding; 100–999, rounded to nearest 10; and >1000, rounded to nearest 100.
c Negative values indicate a decreasing MMR from 1990 to 2008, while positive values indicate an increasing MMR. Given that the uncertainty values are wide for some countries, these will have to be interpreted with caution.

43
43
Trends in maternal mortality: 1990–2008
Appendix 14. Estimates of maternal mortality ratio (MMR, deaths per 100 000 live births), number of maternal deaths and lifetime risk by United Nations Population Division regions, 2008
RegionEstimated
MMRa
Range of uncertainty on MMR estimates Number of
maternal deathsa
Lifetime risk of maternal death:a 1 in:Lower
estimateUpper
estimateAfrica 590 430 840 207 000 36
Sub-Saharan Africa region 640 470 920 204 000 31Asia 180 130 270 139 000 230Europe 16 14 18 1200 4200Latin America and the Caribbean 85 71 110 9200 490Northern America 23 20 26 1100 2200Oceania 100 48 210 570 410More developed regions 17 16 19 2400 3600Less developed regions 290 220 410 356 000 120
Least developed countries 590 420 840 166 000 37Other less developed regions 200 150 290 190 000 190
WORLD 260 200 370 358 000 140a The MMR and lifetime risk have been rounded according to the following scheme: <100, no rounding; 100–999, rounded to near-
est 10; and >1000, rounded to nearest 100. The numbers of maternal deaths have been rounded as follows: <1000, rounded to nearest 10; 1000–9999, rounded to nearest 100; and >10 000, rounded to nearest 1000.
Appendix 15. Comparison of 1990, 1995, 2000, 2005, and 2008 estimates of maternal mortality ratio (MMR, deaths per 100 000 live births) by United Nations Population Division regions
Region
Estimated MMRa % change in MMR between 1990 and
2008
Annual % change in MMR between 1990 and
2008b
1990 1995 2000 2005 2008
Africa 780 770 720 650 590 –25 –1.6Sub-Saharan Africa region 870 850 790 710 640 –26 –1.7
Asia 370 320 270 210 180 –51 –4.0Europe 35 27 21 16 16 –55 –4.4Latin America and the Caribbean 140 130 110 90 85 –41 –2.9Northern America 12 11 13 23 23 97 3.8Oceania 120 110 120 110 100 –12 –0.7More developed regions 26 20 17 17 17 –33 –2.2Less developed regions 440 410 370 320 290 –34 –2.3
Least developed countries 900 840 750 650 590 –35 –2.4Other less developed regions 340 300 270 230 200 –41 –2.9
WORLD 400 370 340 290 260 –34 –2.3a The MMR have been rounded according to the following scheme: <100, no rounding; 100–999, rounded to nearest 10; and
>1000, rounded to nearest 100.
b Negative values indicate a decreasing MMR from 1990 to 2008, while positive values indicate an increasing MMR. Given that the uncertainty values are wide for some countries, these will have to be interpreted with caution.

Trends in maternal mortality: 1990–2008
44
REFERENCES
1. Hill K, et al. Estimates of maternal mortal-ity worldwide between 1990 and 2005: an assessment of available data. Lancet, 2007, 370(9595):1311-1319.
2. WHO/UNICEF/UNFPA/World Bank. Maternal mortality in 2005. Estimates developed by WHO, UNICEF, UNFPA and The World Bank. Geneva, World Health Organization, 2007.
3. Hogan MC, et al. Maternal mortality for 181 countries, 1980–2008: a systematic analysis of progress towards Millennium Development Goal 5. Lancet, 2010, 375(9726):1609-1623.
4. International Statistical Classification of Diseases and Related Health Problems. Tenth Revision. Vol. 1: Tabular list. Vol. 2: Instruction manual. Geneva, World Health Organization, 1992.
5. Horon IL. Underreporting of maternal deaths on death certificates and the magnitude of the problem of maternal mortality. American Journal of Public Health, 2005, 95:478-482.
6. Kao S, Chen LM, Shi L, Weinrich MC. Underreporting and misclassification of mater-nal mortality in Taiwan. Acta Obstetetricia et Gynecologica Scandinavica,1997, 76:629-636.
7. Deneux-Tharaux C, et al. Underreporting of pregnancy-related mortality in the United States and Europe. Obstetrics and Gynecology, 2005, 106:684-692.
8. Karimian-Teherani D, et al. Under-reporting of direct and indirect obstetrical deaths in Austria, 1980-98. Acta Obstetetricia et Gynecologica Scandinavica, 2002, 81:323-327.
9. Chang J, et al. Pregnancy-related mortality sur-veillance – United States, 1991-1999. MMWR Surveillance Summaries, 2003, 52:1-8.
10. Lewis G, ed. The Confidential Enquiry into Maternal and Child Health (CEMACH). Saving mothers' lives: reviewing maternal deaths to make motherhood safer – 2003–2005. The seventh report on confidential enquiries into maternal deaths in the United Kingdom. London, CEMACH, 2007.
11. Lewis G ed. Why mothers die 2000–2002: the confidential enquiries into maternal deaths in the United Kingdom. London, RCOG Press, 2004.
12. Hill K, et al. How should we measure maternal mortality in the developing world? A com-parison of household deaths and sibling his-tory approaches. Bulletin of the World Health Organization, 2006, 84:173-180.
13. Stanton C, Abderrahim N, Hill K. DHS maternal mortality indicators: an assessment of data qual-ity and implications for data use. Calverton, MD, USA, Macro International ,1997 (DHS Analytical Report No. 4).
14. Atrash HK, Alexander S, Berg CJ. Maternal mor-tality in developed countries: not just a concern of the past. Obstetrics and Gynecology, 1995, 86:700-705.
15. Abou Zahr C, Wardlaw T. Maternal mortality in 2000: estimates developed by WHO, UNICEF and UNFPA. Geneva, World Health Organization, 2004.
16. Chandramohan D, Rodigues LC, Maude GH, Hayes RJ. The validity of verbal autopsies for assessing the causes of institutional maternal death. Studies in Family Planning, 1998, 29:414-422.
17. Chandramohan D, Stetal P, Quigley M. Misclassification error in verbal autopsy: can it be adjusted? International Journal of Epidemiology, 2001, 30:509-514.
18. Stanton C, et al. Every death counts: measure-ment of maternal mortality via a census. Bulletin of the World Health Organization, 2001, 79:657-664.
19. World Health Organization. Life tables for WHO Member States (www.who.int/health info/sta-tistics/mortality_life_tables, accessed 10 July 2010).
20. UNPD World population prospects, 2008 revi-sion. New York, United Nations Population Division, 2009.
21. UNICEF global databases 2010 (http://www.childinfo.org/delivery_care_countrydata.php, accessed 5 March 2010).
22. The World Bank World Development Indicators Database, 2010. Washington, DC, The World Bank, 2010 (http://data.worldbank.org/data-catalog, accessed 1 March 2010).

45
45
Trends in maternal mortality: 1990–2008
23. Global economic prospects. Crisis, finance, and growth 2010. Washington, DC, The World Bank, 2010.
24. Heston A, Summers R, Aten B. Penn World Table Version 6.3, Center for International Comparisons of Production, Income and Prices at the University of Pennsylvania, 2009.
25. Stanton C, Abderrahim N, Hill K. An assessment of DHS maternal mortality indicators. Studies in Family Planning, 2000, 31:111-123.
26. World Health Organization. Global burden of dis-ease (http://www.who.int/healthinfo/global_ burden_disease/en/index.html, accessed 1 July 2010).
27. Gelman A, Hill J. Data analysis using regression and multilevel/hierarchical models. Cambridge University Press, Cambridge, 2006.
28. Bates D, Martin Maechler M. lme4: linear mixed-effects models using S4 classes. R package ver-sion 0.999375-32/r527, 2009.
29. R Development Core Team. R: a language and environment for statistical computing. Vienna, Austria, R Foundation for Statistical Computing, 2009.
30. Gray R, et al. Population-Based study of fertil-ity in women with HIV-1 infection in Uganda. Lancet, 1998, 351:98–103.
31 Lee L, et al. Duration of Human immunodefi-ciency virus infection and likelihood of giving birth in a Medicaid population in Maryland. American Journal of Epidemiology, 2000, 151:1020–1028.
32. Terceira N, Gregson S, Zaba B, Mason P. The contribution of HIV to fertility decline in rural Zimbabwe, 1985–2000. Population Studies, 2003, 57:149–164.
33. Wilmoth J. The lifetime risk of maternal mortality: concept and measurement. Bulletin of the World Health Organization, 2009, 87:256-262.
34. The Millennium Development Goals Report 2010. New York, United Nations, 2010.
35. United Nations Secretary-General Ban Ki-moon. Global strategy for women’s and children’s health, 2010, in press.


ISBN 978 92 4 150026 5
Trends in Maternal Mortality:
1990 to 2008Estimates developed by
WHO, UNICEF, UNFPA and The World Bank
For more information, please contact:
Department of Reproductive Health and ResearchWorld Health OrganizationAvenue Appia 20, CH-1211 Geneva 27SwitzerlandFax: +41 22 791 4171E-mail: [email protected]/reproductivehealth
cover-A3-EN pantone 301.indd 1 10/09/2010 09:09:36