Materiel Test Procedure 6-2-514 COMMON ENGINEERING TEST PROCEDURE ELECTRICAL · PDF...
14
Materiel Test Procedure 6-2-514 6 June 1968 Electronic Proving Ground U. S. ARMY TEST AND EVALUATION COMMAND COMMON ENGINEERING TEST PROCEDURE ELECTRICAL POWER REQUIREMENTS 1. OBJECTIVE The objective of this Materiel Test Procedure is to determine the electrical power requirements of communications, surveillance and electronic materiel. 2. BACKGROUND Although the various items in the above category are supplied with instruction manuals and specification plates which purport to detail their respective power requirements, under certain conditions, these power require- ments may vary to the extent that the item's capability to function efficiently is severelyrestricted. Engineering tests such as those contained herein, when performed under such conditions, allow the user to investigate the degree of disparity between stated power requirements and power requirements measured empirically. In addition, such tests allow the user to determine the impact of power requirement variations on the performance of the test item. This data, when analyzed properly, provides an important indication of the test item's overall effectiveness as a single unit or as an integral part of a system, functioning under actual field conditions. 3. REQUIRED EQUIPMENT a. Voltmeters b. Ammeters c. Wattmeters d. Frequency meters e. Oscilloscope with camera f. Strip chart recorder 4. REFERENCES A. Wind, Moe, Handbook of Electronic Measurements, Vol. 1, Polytechnic Institute of Brooklyn, 1956. B. Kinnard, Issac F., Applied Electrical Measurements, John Wiley & Sons, Inc., New York, 1956. C. Golding, E.W., Electrical Measurements and Measuring Instruments, 4th Edition, Sir Isaac Pitman & Sons, Ltd., London, England._ D. Knowlton, A.E., Standard Handbook for Electrical Engineers, Ninth Edition, McGraw-Hill Book Company, New York, New York, 1957. E. TM-II-664, Theory and Use of Electronic Test Equipment. F. TM 11-663, Electronic Power Supplies. G. MTP 6-1-003, Determination of Sample Size l &- 1- .Zdd5 c'aO546
Transcript of Materiel Test Procedure 6-2-514 COMMON ENGINEERING TEST PROCEDURE ELECTRICAL · PDF...

Materiel Test Procedure 6-2-5146 June 1968 Electronic Proving Ground
U. S. ARMY TEST AND EVALUATION COMMANDCOMMON ENGINEERING TEST PROCEDURE
ELECTRICAL POWER REQUIREMENTS
1. OBJECTIVE
The objective of this Materiel Test Procedure is to determine theelectrical power requirements of communications, surveillance and electronicmateriel.
2. BACKGROUND
Although the various items in the above category are supplied withinstruction manuals and specification plates which purport to detail theirrespective power requirements, under certain conditions, these power require-ments may vary to the extent that the item's capability to function efficientlyis severelyrestricted. Engineering tests such as those contained herein,when performed under such conditions, allow the user to investigate the degreeof disparity between stated power requirements and power requirements measuredempirically. In addition, such tests allow the user to determine the impactof power requirement variations on the performance of the test item. Thisdata, when analyzed properly, provides an important indication of the testitem's overall effectiveness as a single unit or as an integral part of asystem, functioning under actual field conditions.
3. REQUIRED EQUIPMENT
a. Voltmetersb. Ammetersc. Wattmetersd. Frequency meterse. Oscilloscope with cameraf. Strip chart recorder
4. REFERENCES
A. Wind, Moe, Handbook of Electronic Measurements, Vol. 1, PolytechnicInstitute of Brooklyn, 1956.
B. Kinnard, Issac F., Applied Electrical Measurements, John Wiley &Sons, Inc., New York, 1956.
C. Golding, E.W., Electrical Measurements and Measuring Instruments,4th Edition, Sir Isaac Pitman & Sons, Ltd., London, England._
D. Knowlton, A.E., Standard Handbook for Electrical Engineers, NinthEdition, McGraw-Hill Book Company, New York, New York, 1957.
E. TM-II-664, Theory and Use of Electronic Test Equipment.F. TM 11-663, Electronic Power Supplies.G. MTP 6-1-003, Determination of Sample Size
l &- 1-
.Zdd5 c'aO546

MTP 6-2-5145 June 1968
5. SCOPE
5.1 SUMMARY
This Materiel Test Procedure describes the following engineering sub-tests required to determine the electrical power requirements of given electronicmateriel:
a. Warm-up Requirements Subtest - The objective of this subtest isto determine the test item's electrical power requirements during its warm-upperiod.
b. Range of Power Requirements Subtest - The objective of this sub-test is to determine the test item's power requirements as the test item isbrought from standby or minimum load operation to peak loading conditions."0 c. Frequency Variation Subtest - The objective of this subtest is to
measure the test item's performance in the presence of frequency variations inthe primary power supply.
d. Voltage Variation Subtest - The objective of this subtest is tomeasure the effects of variations in the power supply voltage level upon thetest items performance. Performance of test item low and high voltage protectiondevices will also be investigated as a part of this test.
5.2 LIMITATIONS
a. Testing of power sources and power transmission lines are consideredonly-with respect to their error contributions to the overall measurement. Ingeneral, power requirements of the test item will be measured only at thepoint where the power transmission cable is mated to the test item.
b. Apparent or available power is not a primary considerationalthough it may be derived in some cases from test data.
c. Reactive power (power available but not by the test item)is not a primary consideration.
6. PROCEDURES
6.1 PREPARATION FOR TEST
6.1.1 Pretesting Procedures
a. Prior to testing it will be necessary to establish a "plane ofreference" such that the portion of the system under test on the power sourceside of the plane is designated "power source and transmission lines" and theportion of the power sink side of the plane is approximately designated as thetest item. The plane of reference shall be located at a conveniently accessiblepoint in close proximity to the point at which the power transmission line ismated to the test item. All measurement instrumentation unless otherwise indicatedin the individual test procedures shall be connected to the power sink side ofthe plane of reference.
40

MTP 6-2-5146 June 1968
b. All laboratory power supplies employed in the test'proceduresshall be examined prior to testing and their electrical characteristics deter-mined and cataloged. Specifically, DC power supplied shall be tested for ripplecontent and AC power supplies checked for harmonic distortion.
c. In order to monitor the test item's performance in the presenceof input power and/or frequency variations a convenient operating parameterof the test item shall be selected to serve as a standard reference indicator.Examples of standard reference indicators would be receiver sensitivity,transmitter output, gain, frequency response, dynamic response, etc. When thestandard reference indicator has been selected, the test item shall be operatedsuch that it draws rated power and the level of the indicator noted for futurereference.
d. Personnel responsible for conducting the test should ensure thatapplicable instructions and design specifications are available.
e. Operating instructions for test instruments, to be used in theconduct of the test, should be obtained and available to test personnel.
f. A test log book or folder should be prepared and utilized to recorddata during tests.
g. Ensure that all test instruments have been calibrated to withindesired tolerances and possess a current calibration tag.
h. Brief test personnel on the purpose of the test, responsibilitiesof each, functions to be performed during testing and the degree of accuracyexpected.
6.1.2 Preparation of Test Log
Data to be recorded in the test log prior to testing shall include butnot be limited to the following:
a. Name of the particular testb. Nomenclature and serial number of test itemc. Identification of plane of referenced. Standard reference indicator descriptione. Standard reference indicator levelf. Power supply electrical characteristicsg. Power supply nomenclature and serial number
6.2 TEST CONDUCT
NOTE: To produce data from which valid conclusions may be drawn, thetest procedures outlined herein shall be subjected to repetitionto simulate an equivalent number of units tested one time each.Size, shall be consulted prior to testing in order to ensurestatistical validity of the resultant.
6.2.1 Warm-up Power Requirements Subtest
a. Ensure that the test item is turned off and has been in the offposition for a period of time sufficient for it to reach the ambient temperature.
--3-

MTP 6-2-5146 June 1968
b. Connect the test item to a power source capable of supplying thenominal voltage (and frequency, where applicable) stated by the developer ofthe test item.
c. Connect the test instruments to the test item as indicated inFigures 1, 2, or 3 according to the type of power source required.
d. Turn on and operate the test item sach that it instantaneouslyrequires rated power from the power source and continuously record datafrom all instrumentation until data indicates that a steady state conditionhas been achieved or the test item indicates a. standard reference level,whichever requireg the longer time.
6.2.2 Range of Power Requirements Subtest
The range of the test item's power requirements is empiricallydetermined by the following test method:
a. Connect the test item to a power source capable of supplyingthe nominal voltage (and frequency, where applicable) as stated by thedeveloper of the test item.
b. Connect the test instrumentation to the test item as indicatedin Figures 1, 2, or 3 according to the power source type.,
c. After having allowed sufficient time for the test item to warm-up,.adjust the test items controls such that it consumes a minimum amount of
power from the power source and activate the recording instruments.d. Successively adjust the test item's controls to increase the 0
power supply loading until the test item is operating at peak load conditions.Note and record the test item's control positions in the margin of the chartrecording paper in order to be able to correlate power requirements withtest item usage.
6.2.3 Frequency Variation Subtest
The effect of frequency variations in the primary power supply onthe power consumed by and performance of the test item shall be investigatedin accordance with the following procedure.
a. Connect the test item to a variable frequrency power supply,adjust to deliver the nominal voltage and frequency stated by the developerof the test item.
b. Connect the test instrumentation as indicated by Figure 2 or3 (whichever is applicable).
c. While maintaining a constant input voltage level, vary thepower supply frequency in incremental steps from 45 to 65 Hz for 60 Hzpower requirements or 380 to 420 Hz for 400 Hz power requirements andrecord the corresponding standard reference indicator levels. Obtain asufficient number of points to be able to plot a smooth curve of input frequencyversus standard reference indicator level.
0-4-

MTP 6-2-5146 June 1968
DCPower Strip Char TestSource Recorder Item
WATTMETER METHOD
0
Power Strip Chart ItemSource evIe0, A
VOLTMETER - AMMETER METHOD
Figure 1. Block Diagram of Possible Equipment Setups for MonitoringDC Power Requirements.
0

MTP 6-2-5146 June 1968 PLAWB OF
REVE
sciftesop raqStrip Chart Ts
Its W aeaRcorder Item
Single-
a scilloscop r I TestAC w/Camera tr. . ItemPower j I
Strip ChartRecorder
THREE VOLTMETER METHOD
phase A A TestACsciiloscop• Iem
Powe~r" .wlCamera Mt.Ie
S•Strip Chart•S•~Recorder
THREE AMM4ETER METHOD
FIGURE 2. Block Diagram of Possible Equipment Setups for MonitoringSingle-phab# AC Power Requirements.
-6-

MTP 6-2-514PLAN OF EPE~NCE6 June 1968
PLN TH"~fRENE WTMTRM~O
Freq.sop Strip Chart.Wamtr. Recorder Ts
~o. -item
0
-1scilloscoptrpCht
M/ CameraWON WATMhETR METHOD,
FIUE3 1c igamo osbeEupet eusfrMntrn0 Thre Phas Power Requreets(St ip C .8es

MTP 6-2-5146 June 1968.0
6.2.4 Voltage Variations Subtest
The effects of variations in the power supply voltage level uponthe test item's performance will be determined by the following test procedure:
a. Connect the test item to a variable voltage power supply adjustedto deliver the nominal rated voltage (and frequency , where applicable) statedby the developer of the test item.
b. Connect a voltmeter across the power source side of the planeof reference and provide power monitoring instrumentation as shown in Figures 1,21 or 3 as applicable.
c. After having allowed sufficient warm-up time, decrease thepower supply voltage in small decrements and monitor the corresponding powerand standard reference indicator levels. Cease testing when the standardreference indicator level falls outside of stated tolerances or fails torespond.
d. Increase the power supply voltage from 0 volts and note thevoltage at which the test item's standard reference indicator initiallyresponds and finally achieves the standard reference level.
e. Increase the power supply voltage from nominal rated voltagein incremental steps and monitor the corresponding power 'nd standard
reference indicator levels. Cease testing when the standard reference indicatorlevel falls outside of stated tolerances or the test item's overvoltageprotection devices operate.
6.3 TEST DATA
6.3.1 Common Subtest Data
a. Record remarks and observations which would aid in subsequentanalysis of the test data.
b. Record the instrumentation or measurement system mean error orstated'accuracy.
c. Record the test item sample size (number of measurement repetitions).
6.3.2 Warm-up Time Subtest Data
a. Record the ambient temperature in degrees centigrade.b. Record the input power, as a function of time, in watts.c. Record the input voltage wave form.d. Record the power source frequency, as a function of time, in
hertz.
6.3.3 Range of Power Requirements Subtest Data
a. Record the input power, as a function of control position, in watts.b. Record the input frequency, as a function of control position, in
hertz. (where applicable).
0

MTP 6-2-514
6 June 1968S
c. Record the input waveform as a function of control position (whereapplicable.
6.3.4 Frequency Variations Subtest Data
a. Record the standard reference indicator level as a function of inputfrequency.
b. Record the input power, as a function of frequency, in watts.c. Record the input voltage waveform at each frequency.d. Record the ambient temperature in degrees centigrade.
6.3.5 Voltage Variations Subtest Data
a. Record the standard reference indicator level as a function ofvoltage.
b. Record the input power, as a function of input voltage, in watts.c. Record the ambient temperature in degrees centigrade.d. Record the input voltage waveform and frequency.
6.4 DATA REDUCTION AND PRESENTATION
6.4.1 Common Subtest Data Reduction
t a. Correct power measurements for power dissipated in the measurementsys tem.
b. Compute mean values and standard deviations of measurements subjectedto repetition.
c. Organize data for presentation in tabular or graphical form.d. Mark all test data for identification and correlate and group
according to subtest title.e. Prepare a written report to accompany the tabular test data and
emphasize test results, conclusions and recommendations drawn from analysis ofthe test findings.
6.4.2 Warm-up Power Requirements Subtest Data Reduction and Presentation
6.4.2.1 Data Reduction
.Reduce data in this subtest as indicated in 6.4.1 a through e.
6.4.2.2 Data Presentation
a. Present data in both tabular and graphic form with separate presenta-tions of the data listed in 6.3.2 b, c, & d made for each ambient temperatureat which measurements were taken.
b. Presentation of data in graphic form shall be accomplished asfollows:
9-9-

MrP 6-2-5146 June 1968
1) Plot input power in watts against time in seconds
2) Plot power source frequency in hertz against time in seconds
6.4.3 Range of Power Requirements Subtest Data Reduction and Presentation
Reduce data in this subtest as indicated in 6.4.1 a through e
6.4.3.2 Data Presentation
a. Present data in both tabular and graphic form with the test itemcontrol position plotted as the dependent variable.
b. Presentation of data in graphic form shall be accomplished asfollows:
1) Plot input power in watts against control position2) Plot input frequency in hertz against control position
c. Present the test item control position at which rated power wasachieved.
d. Present the difference between rated power and measured powerunder standard operating conditions and explain the discrepancy.
e. Present the ratio of maximum load demand to rated load demandas the test items demand factor.
6.4A4 Frequency Variations Subtest Data Reduction and Presentation 06.4.4.1 Data Reduction
Reduce data in this subtest as indicated in 6.4.1 a through e.
6.4.4.2 Data Presentation
a. Present data in both tabular and graphic form with separatepresentations of data listed in 6.3.4 a & b, made for each ambient temperatureat which measurements were taken.
b. Presentation of data in graphic form shall be accomplished asfollows:
1) Plot standard reference indicator level against input frequency2) Plot input power against input frequency
6.4.5 Voltage Variation Subtest Data Reduction and Presentation
6.4.5.1 Data Reduction
Reduce data in this subtest as indicated in 6.4.1 a through e.
1-10-

MTP 6-2-5146 June 1968
6.4.5.2 Data Presentation
a. Present data in both tabular and graphic form with separatepresentations of data listed in 6.3.5 a & b made for each ambient temperatureat which measurements were taken.
b. Presentation of data in graphic form shall be accomplished as follows:
1) Plot standard reference indicator level against input voltage2) Plot input power against input voltage
c. Present the point at which the standard reference level indicatorlevel fell outside the stated tolerance or failed to respond as the inputvoltage was decreased.
d. Present the point at which the standard reference indicatorinitially responded and finally achieved the standard reference level as theinput voltage was increased from zero volts.
e. Present the point at which the standard reference indicatorlevel fell outside the stated tolerance and the test item's overvoltageprotection devices activated as the input voltage was increased.
f. Present voltage waveforms correlated with appropriate tabularand graphical presentations of input power as a function of input voltage.
NOTE: It is an implied condition that all measured values presentedin either tabular or graphical-form in 6.4 shall be meanvalues corrected for power dissipated in the measurementsystem. Additionally, it is implied that the standarddeviation from the mean be indicated whenever mean values areshown.
S-11-
NTP 6-2-5146 June 1968
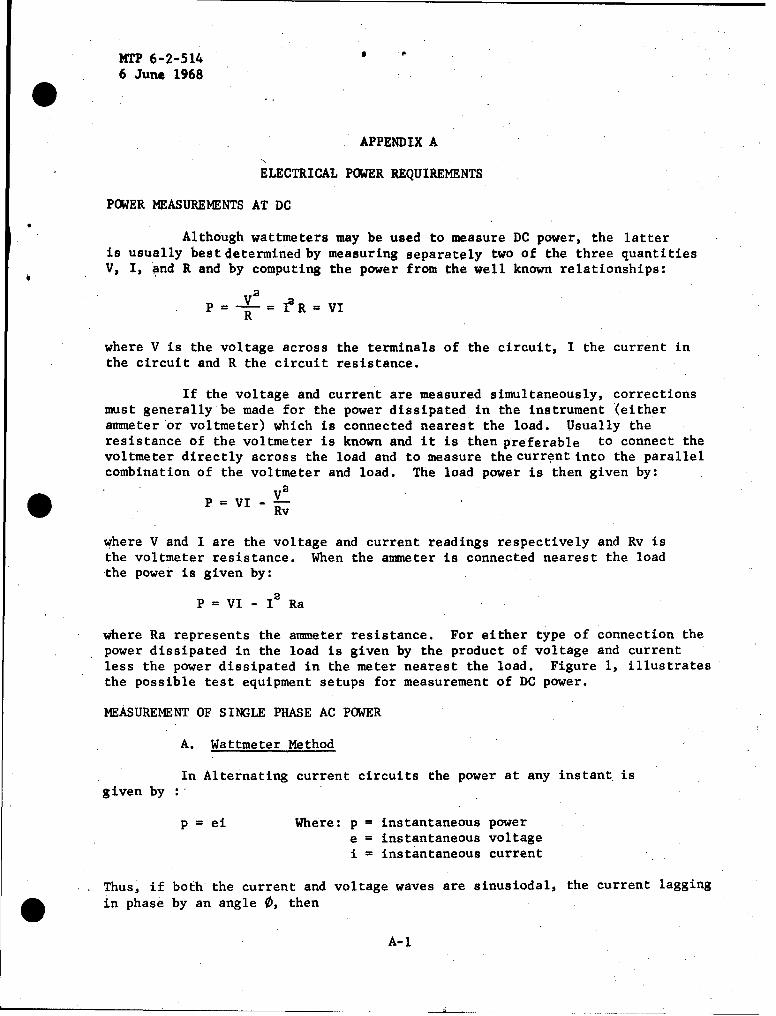
APPENDIX A
ELECTRICAL POWER REQUIREMENTS
POWER MEASUREMENTS AT DC
Although wattmeters may be used to measure DC power, the latteris usually best determined by measuring separately two of the three quantitiesV, I, and R and by computing the power from the well known relationships:
aP = -- = eR =VIR
where V is the voltage across the terminals of the circuit, I the current inthe circuit and R the circuit resistance.
If the voltage and current are measured simultaneously, correctionsmust generally be made for the power dissipated in the instrument (eitherammeter or voltmeter) which is connected nearest the load. Usually theresistance of the voltmeter is known and it is then preferable to connect thevoltmeter directly across the load and to measure the current into the parallelcombination of the voltmeter and load. The load power is then given by:
V2SP = VI -V
P=VI Rv
where V and I are the voltage and current readings respectively and Rv isthe voltmeter resistance. When the ammeter is connected nearest the loadthe power is given by:
P = VI - I1 Ra
where Ra represents the ammeter resistance. For either type of connection thepower dissipated in the load is given by the product of voltage and currentless the power dissipated in the meter nearest the load. Figure 1, illustratesthe possible test equipment setups for measurement of DC power.
MEASUREMENT OF SINGLE PHASE AC POWER
A. Wattmeter Method
In Alternating current circuits the power at any instant isgiven by
p = ei Where: p = instantaneous powere = instantaneous voltagei = instantaneous current
Thus, if both the current and voltage waves are sinusiodal, the current lagging* in phase by an angle 0, then
A-1

MTP 6-2-5146 June 1968
e - E max Sin wt
and i - I max Sin (wt 0)
The instantaneous power p is therefore given by:
p - E max I max Sin wt Sin (wt-0)
The mean power P may therefore be shown as:
P lf Tax I max Sin wt Sin (wt -')dt
22
Therefore P - El cos 0 where E and I are rms values of voltage and current.
The fact that the power factor (cos 0) is involved in the expressionfor the power means that a wattmeter must be used instead of merely anammeter and voltmeter, since the latter method takes no account of power factor.Of the three possible methods for measuring AC power shown in Figure 2, thewattmeter method is most expeditious.
B. Three - Voltmeter Method
It is possible to measure the power required by a single phaseAC load without a wattmeter by using three voltmeters in conjunction with anon-inductive resistance as shown in Figure 2. The simultaneous readings ofthe three voltmeters and resistance value of the non-inductive resistanceare inserted into the following formula to determine the power required bythe load:
2 2 2
Power in load- V3 " V " V32R
If desired, the power factor is also calculated by the formula:2 a 2
cos 0- -V2 -V 3
2V2 V3
Assumptions made in deriving the above relationships are that thecurrent in the resistance R is the same as the load current, and that theresistance is entirely non-inductive.
C. Three- Ammeter Method
The three ammeter method of measuring single phase AC power issomewhat similar to the above. The necessary test equipment connections areshown in Figure 2. The load power may be calculated from a knowledge of thecurrent measured by the ammeters and the resistance value of the non-inductiveresistor by use of the formula, w
A-2

MTP 6-2-5146 June 1968
Power in load -(I - 1 2_ I 52 R
2
Also Power factor 5 cos 0 =(I2- 1 2- 132 )R
21tI3
MEASUREMENT OF THREE PHASE POWER
A. Three Wattmeter Method
The test instrumentation connections for the three wattmetermethod of measuring three phase power are shown in Figure 3. The sum of thesimultaneous readings of the wattmeters will give the mean value of the totalpower required by the test item.
B. Two Wattmeter Method'
This is the commonest method of measuring three - phase power.It is particularly useful when the load is unbalanced. The test instrumentationconnections for the measurement are shown in Figure 3. If WI and W are thetwo wattmeter readings, W + W gives the total power required by tie test item,
*and 1 2
tan0 0 =•3 (W2 - WO)
W1 + WP
From which 0 and the power factor cos 0 of the load may be found.
C. One Wattmeter Method
This method can be used only when the load is balanced. Themeasurement setup is shown in Figure 3. As in the above method, the sumof the two wattmeter readings as obtained from switch positions A and B isthe total power delivered to the test item. In the same way the angle 0is given by:
tan 0 F3 (W2 - W,)
Mi + W2
and the power factor cos 0 is given by:
cos (tan 1 F3 -W
A-3