Glass: Future Applications & Market Demands - focus on raw materials
Gold Circuit ElectronicsMaterials Development Focus
November 19th, 2009
IBM Symposium

Effective characterization and introduction of new printed circuit board materials into mass production is a need.
◦
Signal integrity (5GHz performance -- with 10 GHz understanding)
◦
Excellent reliability for lead free assembly (245C to 260C exposure, for 5 to 6 exposures, including robustness for all assembly possibilities)
◦
Full range of technology and thickness understanding the Design limit for recommended materials is vital to success, strong part number/process interaction verification needed “real time
IBM methodology incorporated into Gold Circuit Electronics standard system, most specifically regarding HOP31b, CAF resistance and SPP (short pulse propagation) testing.

Methodology
I. High speed and Lead free requirements have resulted in a proliferation of products in the supply chain
II. Comprehensive and accurate assessment is vital to customer and market alignment
III. 3-phase methodology established
• Initial Evaluation: - Material type and feasibility assessment:
• Intrinsic property:
• Formulation: • Resin, Fillers, Curing Agent, Coupling Agent & Glass Cloth
• Electricity: • Dielectric constant, dissipation factor, dielectric electrical
strength.
• Thermal reliability: • Time to blister, decomposition, cohesion and adhesion
strength under thermal load or cycling, solder temperature impact index.
• Physical property: • Effect of moisture, material expansion, bond strength, nature
of filler, uniformity
Methodology
• Initial Evaluation: - Material type and feasibility assessment:
• Materials maturity: • Technical support, Productivity, Delivery, Cost
• UL status
• Intellectual property - legality review and status, as applicable
• Marketing• Application history and success. • Third party validation
Methodology
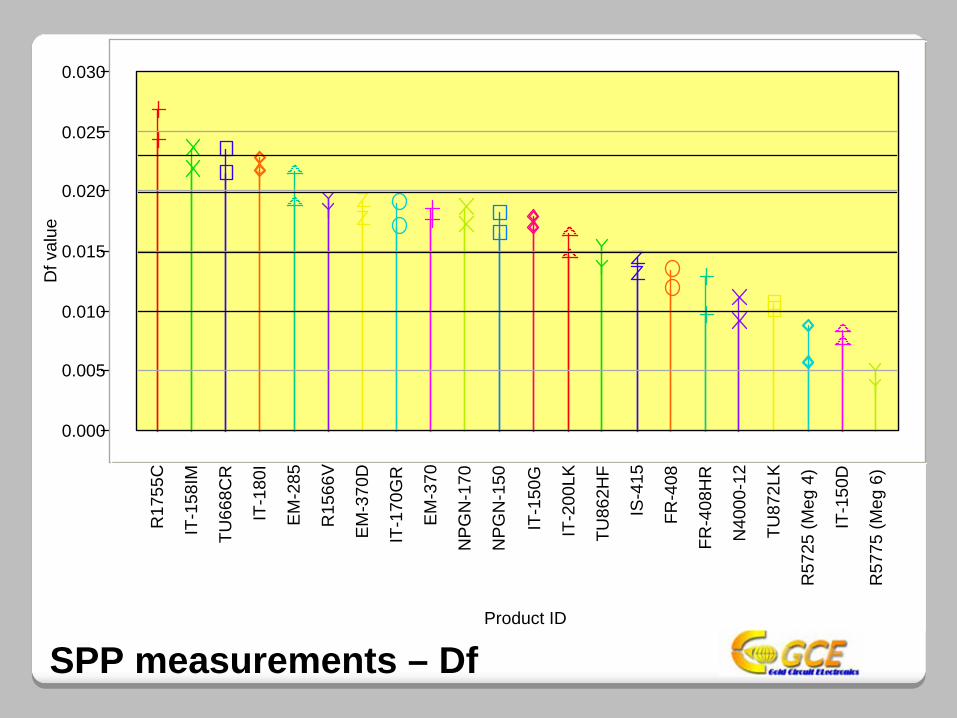
SPP measurements – Df
0.000
0.005
0.010
0.015
0.020
0.025
0.030D
f val
ue
R17
55C
IT-1
58IM
TU66
8CR
IT-1
80I
EM
-285
R15
66V
EM
-370
D
IT-1
70G
R
EM
-370
NP
GN
-170
NP
GN
-150
IT-1
50G
IT-2
00LK
TU86
2HF
IS-4
15
FR-4
08
FR-4
08H
R
N40
00-1
2
TU87
2LK
R57
25 (M
eg 4
)
IT-1
50D
R57
75 (M
eg 6
)
Product ID

SPP measurements – Dk
3.25
3.50
3.75
4.00
4.25
4.50
4.75
5.00
5.25
5.50D
k at
1 G
hz
R17
55C
IT-1
50G
IT-1
70G
R
EM
-370
IT-1
80I
R15
66V
NP
GN
-170
R57
25 (M
eg 4
)
NP
GN
-150
EM
-285
IT-1
58IM
TU86
2HF
TU66
8CR
EM
-370
D
R57
75 (M
eg 6
)
IT-2
00LK
IS-4
15
FR-4
08
FR-4
08H
R
TU87
2LK
IT-1
50D
N40
00-1
2
Product ID

• Process certification.
– Process test (all areas) – Primary focus
– Lamination – melt viscosity, flow, time, temperature and pressure optimization, compatibility with oxide, moisture and hold time control.
– Drill – tool wear, small and mid size hole, smear generation, peck drilling, material interaction
– Plasma/De-smear – chemical resistance, weight loss, part number design contribution
– Plating – copper thickness uniformity, copper bond strength
– Impedance. – dielectric thickness and property consistency and impact on uniformity of impedance, foil type and property )
Methodology

• Process certification. -GCE new materials process certification report
– Reliability test: – Interconnect Stress Test (500 and 1000 cycles to fail)
– Cathodic Anodic Filament resistance (300 and 600 hours)
– Accelerated Thermal Cycle,(600 and 900 hours)
– Reflow & Solder reflow report. (6x 260C)
– “Other” PFMEA (potential failure mode element analysis) result – Fracture toughness (pad crater/material cracking) – Change in mechanical nature after reflow
Methodology

• Mass Production Readiness.
– Mass-production: – Refinement of FMEA failure modes and effects
analysis
– Material availability and stock control and Supplier performance monitoring
– Reliability test ongoing: – IST – each new key technology part number
(impact of design and stack up)
– CAF – each new key technology part number (impact of design and stack up) ,
– ATC – quarterly check,
– Reflow & Solder reflow monitor – every lot check
Methodology

150
200
250
300
350
400
Ther
mal
val
ues
R57
75 (M
eg 6
)
TU86
2HF
EM
-370
D
FR-4
08H
R
R17
55C
IT-2
00LK
R57
25 (M
eg 4
)
IS-4
15
TU87
2LK
EM
-370
N40
00-1
2
IT-1
70G
R
FR-4
08
EM
-285
IT-1
80I
R15
66V
NP
GN
-170
IT-1
50G
IT-1
58IM
NP
GN
-150
TU66
8CR
IT-1
50D
Product ID
Thermal –Tg, Td, STII
STII = (Tg/2 + Td/2)- (CTE % x 10)(solder temp impact index) per W. Engelmeier publication

Evolving Sweet Spot
Product IDDf
LowDf
HighDk
HighDk
Low Tg Td T288STII
Index Filler HF CAF ATC IST*Delam
245Delam
260
R1755C 0.0244 0.0269 5.188 4.171 176 360 30 251 X NT NT 6x 6x
IT-158IM 0.0218 0.0235 4.598 4.259 150 330 >10 215 492 600 526 6x 3x
TU668CR 0.0216 0.0235 4.497 4.236 150 340 >10 211 X 504 IW 394 6x IW
IT-180I 0.0219 0.0229 4.832 4.596 175 340 2.8 230 X 576 600 635 6x 6x
EM-285 0.0191 0.0217 4.617 4.610 150 360 30 230 X X 564 NT 783 6x NT
R1566V 0.0185 0.0195 4.828 4.330 148 370 12 229 X X 444 600 491 5x NT
EM-370D 0.0178 0.0193 4.490 4.270 175 390 >60 259 X X NT NT 6x 6x
IT-170GR 0.0171 0.0191 4.863 4.247 175 350 >30 235 X X 564 NT 867 6x NT
EM-370 0.0177 0.0187 4.840 4.283 170 370 >60 247 X X NT NT 6x NT
NPGN-170 0.0172 0.0186 4.828 4.516 165 340 >20 229 X X 528 NT 493 6x 6x
NPGN-150 0.0165 0.0183 4.641 4.320 145 340 >20 213 X X 552 NT 539 6x 4x
IT-150G 0.0171 0.0180 4.907 4.724 150 350 >30 220 X X NT NT 5x NT
IT-200LK 0.0147 0.0165 4.259 3.523 200 350 >30 251 X 552 600 602 6x 6x
TU862HF 0.0137 0.0155 4.598 4.387 170 390 >60 259 X X 516 600 581 6x 6x
IS-415 0.0132 0.0145 4.148 3.728 200 370 25 250 X 540 600 482 6x 6x
FR-408 0.0119 0.0135 4.071 3.797 180 355 >20 233 552 600 558 6x 6x
FR-408HR 0.0097 0.0130 3.936 3.648 200 360 >20 256 X 588 600 617 6x 6x
N4000-12 0.0091 0.0111 3.637 3.571 190 370 >20 244 468 NT 509 6x NT
TU872LK 0.0102 0.0107 3.851 3.829 200 340 15 247 X 536 600 580 6x 6x
R5725 (Meg 4) 0.0058 0.0088 4.679 4.885 175 360 30 251 600 600 872 6x 6x
IT-150D 0.0074 0.0084 3.768 3.443 150 340 15 211 X NT NT 6x NT
R5775 (Meg 6) 0.0038 0.0051 4.301 3.899 185 410 >120 275 X 900 900 6x 6x
*5x 245C

N4000-12 IT150D
IS415
FR408IT200LK
Electrical Properties
Ther
mal
Per
form
ance
FR406
Standard loss Mid Loss Low Loss Ultra Low Loss
NP170IM
R1566W/VTUC862HF
IT180ITU668CR
FR408HRMeg-4
TU872LK
Meg-6
IT158
023 015020 010

PFMEA Testing
Cooperation with DfR Solutions. (design for reliability) HQ located in College Park Maryland with sites in China and Taiwan ◦
3 year relationship focuses on key material analysis, test and development concept
Previous work (symposium posters) ◦
CAF mechanisms and failure point analysis with increasingly narrow hole to hole spacing.
◦
Use of capacitance testing to predict moisture levels and subsequent de-lam resistance in phenolic systems
Current work (2009) ◦
Assessment of fracture toughness and hardness as a predictor of post reflow thermo-mechanical behavior in mid Tg phenolic and halogen free systems

Discussion
Hardness and fracture toughness are characteristics that can change after thermal exposure
Measurement of these features has been historically difficult
“Ceramic” indenter method to record hardness but also potential for propagation of laminate crack analysis leading to a fracture toughness measurement.
Next level of analysis to be completed this month

Key Point summary:IBM methodologies are proven and effectively screen materials for
electrical and thermal performance
Host of trade-offs desired require disciplined review of competing characteristics and test results.
-
CAF, ATC, IST - Df, Dk-
De-lam Resistance-
Hardness and Fracture Toughness
Pursuit of these additional methods like hardness and fracture toughness will be further useful for mass production readiness.